20chapter%204_tracked
DESCRIPTION
http://www.panhandlewater.org/2011_draft_plan/Main_Report/4_SB2%20Chapter%204_TRACKED.pdfTRANSCRIPT

Chapter 4
Identification, Evaluation, and Selection of Water Management
Strategies Based on Needs

Chapter 4 March September 1, 2010 Evaluation of Water Management Strategies
4-2
Identified Regional Shortages and Evaluation Procedures The Panhandle Water Planning Group (PWPG) would like to note the following points for the reader to consider when reviewing this report:
The impacts contained in this report represent a drought of record scenario. In order to produce the identified impacts assessed by the TWDB in Section 4.13, all identified water shortages per user group for the entire region would have to go un-met. While the report does consider meeting partial shortages per user group if the full need cannot be met, the impacts of the reduced shortages are not addressed.
The shortages presented are cumulative in nature throughout the 50-year planning
horizon. Without water management strategies, shortages are considered to be un-met in their entirety from the first point identified in the Regional Water Plan and continue to be entirely un-met through the year 2060.
The predominant groundwater supply in the PWPA, Ogallala aquifer, is a finite resource.
This limitation is addressed through allocation of supplies as adopted by the PWPG. At some point in the future (beyond this planning period) this water source will have limited water available to meet the projected demands in the region.
As noted in the body of the report, the impacts presented in the report do not indicate a
prediction or forecast of future water disasters.
The report assumes that management strategies to meet any identified shortages are employed or implemented by the respective water user. The PWPG does not take responsibility in planning or implementing the strategies.
In June 2005, CRMWA completed and submitted a Management Plan for the Arkansas
River Shiner. CRMWA and its partners in this endeavor consider a flexible, adaptive, and proactive management approach to be an appropriate and effective means of achieving continued conservation of the Arkansas River Shiner while contributing to national recovery efforts.
4.1 Regional Shortages The comparison of current water supplies to demands presented in Chapter 3 identified 27 different water user groups with shortages greater than or equal to 10 acre-feet per year. Water management strategies were not developed for water user groups with shortages of less than 10 acre-feet per year during the planning period. Most of the shortages are located in five counties: Dallam, Hartley, Hutchinson, Moore, and Sherman Counties. A list of these users and their respective shortages are presented in Table 4-1.

Chapter 4 March September 1, 2010 Evaluation of Water Management Strategies
4-3
Table 4-1: Identified Shortages in the PWPA
Shortages (Ac-ft/yr)
County Name Water User Group Basin 2010 2020 2030 2040 2050 2060
DALLAM IRRIGATION CANADIAN 132,889 140,984 148,630 149,134 133,737 117,396
GRAY LEFORS RED 0 0 0 29 35 36
HALL MEMPHIS RED 0 81 140 140 140 142
HANSFORD GRUVER CANADIAN 0 77 229 282 333 334
HANSFORD IRRIGATION CANADIAN 150 1,005 1,484 4,548 3,077 1,640
HANSFORD SPEARMAN CANADIAN 0 0 276 611 831 849
HARTLEY IRRIGATION CANADIAN 181,732 180,523 183,457 179,983 161,368 142,079
HUTCHINSON BORGER CANADIAN 0 0 0 0 0 196
HUTCHINSON IRRIGATION CANADIAN 15,008 12,175 11,652 10,612 7,534 5,455
HUTCHINSON MANUFACTURING CANADIAN 0 0 64 469 784 1,270
MOORE CACTUS CANADIAN 0 0 204 262 309 354
MOORE COUNTY-OTHER CANADIAN 0 0 264 505 652 741
MOORE DUMAS CANADIAN 0 387 1,163 1,672 2,219 2,478
MOORE IRRIGATION CANADIAN 52,317 48,090 52,425 54,994 50,321 45,420
MOORE MANUFACTURING CANADIAN 173 800 1,033 1,396 1,718 2,067
MOORE STEAM ELECTRIC POWER
CANADIAN 75 99 117 128 136 154
MOORE SUNRAY CANADIAN 0 0 0 27 108 127
POTTER AMARILLO CANADIAN 0 0 1,349 2,961 4,582 5,950
POTTER AMARILLO RED 0 0 961 2,110 3,266 4,241
POTTER COUNTY-OTHER CANADIAN 0 0 0 299 708 1,043
POTTER COUNTY-OTHER RED 0 103 329 586 866 1,096
POTTER MANUFACTURING CANADIAN 0 0 33 57 35 43
POTTER MANUFACTURING RED 0 0 187 923 1,675 2,486
RANDALL AMARILLO RED 0 0 1,787 3,971 6,217 8,146
RANDALL CANYON RED 0 422 1,245 1,903 2,452 2,859
RANDALL COUNTY-OTHER RED 0 5 597 1,273 2,009 2,619
SHERMAN IRRIGATION CANADIAN 72,532 69,367 79,690 82,955 77,118 69,190
Total 454,876 454,118 487,316 501,830 462,230 418,411
4.2 Evaluation Procedures The consideration and selection of water management strategies for water user groups with needs followed TWDB guidelines and were conducted in open meetings within the Panhandle Planning Area. The potentially feasible strategies identified in previous round of planning were considered as a starting point. Additionally, new strategies were developed to meet new
Chapter 4 March September 1, 2010 Evaluation of Water Management Strategies
4-4
shortages or based on input from the water user group. The PWPA consistently endorsed the highest level of conservation achievable for all water uses in the region. In addition, environmental impacts and the protection of the region’s resources were a priority in the selection process. In the development of the water management strategies, existing water rights, water contracts, and option agreements are recognized and fully protected. Water supply strategies were developed for water user groups with shortages. Most of these strategies were based on survey responses from the municipalities, as well as previous planning reports. General strategies were developed for mining, steam electric, and irrigation. In most cases, the potentially feasible strategy identified to meet water shortages was to develop existing groundwater rights or purchase and develop groundwater rights. Due to the large volume of water shortages for irrigation, management strategies that would reduce irrigation demands were examined. These included, but were not limited to, the evaluation of the North Plains Evapotranspiration Network (NPET) to schedule irrigation; improved irrigation equipment and scheduling; conservation tillage practices; use of drought tolerant crops, precipitation enhancement, and bioengineered crop types. Strategies for municipal users with shortages are described in Section 4.4. Strategies for industrial users with shortages, i.e. manufacturing and steam electric, are presented in Sections 4.5 and 4.6, respectively. Discussion of the irrigation shortages and strategies are presented in Sections 4.7 and 4.8. There are no currently indentified shortages for livestock or mining. Attachment 4-1, which immediately follows this chapter, includes a list of potentially feasible strategies, recommended strategies and alternate strategies. Attachment 4-2 includes summaries for each municipal water user group. In addition, aA summary sheet has been created for each county, which lists all users in that county and the proposed water management strategies for those with projected shortages. These summary sheets are included in Appendix B. Strategies for wholesale water providers are discussed in Section 4.9. In accordance with state guidance, the potentially feasible strategies were evaluated with respect to:
Quantity, reliability and cost; Environmental factors, including effects on environmental water shortages, wildlife
habitat and cultural resources; Impacts on water resources, such as playas and other water management strategies; Impacts on agriculture and natural resources; and Other relevant factors.
The other considerations listed in TAC 357.7(a), such as inter-basin transfers and third party impacts due to re-distribution of water rights, were not specifically reviewed because they were not applicable to strategies identified for the Panhandle Water Planning Area (PWPA) shortages. The definition of quantity is the amount of water the strategy would provide to the respective user group in acre-feet per year. This amount is considered with respect to the user’s short-term and long-term shortages. Reliability is an assessment of the availability of the specified water quantity to the user over time. If the quantity of water is available to the user all the time, then the strategy has a high reliability. If the quantity of water is contingent on other factors,

Chapter 4 March September 1, 2010 Evaluation of Water Management Strategies
4-5
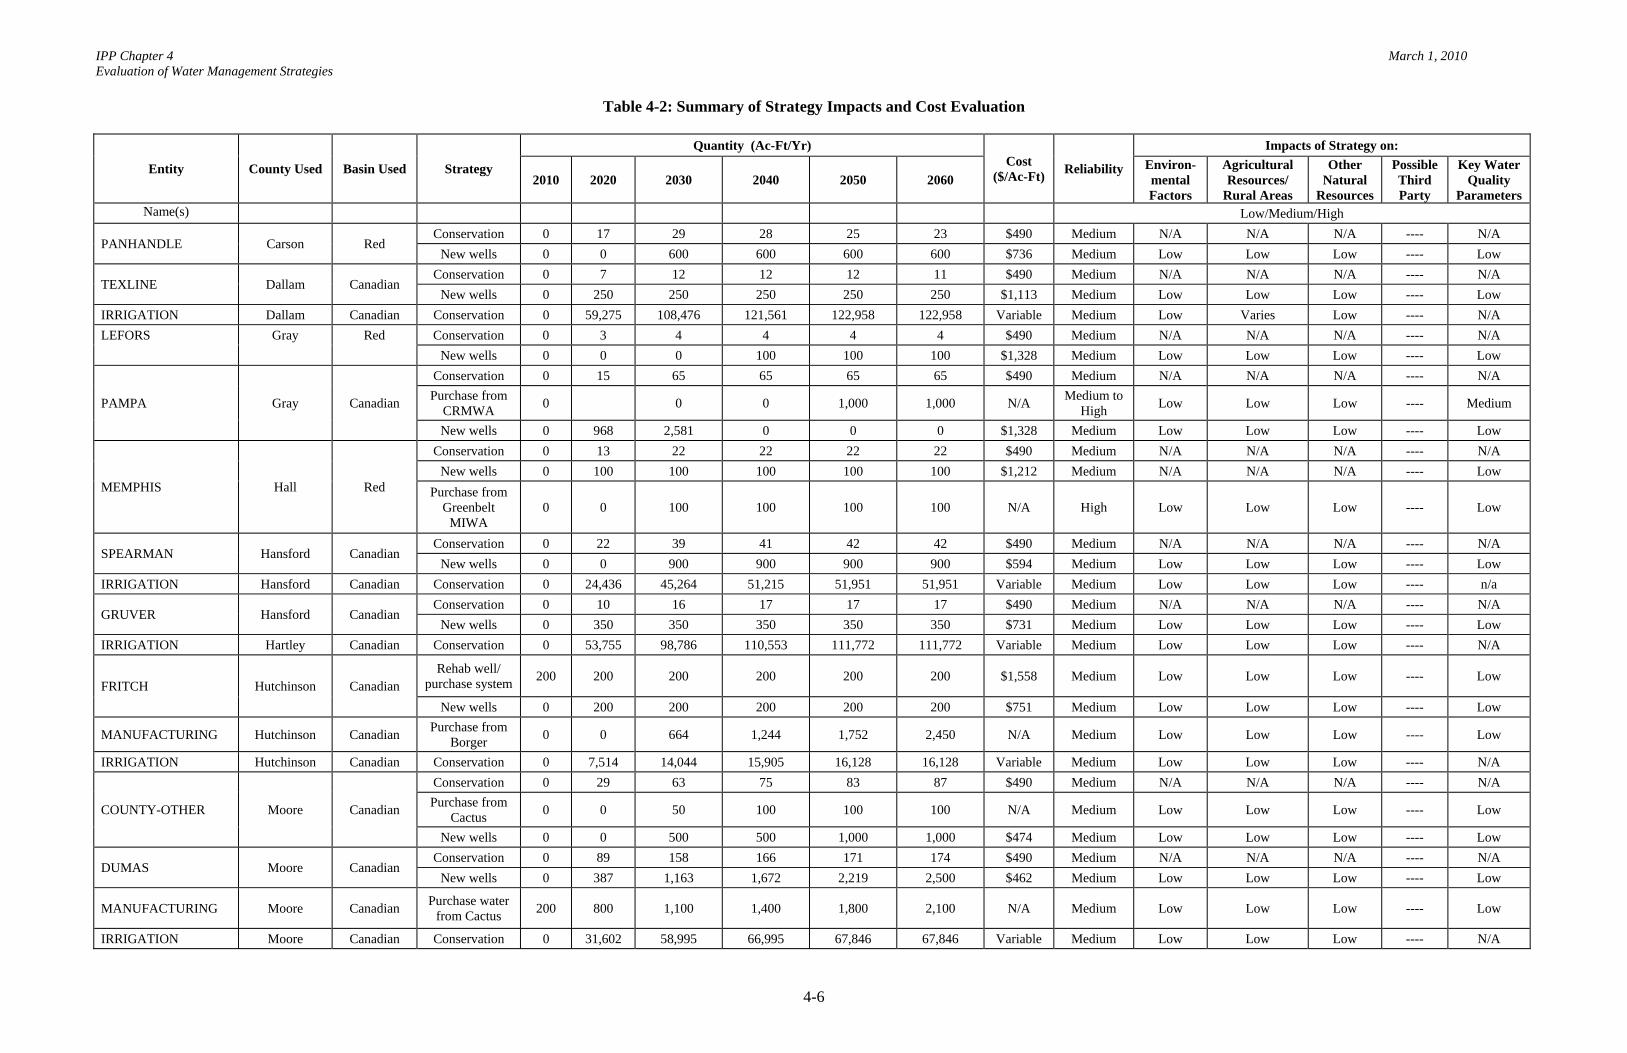
reliability will be lower. The assessment of cost for each strategy is expressed in dollars per acre-foot per year for water delivered and treated for the end user requirements. Calculations of these costs follow the Texas Water Development Board’s guidelines for cost considerations and identify capital and annual costs by decade. Project capital costs are based on September 2008 price levels and include construction costs, engineering, land acquisition, mitigation, right-of-way, contingencies and other project costs associated with the respective strategy. Annual costs include power costs associated with transmission, water treatment costs, water purchase (if applicable), operation and maintenance, and other project-specific costs. Debt service for capital improvements was calculated over 20 years at a 6 percent interest rate. In the case of municipal and county-other water shortages, the cost estimates are only for development of the supply and delivery to the user’s distribution system. There may be additional costs to actually deliver the water to the end users of the water that are not represented in these estimates. Potential impacts to sensitive environmental factors were considered for each strategy. Sensitive environmental factors may include wetlands, threatened and endangered species, unique wildlife habitats, and cultural resources. In most cases, a detailed evaluation could not be completed because a specific location for groundwater rights was not available. Therefore, a more detailed environmental assessment will be required before a strategy is implemented. The impact on water resources considers the effects of the strategy on water quantity, quality, and use of the water resource. A water management strategy may have a positive or negative effect on a water resource. This review also evaluated whether the strategy would impact the water quantity and quality of other water management strategies identified. A water management strategy could potentially impact agricultural production or local natural resources. Impacts to agriculture may include reduction in agricultural acreage, reduced water supply for irrigation, or impacts to water quality as it affects crop production. Various strategies may actually improve water quality, while others may have a negative impact. The impacts to natural resources may consider inundation of parklands, impacts to exploitable natural resources (such as mining), recreational use of a natural resource, and other strategy-specific factors. Other relevant factors include regulatory requirements, political and local issues, amount of time required to implement the strategy, recreational impacts of the strategy, and other socio-economic benefits or impacts. Municipal and manufacturing strategies were developed to provide water of sufficient quantity and quality that is acceptable for its end use. Water quality issues affect water use options and treatment requirements. For the evaluations of the strategies, it was assumed that the final water product would meet existing state water quality requirements for the specified use. For example, a strategy that provided water for municipal supply would meet existing drinking water standards, while water used for mining may have a lower quality. A summary of various factors evaluated to analyze and quantify the environmental and other impacts of each recommended strategy is shown in Table 4-2.
IPP Chapter 4 March 1, 2010 Evaluation of Water Management Strategies
4-6
Table 4-2: Summary of Strategy Impacts and Cost Evaluation
Entity County Used Basin Used Strategy
Quantity (Ac-Ft/Yr) Cost
($/Ac-Ft) Reliability
Impacts of Strategy on:
2010 2020 2030 2040 2050 2060 Environ-mental Factors
Agricultural Resources/
Rural Areas
Other Natural
Resources
Possible Third Party
Key Water Quality
Parameters Name(s) Low/Medium/High
PANHANDLE Carson Red Conservation 0 17 29 28 25 23 $490 Medium N/A N/A N/A ---- N/A
New wells 0 0 600 600 600 600 $736 Medium Low Low Low ---- Low
TEXLINE Dallam Canadian Conservation 0 7 12 12 12 11 $490 Medium N/A N/A N/A ---- N/A
New wells 0 250 250 250 250 250 $1,113 Medium Low Low Low ---- Low
IRRIGATION Dallam Canadian Conservation 0 59,275 108,476 121,561 122,958 122,958 Variable Medium Low Varies Low ---- N/A
LEFORS Gray Red Conservation 0 3 4 4 4 4 $490 Medium N/A N/A N/A ---- N/A
New wells 0 0 0 100 100 100 $1,328 Medium Low Low Low ---- Low
PAMPA Gray Canadian
Conservation 0 15 65 65 65 65 $490 Medium N/A N/A N/A ---- N/A
Purchase from CRMWA
0 0 0 1,000 1,000 N/A Medium to
High Low Low Low ---- Medium
New wells 0 968 2,581 0 0 0 $1,328 Medium Low Low Low ---- Low
MEMPHIS Hall Red
Conservation 0 13 22 22 22 22 $490 Medium N/A N/A N/A ---- N/A
New wells 0 100 100 100 100 100 $1,212 Medium N/A N/A N/A ---- Low
Purchase from Greenbelt
MIWA 0 0 100 100 100 100 N/A High Low Low Low ---- Low
SPEARMAN Hansford Canadian Conservation 0 22 39 41 42 42 $490 Medium N/A N/A N/A ---- N/A
New wells 0 0 900 900 900 900 $594 Medium Low Low Low ---- Low
IRRIGATION Hansford Canadian Conservation 0 24,436 45,264 51,215 51,951 51,951 Variable Medium Low Low Low ---- n/a
GRUVER Hansford Canadian Conservation 0 10 16 17 17 17 $490 Medium N/A N/A N/A ---- N/A
New wells 0 350 350 350 350 350 $731 Medium Low Low Low ---- Low
IRRIGATION Hartley Canadian Conservation 0 53,755 98,786 110,553 111,772 111,772 Variable Medium Low Low Low ---- N/A
FRITCH Hutchinson Canadian Rehab well/
purchase system 200 200 200 200 200 200 $1,558 Medium Low Low Low ---- Low
New wells 0 200 200 200 200 200 $751 Medium Low Low Low ---- Low
MANUFACTURING Hutchinson Canadian Purchase from
Borger 0 0 664 1,244 1,752 2,450 N/A Medium Low Low Low ---- Low
IRRIGATION Hutchinson Canadian Conservation 0 7,514 14,044 15,905 16,128 16,128 Variable Medium Low Low Low ---- N/A
COUNTY-OTHER Moore Canadian
Conservation 0 29 63 75 83 87 $490 Medium N/A N/A N/A ---- N/A
Purchase from Cactus
0 0 50 100 100 100 N/A Medium Low Low Low ---- Low
New wells 0 0 500 500 1,000 1,000 $474 Medium Low Low Low ---- Low
DUMAS Moore Canadian Conservation 0 89 158 166 171 174 $490 Medium N/A N/A N/A ---- N/A
New wells 0 387 1,163 1,672 2,219 2,500 $462 Medium Low Low Low ---- Low
MANUFACTURING Moore Canadian Purchase water
from Cactus 200 800 1,100 1,400 1,800 2,100 N/A Medium Low Low Low ---- Low
IRRIGATION Moore Canadian Conservation 0 31,602 58,995 66,995 67,846 67,846 Variable Medium Low Low Low ---- N/A

IPP Chapter 4 March 1, 2010 Evaluation of Water Management Strategies
4-7
Table 4-2: Summary of Strategy Impacts and Cost Evaluation (Continued)
Entity County Used Basin Used Strategy
Quantity (Ac-Ft/Yr) Cost
($/Ac-Ft) Reliability
Impacts of Strategy on:
2010 2020 2030 2040 2050 2060 Environ-mental Factors
Agricultural Resources/
Rural Areas
Other Natural
Resources
Possible Third Party
Key Water Quality
Parameters
STEAM ELECTRIC Moore Canadian New wells 200 200 200 200 200 200 $1,017 Medium Low Low Low ---- Low
SUNRAY Moore Canadian Conservation 0 18 34 36 38 39 $490 Medium N/A N/A N/A ---- N/A
New wells 0 0 800 800 800 800 $567 Medium Low Low Low ---- Low
PERRYTON Ochiltree Canadian Conservation 0 64 113 118 120 123 $490 Medium N/A N/A N/A ---- N/A
New wells 0 0 0 0 600 1,200 $759 Medium Low Low Low ---- Low
COUNTY-OTHER Potter Canadian Conservation 0 41 85 103 124 140 $490 Medium N/A N/A N/A ---- N/A
New wells 0 0 1,000 1,000 1,000 1,000 $474 Medium Low Low Low ---- Low
COUNTY-OTHER Potter Red Conservation 0 28 58 71 85 96 $490 Medium N/A N/A N/A ---- N/A
New wells 0 600 600 600 1,200 1,200 $474 Medium Low Low Low ---- Low
MANUFACTURING Potter Canadian Purchase from
Amarillo 0 0 200 328 313 225 N/A
Medium to High
Low Low Low ---- Medium
MANUFACTURING Potter Red Purchase from
Amarillo 0 0 444 1,087 1,846 2,638 N/A
Medium to High
Low Low Low ---- Medium
CANYON Randall Red Conservation 0 81 146 159 174 186 $490 Medium N/A N/A N/A ---- N/A
New wells 0 100 100 100 700 700 $0 Medium Low Low Low ---- Medium
COUNTY-OTHER Randall Red Conservation 0 101 197 231 268 299 $490 Medium N/A N/A N/A ---- N/A
New wells 0 0 600 1,200 2,600 2,600 $386 Medium Low Low Low ---- Medium
IRRIGATION Sherman Canadian Conservation 0 41,127 77,102 86,803 87,896 87,896 Variable Medium Low Low Low ---- Low
WHEELER Wheeler Red Conservation 0 9 15 15 15 15 $490 Medium N/A N/A N/A ---- N/A
New wells 0 0 0 0 200 200 $1,311 Medium Low Low Low ---- Low
WHOLESALE WATER PROVIDERS:
AMARILLO Potter and Randall
Red and Canadian
Conservation 0 1,375 2,453 2,639 2,841 3,012 $490 Medium N/A N/A N/A ---- N/A Potter Co. Well
Field 0 9,467 10,292 11,182 11,141 10,831 $565 Medium Low Low Low ---- Low
Roberts Co. Well Field 0 0 0 0 0 11,210 $1,286
Medium to High
Low Low Low ---- Medium
BORGER Hutchinson Canadian Conservation 0 24 71 114 107 102 $490 Medium N/A N/A N/A ---- N/A
New wells 0 0 1,000 1,000 2,000 2,000 $628 Medium Low Low Low ---- Low
CACTUS Moore Canadian Conservation 0 18 31 31 31 31 $490 Medium N/A N/A N/A ---- N/A
New wells 500 1,500 1,500 3,000 3,000 3,000 $537 Medium Low Low Low ---- Low
CRMWA Replacement Wells
0 0 15,000 15,000 15,000 15,000 $235 Medium to
High Low Low Low ---- Low
CRMWA Water rights
purchase 0 0 0 0 0 0 NA Medium to
High Low Low Low ---- Low
PALO DURO RIVER AUTHORITY Palo Duro
Transmission System
0 0 3,758 3,758 3,758 3,750 Varies Low to
Medium Low Low Low ----
Low to Medium
GREENBELT M&IWA New Wells 0 800 800 800 800 800 $288 Medium Low Low Low ---- Low
Chapter 4 March September 1, 2010 Evaluation of Water Management Strategies
4-8
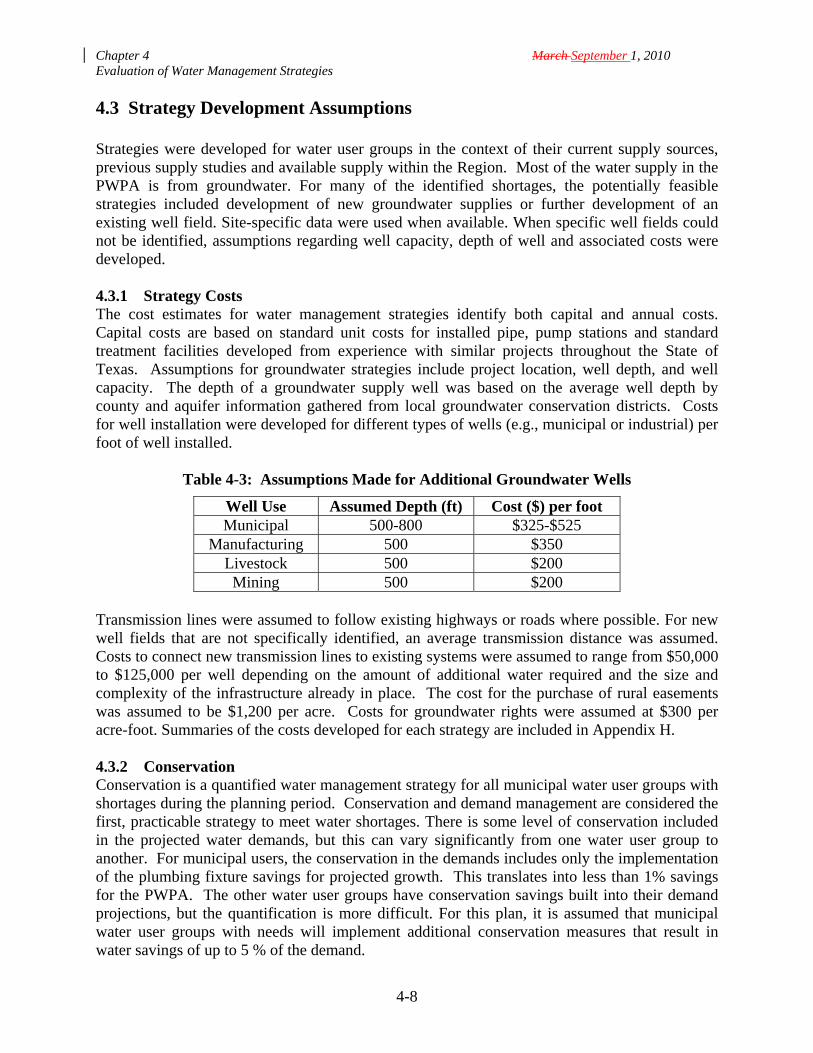
4.3 Strategy Development Assumptions Strategies were developed for water user groups in the context of their current supply sources, previous supply studies and available supply within the Region. Most of the water supply in the PWPA is from groundwater. For many of the identified shortages, the potentially feasible strategies included development of new groundwater supplies or further development of an existing well field. Site-specific data were used when available. When specific well fields could not be identified, assumptions regarding well capacity, depth of well and associated costs were developed. 4.3.1 Strategy Costs The cost estimates for water management strategies identify both capital and annual costs. Capital costs are based on standard unit costs for installed pipe, pump stations and standard treatment facilities developed from experience with similar projects throughout the State of Texas. Assumptions for groundwater strategies include project location, well depth, and well capacity. The depth of a groundwater supply well was based on the average well depth by county and aquifer information gathered from local groundwater conservation districts. Costs for well installation were developed for different types of wells (e.g., municipal or industrial) per foot of well installed.
Table 4-3: Assumptions Made for Additional Groundwater Wells
Well Use Assumed Depth (ft) Cost ($) per foot Municipal 500-800 $325-$525
Manufacturing 500 $350 Livestock 500 $200 Mining 500 $200
Transmission lines were assumed to follow existing highways or roads where possible. For new well fields that are not specifically identified, an average transmission distance was assumed. Costs to connect new transmission lines to existing systems were assumed to range from $50,000 to $125,000 per well depending on the amount of additional water required and the size and complexity of the infrastructure already in place. The cost for the purchase of rural easements was assumed to be $1,200 per acre. Costs for groundwater rights were assumed at $300 per acre-foot. Summaries of the costs developed for each strategy are included in Appendix H. 4.3.2 Conservation Conservation is a quantified water management strategy for all municipal water user groups with shortages during the planning period. Conservation and demand management are considered the first, practicable strategy to meet water shortages. There is some level of conservation included in the projected water demands, but this can vary significantly from one water user group to another. For municipal users, the conservation in the demands includes only the implementation of the plumbing fixture savings for projected growth. This translates into less than 1% savings for the PWPA. The other water user groups have conservation savings built into their demand projections, but the quantification is more difficult. For this plan, it is assumed that municipal water user groups with needs will implement additional conservation measures that result in water savings of up to 5 % of the demand.

Chapter 4 March September 1, 2010 Evaluation of Water Management Strategies
4-9
Advanced conservation for municipal users is encouraged to achieve a 1% annual demand reduction until a goal of 140 gallons per capita per day consumption is achieved. These strategies should be adopted by all regional municipalities in their respective water conservation plans in order to sustain regional municipal supply sources for future generations. Table 4-2 shows conservation savings for water user groups in the PWPA with needs for the planning period. It was assumed that municipalities will have a 0% conservation savings in 2010, 3% conservation savings in 2020, and 5% conservation savings from 2030 through 2060. The measures considered include the implementation of water efficient clothes washers for current populations, education and public awareness programs, reduction of unaccounted for water through water audits and system maintenance, and water rate structures that discourage water waste. Annual costs for municipal conservation are assumed to be $1.50 per thousand gallons ($490 per acre-foot). This is based on typical costs reported by municipalities for these types of strategies. Actual costs may differ pending the strategies implemented and the water supplier. Conservation strategies to reduce manufacturing water use are typically industry and process-specific and cannot be specified to meet county-wide needs. Wastewater reuse is a more general strategy that can be utilized by various industries for process water. This strategy requires a source (municipal water users with treated effluent), sufficient quantity and industrial processes that can utilize non-potable water. In lieu of specific conservation strategies for manufacturing, costs for improved efficiencies will be assumed at $1.50 per 1,000 gallons of supply ($490 per acre-foot). Where possible, wastewater reuse will be considered for manufacturing water needs. Steam electric power generation in the region is on schedule to implement full utilization of reuse wastewater for supply generation by 2010. Mining is another water category that often can use non-potable water, and its processes are conducive for recycling of water. Reuse (or recycling of water) will be considered as a conservation strategy for mining. The agricultural water needs in the PWPA include livestock and irrigated agriculture. New water supply strategies to meet these needs are limited. For irrigated agriculture, the primary strategies identified to address irrigation shortages are demand reduction strategies (conservation). The agricultural water conservation strategies considered include the use of the NPET to schedule irrigation, irrigation equipment efficiency improvements, implementation of conservation tillage methods, precipitation enhancement, conversion to dryland farming and changes to crop types that use less water. These strategies are discussed in Section 4.8. There are no identified conservation strategies for livestock water use. Drought management is a temporary strategy to conserve available water supplies during times of drought or emergencies. This strategy is not recommended to meet long-term growth in demands, but rather acts as means to minimize the adverse impacts of water supply shortages during drought. Discussions of drought management plans for entities in the PWPA are included in Chapter 6.
Chapter 4 March September 1, 2010 Evaluation of Water Management Strategies
4-10
4.4 Municipal Shortages As shown in Table 4-1, there are ten cities and three county-other municipal water users that indicate a shortage during the planning period. In addition, there is one county-other user that has known water quality concerns that requires the development of new supplies. Based on a water rights survey conducted for the 2006 regional water plan, several cities own additional groundwater rights that are not fully developed. For cities with projected shortages, it was assumed that these rights would be fully developed. If this supply was sufficient to meet the city’s shortages through 2060, no other strategies were developed. The strategies for each city are discussed in the following subsections. Water supply projects that do not involve the development of or connection to a new water source are consistent with the regional water plan, even though not specifically recommended in the plan. These include, but are not limited to, such projects as repairing treatment plants, repairing pipelines, maintaining groundwater supplies, and constructing new water towers.
4.4.1 Amarillo Location County: Potter and Randall River Basin: Canadian and Red The City of Amarillo is a water user group and a wholesale water provider in PWPA. Additional information regarding Amarillo’s recommended strategies is found in Section 4.9.2. The current sources of water include well fields in the Ogallala aquifer, reuse, and purchasing surface water and groundwater from the Canadian River Municipal Water Authority (CRMWA). The recommended strategies for the City of Amarillo include water conservation, the development of the Potters County well field, and development of the Roberts County well field. 4.4.2 Borger Location County: Hutchinson River Basin: Canadian The City of Borger is a water user group and a wholesale water provider in PWPA. The City is expected to need additional water supplies by 2030. Additional information regarding Borger’s recommended strategies is found in Section 4.9.3. The current sources of water include well fields in the Ogallala aquifer, reuse, and purchasing surface water and groundwater from the Canadian River Municipal Water Authority (CRMWA). The recommended strategies for the City of Borger include water conservation, and the development of the additional groundwater in Hutchinson County and purchase additional water from CRMWA. 4.4.3 Cactus Location Projected Shortage County: Moore 354 acre-feet per year River Basin: Canadian
Chapter 4 March September 1, 2010 Evaluation of Water Management Strategies
4-11
The City of Cactus in Moore County is a member of the Palo Duro River Authority and a wholesale water provider. The current supply for Cactus is the Ogallala aquifer in Moore County. Cactus is expected to need additional water supplies beginning in 2010 to serve its municipal and industrial customers. The recommended water management strategies for the City of Cactus are water conservation and purchasing additional groundwater rights in Moore County. Discussion of these strategies is found in Section 4.9.4. 4.4.4 Canyon Location Projected Shortage County: Randall 2,859 acre-feet per year River Basin: Red Canyon currently buys water from the City of Amarillo, as well as uses groundwater from its own wells in the Ogallala / Santa Rosa aquifer (Umbarger well field). This well field is showing rapid decline and will not be sustainable at the current pumpage amount. As a result, Canyon is shown to have shortages beginning in 2020 with a projected need of 2,859 acre-feet per year by 2060. In 2006, the City of Canyon purchased approximately 1,075 acres of undeveloped water rights in Randall County, northeast of the city. Two wells have been constructed at the Kim Road Well Field and the City plans to expand this well field and develop the Rockwell Road Well Field within the next five years. Both of these well fields are located in the Dockum formation. When fully developed, both well fields are expected to produce up to 8.5 MGD. This is an estimated 3,800 acre-feet per year of additional water supply. As the City develops these well fields, it may choose to reduce its water purchases from the City of Amarillo. At this time, it is assumed that Canyon will continue to purchase water from Amarillo. Recommended Strategies
- Implement water conservation - Develop groundwater rights in Randall County with associated infrastructure
Recommended Water Conservation Strategies - Implementation of water conservation plan - Water conservation pricing - System water audit
Strategy Descriptions The recommended strategies include implementing conservation measures and developing additional groundwater from the Dockum aquifer in Randall County with associated transmission system. Municipal water conservation is based on the goals reported in the City’s water conservation plan: reduction of 5 gpcd in 2020, followed by reductions of 10 gpcd for subsequent decades. Data for the development of the Dockum well fields was provided by the City. Time Intended to Complete The water conservation strategies are assumed to be in place by 2010 with visible reductions in water demand being seen by 2020. Some of the additional groundwater supply is expected to be online by 2010, with expansions planned over the planning period.

Chapter 4 March September 1, 2010 Evaluation of Water Management Strategies
4-12
Quantity, Reliability, and Cost The quantity of water from these strategies should be sufficient. The reliability of conservation is considered moderate because much of the conservation plan must be implemented by the consumers. The conservation measures do not have any capital costs associated with them. The reliability of the additional supply from groundwater is moderate. There is competition for groundwater in Randall County which can impact the long-term reliability of this source. The capital cost for additional infrastructure is estimated at $8.29.5 million with a unit cost of water at $369 407 per acre-foot. Environmental Issues No significant environmental impacts are expected as a result of the implementation of the recommended strategies. Impact on Water Resources and Other Management Strategies The recommended strategies are not expected to have any impacts on water resources or other management strategies. Impact on Agriculture and Natural Resources No significant impact on agricultural or natural resources is expected for the recommended strategies. Other Relevant Factors There are no other relevant factors associated with these strategies. Interbasin Transfer The recommended strategies do not require interbasin transfer permits. Social and Economic Impacts No negative social and economic impacts are expected from the implementation of these strategies. Impacts on Water Rights, Contracts, and Option Agreements The recommended strategies are not expected to have any impact on water rights, contracts, or option agreements. The City already owns the additional water rights included in this strategy. Impact on Navigation No impact on the navigable waters of the United States is expected. Recommended Strategies for City of Canyon -Values are in Acre-Feet per Year-
Strategy Capital Cost 2010 2020 2030 2040 2050 2060 Conservation $0 0 80 176 191 208 227 New Wells Dockum
$8,218,09,528,800 700 1,400 2,100 2,800 2,800 3,800

Chapter 4 March September 1, 2010 Evaluation of Water Management Strategies
4-13
4.4.5 Dumas Location Projected Shortage County: Moore 2,478 acre-feet per year River Basin: Canadian The City of Dumas is located in Moore County and is the largest member city of the Palo Duro River Authority (PDRA). Currently, Dumas obtains its water supply from its own wells in the Ogallala aquifer in Moore County. Dumas is expected to need additional water to meet its demand throughout most of the planning period (2020-2060). By 2060, the projected shortages for Dumas are nearly 2,500 acre-feet per year. Dumas recently developed its water rights in Hartley County, but additional water rights will need to be acquired to fully meet the City’s projected shortages. The City intends to fully meet its projected demands with groundwater. As an alternative, Dumas may participate in the Palo Duro transmission project. Recommended Strategies - Implement water conservation strategies - Develop groundwater in the Ogallala aquifer in Hartley and/ or Moore Counties with new
wells and associated infrastructure
Recommended Water Conservation Strategies - Implementation of water conservation plan - Water conservation pricing - System water audit
Strategy Descriptions The recommended strategies for Dumas include implementing water conservation and developing additional supply from the Ogallala aquifer with four new wells and transmission system. Time Intended to Complete Water conservation strategies should be in place by 2010 with water savings being noticed in 2020. Dumas will need to develop additional groundwater before 2020. Quantity, Reliability and Cost The quantity of water should be sufficient. The reliability of conservation is considered moderate because much of the conservation plan must be implemented by the consumers. The conservation measures do not have any capital costs associated with them. Reliability of Ogallala supply is moderate to moderately-low since the aquifer is heavily used and availability depends on other water users. Assuming the expanded well field will be located within 5 miles of the City or the existing well field in Hartley County, the capital cost for new wells is estimated at $8 million. Unit cost of water would be $479 per acre-foot. Environmental Issues The environmental impacts from conservation and groundwater development are expected to be low. Once the specific locations of additional wells and alignments associated with infrastructure are identified, a detailed evaluation to determine environmental impacts, if any, will need to be performed.

Chapter 4 March September 1, 2010 Evaluation of Water Management Strategies
4-14
Impact on Water Resources and Other Management Strategies Water conservation may impact the amount of water returned to the system that might be available for reuse. The increased demands on the Ogallala will continue to deplete the storage in the aquifer. To prolong the life of the Ogallala, other users may need to reduce their demands. Impact on Agriculture and Natural Resources The recommended strategies are expected to have low to moderate impact on the agriculture and other natural resources. This strategy may reduce the irrigated acreage for farming as additional water rights acreage is purchased. This acreage could be used for dry land farming if needed, but may require crop changes. Other Relevant Factors There are no other identified relevant factors. Interbasin Transfer The recommended strategies do not require interbasin transfer permits. Social and Economic Impacts No negative social and economic impacts are expected from the implementation of these strategies. Impacts on Water Rights, Contracts, and Option Agreements The recommended strategies are not expected to impact water rights, contracts, or option agreements. Impact on Navigation The recommended strategies should have no impact on the navigable waters of the United States. Alternative Strategy As a member of the PDRA, Dumas is interested in developing a regional transmission system to use water from Palo Duro Reservoir. The Palo Duro Reservoir transmission project is an alternative strategy for Dumas. The project would have very little impact on the environment, agricultural or other natural resources. Once the pipeline route is established, a more detailed analysis of the impacts should be considered. No interbasin transfer permits would be required for the Palo Duro transmission project. The use of this supply might decrease lake levels and impact recreation uses on the lake from time to time. No other impacts are expected from this project. Dumas is expected to have a capital cost of $36.7 million associated with their portion of the project. Recommended Strategies for City of Dumas -Values are in Acre-Feet per Year-
Strategy Capital
Cost 2010 2020 2030 2040 2050 2060
Conservation $0 0 89 158 166 171 174 New Wells Ogallala
$7,997,200 0 387 1,163 1,672 2,219 2,500
Chapter 4 March September 1, 2010 Evaluation of Water Management Strategies
4-15
4.4.6 Fritch Location County: Hutchinson and Moore River basin: Canadian The City of Fritch currently obtains its water supply from the Ogallala aquifer in Carson County. The supply and demand comparison for Fritch did not show a shortage; however, the City is currently in the process of purchasing groundwater rights and existing well fields from the Hi Texas Water Supply Corporation. The City is planning to rehabilitate an existing well and drill a new well. For planning purposes, it is assumed that the existing well is located in Carson County and the new well will be drilled in Hutchinson County.. Recommended Strategies - Purchase existing infrastructure form Hi Texas Water Supply Corporation and
rehabilitate one well in Carson County in the Ogallala aquifer - Drill an additional well in the Ogallala aquifer in Hutchinson County
Strategy Descriptions The recommended strategies include developing additional supply from the Ogallala aquifer in Carson and Hutchinson County. For planning purposes, it is assumed that the rehabilitated well will provide 200 acre-feet per year beginning in 2010, and the new well in Hutchinson County will provide another 200 acre-feet per year. (Note: the actual number and location of wells will be determined at the time of the strategy development.) Time Intended to Complete The additional groundwater from the rehabilitated well will be available shortly after 2010 and the new well will be constructed by 2020. Quantity, Reliability and Cost The quantity of water from these strategies should be sufficient. Reliability of Ogallala supplies is moderate since availability depends on other water users. For cost purposes, it is assumed that the new well would be located within one mile of the City’s existing transmission system. The capital cost for the system infrastructure, rehabilitation and a new well additional is approximately $4 million. Environmental Issues No significant environmental impact is expected for the recommended strategies. Once the specific locations of the additional well and alignments associated with infrastructure are identified, a detailed evaluation to determine environmental impacts, if any, will need to be performed. Impact on Water Resources and Other Management Strategies The increased demands on the Ogallala will continue to deplete the storage in the aquifer. To prolong the life of this water resource, other users may need to reduce their demands.

Chapter 4 March September 1, 2010 Evaluation of Water Management Strategies
4-16
Impact on Agriculture and Natural Resources No significant impact on agricultural or natural resources is expected for the recommended strategies. Other Relevant Factors There are no other identified relevant factors. Interbasin Transfer The recommended strategies do not require interbasin transfer permits. Social and Economic Impacts No negative social and economic impacts are expected from the implementation of these strategies. Impacts on Water Rights, Contracts, and Option Agreements The recommended strategies are not expected to have any impacts on water rights, contracts, or option agreements. The acquisition of the water supply corporation is a mutual agreement. Impact on Navigation No impact on the navigable waters of the United States is expected. Recommended Strategies for City of Fritch -Values are in Acre-Feet per Year-
Strategy Capital
Cost 2010 2020 2030 2040 2050 2060
Rehabilitate well and purchase system
$2,850,300 200 200 200 200 200 200
New Wells Ogallala
$1,156,600 0 200 200 200 200 200
4.4.7 Gruver Location Projected Shortage County: Hansford 334 acre-feet per year River basin: Canadian The City of Gruver currently obtains its water supply from the Ogallala aquifer in Hansford County. Based on the availability of the City’s current wells, Gruver will need to develop additional supplies before 2020. Projected shortages for Gruver range from 77 acre-feet in 2020 to 334 acre-feet in 2060. The City owns approximately 1,000 acres of undeveloped water rights. These water rights may be sufficient to meet the projected needs, pending competition for water from other users. The recommended strategies for Gruver include water conservation and developing additional groundwater from the Ogallala aquifer with a new well and associated infrastructure.
Chapter 4 March September 1, 2010 Evaluation of Water Management Strategies
4-17
Recommended Strategies - Implement water conservation strategies - Drill additional wells in the Ogallala aquifer in Hansford County with transmission
Conservation Strategy Name - Implementation of water conservation plan - Water conservation pricing - System water audit
Strategy Descriptions The recommended strategies include implementing conservation measures and developing additional supply from the Ogallala aquifer in Hansford County. For planning purposes, it is assumed that one new well providing 350 acre-feet per year (400 gpm) will be needed for the City’s needs. (Note: the actual number and location of wells will be determined at the time of the strategy development.) Time Intended to Complete The water conservation strategies are assumed to be in place by 2010 with visible reductions in water demand being seen by 2020. The additional groundwater will be needed by 2020. Quantity, Reliability and Cost The quantity of water from these strategies should be sufficient. The reliability of conservation is considered moderate because much of the conservation plan must be implemented by the consumers. The conservation measures do not have any capital costs associated with them. Reliability of Ogallala supplies is moderate since availability depends on other water users. For cost purposes, it is assumed that the new well would be located within three miles of the City. The capital cost for the additional groundwater well and transmission pipeline is approximately $2 million. Environmental Issues No significant environmental impact is expected for the recommended strategies. Once the specific locations of additional wells and alignments associated with infrastructure are identified, a detailed evaluation to determine environmental impacts, if any, will need to be performed. Impact on Water Resources and Other Management Strategies The increased demands on the Ogallala will continue to deplete the storage in the aquifer. To prolong the life of this water resource, other users may need to reduce their demands. Impact on Agriculture and Natural Resources No significant impact on agricultural or natural resources is expected for the recommended strategies. Other Relevant Factors There are no other identified relevant factors.

Chapter 4 March September 1, 2010 Evaluation of Water Management Strategies
4-18
Interbasin Transfer The recommended strategies do not require interbasin transfer permits. Social and Economic Impacts No negative social and economic impacts are expected from the implementation of these strategies. Impacts on Water Rights, Contracts, and Option Agreements The recommended strategies are not expected to have any impacts on water rights, contracts, or option agreements. Impact on Navigation No impact on the navigable waters of the United States is expected. Alternative Strategy As a member of the PDRA, Gruver may be interested in developing a regional transmission system to use water from Palo Duro Reservoir. The Palo Duro Reservoir transmission project is an alternative strategy for Gruver. The project would have very little impact on the environment, agricultural or other natural resources. Once the pipeline route is established, a more detailed analysis of the impacts should be considered. No interbasin transfer permits would be required for the Palo Duro transmission project. The use of this supply might decrease lake levels and impact recreation uses on the lake from time to time. No other impacts are expected from this project. Gruver would expect to have a capital cost of $5.1 million associated with their portion of the project. Recommended Strategies for City of Gruver -Values are in Acre-Feet per Year-
Strategy Capital
Cost 2010 2020 2030 2040 2050 2060
Conservation $0 0 10 16 17 17 17 New Wells Ogallala
$1,968,500 0 350 350 350 350 350

Chapter 4 March September 1, 2010 Evaluation of Water Management Strategies
4-19
4.4.7 8 Lefors Location Projected Shortage County: Gray 36 acre-feet per year River Basin: Red Lefors currently obtains its water supply from the Ogallala aquifer in Gray County. Based on the availability of the City’s current wells, Lefors will need to develop additional supplies by 2040. The recommended strategies for Lefors include water conservation and developing additional groundwater from the Ogallala aquifer with new wells and transmission system. Recommended Strategies
- Implement water conservation strategies - Purchase additional water rights and develop a new well in the Ogallala aquifer in Gray
County with associated infrastructure Conservation Strategy Name
- Implementation of water conservation plan - Water conservation pricing - System water audit
Strategy Descriptions The recommended strategies include implementing conservation measures and developing additional supply from the Ogallala aquifer in Gray County. For planning purposes, it is assumed that one new well will be needed for the City’s needs. This well is sized for 100 acre-feet per year and is assumed to be located within five miles of the City. Time Intended to Complete The water conservation strategies are assumed to be in place by 2010 with visible reductions in water demand being seen by 2020. The additional groundwater will be needed by 2040. Quantity, Reliability and Cost The quantity of water from these strategies should be sufficient. The reliability of conservation is considered moderate because much of the conservation plan must be implemented by the consumers. The conservation measures do not have any capital costs associated with them. Reliability of Ogallala supplies is moderate since availability depends on other water users. The capital cost for the additional groundwater well and transmission pipeline is $1.1 million. Environmental Issues No significant environmental impact is expected for the recommended strategies. Once the specific locations of additional wells and alignments associated with infrastructure are identified, a detailed evaluation to determine environmental impacts, if any, will need to be performed. Impact on Water Resources and Other Management Strategies The increased demands on the Ogallala will continue to deplete the storage in the aquifer. To prolong the life of this water resource, other users may need to reduce their demands.

Chapter 4 March September 1, 2010 Evaluation of Water Management Strategies
4-20
Impact on Agriculture and Natural Resources No significant impact on agricultural or natural resources is expected for the recommended strategies. Other Relevant Factors There are no other identified relevant factors. Interbasin Transfer The recommended strategies do not require interbasin transfer permits. Social and Economic Impacts No negative social and economic impacts are expected from the implementation of these strategies. Impacts on Water Rights, Contracts, and Option Agreements The recommended strategies are not expected to have any impacts on water rights, contracts, or option agreements. Impact on Navigation No impact on the navigable waters of the United States is expected. Recommended Strategies for City of Lefors -Values are in Acre-Feet per Year-
Strategy Capital
Cost 2010 2020 2030 2040 2050 2060
Conservation $0 0 3 4 4 4 4 New Wells Ogallala
$1,132,500 0 0 0 100 100 100
4.4.8 9 Memphis Location Projected Shortage County: Hall 142 acre-feet per year River Basin: Red The City of Memphis currently obtains its water supply from the Ogallala aquifer in Donley County and purchases treated surface water from Greenbelt Municipal and Industrial Water Authority. Due to the limited groundwater in Donley County, Memphis is projected to have a shortage of 81 acre-feet by 2020, increasing to approximately 140 acre-feet from 2030 through 2060. To meet this need, Memphis could develop additional groundwater in Donley County and/or purchase additional water from Greenbelt M&IWA. The recommended strategies for Memphis include water conservation, developing additional groundwater from the Ogallala aquifer with new wells and associated infrastructure, and purchasing additional water from Greenbelt M&IWA.

Chapter 4 March September 1, 2010 Evaluation of Water Management Strategies
4-21
Recommended Strategies - Implement water conservation strategies - Purchase additional water rights and develop new well in the Ogallala aquifer in Donley
County with associated infrastructure - Purchase additional water from Greenbelt M&IWA
Conservation Strategy Name
- Implementation of water conservation plan - Water conservation pricing - System water audit
Strategy Descriptions The recommended strategies include implementing conservation measures, developing additional supply from the Ogallala aquifer in Donley County, and purchasing additional water from Greenbelt M&IWA. For planning purposes, it is assumed that one new well will be needed for the City’s needs. The additional supply from Greenbelt M&IWA would be 100 acre-feet per year. Time Intended to Complete The water conservation strategies are assumed to be in place by 2010 with visible reductions in water demand being seen by 2020. The additional groundwater will be needed by 2020, with additional treated surface water by 2030. Quantity, Reliability and Cost The quantity of water from these strategies should be sufficient. The reliability of conservation is considered moderate because much of the conservation plan must be implemented by the consumers. The conservation measures do not have any capital costs associated with them. Reliability of Ogallala supplies is moderate since availability depends on other water users and the nearest well field locations are near the boundary of the aquifer. The capital cost for the additional groundwater well is approximately $1 million. The reliability of the treated surface water supply is high. It is assumed that the additional surface water could be delivered through existing infrastructure and there are no additional capital costs. (This will need to be confirmed.) Environmental Issues No significant environmental impact is expected for the recommended strategies. Once the specific locations of additional wells and alignments associated with infrastructure are identified, a detailed evaluation to determine environmental impacts, if any, will need to be performed. Impact on Water Resources and Other Management Strategies The increased demands on the Ogallala will continue to deplete the storage in the aquifer. To prolong the life of this water resource, other users may need to reduce their demands. Impact on Agriculture and Natural Resources No significant impact on agricultural or natural resources is expected for the recommended strategies.

Chapter 4 March September 1, 2010 Evaluation of Water Management Strategies
4-22
Other Relevant Factors There are no other identified relevant factors. Interbasin Transfer The recommended strategies do not require interbasin transfer permits. Social and Economic Impacts No negative social and economic impacts are expected from the implementation of these strategies. Impacts on Water Rights, Contracts, and Option Agreements The recommended strategies are not expected to have any impacts on water rights, contracts, or option agreements. Impact on Navigation No impact on the navigable waters of the United States is expected. Recommended Strategies for City of Memphis -Values are in Acre-Feet per Year-
Strategy Capital
Cost 2010 2020 2030 2040 2050 2060
Conservation $0 0 13 22 22 22 22 New Wells Ogallala
$1,042,100 0 100 100 100 100 100
Purchase from Greenbelt M&IWA
$0* 0 0 100 100 100 100
*This assumes no additional infrastructure is needed. 4.4.10 City of Pampa The City of Pampa provides water to customers in Gray County, including TDCJ, and Titan Specialties and other manufactories. The City receives blended water from CRMWA and operates wells for groundwater from the Ogallala aquifer. The City also reuses treated wastewater to supply irrigation water to its municipal golf course. The supply and demand analysis shows that Pampa has sufficient supplies to meet its current demands. The City is currently planning to rehabilitate its existing well system and developing additional groundwater. Recommended Strategies
‐ Implement conservation strategies ‐ Purchase additional water form CRMWA ‐ Develop additional groundwater (Ogallala aquifer) and rehabilitate existing wells
Recommended Conservation Strategies
‐ Implementation of water conservation plan ‐ Water conservation pricing ‐ System water audit
Chapter 4 March September 1, 2010 Evaluation of Water Management Strategies
4-23
Strategy Descriptions The recommended strategies include implementing conservation measures, purchasing additional water from CRMWA and developing additional groundwater from the Ogallala aquifer in Gray County. The table below shows the amount of water supply associated with each of the recommended strategies. The yield of the City of Pampa well field is expected to decline over time. It is anticipated that Pampa will continue to operate groundwater system at levels similar to current pumpage. To do this, the City will need to install additional wells and rehabilitate existing wells. To provide for additional commercial demands, the City of Pampa can purchase additional water from CRMWA. For planning purposes, it is assumed that no additional infrastructure will be needed; however, pending the additional purchase amount, there may be insufficient capacity in the existing infrastructure and future improvements will be needed. Time intended to complete Water conservation strategies are in place with water savings being noticed in 2020. The Gray County well field rehabilitation is beginning in 2010. Additional expansion of the well field will be developed as needed. Additional supply from CRMWA will be developed as needed. For planning purposes, it is assumed to come online by 2040. Quality, Reliability and Cost The quantity of water should be sufficient. The reliability of conservation is considered moderate because much of the conservation plan must be implemented by the consumers. The conservation measures do not have any capital costs associated with them. Reliability of Ogallala supplies is moderate since availability depends on other water users. The capital cost for the additional groundwater is $1.7 million. It is assumed that are no capital associated with increasing the purchase amount form CRMWA. Environmental Issues The environmental impacts from conservation and groundwater development are expected to be low. Once the specific locations of additional wells and alignment associated with the infrastructure are identified, a detailed evaluation to determine environmental impacts, if any, will need to be performed. Impact on Water Resources and Other Management Strategies Water conservation may impact the amount of water returned to the system that might be available for reuse. The increased demands on the Ogallala will continue to deplete the storage in the aquifer. There are other users that may compete for groundwater supplies, but there is sufficient water in Gray County to support these demands. Impact on Agriculture and Natural Resources Water conservation and the possible development of the future well fields are expected to have minimal impact on the agriculture and other natural resources. Other Relevant Factors There are no other identified relevant factors.

Chapter 4 March September 1, 2010 Evaluation of Water Management Strategies
4-24
Interbasin Transfer The recommended strategies do not require interbasin transfer permits. Social and Economic Impacts No negative social and economic impacts are expected from the implementation of these strategies. Impacts on Water Rights, Contracts, and Option Agreements The recommended strategies are not expected to have any impacts on water rights, contracts, or option agreements. Impact on Navigation No impact on the navigable waters of the United States is expected. Recommended Strategies for City of Pampa -Values are in Acre-Feet per Year-
Strategy Capital
Cost 2010 2020 2030 2040 2050 2060
Conservation $0 0 15 65 65 65 65 New Wells Ogallala
$1,731,100 968 2,581 0 0 0 0
Purchase from CRMWA*
$0* 0 0 0 0 1,000 1,000
*This assumes no additional infrastructure is needed. 4.4.9 11 Panhandle Location Projected Shortage County: Carson 556 acre-feet per year River Basin: Red The City of Panhandle currently obtains its water supply from the Ogallala aquifer in Carson County. Panhandle is not shown to have a shortage with the 2004 Northern Ogallala GAM; however, with the updated GAM the water supplies for Panhandle are substantially less. This is because the refined aquifer thickness shows decreases in the area with the city’s current well field. As a result, Panhandle will need to develop additional supplies by 2030. The recommended strategies for Panhandle include water conservation and developing additional groundwater from the Ogallala aquifer with new wells and associated transmission. Recommended Strategies - Implement water conservation strategies - Purchase additional water rights and develop new well field in the Ogallala aquifer in
Carson County with associated transmission Conservation Strategy Name
- Implementation of water conservation plan - Water conservation pricing - System water audit

Chapter 4 March September 1, 2010 Evaluation of Water Management Strategies
4-25
Strategy Descriptions The recommended strategies include implementing conservation measures and developing additional supply from the Ogallala aquifer in Carson County. For planning purposes, it is assumed that two new wells and associated transmission will be needed for the City’s needs. The wells are sized for a total supply of 600 ac-ft per year and are assumed to be located within five miles of the City. Time Intended to Complete The water conservation strategies are assumed to be in place by 2010 with visible reductions in water demand being seen by 2020. The additional groundwater will be needed by 2030. Quantity, Reliability and Cost The quantity of water from these strategies should be sufficient. The reliability of conservation is considered moderate because much of the conservation plan must be implemented by the consumers. The conservation measures do not have any capital costs associated with them. Reliability of Ogallala supplies is moderate since availability depends on other water users and location of new well field. The capital cost for the additional groundwater well and transmission pipeline is $3.3 million. Environmental Issues No significant environmental impact is expected for the recommended strategies. Once the specific locations of additional wells and alignments associated with infrastructure are identified, a detailed evaluation to determine environmental impacts, if any, will need to be performed. Impact on Water Resources and Other Management Strategies The increased demands on the Ogallala will continue to deplete the storage in the aquifer. To prolong the life of this water resource, other users may need to reduce their demands. Impact on Agriculture and Natural Resources No significant impact on agricultural or natural resources is expected for the recommended strategies. Other Relevant Factors There are no other identified relevant factors. Interbasin Transfer The recommended strategies do not require interbasin transfer permits. Social and Economic Impacts No negative social and economic impacts are expected from the implementation of these strategies. Impacts on Water Rights, Contracts, and Option Agreements The recommended strategies are not expected to have any impacts on water rights, contracts, or option agreements.

Chapter 4 March September 1, 2010 Evaluation of Water Management Strategies
4-26
Impact on Navigation No impact on the navigable waters of the United States is expected. Recommended Strategies for City of Panhandle -Values are in Acre-Feet per Year-
Strategy Capital
Cost 2010 2020 2030 2040 2050 2060
Conservation $0 0 17 29 28 25 23 New Wells Ogallala
$3,309,300 0 0 600 600 600 600
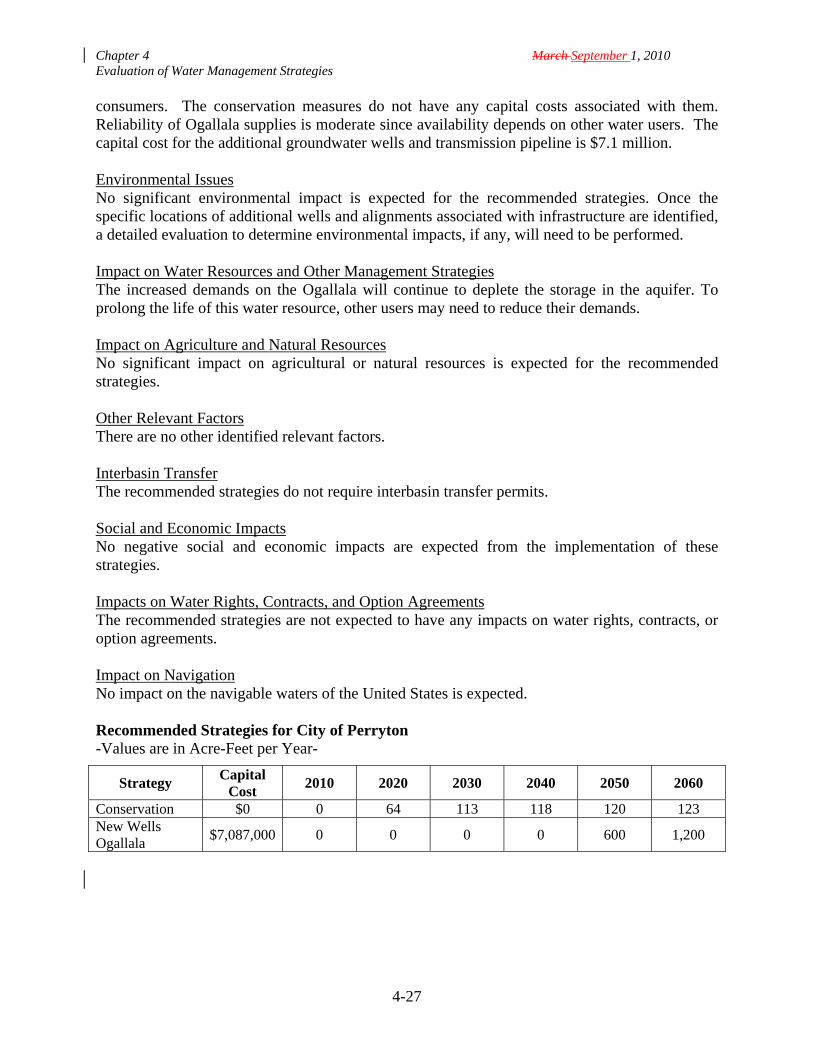
4.4.10 12 Perryton Location Projected Shortage County: Ochiltree 1,142 acre-feet per year River Basin: Canadian Perryton currently obtains its water supply from the Ogallala aquifer in Ochiltree County. The City of Perryton is not shown to have a shortage with the 2004 Northern Ogallala GAM; however, with the updated GAM the water supplies for Perryton are less. As a result, Perryton will need to develop additional supplies by 2050. The City owns 8 sections of undeveloped water rights in Ochiltree County, located about 5 to 15 miles from the city. The recommended strategies for Perryton include water conservation and developing the City’s undeveloped water rights in the Ogallala aquifer with new wells and associated transmission. Recommended Strategies - Implement water conservation strategies - Develop existing water rights with new wells in the Ogallala aquifer in Ochiltree County
with associated transmission Conservation Strategy Name - Implementation of water conservation plan - Water conservation pricing - System water audit
Strategy Descriptions The recommended strategies include implementing conservation measures and developing additional supply from the Ogallala aquifer in Ochiltree County. For planning purposes, it is assumed that four new wells will be needed for the City’s needs. Collectively, the wells will provide 1,200 acre-feet per year and are assumed to be located within ten miles of the City. Time Intended to Complete The water conservation strategies are assumed to be in place by 2010 with visible reductions in water demand being seen by 2020. The additional groundwater will be needed by 2050. Quantity, Reliability and Cost The quantity of water from these strategies should be sufficient. The reliability of conservation is considered moderate because much of the conservation plan must be implemented by the
Chapter 4 March September 1, 2010 Evaluation of Water Management Strategies
4-27
consumers. The conservation measures do not have any capital costs associated with them. Reliability of Ogallala supplies is moderate since availability depends on other water users. The capital cost for the additional groundwater wells and transmission pipeline is $7.1 million. Environmental Issues No significant environmental impact is expected for the recommended strategies. Once the specific locations of additional wells and alignments associated with infrastructure are identified, a detailed evaluation to determine environmental impacts, if any, will need to be performed. Impact on Water Resources and Other Management Strategies The increased demands on the Ogallala will continue to deplete the storage in the aquifer. To prolong the life of this water resource, other users may need to reduce their demands. Impact on Agriculture and Natural Resources No significant impact on agricultural or natural resources is expected for the recommended strategies. Other Relevant Factors There are no other identified relevant factors. Interbasin Transfer The recommended strategies do not require interbasin transfer permits. Social and Economic Impacts No negative social and economic impacts are expected from the implementation of these strategies. Impacts on Water Rights, Contracts, and Option Agreements The recommended strategies are not expected to have any impacts on water rights, contracts, or option agreements. Impact on Navigation No impact on the navigable waters of the United States is expected. Recommended Strategies for City of Perryton -Values are in Acre-Feet per Year-
Strategy Capital
Cost 2010 2020 2030 2040 2050 2060
Conservation $0 0 64 113 118 120 123 New Wells Ogallala
$7,087,000 0 0 0 0 600 1,200

Chapter 4 March September 1, 2010 Evaluation of Water Management Strategies
4-28
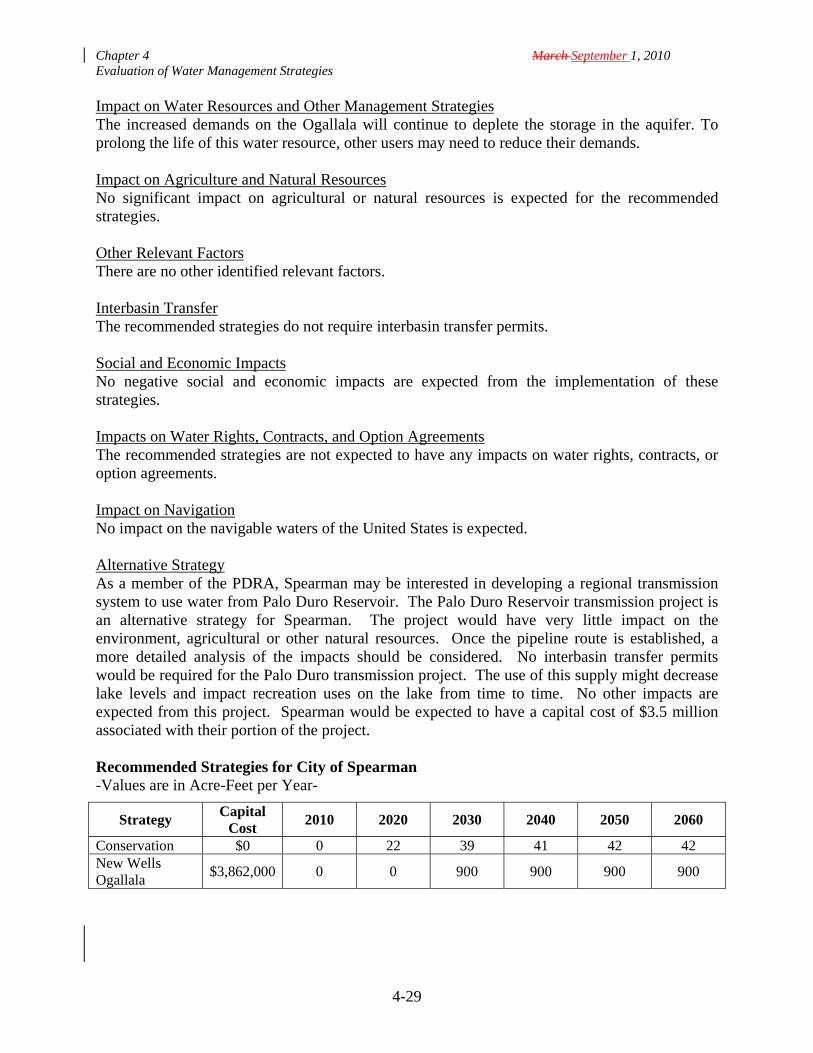
4.4.11 13 Spearman Location Projected Shortage County: Hansford 849 acre-feet per year River Basin: Canadian The City of Spearman currently obtains its water supply from the Ogallala aquifer in Hansford County. Based on the availability of the City’s current wells, Spearman will need to develop additional supplies by 2030. The recommended strategies for Spearman include water conservation and developing additional groundwater from the Ogallala aquifer with new wells and transmission system. Recommended Strategies
- Implement water conservation strategies - Purchase additional water rights and develop new well in the Ogallala aquifer in
Hansford County with associated infrastructure Conservation Strategy Name
- Implementation of water conservation plan - Water conservation pricing - System water audit
Strategy Descriptions The recommended strategies include implementing conservation measures and developing additional supply from the Ogallala aquifer in Hansford County. For planning purposes, it is assumed that two new wells will be needed to meet the City’s needs, and these wells would be located within five miles of the City. (Note: the actual number and location of wells will be determined at the time the strategy is developed.) Time Intended to Complete The water conservation strategies are assumed to be in place by 2010 with visible reductions in water demand being seen by 2020. The additional groundwater will be needed by 2030. Quantity, Reliability and Cost The quantity of water from these strategies should be sufficient. The reliability of conservation is considered moderate because much of the conservation plan must be implemented by the consumers. The conservation measures do not have any capital costs associated with them. Reliability of Ogallala supplies is moderate since availability depends on other water users. The capital cost for the additional groundwater wells is approximately $4 million. Environmental Issues No significant environmental impact is expected for the recommended strategies. Once the specific locations of additional wells and alignments associated with infrastructure are identified, a detailed evaluation to determine environmental impacts, if any, will need to be performed.
Chapter 4 March September 1, 2010 Evaluation of Water Management Strategies
4-29
Impact on Water Resources and Other Management Strategies The increased demands on the Ogallala will continue to deplete the storage in the aquifer. To prolong the life of this water resource, other users may need to reduce their demands. Impact on Agriculture and Natural Resources No significant impact on agricultural or natural resources is expected for the recommended strategies. Other Relevant Factors There are no other identified relevant factors. Interbasin Transfer The recommended strategies do not require interbasin transfer permits. Social and Economic Impacts No negative social and economic impacts are expected from the implementation of these strategies. Impacts on Water Rights, Contracts, and Option Agreements The recommended strategies are not expected to have any impacts on water rights, contracts, or option agreements. Impact on Navigation No impact on the navigable waters of the United States is expected. Alternative Strategy As a member of the PDRA, Spearman may be interested in developing a regional transmission system to use water from Palo Duro Reservoir. The Palo Duro Reservoir transmission project is an alternative strategy for Spearman. The project would have very little impact on the environment, agricultural or other natural resources. Once the pipeline route is established, a more detailed analysis of the impacts should be considered. No interbasin transfer permits would be required for the Palo Duro transmission project. The use of this supply might decrease lake levels and impact recreation uses on the lake from time to time. No other impacts are expected from this project. Spearman would be expected to have a capital cost of $3.5 million associated with their portion of the project. Recommended Strategies for City of Spearman -Values are in Acre-Feet per Year-
Strategy Capital
Cost 2010 2020 2030 2040 2050 2060
Conservation $0 0 22 39 41 42 42 New Wells Ogallala
$3,862,000 0 0 900 900 900 900

Chapter 4 March September 1, 2010 Evaluation of Water Management Strategies
4-30
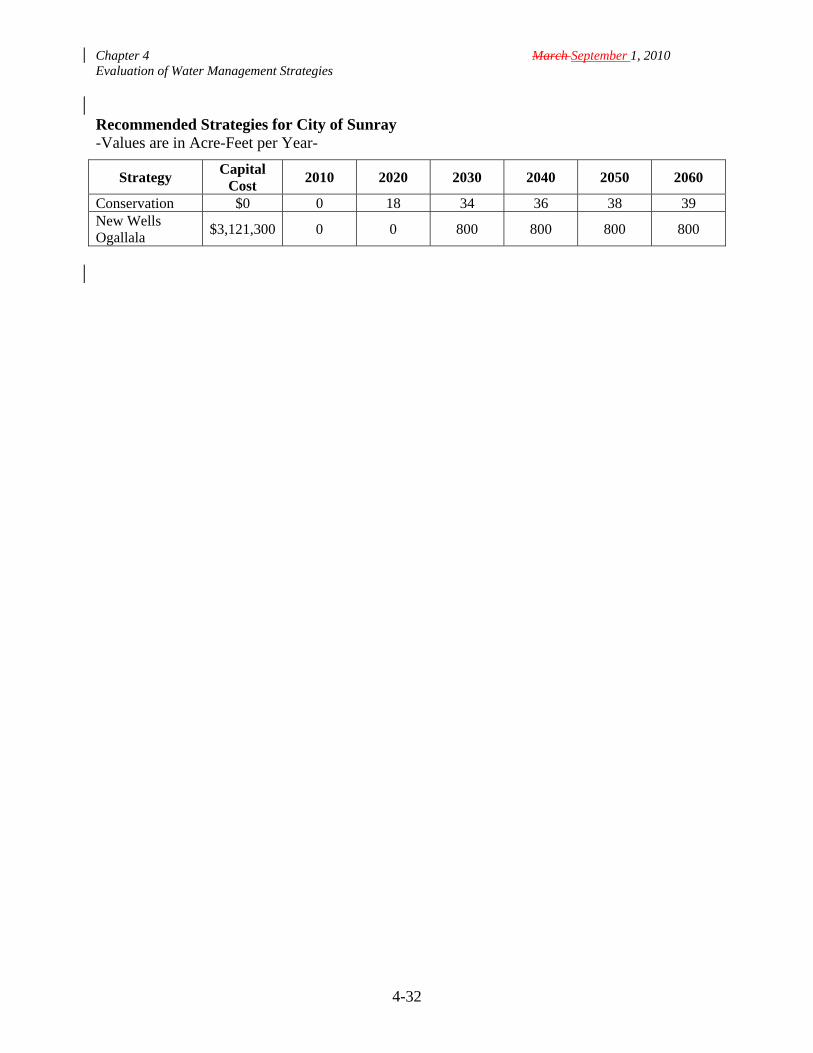
4.4.1214 Sunray Location Projected Shortage County: Moore 800 acre-feet per year River Basin: Canadian The City of Sunray is a member of the Palo Duro River Authority (PDRA). Sunray currently obtains its water supply from the Ogallala aquifer in Moore County. Sunray provides some water to rural county-other in Moore County, and it is assumed that Sunray will continue to supply water to a portion of Moore County-Other. By the end of the planning period, it is expected that Sunray will provide nearly 200 acre-feet for rural municipal needs. With the rural county-other demands, the projected shortages for the City of Sunray are greater than 300 acre-feet/year by 2060 based on the 2004 Ogallala GAM. With the update GAM, the shortages for Sunray are greater. To meet these shortages plus potential demands from future customers Sunray will need to develop additionally additional supply totaling approximately 800 acre-feet of water per year. The recommended strategies for Sunray include water conservation and developing additional groundwater from the Ogallala aquifer with new wells and associated infrastructure. Recommended Strategies - Implement water conservation strategies - Drill additional wells in the Ogallala aquifer in Moore County with associated
infrastructure Conservation Strategy Name - Implementation of water conservation plan - Water conservation pricing - System water audit
Strategy Descriptions The recommended strategies include implementing conservation measures and developing additional supply from the Ogallala aquifer in Moore County with associated transmission system. For planning purposes, it is assumed that three new wells will be needed for the City’s needs and the wells will be located within two miles of the City. (Note: the actual number and location of wells will be determined at the time the strategy is developed.) Time Intended to Complete The water conservation strategies are assumed to be in place by 2010 with visible reductions in water demand being seen by 2020. The additional groundwater will be needed by 2030. Quantity, Reliability and Cost The quantity of water from these strategies should be sufficient. The reliability of conservation is considered moderate because much of the conservation plan must be implemented by the consumers. The conservation measures do not have any capital costs associated with them. Reliability of Ogallala supplies is moderate since availability depends on other water users. The capital cost for the additional groundwater well is $3.1 million. The unit cost of water is $567 per acre-foot.

Chapter 4 March September 1, 2010 Evaluation of Water Management Strategies
4-31
Environmental Issues No significant environmental impact is expected for the recommended strategies. Once the specific locations of additional wells and alignments associated with infrastructure are identified, a detailed evaluation to determine environmental impacts, if any, will need to be performed. Impact on Water Resources and Other Management Strategies The increased demands on the Ogallala will continue to deplete the storage in the aquifer. To prolong the life of this water resource, other users may need to reduce their demands. Impact on Agriculture and Natural Resources No significant impact on agricultural or natural resources is expected for the recommended strategies. Other Relevant Factors There are no other identified relevant factors. Interbasin Transfer The recommended strategies do not require interbasin transfer permits. Social and Economic Impacts No negative social and economic impacts are expected from the implementation of these strategies. Impacts on Water Rights, Contracts, and Option Agreements The recommended strategies are not expected to have any impacts on water rights, contracts, or option agreements. Impact on Navigation No impact on the navigable waters of the United States is expected. Alternative Strategy As a member of the PDRA, Sunray is interested in developing a regional transmission system to use water from Palo Duro Reservoir. The Palo Duro Reservoir transmission project is an alternative strategy for Sunray. The project would have very little impact on the environment, agricultural or other natural resources. Once the pipeline route is established, a more detailed analysis of the impacts should be considered. No interbasin transfer permits would be required for the Palo Duro transmission project. The use of this supply might decrease lake levels and impact recreation uses on the lake from time to time. No other impacts are expected from this project. Sunray is expected to have a capital cost of $7.7 million associated with their portion of the project.
Chapter 4 March September 1, 2010 Evaluation of Water Management Strategies
4-32
Recommended Strategies for City of Sunray -Values are in Acre-Feet per Year-
Strategy Capital
Cost 2010 2020 2030 2040 2050 2060
Conservation $0 0 18 34 36 38 39 New Wells Ogallala
$3,121,300 0 0 800 800 800 800

Chapter 4 March September 1, 2010 Evaluation of Water Management Strategies
4-33
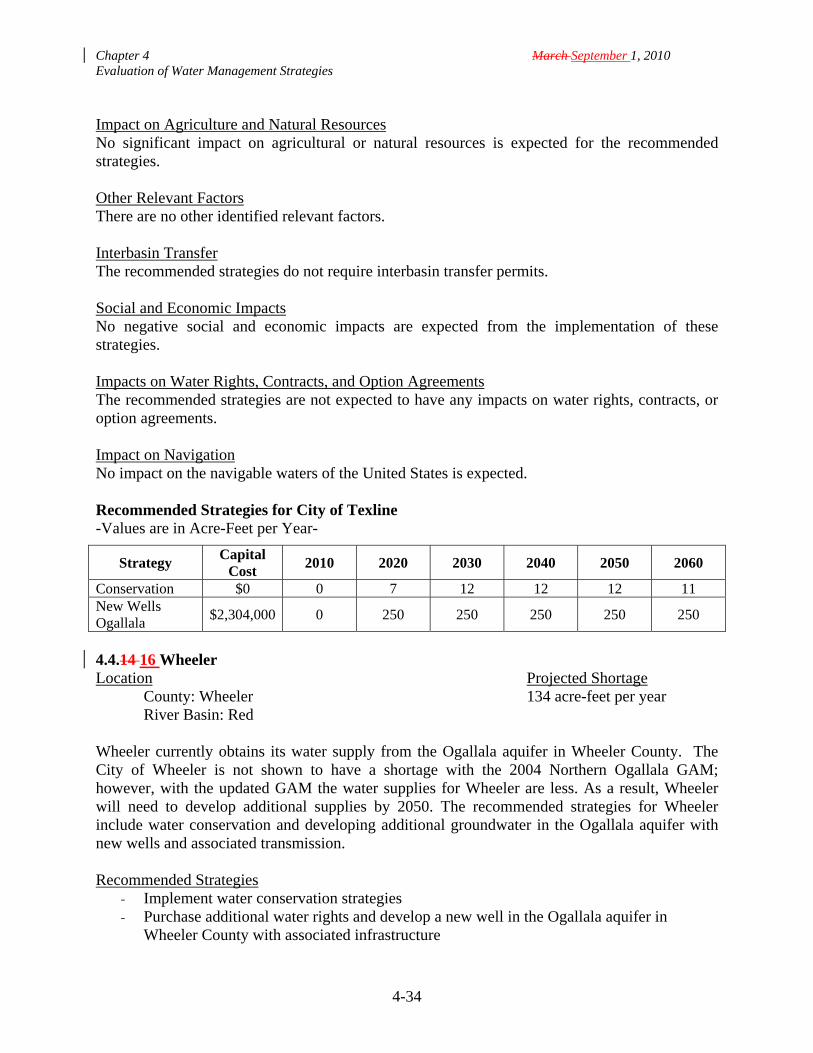
4.4.13 15 Texline Location Projected Shortage County: Dallam 224 acre-feet per year River Basin: Canadian Texline currently obtains its water supply from the Ogallala aquifer in Dallam County. The City of Texline is not shown to have a shortage with the 2004 Northern Ogallala GAM; however, with the updated GAM the water supplies for Texline are substantially less. As a result, Texline will need to develop additional supplies by 2020. The recommended strategies for Texline include water conservation and developing additional groundwater in the Ogallala aquifer with new wells and transmission system. Recommended Strategies - Implement water conservation strategies - Purchase additional water rights and develop a new well in the Ogallala aquifer in Dallam
County with associated infrastructure Conservation Strategy Name
- Implementation of water conservation plan - Water conservation pricing - System water audit
Strategy Descriptions The recommended strategies include implementing conservation measures and developing additional supply from the Ogallala aquifer in Dallam County. For planning purposes, it is assumed that one new well will be needed for the City’s needs. This well is sized for 250 acre-feet per year and is assumed to be located within five miles of the City. Time Intended to Complete The water conservation strategies are assumed to be in place by 2010 with visible reductions in water demand being seen by 2020. The additional groundwater will be needed by 2020. Quantity, Reliability and Cost The quantity of water from these strategies should be sufficient. The reliability of conservation is considered moderate because much of the conservation plan must be implemented by the consumers. The conservation measures do not have any capital costs associated with them. Reliability of Ogallala supplies is moderate since availability depends on other water users. The capital cost for the additional groundwater well and transmission pipeline is $2.3 million. Environmental Issues No significant environmental impact is expected for the recommended strategies. Once the specific locations of additional wells and alignments associated with infrastructure are identified, a detailed evaluation to determine environmental impacts, if any, will need to be performed. Impact on Water Resources and Other Management Strategies The increased demands on the Ogallala will continue to deplete the storage in the aquifer. To prolong the life of this water resource, other users may need to reduce their demands.
Chapter 4 March September 1, 2010 Evaluation of Water Management Strategies
4-34
Impact on Agriculture and Natural Resources No significant impact on agricultural or natural resources is expected for the recommended strategies. Other Relevant Factors There are no other identified relevant factors. Interbasin Transfer The recommended strategies do not require interbasin transfer permits. Social and Economic Impacts No negative social and economic impacts are expected from the implementation of these strategies. Impacts on Water Rights, Contracts, and Option Agreements The recommended strategies are not expected to have any impacts on water rights, contracts, or option agreements. Impact on Navigation No impact on the navigable waters of the United States is expected. Recommended Strategies for City of Texline -Values are in Acre-Feet per Year-
Strategy Capital
Cost 2010 2020 2030 2040 2050 2060
Conservation $0 0 7 12 12 12 11 New Wells Ogallala
$2,304,000 0 250 250 250 250 250
4.4.14 16 Wheeler Location Projected Shortage County: Wheeler 134 acre-feet per year River Basin: Red Wheeler currently obtains its water supply from the Ogallala aquifer in Wheeler County. The City of Wheeler is not shown to have a shortage with the 2004 Northern Ogallala GAM; however, with the updated GAM the water supplies for Wheeler are less. As a result, Wheeler will need to develop additional supplies by 2050. The recommended strategies for Wheeler include water conservation and developing additional groundwater in the Ogallala aquifer with new wells and associated transmission. Recommended Strategies - Implement water conservation strategies - Purchase additional water rights and develop a new well in the Ogallala aquifer in
Wheeler County with associated infrastructure

Chapter 4 March September 1, 2010 Evaluation of Water Management Strategies
4-35
Conservation Strategy Name - Implementation of water conservation plan - Water conservation pricing - System water audit
Strategy Descriptions The recommended strategies include implementing conservation measures and developing additional supply from the Ogallala aquifer in Wheeler County. For planning purposes, it is assumed that one new well will be needed for the City’s needs. This well is sized for 200 acre-feet per year and is assumed to be located within five miles of the City. Time Intended to Complete The water conservation strategies are assumed to be in place by 2010 with visible reductions in water demand being seen by 2020. The additional groundwater will be needed by 2050. Quantity, Reliability and Cost The quantity of water from these strategies should be sufficient. The reliability of conservation is considered moderate because much of the conservation plan must be implemented by the consumers. The conservation measures do not have any capital costs associated with them. Reliability of Ogallala supplies is moderate since availability depends on other water users. The capital cost for the additional groundwater well and transmission pipeline is $2.1 2 million. Environmental Issues No significant environmental impact is expected for the recommended strategies. Once the specific locations of additional wells and alignments associated with infrastructure are identified, a detailed evaluation to determine environmental impacts, if any, will need to be performed. Impact on Water Resources and Other Management Strategies The increased demands on the Ogallala will continue to deplete the storage in the aquifer. To prolong the life of this water resource, other users may need to reduce their demands. Impact on Agriculture and Natural Resources No significant impact on agricultural or natural resources is expected for the recommended strategies. Other Relevant Factors There are no other identified relevant factors. Interbasin Transfer The recommended strategies do not require interbasin transfer permits. Social and Economic Impacts No negative social and economic impacts are expected from the implementation of these strategies.
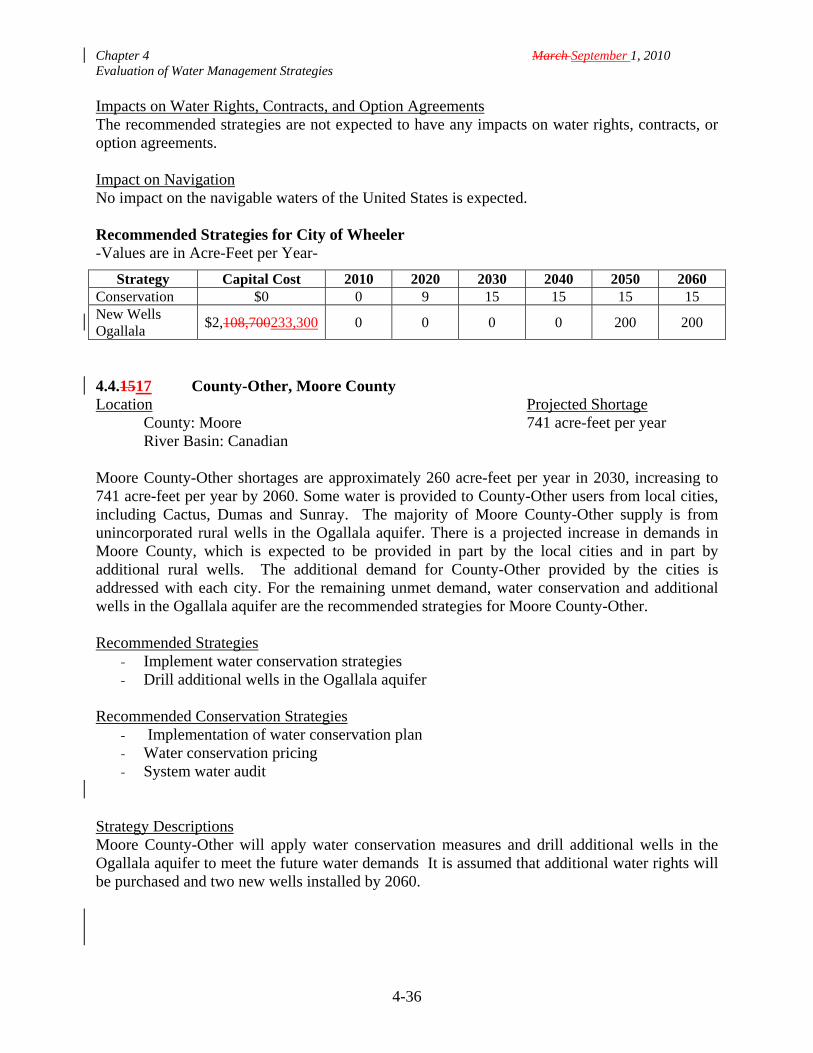
Chapter 4 March September 1, 2010 Evaluation of Water Management Strategies
4-36
Impacts on Water Rights, Contracts, and Option Agreements The recommended strategies are not expected to have any impacts on water rights, contracts, or option agreements. Impact on Navigation No impact on the navigable waters of the United States is expected. Recommended Strategies for City of Wheeler -Values are in Acre-Feet per Year-
Strategy Capital Cost 2010 2020 2030 2040 2050 2060 Conservation $0 0 9 15 15 15 15 New Wells Ogallala
$2,108,700233,300 0 0 0 0 200 200
4.4.1517 County-Other, Moore County Location Projected Shortage County: Moore 741 acre-feet per year River Basin: Canadian Moore County-Other shortages are approximately 260 acre-feet per year in 2030, increasing to 741 acre-feet per year by 2060. Some water is provided to County-Other users from local cities, including Cactus, Dumas and Sunray. The majority of Moore County-Other supply is from unincorporated rural wells in the Ogallala aquifer. There is a projected increase in demands in Moore County, which is expected to be provided in part by the local cities and in part by additional rural wells. The additional demand for County-Other provided by the cities is addressed with each city. For the remaining unmet demand, water conservation and additional wells in the Ogallala aquifer are the recommended strategies for Moore County-Other. Recommended Strategies - Implement water conservation strategies - Drill additional wells in the Ogallala aquifer
Recommended Conservation Strategies - Implementation of water conservation plan - Water conservation pricing - System water audit
Strategy Descriptions Moore County-Other will apply water conservation measures and drill additional wells in the Ogallala aquifer to meet the future water demands It is assumed that additional water rights will be purchased and two new wells installed by 2060.
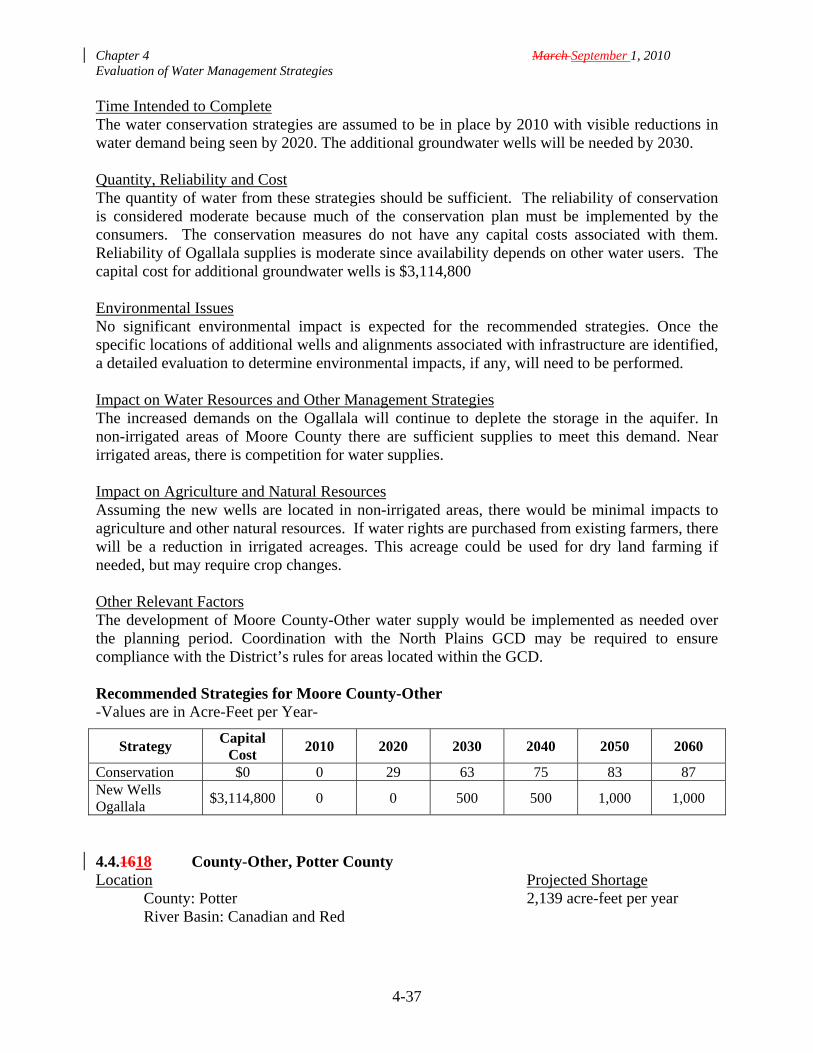
Chapter 4 March September 1, 2010 Evaluation of Water Management Strategies
4-37
Time Intended to Complete The water conservation strategies are assumed to be in place by 2010 with visible reductions in water demand being seen by 2020. The additional groundwater wells will be needed by 2030. Quantity, Reliability and Cost The quantity of water from these strategies should be sufficient. The reliability of conservation is considered moderate because much of the conservation plan must be implemented by the consumers. The conservation measures do not have any capital costs associated with them. Reliability of Ogallala supplies is moderate since availability depends on other water users. The capital cost for additional groundwater wells is $3,114,800 Environmental Issues No significant environmental impact is expected for the recommended strategies. Once the specific locations of additional wells and alignments associated with infrastructure are identified, a detailed evaluation to determine environmental impacts, if any, will need to be performed. Impact on Water Resources and Other Management Strategies The increased demands on the Ogallala will continue to deplete the storage in the aquifer. In non-irrigated areas of Moore County there are sufficient supplies to meet this demand. Near irrigated areas, there is competition for water supplies. Impact on Agriculture and Natural Resources Assuming the new wells are located in non-irrigated areas, there would be minimal impacts to agriculture and other natural resources. If water rights are purchased from existing farmers, there will be a reduction in irrigated acreages. This acreage could be used for dry land farming if needed, but may require crop changes. Other Relevant Factors The development of Moore County-Other water supply would be implemented as needed over the planning period. Coordination with the North Plains GCD may be required to ensure compliance with the District’s rules for areas located within the GCD. Recommended Strategies for Moore County-Other -Values are in Acre-Feet per Year-
Strategy Capital
Cost 2010 2020 2030 2040 2050 2060
Conservation $0 0 29 63 75 83 87 New Wells Ogallala
$3,114,800 0 0 500 500 1,000 1,000
4.4.1618 County-Other, Potter County Location Projected Shortage County: Potter 2,139 acre-feet per year River Basin: Canadian and Red
Chapter 4 March September 1, 2010 Evaluation of Water Management Strategies
4-38
Potter County-Other shortages are approximately 100 acre-feet per year in 2020, increasing to over 2,100 acre-feet per year by 2060 for the Red and Canadian basins combined. Small water supply corporations supply a portion of these demands. The majority of Potter County-Other supply is from unincorporated rural wells in the Ogallala aquifer. It is anticipated that this pattern will continue over the planning period. It is assumed that as demands increase, additional rural municipal wells will be installed. Water conservation and additional wells in the Ogallala aquifer are the recommended strategies for Potter County in both the Canadian and Red Basins. Recommended Strategies - Implement water conservation strategies - Drill additional wells in the Ogallala aquifer
Recommended Conservation Strategies - Implementation of water conservation plan - Water conservation pricing - System water audit
Strategy Descriptions Potter County-Other will apply water conservation measures and drill additional wells in the Ogallala aquifer to meet the future water demands It is assumed that additional water rights will be purchased and six new wells installed by 2060. Time Intended to Complete The water conservation strategies are assumed to be in place by 2010 with visible reductions in water demand being seen by 2020. Due to the nature of the aggregated County-Other demand, additional wells may be needed before the projected need is shown. For purposes of this plan, it is assumed that additional groundwater wells are installed prior to 2020. Quantity, Reliability and Cost The quantity of water from these strategies should be sufficient. The reliability of conservation is considered moderate because much of the conservation plan must be implemented by the consumers. The conservation measures do not have any capital costs associated with them. Reliability of Ogallala supplies is moderate since availability depends on other water users. The capital cost for additional groundwater wells is $8.9 million. Environmental Issues No significant environmental impact is expected for the recommended strategies. Once the specific locations of additional wells and alignments associated with infrastructure are identified, a detailed evaluation to determine environmental impacts, if any, will need to be performed. Impact on Water Resources and Other Management Strategies The increased demands on the Ogallala will continue to deplete the storage in the aquifer. To prolong the life of this water resource, other users may need to reduce their demands.

Chapter 4 March September 1, 2010 Evaluation of Water Management Strategies
4-39
Impact on Agriculture and Natural Resources This strategy may reduce the irrigated acreage for farming as additional water rights acreage is purchased. This acreage could be used for dry land farming if needed, but may require crop changes. Other Relevant Factors The development of Potter County-Other water supply would be implemented as needed over the planning period. Coordination with the local groundwater districts (Panhandle GCD and High Plains GCD) will be required to ensure compliance with the Districts’ production limitations and property line setback requirements for well locations. Interbasin Transfer The recommended strategies do not require interbasin transfer permits. Social and Economic Impacts No negative social and economic impacts are expected from the implementation of these strategies. Impacts on Water Rights, Contracts, and Option Agreements The recommended strategies are not expected to have any impacts on water rights, contracts, or option agreements Impact on Navigation The recommended strategies will have no impact on the navigable waters of the United States. Recommended Strategies for Potter County-Other (Red Basin) -Values are in Acre-Feet per Year-
Strategy Capital
Cost 2010 2020 2030 2040 2050 2060
Conservation $0 0 28 58 71 85 96 New Wells Ogallala
$5,444,600 0 600 600 600 1,200 1,200
Recommended Strategies for Potter County-Other (Canadian Basin) -Values are in Acre-Feet per Year-
Strategy Capital
Cost 2010 2020 2030 2040 2050 2060
Conservation $0 0 41 85 103 124 140 New Wells Ogallala
$3,114,800 0 0 1,000 1,000 1,000 1,000
4.4.1719 County-Other, Randall County Location Projected Shortage County: Randall 2,619 acre-feet per year River Basin: Red

Chapter 4 March September 1, 2010 Evaluation of Water Management Strategies
4-40
The demands in Randall County for county-other municipal supply are expected to more than double from approximately 2,715 acre-feet per year to 5,970 acre-feet per year. The current supply to Randall County-Other is primarily the Ogallala aquifer. A small amount of supply comes from the Dockum aquifer, and a small quantity of water is provided from the City of Amarillo to the Palo Duro Canyon State park for municipal use. Groundwater is limited in parts of the county, with some residential wells in northeast Randall County experiencing significant reductions in production. To meet these projected needs, groundwater wells will likely need to be expanded and/or improved to access deeper water. Water conservation will also be needed as demand for additional water increase. As an alternate strategy, Amarillo may sell wholesale water to county-other water users provided that these users meet the City’s requirements for municipal water sales. Recommended Strategies - Implement water conservation strategies - Drill additional wells in Ogallala aquifer in Randall County, Red Basin
Recommended Water Conservation Strategies - Implementation of water conservation plan - Water conservation pricing - System water audit
Strategy Descriptions Randall County-Other in the Red Basin will get additional supplies from water conservation measures and additional groundwater from the Ogallala aquifer. Additional water rights will need to be purchased and it is assumed that two new wells providing 600 acre-feet per year will be installed by 2030 with subsequent expansions needed to provide 2,400 acre-feet per year by 2060. Time Intended to Complete The water conservation strategies are assumed to be in place by 2010 with visible reductions in water demand being seen by 2020. The additional groundwater wells will be needed by 2030. Quantity, Reliability and Cost The quantity of water from these strategies should be sufficient. The reliability of conservation is considered moderate because much of the conservation plan must be implemented by the consumers. The conservation measures do not have any capital costs associated with them. Reliability of Ogallala supplies is moderate since availability depends on other water users. The capital cost for additional groundwater wells is approximately $10.9 million. Environmental Issues No significant environmental impact is expected for the recommended strategies. Once the specific locations of additional wells and alignments associated with infrastructure are identified, a detailed evaluation to determine environmental impacts, if any, will need to be performed.

Chapter 4 March September 1, 2010 Evaluation of Water Management Strategies
4-41

Chapter 4 March September 1, 2010 Evaluation of Water Management Strategies
4-42
Impact on Water Resources and Other Management Strategies The increased demands on the Ogallala will continue to deplete the storage in the aquifer. To prolong the life of this water resource, other users may need to reduce their demands. Impact on Agriculture and Natural Resources This strategy may reduce the irrigated acreage for farming as additional water rights acreage is purchased. This acreage could be used for dry land farming if needed, but may require crop changes. Other Relevant Factors Some areas in Randall County that currently do not lie within a groundwater conservation district are contemplating joining a GCD in the next 5 years. This may impact well locations and production amounts. Interbasin Transfer The recommended strategies do not require interbasin transfer permits.. Social and Economic Impacts No negative social and economic impacts are expected from the implementation of these strategies. Impacts on Water Rights, Contracts, and Option Agreements The recommended strategies are not expected to have any impacts on water rights, contracts, or option agreements. Impact on Navigation The recommended strategies will have no impact on the navigable waters of the United States. Recommended Strategies for Randall County-Other -Values are in Acre-Feet per Year-
Strategy Capital
Cost 2010 2020 2030 2040 2050 2060
Conservation $0 0 101 197 231 268 299 New Wells Ogallala
$10,889,200 0 0 600 1,200 1,800 2,400
4.4.2018 County-Other, Hall County Location Projected Shortage County: Hall Estimated at 80 acre-feet per year River Basin: Red Water quality concerns The supply and demand comparison for Hall County-Other shows that there are sufficient water supplies to meet the projected demands. However, there are water quality concerns for some users of the Seymour aquifer and localized shortages. The City of Turkey has been cited by the TCEQ for water quality exceedances for nitrates. The City considered advanced water treatment but this strategy was dismissed due to high costs. The City of Turkey is now planning to develop additional groundwater in Briscoe County in Region O and blending the new groundwater with
Chapter 4 March September 1, 2010 Evaluation of Water Management Strategies
4-43
its existing supplies. In addition, the Brice-Lesley Water Supply Corporation is experiencing significant reductions in production from its existing wells in Donley County. The WSC will need to expand its groundwater wells to maintain the current production capacities. Recommended Strategies
- Drill additional wells in Ogallala aquifer in Briscoe and Donley Counties
Strategy Descriptions The City of Turkey will develop additional groundwater in a new well field and blend the low nitrate water with its existing Seymour aquifer supply. For planning purposes, it is assumed that Turkey will develop 100 acre-feet per year of Ogallala water in Floyd County. To meet the needs of Brice-Lesley WSC and possibly other small water suppliers, it is assumed that additional wells will be drilled in the Ogallala aquifer in Donley County. Time Intended to Complete The strategies are assumed to be in design by 2010 with developed supplies shortly thereafter. Quantity, Reliability and Cost The quantity of water from these strategies should be sufficient. Reliability of Ogallala supplies is moderate since availability depends on other water users. The capital cost for additional groundwater wells is approximately $2.5 million. Environmental Issues No significant environmental impact is expected for the recommended strategies. Once the specific locations of additional wells and alignments associated with infrastructure are identified, a detailed evaluation to determine environmental impacts, if any, will need to be performed. Impact on Water Resources and Other Management Strategies The increased demands on the Ogallala will continue to deplete the storage in the aquifer. To prolong the life of this water resource, other users may need to reduce their demands. Impact on Agriculture and Natural Resources This strategy may reduce the irrigated acreage for farming as additional water rights acreage is purchased. This acreage could be used for dry land farming if needed, but may require crop changes. Other Relevant Factors No other relevant factors. Interbasin Transfer The recommended strategies do not require interbasin transfer permits.. Social and Economic Impacts No negative social and economic impacts are expected from the implementation of these strategies.
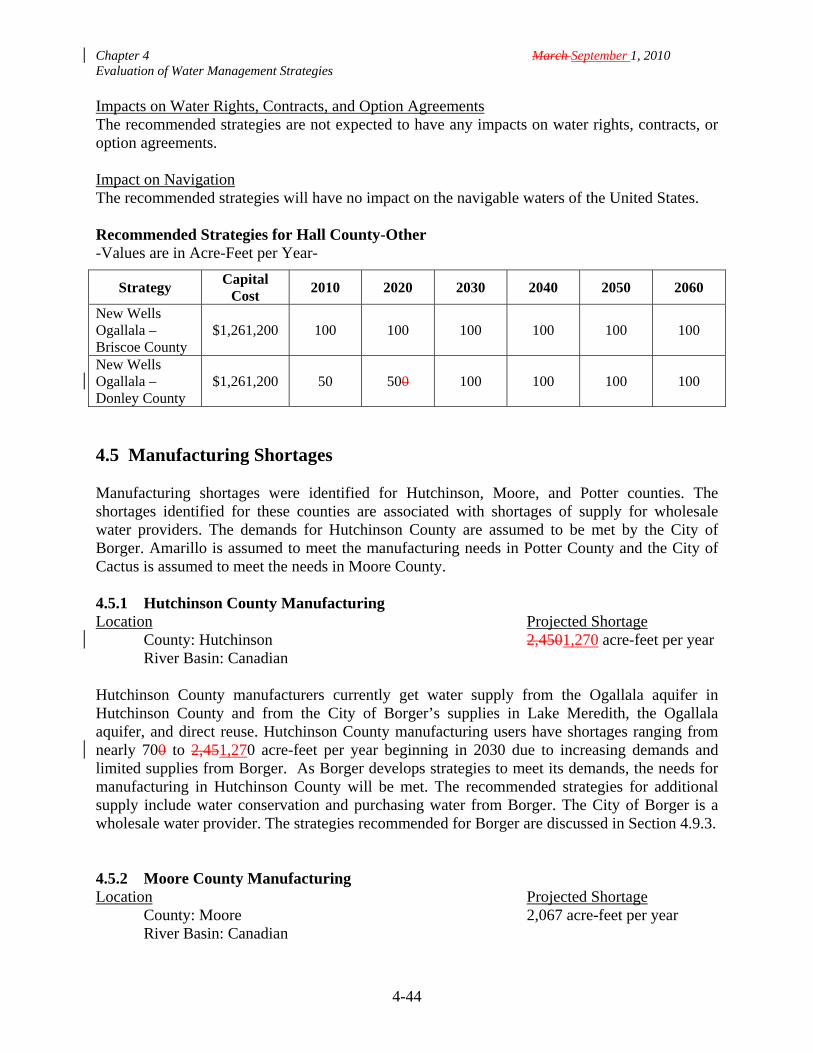
Chapter 4 March September 1, 2010 Evaluation of Water Management Strategies
4-44
Impacts on Water Rights, Contracts, and Option Agreements The recommended strategies are not expected to have any impacts on water rights, contracts, or option agreements. Impact on Navigation The recommended strategies will have no impact on the navigable waters of the United States. Recommended Strategies for Hall County-Other -Values are in Acre-Feet per Year-
Strategy Capital
Cost 2010 2020 2030 2040 2050 2060
New Wells Ogallala – Briscoe County
$1,261,200 100 100 100 100 100 100
New Wells Ogallala – Donley County
$1,261,200 50 500 100 100 100 100
4.5 Manufacturing Shortages Manufacturing shortages were identified for Hutchinson, Moore, and Potter counties. The shortages identified for these counties are associated with shortages of supply for wholesale water providers. The demands for Hutchinson County are assumed to be met by the City of Borger. Amarillo is assumed to meet the manufacturing needs in Potter County and the City of Cactus is assumed to meet the needs in Moore County. 4.5.1 Hutchinson County Manufacturing Location Projected Shortage County: Hutchinson 2,4501,270 acre-feet per year River Basin: Canadian Hutchinson County manufacturers currently get water supply from the Ogallala aquifer in Hutchinson County and from the City of Borger’s supplies in Lake Meredith, the Ogallala aquifer, and direct reuse. Hutchinson County manufacturing users have shortages ranging from nearly 700 to 2,451,270 acre-feet per year beginning in 2030 due to increasing demands and limited supplies from Borger. As Borger develops strategies to meet its demands, the needs for manufacturing in Hutchinson County will be met. The recommended strategies for additional supply include water conservation and purchasing water from Borger. The City of Borger is a wholesale water provider. The strategies recommended for Borger are discussed in Section 4.9.3. 4.5.2 Moore County Manufacturing Location Projected Shortage County: Moore 2,067 acre-feet per year River Basin: Canadian
Chapter 4 March September 1, 2010 Evaluation of Water Management Strategies
4-45
The manufacturing shortages in Moore County range from 173 to 2,067 acre-feet per year over the planning period. These shortages are associated with shortages for the City of Cactus, which will be met through the City of Cactus’ water management strategies. The City of Cactus is a wholesale water provider and water management strategies for this entity are discussed in Section 4.9.4. 4.5.3 Potter County Manufacturing Location Projected Shortage County: Potter 2,529 acre-feet per year River Basin: Canadian and Red The current supplies for manufacturing in Potter County include self supplied Ogallala water and water purchased from Amarillo. Much of the water for manufacturing is currently supplied by the City of Amarillo via contracts to Tyson and ASARCO, Inc. Approximately 2,500 acre-feet per year of additional water supplies are expected to be needed by 2060. The recommended strategies include additional water from Amarillo as Amarillo develops additional supplies. The strategies for Amarillo are discussed in Section 4.9.2. 4.6 Steam Electric Power Shortages There is one shortage identified for steam electric power in Moore County (less than 200 af/y). In Moore County, water from the Ogallala aquifer is used for steam electric power demands. The steam electric need begins in 2010 and is the result of competition for this supply with other users. The recommended strategy to meet the shortages is to develop additional supply from the Ogallala aquifer in Moore County with additional wells. 4.6.1 Moore County Steam Electric Power Location Projected Shortage County: Moore 154 acre-feet per year River Basin: Canadian Recommended Strategy
- Develop new groundwater from the Ogallala aquifer with new wells
Recommended Water Conservation Strategies The projected demands for steam electric power included water conservation when the demands were developed. Thus, no additional water conservation is recommended.

Chapter 4 March September 1, 2010 Evaluation of Water Management Strategies
4-46
Strategy Description The steam electric power shortages in Moore County will be met with additional water from the Ogallala aquifer in Moore County. Time Intended to Complete The recommended water management strategy should be implemented by 2010 to meet the expected shortage. Quantity, Reliability and Cost The quantity of water should be sufficient. Reliability would be moderate, depending on other Ogallala water users. The capital cost for additional wells is $1.85 million. Environmental Issues No significant environmental impact is expected for the recommended strategy. Once the specific locations of additional wells and alignments associated with infrastructure are identified, a detailed evaluation to determine environmental impacts, if any, will need to be performed. Impact on Water Resources and Other Management Strategies There should be no impacts to water resources or other management strategies. Impact on Agriculture and Natural Resources This strategy may reduce the irrigated acreage for farming if additional water rights acreage is purchased. This acreage could be used for dry land farming if needed, but may require crop changes. Other Relevant Factors Other relevant factors that may affect the development of water rights include North Plains GCD rules affecting production limitations and property line setback requirements for locating wells. Interbasin Transfer The recommended strategy does not require an interbasin transfer permit. Social and Economic Impacts No negative social and economic impacts are expected from the implementation of this strategy. Impacts on Water Rights, Contracts, and Option Agreements The recommended strategy is not expected to have any impacts on water rights, contracts, or option agreements. Impact on Navigation The recommended strategy will have no impact on the navigable waters of the United States.
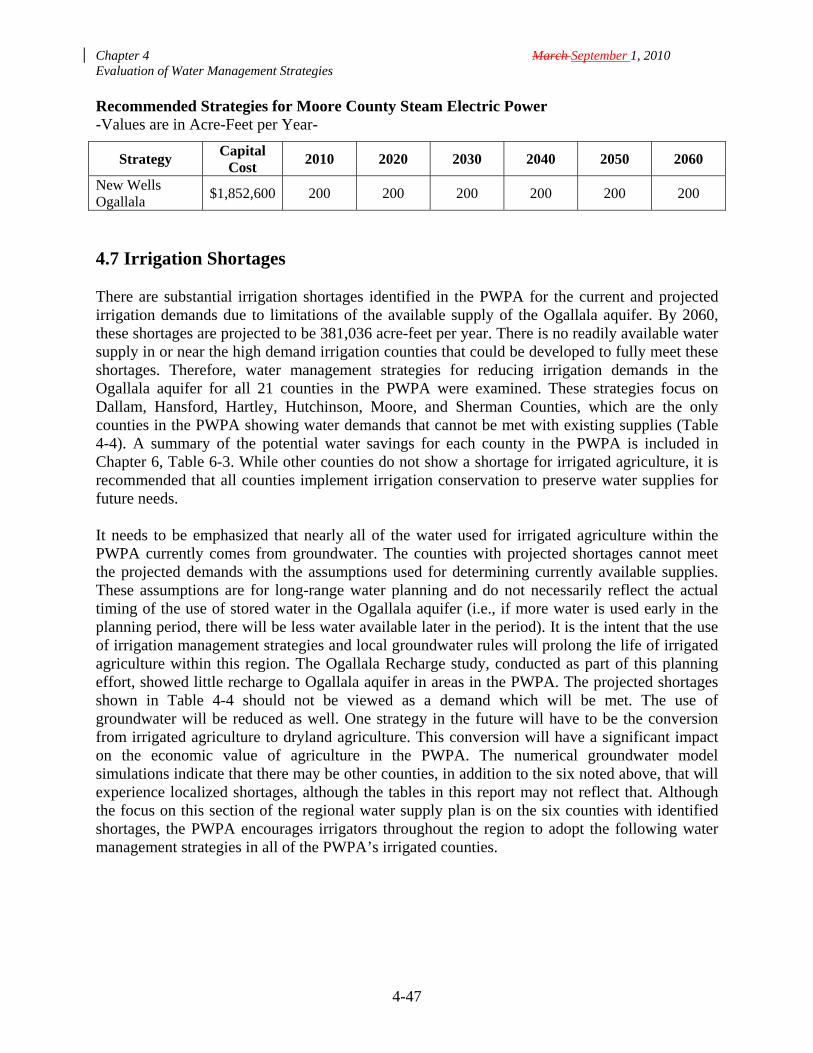
Chapter 4 March September 1, 2010 Evaluation of Water Management Strategies
4-47
Recommended Strategies for Moore County Steam Electric Power -Values are in Acre-Feet per Year-
Strategy Capital
Cost 2010 2020 2030 2040 2050 2060
New Wells Ogallala
$1,852,600 200 200 200 200 200 200
4.7 Irrigation Shortages There are substantial irrigation shortages identified in the PWPA for the current and projected irrigation demands due to limitations of the available supply of the Ogallala aquifer. By 2060, these shortages are projected to be 381,036 acre-feet per year. There is no readily available water supply in or near the high demand irrigation counties that could be developed to fully meet these shortages. Therefore, water management strategies for reducing irrigation demands in the Ogallala aquifer for all 21 counties in the PWPA were examined. These strategies focus on Dallam, Hansford, Hartley, Hutchinson, Moore, and Sherman Counties, which are the only counties in the PWPA showing water demands that cannot be met with existing supplies (Table 4-4). A summary of the potential water savings for each county in the PWPA is included in Chapter 6, Table 6-3. While other counties do not show a shortage for irrigated agriculture, it is recommended that all counties implement irrigation conservation to preserve water supplies for future needs. It needs to be emphasized that nearly all of the water used for irrigated agriculture within the PWPA currently comes from groundwater. The counties with projected shortages cannot meet the projected demands with the assumptions used for determining currently available supplies. These assumptions are for long-range water planning and do not necessarily reflect the actual timing of the use of stored water in the Ogallala aquifer (i.e., if more water is used early in the planning period, there will be less water available later in the period). It is the intent that the use of irrigation management strategies and local groundwater rules will prolong the life of irrigated agriculture within this region. The Ogallala Recharge study, conducted as part of this planning effort, showed little recharge to Ogallala aquifer in areas in the PWPA. The projected shortages shown in Table 4-4 should not be viewed as a demand which will be met. The use of groundwater will be reduced as well. One strategy in the future will have to be the conversion from irrigated agriculture to dryland agriculture. This conversion will have a significant impact on the economic value of agriculture in the PWPA. The numerical groundwater model simulations indicate that there may be other counties, in addition to the six noted above, that will experience localized shortages, although the tables in this report may not reflect that. Although the focus on this section of the regional water supply plan is on the six counties with identified shortages, the PWPA encourages irrigators throughout the region to adopt the following water management strategies in all of the PWPA’s irrigated counties.

Chapter 4 March September 1, 2010 Evaluation of Water Management Strategies
4-48
Table 4-4: Irrigation Shortages Identified in the PWPA
County Projected Need (acre-feet per year)
2010 2020 2030 2040 2050 2060
Dallam 132,889 140,984 148,630 149,134 133,737 117,396
Hansford 150 1,005 1,484 4,548 3,077 1,640
Hartley 181,732 180,523 183,457 179,983 161,368 142,079
Hutchinson 15,008 12,175 11,652 10,612 7,534 5,455
Moore 52,317 48,090 52,425 54,994 50,321 45,420
Sherman 72,532 69,367 79,690 82,955 77,118 69,190
Total 454,628 452,144 477,338 482,226 433,155 381,180
The following sections present an overview analysis of the agricultural water conservation strategies considered in PWPA. The analysis results are presented on a regional basis and include projected water savings, implementation cost, and the anticipated impact (positive or negative) that each of the strategies will have on the regional economy. Subsequent sections estimate the water savings of each strategy in the counties with projected irrigation deficits. 4.7.1 Overview Analysis of Agricultural Water Conservation Strategies In the first round of planning, the PWPA Agricultural Demands and Projections Committee identified seven potential water management strategies for evaluation to reduce irrigation demand. These strategies included the use of the North Plains Evapotranspiration Network (NPET) to schedule irrigation, changes in crop variety, irrigation equipment efficiency improvements, change in crop type, implementation of conservation tillage methods, precipitation enhancement and conversion of irrigated land to dryland. In the second round of planning, considerable time was spent documenting water savings and levels of implementation of these strategies. For the 2011 regional water plan, the estimated cost of each of these strategies was updated to September 2008 dollars. In addition, their effectiveness with respect to water savings given the changing conditions in the region was re-estimated. Also, the PWPA Agricultural Demands and Projections Committee decided to add the adoption of drought resistant crop varieties that are currently under development with the assistance of biotechnology as a potential strategy. A description of each of these strategies is presented in Section 4.8. It should be noted that the water savings associated with each of the agricultural conservation strategies represent the maximum level of savings associated with the individual strategy and may be mutually exclusive of other strategies. For example, the savings associated with the implementation of irrigation equipment efficiency improvements cannot be applied to irrigated land that is converted to dryland farming. For this plan, seven of the irrigation conservation strategies are recommended in two different tiers. The first tier includes; biotechnology adoption of drought resistant crops, the use of the NPET to schedule irrigation, irrigation equipment efficiency improvements and implementation of conservation tillage methods. The second tier while recommended is considered less desirable because of their anticipated negative impact on the regional economy. The second tier includes: changes in crop variety, changes in crop type and converting irrigated acreage to dryland
Chapter 4 March September 1, 2010 Evaluation of Water Management Strategies
4-49
farming. Precipitation enhancement is considered an alternative strategy for counties not currently implementing this strategy. This is because it cannot be implemented by an individual producer and little participation has been shown in implementing this strategy by water districts in the region with exception of the Panhandle GCD. A list of the potentially feasible irrigation strategies is shown in Table 4-5. A synopsis of the potential water savings associated with all eight strategies is presented in Section 4.8 for each county with an irrigation need.
Table 4-5 List of Potentially Feasible Irrigation Strategies
Tier 1 Strategies: Biotechnology adoption of drought resistant crops NPET to schedule irrigation Irrigation equipment efficiency improvements Conservation tillage methods
Tier 2 Strategies: Changes in crop variety, and Changes in crop type Converting irrigated acreage to dryland farming
Alternate Strategy: Precipitation Enhancement
4.8 Description of Irrigation Strategies Use of North Plains Evapotranspiration Network (NPET) The NPET network offers a uniform and independent source of crop water use for both irrigators and the public. It is comprised of eight meteorological stations in PWPA and used to acquire localized crop weather data. The detailed weather data are then used to compute daily reference evapotranspiration and crop water use. These computed parameters help farmers know exactly when conditions are optimal to plant and irrigate. This information is especially critical when moisture is short, and when well capacity is limited, as producers must carefully schedule the timing of their applications to efficiently use their water resources (Howell et al., 1995). Change in Crop Variety Shifting from long season to short season corn and sorghum varieties is another water savings strategy. Water savings are possible by reducing the length of the growing season. However, lower yields are associated with short season varieties. Previous analysis by the Texas AgriLife staff indicated that other major crop changes resulted in no water savings. (FNI, 2006) Irrigation Equipment Efficiency Improvements Each irrigation system has a different level and range of efficiency and can be dramatically affected by operator management during the growing season. A study by Amosson et al. (2001) estimated conventional furrow, surge flow, mid-elevation spray application (MESA), low elevation spray application (LESA), low elevation precision application (LEPA) and subsurface drip (SD) with application efficiencies of 60 percent, 70 percent, 78 percent, 88 percent, 95 percent and 97 percent, respectively. These application efficiencies are the percentage of
Chapter 4 March September 1, 2010 Evaluation of Water Management Strategies
4-50
irrigation water that is actually used by the crop, while the remainder is lost to runoff, evaporation or deep percolation and the differences were used as the basis of improvement for the strategy. Change in Crop Type Crops such as corn require a large amount of irrigation on the High Plains. By reducing the amount of acreage of high water use crops and shifting them to lower water use crops (cotton), substantial water savings would be generated. Implementation of Conservation Tillage Methods Converting from convention to conservation production practices essentially involves replacing tillage operations with herbicide applications. This conversion strategy generally results in reduced moisture losses, as well as, an improved soil profile. Precipitation Enhancement Precipitation enhancement introduces seeding agents to stimulate clouds to generate more rainfall. This process is also commonly known as cloud seeding or weather modification. The cloud seeding process involves the intentional treatment of individual clouds or storm systems in order to achieve a beneficial effect. The benefits that can be realized from increased rainfall through precipitation enhancement projects include: increased agricultural production, improved economic sustainability and future growth, decreased surface and ground water consumption, increased reservoir levels, increased and higher quality forage for livestock and wildlife, and fire and hail suppression. Conversion from Irrigated to Dryland Reducing the amount of irrigated acreage in PWPA will reduce the amount of water applied to crops in the area. While converting from an irrigated to dryland cropping system may be a viable economic alternative for many PWPA producers, research indicates that only a limited number of dryland crops can be produced profitability in this area. The primary dryland crops are winter wheat, grain sorghum, and upland cotton. Biotechnology Adoption The adoption of drought resistant varieties currently under development was added as a potential conservation strategy in the 2011 planning effort. Based on conversations with conventional breeders and Seed Company personnel utilizing biotechnology to develop drought resistant varieties, the first wave of drought resistant varieties for corn, cotton and soybeans are expected to be released within the next five years followed by a second wave that will improve drought tolerance even more. Industry experts believe the first round of drought resistant varieties could reduce water use 15 percent while the second round could double that impact. It was assumed for modeling purposes that drought resistant varieties for corn, cotton and soybeans would be available by 2020 that reduced water use 15 percent and the adoption rate would be 50 percent. It was further assumed by 2030 that varieties of these crops which reduce water use 30 percent (total) would be available and the adoption rate would be 90 percent. No further improvements were modeled for the remainder of the planning horizon; however, the adoption rate was increased to 100 percent by 2040. The implementation cost of this strategy was assumed to be the additional cost of the drought resistant seed which was estimated at a dollar

Chapter 4 March September 1, 2010 Evaluation of Water Management Strategies
4-51
for every one percent reduction in water use. Therefore, it is assumed a 15 percent reduction in water use is expected to cost $15/acre and a 30 percent reduction will cost $30/acre. It should be noted that similar breeding efforts are currently underway to develop drought resistant varieties for wheat. However, the release of these varieties could be as much as a decade behind the other three crops and an estimate of water savings is unknown at this time. Therefore, wheat was not included in this scenario for this planning session, but will be considered in the 2016 planning process. In the 2001 effort, implementation levels and schedules were developed for seven strategies by the Agricultural Demands Subcommittee of the planning group. During the 2006 round of planning, extensive research on these strategies was conducted resulting in water savings and implementation levels being modified where appropriate. In the 2011 planning cycle, the water savings and implementation level were assumed to the same as identified in the 2006 planning effort for the seven strategies with the exception of precipitation enhancement. The water savings associated with precipitation enhancement was increased from .546 ac-in to one ac-in based on the recommendation of Panhandle GCD personnel who have utilized precipitation enhancement as a strategy in the district for several years. An additional strategy of adopting drought resistant varieties for corn, cotton and soybeans was added. The estimated water savings and implementation schedule used in the 2011 planning effort for each of the strategies is presented in Table 4-6.
Table 4-6: Possible Water Management Strategies for Reducing Irrigation Demands
Water Management Strategy
Annual Regional
Water Savings
(ac-ft/ac/yr)
Assumed Baseline
Use 2010
Goal for Adoption
2020
Goal for Adoption
2030
Goal for Adoption
2040
Goal for Adoption
2050
Goal for Adoption
2060
Use of NPET 0.083 20% 27.5% 35% 42.5% 50% 50%
Change in Crop Variety
0.341-corn and 0.054-sorghum
40% 70% 70% 70% 70% 70%
Irrigation Equipment Changes
0.525 80% 85% 90% 95% 95% 95%
Change in Crop Type 0.692 20% 40% 40% 40% 40% 40%
Convert Irrigated Land to Dryland
0.892 5% 10% 15% 15% 15% 15%
Implement Conservation Tillage Methods
0.146 60% 70% 70% 70% 70% 70%
Precipitation Enhancement
0.083 0% 100% 100% 100% 100% 100%
Biotechnology Adoption
15 – 30% corn, cotton & soybeans
0% 50% 90% 100% 100% 100%

Chapter 4 March September 1, 2010 Evaluation of Water Management Strategies
4-52
4.8.1 Methodology Water savings, implementation cost and direction of impact in gross crop receipts were estimated for each proposed water management strategy identified in the planning effort and described in Section 4.8. The year 2010 was selected as the baseline for evaluating strategies. The proposed 2010 adoption rates from the 2006 plan from the seven previously identified water management strategies were assumed to have occurred. All strategies were evaluated over a 50-year planning horizon (2010 – 2060) using a three-year average (2006 – 2008) of Farm Service Agency (FSA) irrigated acreage for the region as the base. The three-year average of irrigated acreage was used to dampen distortions resulting from acreage shifts between crops caused by volatile crop prices. Water availability was assumed to remain constant in measuring the impacts of the various water conservation strategies. Implementation costs were defined as the direct costs associated with implementing a strategy whether these costs would be borne by producers and/or the government. All costs were evaluated in September 2008 dollars. The impact on the regional economy estimated via the change in gross receipts was not estimated. However, the anticipated direction of gross receipts from implementing a strategy was identified. 4.8.2 Results Cumulative water savings, implementation cost and the anticipated direction of regional impacts for each of the water conservation strategies are presented in Table 4-7. Biotechnology Adoption (drought resistant varieties) was estimated to generate by far the largest amount of water savings, 10.6 million ac-ft, which was 14.7 percent of the total irrigation water pumped over the 50-year planning horizon. Implementing this strategy was expected to cost $75.8 million resulting in an average cost of $7.13 per ac-ft of water saved. The precipitation enhancement strategy was projected to save 4.8 million ac-ft under the assumption that increased rainfall would result in a one acre-inch reduction in pumping. The estimated implementation cost associated with this strategy was $29 million resulting in a cost of $6.01 per ac-ft of water saved. This strategy should yield a positive impact to gross receipts in the region, since additional rainfall will occur not only on irrigated land but on dryland and pasture operations increasing their productivity. It should be noted, that unlike the other strategies considered, this is not a strategy a producer can individually adopt. Currently, only the Panhandle GCD practices precipitation enhancement in PWPA, and there are no indications that any other areas of the region plan to incorporate this strategy. Additional conversion of non-efficient irrigation delivery systems in the region, such as, furrow and MESA to more efficient systems (LESA, LEPA or subsurface drip irrigation) resulted in a savings of 4.0 million ac-ft (5.5% of total irrigation water pumped). Investment in these more efficient systems and reinvestment as they wore out resulted in an implementation cost of $217 million. This translates into a cost of $54.89 per ac-ft of water saved, by far the most expensive of the strategies considered from an implementation cost standpoint. However, this strategy was not expected to have any adverse effects on gross receipts while reducing pumping cost, thus, having a slightly positive impact on the regional economy.

Chapter 4 March September 1, 2010 Evaluation of Water Management Strategies
4-53
Table 4-7: Estimated Total Water Savings and Costs Associated with Proposed Water Conservation Strategies in PWPA
Water Management
Strategy
Cumulative Water
Savings (WS)
WS/Total Irrigation Demand
Implementation Cost (IC)
IC/WS
Direct Regional Impact (DRI)1
DRI/WS
ac-ft % $1,000 $/ac-ft $1,000 $/ac-ft Use of NPET 1,012,894 1.40 9,000 $8.89 + + Change in Crop Variety
2,265,030 3.14 - - - -
Irrigation Equipment Changes
3,966,151 5.49 216,907 $54.69 + +
Change in Crop Type
3,312,507 4.59 114,885 $34.68 - -
Conservation Tillage Methods
848,437 1.18 -6,956 -$8.20 + +
Precipitation Enhancement
4,823,304 6.68 28,994 $6.01 + +
Irrigated to Dryland Farming
2,522,546 3.49 75,412 $29.90 - -
Biotechnology Adoption
10,635,558 14.73 75,816 $7.13 + + 1 +indicates an anticipated positive impact that was not quantified.
The change in crop type was estimated to generate 3.3 million ac-ft of water savings, which was 4.6 percent of the total irrigation water pumped over the 60-year planning horizon. Implementing this strategy was expected to cost $114.9 million resulting in an average cost of $34.68 per ac-ft of water saved. However, achieving these water savings came at an additional cost. The move to lower productive crops resulted in a loss in gross crop receipts resulting in a negative impact on the regional economy. Converting marginally irrigated land to dryland production yielded water savings of 2.5 million ac-ft or 3.5 percent of the total pumped. The estimated change in land values resulted in an implementation cost of $75.4 million and a resultant cost of $29.90 per ac-ft of water saved. The loss in gross receipts because of the lost production is estimated to have a negative impact on the regional economy. The change to shorter season corn and sorghum varieties yielded the sixth largest water savings of 2.3 million ac-ft or 3.1 percent of the total pumped. It was not anticipated that changing crop variety would result in increased cost. However, changing crop variety led to a reduction in yields that resulted in a loss in gross cash receipts, thus having an anticipated negative impact on the regional economy. Increased use of the NPET to improve the efficiency of irrigation scheduling was estimated to save 1.0 million ac-ft or approximately 1.4 percent of total water pumped. Implementation costs were estimated at $9.0 million resulting in the third lowest cost per ac-ft of water saved, $8.89. It should be noted that the water savings assumed a one acre-inch savings which may or may not

Chapter 4 March September 1, 2010 Evaluation of Water Management Strategies
4-54
be accurate for the region. Results of a very limited, previous survey of NPET users indicated that just as many producers increased pumping from use of the NPET (increased irrigated acreage) as decreased water usage. A study of the California ET network (CIMIS) yielded a significant increase in returns from a combination of water savings and yield increases, but the amount of water savings achieved was omitted from the study report. Increasing the level of conservation tillage practices yielded water savings of 0.8 million ac-ft or 1.2 percent of total irrigation water pumped. The change in relative cost of fuel and chemicals over the last five years has resulted in the implementation of increased conservation tillage reducing costs to an estimated $7.0 million resulting in a negative cost per acre-foot of water saved (-$8.20). The resultant cost savings from increasing conservation tillage acreage was assumed to have a positive impact on the regional economy. 4.8.3 Dallam County: Irrigation Shortages and Water Savings from Conservation
Strategies It is projected that Dallam County will have an irrigation shortage of 132,889 ac-ft in 2010 (Table 4-7). This annual shortfall is expected to increase to 149,134 ac-ft in 2040 before falling to 117,396 ac-ft by 2060. The evaluation of the conservation strategies showed that Biotechnology Adoption is the most effective water saving strategy when fully implemented in Dallam County, reducing annual use by 57,968 ac-ft. The effectiveness of the remaining strategies once fully implemented rank as follows: Precipitation Enhancement (18,625 ac-ft), Improvement in Irrigation Equipment (17,673 ac-ft), Change in Crop Type (17,172 ac-ft), Change in Crop Variety (12,813 ac-ft), Conversion to Dryland (8,468 ac-ft), Irrigation Scheduling (5,588 ac-ft) and Conservation Tillage (3,276 ac-ft). It is projected that implementing all strategies would result in a surplus (24,186 ac-ft) by 2060. However, implementation of certain strategies can diminish the effectiveness of others if they are also implemented. Also, Precipitation Enhancement is currently not practiced in Dallam County. Therefore, it is unlikely that the full potential water savings would be realized unless there were changes to the implementation rates and schedules or other strategies implemented.
Table 4-8: Dallam County Projected Annual Irrigation Shortage and Water Savings by Strategy (acre-ft/year), 2010-2060.
2010 2020 2030 2040 2050 2060 Projected Shortage -132,889 -140,984 -148,630 -149,134 -133,737 -117,396 Projected Water Savings
Water S
aving
Strategies
Change in Crop Type 0 17,172 17,172 17,172 17,172 17,172 Change in Crop Variety 0 12,813 12,813 12,813 12,813 12,813 Conservation Tillage 0 3,276 3,276 3,276 3,276 3,276 Convert to Dry 0 4,234 8,468 8,468 8,468 8,468 Irrigation Equipment 0 5,891 11,782 17,673 17,673 17,673 NPET Network 0 1,397 2,794 4,191 5,588 5,588 Precipitation Enhancement 0 18,625 18,625 18,625 18,625 18,625
Biotechnology Adoption 0 14,492 52,171 57,968 57,968 57,968
Total Potential Water Savings 0-
132,889 77,90077
,900 127,1011
27,101 140,1861
40,186 141,5831
41,582 141,5831
41,582 Water Surplus / Deficit -132,889- -63,084- -21,529- -8,948- 7,8467,8 24,18724
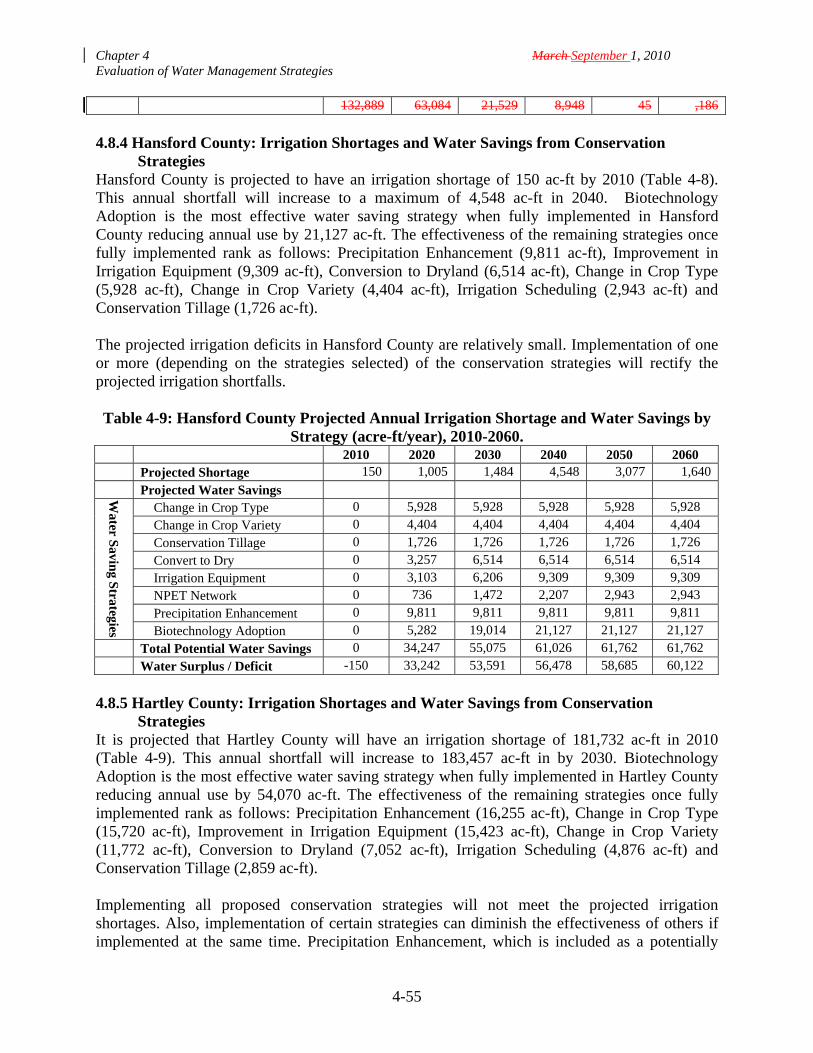
Chapter 4 March September 1, 2010 Evaluation of Water Management Strategies
4-55
132,889 63,084 21,529 8,948 45 ,186
4.8.4 Hansford County: Irrigation Shortages and Water Savings from Conservation
Strategies Hansford County is projected to have an irrigation shortage of 150 ac-ft by 2010 (Table 4-8). This annual shortfall will increase to a maximum of 4,548 ac-ft in 2040. Biotechnology Adoption is the most effective water saving strategy when fully implemented in Hansford County reducing annual use by 21,127 ac-ft. The effectiveness of the remaining strategies once fully implemented rank as follows: Precipitation Enhancement (9,811 ac-ft), Improvement in Irrigation Equipment (9,309 ac-ft), Conversion to Dryland (6,514 ac-ft), Change in Crop Type (5,928 ac-ft), Change in Crop Variety (4,404 ac-ft), Irrigation Scheduling (2,943 ac-ft) and Conservation Tillage (1,726 ac-ft). The projected irrigation deficits in Hansford County are relatively small. Implementation of one or more (depending on the strategies selected) of the conservation strategies will rectify the projected irrigation shortfalls. Table 4-9: Hansford County Projected Annual Irrigation Shortage and Water Savings by
Strategy (acre-ft/year), 2010-2060.
4.8.5 Hartley County: Irrigation Shortages and Water Savings from Conservation
Strategies It is projected that Hartley County will have an irrigation shortage of 181,732 ac-ft in 2010 (Table 4-9). This annual shortfall will increase to 183,457 ac-ft in by 2030. Biotechnology Adoption is the most effective water saving strategy when fully implemented in Hartley County reducing annual use by 54,070 ac-ft. The effectiveness of the remaining strategies once fully implemented rank as follows: Precipitation Enhancement (16,255 ac-ft), Change in Crop Type (15,720 ac-ft), Improvement in Irrigation Equipment (15,423 ac-ft), Change in Crop Variety (11,772 ac-ft), Conversion to Dryland (7,052 ac-ft), Irrigation Scheduling (4,876 ac-ft) and Conservation Tillage (2,859 ac-ft). Implementing all proposed conservation strategies will not meet the projected irrigation shortages. Also, implementation of certain strategies can diminish the effectiveness of others if implemented at the same time. Precipitation Enhancement, which is included as a potentially
2010 2020 2030 2040 2050 2060 Projected Shortage 150 1,005 1,484 4,548 3,077 1,640 Projected Water Savings W
ater Savin
g Strategies
Change in Crop Type 0 5,928 5,928 5,928 5,928 5,928 Change in Crop Variety 0 4,404 4,404 4,404 4,404 4,404 Conservation Tillage 0 1,726 1,726 1,726 1,726 1,726 Convert to Dry 0 3,257 6,514 6,514 6,514 6,514 Irrigation Equipment 0 3,103 6,206 9,309 9,309 9,309 NPET Network 0 736 1,472 2,207 2,943 2,943
Precipitation Enhancement 0 9,811 9,811 9,811 9,811 9,811 Biotechnology Adoption 0 5,282 19,014 21,127 21,127 21,127
Total Potential Water Savings 0 34,247 55,075 61,026 61,762 61,762
Water Surplus / Deficit -150 33,242 53,591 56,478 58,685 60,122

Chapter 4 March September 1, 2010 Evaluation of Water Management Strategies
4-56
feasible strategy, is currently not practiced in Hartley County and is considered an alternate strategy for planning purposes. To fully meet the projected irrigation needs, improvements in the implementation level and/or schedule of the current strategies would be required and additional strategies would likely be needed to enhance water conservation.
Table 4-10: Hartley County Projected Annual Irrigation Shortage and Water Savings by Strategy (acre-ft/year), 2010-2060.
2010 2020 2030 2040 2050 2060 Projected Shortage -181,732 -180,523 -183,457 -179,983 -161,368 -142,079 Projected Water Savings W
ater Savin
g Strategies
Change in Crop Type 0 15,720 15,720 15,720 15,720 15,720 Change in Crop Variety 0 11,772 11,772 11,772 11,772 11,772 Conservation Tillage 0 2,859 2,859 2,859 2,859 2,859 Convert to Dry 0 3,526 7,052 7,052 7,052 7,052 Irrigation Equipment 0 5,141 10,282 15,423 15,423 15,423 NPET Network 0 1,219 2,438 3,657 4,876 4,876 Precipitation Enhancement 0 16,255 16,255 16,255 16,255 16,255 Biotechnology Adoption 0 13,518 48,663 54,070 54,070 54,070
Total Potential Water Savings 00 70,01070
,010 115,041115,042
126,808126,809
128,027128,028
128,027128,028
Water Surplus / Deficit -
181,732-181,732
-110,513-110,513
-68,416-68,415
-53,175-53,174
-33,341-33,340
-14,052-14,051
4.8.6 Hutchinson County: Irrigation Shortages and Water Savings from Conservation
Strategies It is projected that Hutchinson County will have an irrigation shortage of 15,008 ac-ft in 2010 (Table 4-10). This annual shortfall is projected to still exist but is expected to fall to 5,455 ac-ft in 2060. Biotechnology Adoption is the most effective water saving strategy when fully implemented in Hutchinson County reducing annual use by 7,007 ac-ft. The effectiveness of the remaining strategies once fully implemented rank as follows: Precipitation Enhancement (2,965 ac-ft), Improvement in Irrigation Equipment (2,814 ac-ft), Change in Crop Type (1,863 ac-ft), Conversion to Dryland (1,631 ac-ft), Change in Crop Variety (1,401 ac-ft), Irrigation Scheduling (890 ac-ft) and Conservation Tillage (522 ac-ft). It will be difficult to meet projected irrigation shortages in the short term with the current water conservation strategies identified. However, projected irrigation shortfalls are expected to decline in later years. Therefore, in the later years (2030 – 2060), implementing a combination of selected strategies should be adequate to meet projected irrigation shortfalls.

Chapter 4 March September 1, 2010 Evaluation of Water Management Strategies
4-57
Table 4-11: Hutchinson County Projected Annual Irrigation Shortage and Water Savings by Strategy (acre-ft/year), 2010-2060.
4.8.7 Moore County: Irrigation Shortages and Water Savings from Conservation Strategies It is projected that Moore County will have an irrigation shortage of 52,317 ac-ft in 2010 (Table 4-11). This annual shortfall will increase to 54,494 ac-ft in 2040 before decreasing to 45,420 in 2060. Biotechnology Adoption is the most effective water saving strategy when fully implemented in Moore County reducing annual use by 30,699 ac-ft. The effectiveness of the remaining strategies once fully implemented rank as follows: Precipitation Enhancement (11,348 ac-ft), Improvement in Irrigation Equipment (10,767 ac-ft), Change in Crop Type (7,852 ac-ft), Conversion to Dryland (6,977 ac-ft), Change in Crop Variety (6,151 ac-ft), Irrigation Scheduling (3,404 ac-ft) and Conservation Tillage (1,996 ac-ft). Implementing all the strategies identified would not completely meet the projected irrigation deficits in the early decades. Considering the decreased effectiveness with respect to water savings of certain combinations of strategies and no current sponsor for Precipitation Enhancement in Moore County, it is uncertain whether deficits in later decades could be met with the identified conservation strategies. Improvements to implementation rates and/or additional strategies to enhance water conservation would need to be developed.
Table 4-12: Moore County Projected Annual Irrigation Shortage and Water Savings by Strategy (acre-ft/year), 2010-2060.
2010 2020 2030 2040 2050 2060 Projected Shortage -52,317 -48,090 -52,425 -54,994 -50,321 -45,420 Projected Water Savings W
ater Savin
g Strategies
Change in Crop Type 0 7,852 7,852 7,852 7,852 7,852 Change in Crop Variety 0 6,151 6,151 6,151 6,151 6,151 Conservation Tillage 0 1,996 1,996 1,996 1,996 1,996 Convert to Dry 0 3,488 6,977 6,977 6,977 6,977 Irrigation Equipment 0 3,589 7,178 10,767 10,767 10,767 NPET Network 0 851 1,702 2,553 3,404 3,404 Precipitation Enhancement 0 11,348 11,348 11,348 11,348 11,348 Biotechnology Adoption 0 7,675 27,629 30,699 30,699 30,699
2010 2020 2030 2040 2050 2060 Projected Shortage -15,008 -12,175 -11,652 -10,612 -7,534 -5,455 Projected Water Savings W
ater Savin
g Strategies
Change in Crop Type 0 1,863 1,863 1,863 1,863 1,863 Change in Crop Variety 0 1,401 1,401 1,401 1,401 1,401 Conservation Tillage 0 522 522 522 522 522 Convert to Dry 0 816 1,631 1,631 1,631 1,631 Irrigation Equipment 0 938 1,876 2,814 2,814 2,814 NPET Network 0 222 445 667 890 890 Precipitation Enhancement 0 2,965 2,965 2,965 2,965 2,965 Biotechnology Adoption 0 1,752 6,306 7,007 7,007 7,007
Total Potential Water Savings 00 10,47910
,478 17,00917
,009 18,87018
,870 19,09319
,092 19,09319
,092
Water Surplus / Deficit -15,008-15,008
-1,696-1,697
5,3575,357
8,2588,258
11,55911,558
13,63813,637

Chapter 4 March September 1, 2010 Evaluation of Water Management Strategies
4-58
Total Potential Water Savings 0 42,950 70,343 78,343 79,194 79,194
Water Surplus / Deficit -52,317 -5,140 18,408 23,349 28,873 33,774
4.8.8 Sherman County: Irrigation Shortages and Water Savings from Conservation
Strategies It is projected that Sherman County will have an irrigation shortage of 72,532 ac-ft in 2010 (Table 4-12). This annual shortfall will increase to 82,955 ac-ft in 2040 before decreasing to 69,190 ac-ft in 2060. Biotechnology Adoption is the most effective water saving strategy when fully implemented in Sherman County reducing annual use by 40,022 ac-ft. The effectiveness of the remaining strategies once fully implemented rank as follows: Precipitation Enhancement (14,566 ac-ft), Improvement in Irrigation Equipment (13,821 ac-ft), Change in Crop Type (10,580 ac-ft), Conversion to Dryland (8,521 ac-ft), Change in Crop Variety (8,020 ac-ft), Irrigation Scheduling (4,370 ac-ft) and Conservation Tillage (2,562 ac-ft). Implementing all the strategies identified would not completely cover the projected irrigation deficits in the early decades. Considering the decreased effectiveness with respect to water savings of certain combinations of strategies and no current sponsor for Precipitation Enhancement in Sherman County, it is uncertain whether deficits in later decades could be met with the identified conservation strategies. Therefore, an improvement in the implementation level and/or schedule of the current strategies especially in the early decades would be required to fully meet the irrigation needs and probably additional strategies to enhance water conservation would need to be developed.
Table 4-13: Sherman County Projected Annual Irrigation Shortage and Water Savings by
Strategy (acre-ft/year), 2010-2060. 2010 2020 2030 2040 2050 2060 Projected Shortage -72,532 -69,367 -79,690 -82,955 -77,118 -69,190 Projected Water Savings
Water S
aving
Strategies
Change in Crop Type 0 10,580 10,580 10,580 10,580 10,580 Change in Crop Variety 0 8,020 8,020 8,020 8,020 8,020 Conservation Tillage 0 2,562 2,562 2,562 2,562 2,562 Convert to Dry 0 4,261 8,521 8,521 8,521 8,521 Irrigation Equipment 0 4,607 9,214 13,821 13,821 13,821 NPET Network 0 1,092 2,185 3,277 4,370 4,370 Precipitation Enhancement 0 14,566 14,566 14,566 14,566 14,566 Biotechnology Adoption 0 10,006 36,020 40,022 40,022 40,022
Total Potential Water Savings 0 55,693 91,668 101,369 102,462 102,462
Water Surplus / Deficit -72,126 -13,674 11,978 18,414 25,344 33,272
4.8.9 Summary of Irrigation Conservation Strategies Prioritizing and implementing the eight irrigation conservation strategies will depend on the individual irrigator and regional support of the strategy. The one strategy that yields the largest water savings is the adoption of drought resistant varieties of corn, cotton and soybeans which are being developed with the aid of biotechnology. It is estimated to have the potential to save 10.6 million ac-ft (cumulative savings), which was 14.7 percent of the total irrigation water pumped over the 50-year planning horizon significantly more than the other strategies evaluated. The cumulative effectiveness of the remaining strategies in millions of ac-ft ranked as follows:

Chapter 4 March September 1, 2010 Evaluation of Water Management Strategies
4-59
Precipitation Enhancement (4.8), Improvement in Irrigation Equipment (4.0), Change in Crop Type (3.3), Conversion to Dryland (2.5), Change in Crop Variety (2.3), Irrigation Scheduling (1.0) and Conservation Tillage (0.8). The estimated cost of implementing the various strategies as expressed in $/ac-ft of water savings varied considerably. The cost of implementing conservation tillage actually was projected to be negative suggesting that producers would save money by implementing conservation tillage techniques (-$8.20). In the 2006 water plan, this strategy had a relatively small cost to implementation but the relative change in fuel and chemical costs resulted in the cost of implementation becoming negative. Change in Crop Variety, Precipitation Enhancement, Biotechnology Adoption and Irrigation Scheduling are the next four most cost effective strategies at $0.00, $6.01, $7.13 and $8.89 per ac-ft, respectively. The remaining strategies which include Conversion to Dryland, Change in Crop Type and Improvement in Irrigation Equipment have implementation costs estimated at $29.90, $34.68 and $54.69 per ac-ft, respectively. Water conservation strategies can have significantly different impacts on the regional economy that is often measured by the change in gross receipts or costs. The impact on the regional economy should be a major consideration in prioritizing strategies to be implemented. In this planning effort, no attempt was made to quantify the impacts of individual strategies on the regional economy; however, the anticipated direction of effect(s) was included. Change in crop type, change in crop variety and conversion to dryland are all anticipated to have a negative impact due to the reduction in production. The remaining five conservation strategies are all expected to have a positive impact either due to increased production or a reduction in costs without reducing yields leading to a freeing up of income to be spent in the economy. The counties of Dallam, Hansford, Hartley, Hutchinson, Moore, and Sherman are projected to have irrigation shortfalls. Implementing one or a combination of identified water conservation strategies could readily eliminate projected deficits in Hansford and Hutchinson Counties. Implementing all strategies and development of additional conservation strategies may be necessary in the other four counties particularly in Dallam and Hartley counties to overcome projected irrigation shortfalls. Several caveats to this analysis need to be mentioned. First, the associated water savings with these strategies are “potential” water savings. In the absence of water use constraints, most if not all the strategies considered will simply increase gross receipts. In fact, the improved water use efficiencies generated from some of these strategies may actually increase the depletion rate of the Ogallala aquifer. Second, potential water savings may be overestimated when combinations of strategies are implemented. For example, the savings associated with the implementation of irrigation equipment efficiency improvements cannot be applied to irrigated land that is converted to dryland farming. Finally, precipitation enhancement is not a strategy that a producer can implement. It has to be funded and implemented by a group such as a water district. Currently, only the Panhandle GCD practices precipitation enhancement. At this time, none of the other water districts have any plans to adopt precipitation enhancement; therefore, estimated total water savings may be overestimated depending on location. For this plan, precipitation enhancement is only recommended for counties within the Panhandle GCD. It is an alternate strategy for the other counties in the PWPA.
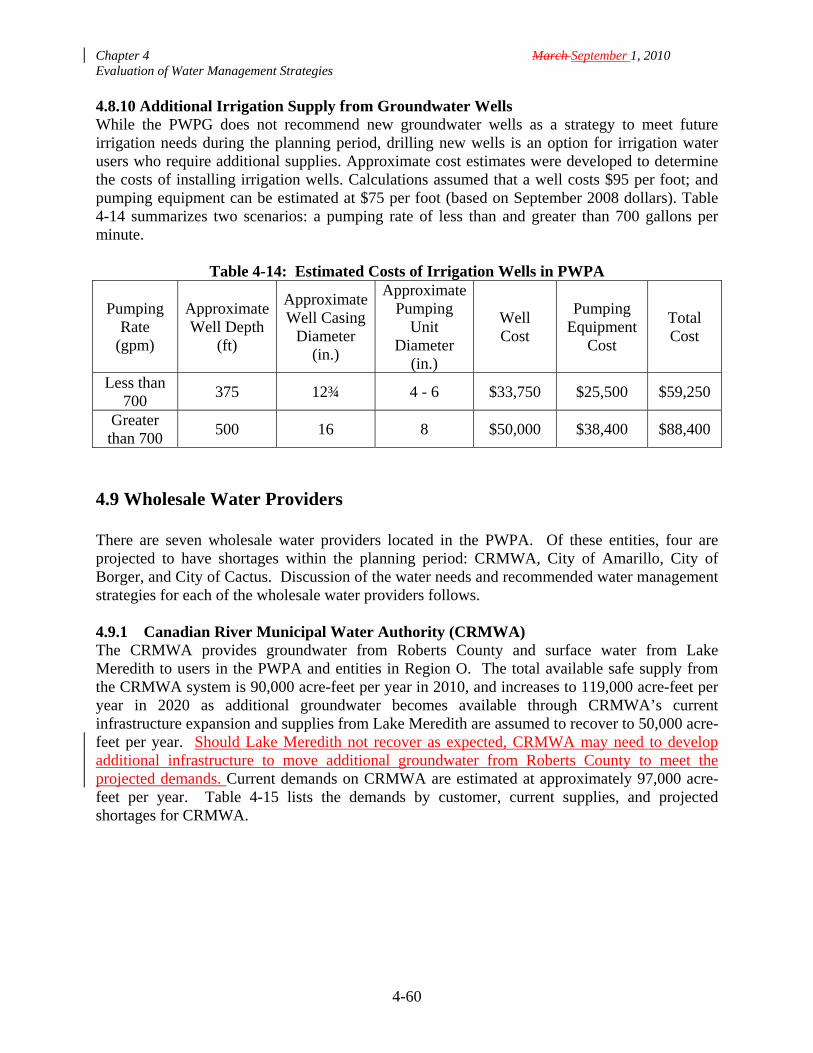
Chapter 4 March September 1, 2010 Evaluation of Water Management Strategies
4-60
4.8.10 Additional Irrigation Supply from Groundwater Wells While the PWPG does not recommend new groundwater wells as a strategy to meet future irrigation needs during the planning period, drilling new wells is an option for irrigation water users who require additional supplies. Approximate cost estimates were developed to determine the costs of installing irrigation wells. Calculations assumed that a well costs $95 per foot; and pumping equipment can be estimated at $75 per foot (based on September 2008 dollars). Table 4-14 summarizes two scenarios: a pumping rate of less than and greater than 700 gallons per minute.
Table 4-14: Estimated Costs of Irrigation Wells in PWPA
Pumping Rate
(gpm)
Approximate Well Depth
(ft)
Approximate Well Casing
Diameter (in.)
Approximate Pumping
Unit Diameter
(in.)
Well Cost
Pumping Equipment
Cost
Total Cost
Less than 700
375 12¾ 4 - 6 $33,750 $25,500 $59,250
Greater than 700
500 16 8 $50,000 $38,400 $88,400
4.9 Wholesale Water Providers There are seven wholesale water providers located in the PWPA. Of these entities, four are projected to have shortages within the planning period: CRMWA, City of Amarillo, City of Borger, and City of Cactus. Discussion of the water needs and recommended water management strategies for each of the wholesale water providers follows. 4.9.1 Canadian River Municipal Water Authority (CRMWA) The CRMWA provides groundwater from Roberts County and surface water from Lake Meredith to users in the PWPA and entities in Region O. The total available safe supply from the CRMWA system is 90,000 acre-feet per year in 2010, and increases to 119,000 acre-feet per year in 2020 as additional groundwater becomes available through CRMWA’s current infrastructure expansion and supplies from Lake Meredith are assumed to recover to 50,000 acre-feet per year. Should Lake Meredith not recover as expected, CRMWA may need to develop additional infrastructure to move additional groundwater from Roberts County to meet the projected demands. Current demands on CRMWA are estimated at approximately 97,000 acre-feet per year. Table 4-15 lists the demands by customer, current supplies, and projected shortages for CRMWA.
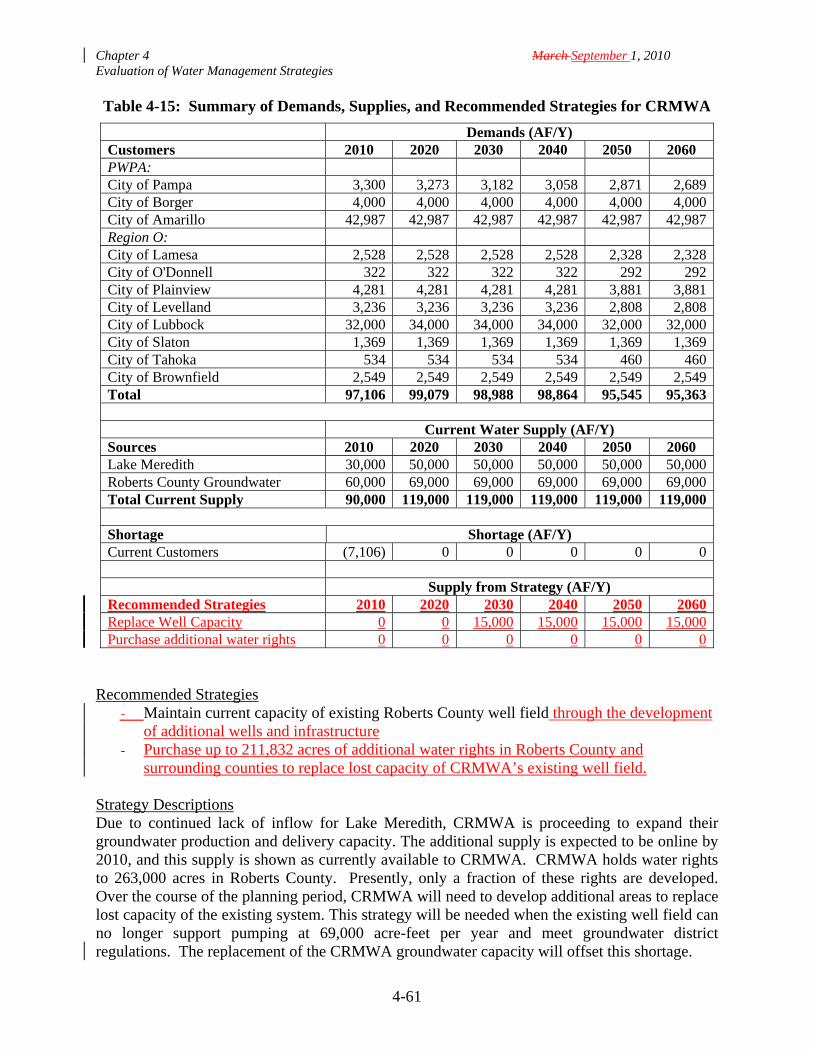
Chapter 4 March September 1, 2010 Evaluation of Water Management Strategies
4-61
Table 4-15: Summary of Demands, Supplies, and Recommended Strategies for CRMWA
Demands (AF/Y) Customers 2010 2020 2030 2040 2050 2060 PWPA: City of Pampa 3,300 3,273 3,182 3,058 2,871 2,689City of Borger 4,000 4,000 4,000 4,000 4,000 4,000City of Amarillo 42,987 42,987 42,987 42,987 42,987 42,987Region O: City of Lamesa 2,528 2,528 2,528 2,528 2,328 2,328City of O'Donnell 322 322 322 322 292 292City of Plainview 4,281 4,281 4,281 4,281 3,881 3,881City of Levelland 3,236 3,236 3,236 3,236 2,808 2,808City of Lubbock 32,000 34,000 34,000 34,000 32,000 32,000City of Slaton 1,369 1,369 1,369 1,369 1,369 1,369City of Tahoka 534 534 534 534 460 460City of Brownfield 2,549 2,549 2,549 2,549 2,549 2,549Total 97,106 99,079 98,988 98,864 95,545 95,363
Current Water Supply (AF/Y) Sources 2010 2020 2030 2040 2050 2060 Lake Meredith 30,000 50,000 50,000 50,000 50,000 50,000Roberts County Groundwater 60,000 69,000 69,000 69,000 69,000 69,000Total Current Supply 90,000 119,000 119,000 119,000 119,000 119,000
Shortage Shortage (AF/Y) Current Customers (7,106) 0 0 0 0 0 Supply from Strategy (AF/Y) Recommended Strategies 2010 2020 2030 2040 2050 2060Replace Well Capacity 0 0 15,000 15,000 15,000 15,000Purchase additional water rights 0 0 0 0 0 0
Recommended Strategies - Maintain current capacity of existing Roberts County well field through the development
of additional wells and infrastructure - Purchase up to 211,832 acres of additional water rights in Roberts County and
surrounding counties to replace lost capacity of CRMWA’s existing well field. Strategy Descriptions Due to continued lack of inflow for Lake Meredith, CRMWA is proceeding to expand their groundwater production and delivery capacity. The additional supply is expected to be online by 2010, and this supply is shown as currently available to CRMWA. CRMWA holds water rights to 263,000 acres in Roberts County. Presently, only a fraction of these rights are developed. Over the course of the planning period, CRMWA will need to develop additional areas to replace lost capacity of the existing system. This strategy will be needed when the existing well field can no longer support pumping at 69,000 acre-feet per year and meet groundwater district regulations. The replacement of the CRMWA groundwater capacity will offset this shortage.

Chapter 4 March September 1, 2010 Evaluation of Water Management Strategies
4-62
If storage in Lake Meredith continues to decline, CRMWA may need to develop additional groundwater supplies beyond the system’s current capacity. To support greater demands on the Roberts County well field, CRMWA would purchase up to 211,832 acres of additional water rights in the four-county area, including Roberts, Ochiltree, Lipscomb and Hemphill counties. Time Intended to Complete Maintenance of the existing well field will be ongoing. However, additional wells may need to be drilled by 2030 to maintain the current supply. The purchase of water rights would be on-going, pending agreements with willing sellers. Quantity, Reliability and Cost The quantity of water should be sufficient to meet the projected needs of CRMWA’s customers. Depending on the future reliability of Lake Meredith, additional groundwater supplies beyond the total amount of 69,000 acre-feet per year from Roberts County may be needed to meet future demands. Any water management strategy will need to acquire an adequate quantity of groundwater water rights while complying with all applicable groundwater conservation district rules. Reliability of Ogallala supplies is moderate to high. There are significant quantities of untapped water supplies in Roberts County, but the availability of this water also depends on other water users. Costs to maintain the capacity of the existing Roberts County well field is estimated at $21.8 million. The cost to purchase the additional water rights is estimated at $88.2 million. Environmental Issues The environmental issues associated with this water management strategy are for pipeline rights-of-way and sites for pumping plants and storage facilities. Since routes and sites can be selected to avoid sensitive wildlife habitat and cultural resources, there would be very little, if any, environmental issues of significant concern. Impact on Water Resources and Other Management Strategies The increased demands on the Ogallala will continue to deplete the storage in the aquifer. There are other users that may compete for groundwater supplies, but there is sufficient water in Roberts County to support these demands. Impact on Agriculture and Natural Resources The expansion of the Roberts County well field and maintenance of the existing well field are expected to have minimal impacts on the agriculture and other natural resources. A small amount of agricultural lands may be affected by the transmission system associated with the well field, depending on the final transmission route. Other Relevant Factors In the event that Lake Meredith does not recover from the current drought, CRMWA will need to increase its supplies form Roberts County. This may generate the need for additional transmission from Roberts County to near Amarillo. If this is needed, a joint pipeline with Amarillo (as Amarillo develops its Roberts County water rights) should be considered.
Chapter 4 March September 1, 2010 Evaluation of Water Management Strategies
4-63
Interbasin Transfer The recommended strategies do not require interbasin transfer permits. Social and Economic Impacts No negative social and economic impacts are expected from the implementation of these strategies. Impacts on Water Rights, Contracts, and Option Agreements The recommended strategies are not expected to impact water rights, contracts, or option agreements. Impact on Navigation The recommended strategies should have no impact on the navigable waters of the United States. 4.9.2 City of Amarillo The City of Amarillo provides municipal water to city customers in Randall and Potter Counties, the City of Canyon, and Palo Duro State Park. It also provides most of the manufacturing water needs in Potter County with a small amount to manufacturing demands in Randall County. The City also has a contract with Xcel Energy for treated wastewater effluent. Amarillo owns water rights in Randall, Potter, Carson, Deaf Smith, Dallam, Hartley and Roberts County, but only a portion of these groundwater rights are fully developed. In addition, the City has a contract with CRMWA for water from Lake Meredith and Roberts County groundwater. The current delivery capacity for water from CRMWA is 42,987 acre-feet of year of water. The total estimated current supply for the City is 50,198 acre-feet per year of potable water and 19,603 acre-feet of reuse supply. Potable water supplies are projected to increase to 55,035 acre-feet per year after CRMWD completes its Roberts County expansion and then decrease to 49,283 acre-feet per year by 2060. Reuse is expected is increase over time and is supplied to Xcel Energy for steam electric power use. Table 4-16 lists the projected potable demands by customer, the current sources of supply available, and the recommended strategies. The projected shortages are expected to begin in 2030 with a shortfall of 4,852 acre-feet per year and increasing up to 21,597 acre-feet per year by 2060. The recommended water management strategies for Amarillo include completing the development of the Potter County well field and then developing the City’s water rights in Roberts County. For planning purposes, it is assumed that the water rights in Hartley County will be developed after Roberts County. However, the timing of these strategies may change pending other developments. Recommended Strategies - Implement conservation strategies - Develop Potter County Well Field (Ogallala aquifer) - Develop Roberts County Well Field (Ogallala aquifer)
Recommended Conservation Strategies - Implementation of water conservation plan - Water conservation pricing
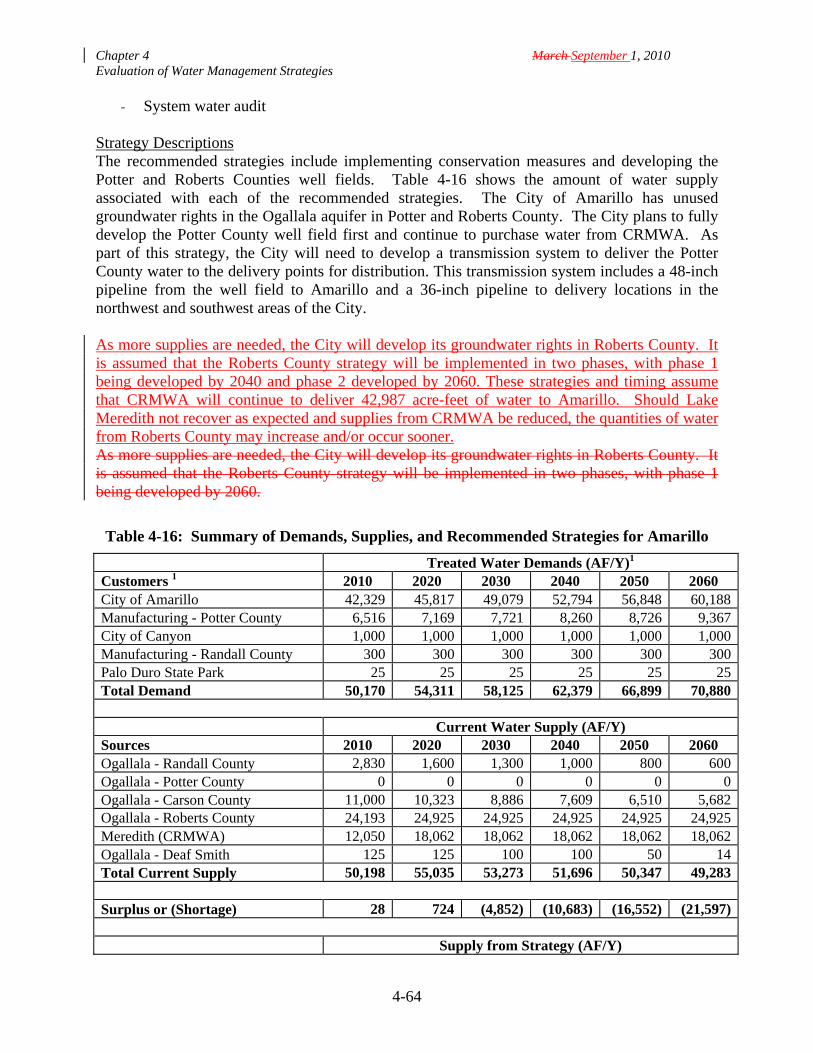
Chapter 4 March September 1, 2010 Evaluation of Water Management Strategies
4-64
- System water audit Strategy Descriptions The recommended strategies include implementing conservation measures and developing the Potter and Roberts Counties well fields. Table 4-16 shows the amount of water supply associated with each of the recommended strategies. The City of Amarillo has unused groundwater rights in the Ogallala aquifer in Potter and Roberts County. The City plans to fully develop the Potter County well field first and continue to purchase water from CRMWA. As part of this strategy, the City will need to develop a transmission system to deliver the Potter County water to the delivery points for distribution. This transmission system includes a 48-inch pipeline from the well field to Amarillo and a 36-inch pipeline to delivery locations in the northwest and southwest areas of the City. As more supplies are needed, the City will develop its groundwater rights in Roberts County. It is assumed that the Roberts County strategy will be implemented in two phases, with phase 1 being developed by 2040 and phase 2 developed by 2060. These strategies and timing assume that CRMWA will continue to deliver 42,987 acre-feet of water to Amarillo. Should Lake Meredith not recover as expected and supplies from CRMWA be reduced, the quantities of water from Roberts County may increase and/or occur sooner. As more supplies are needed, the City will develop its groundwater rights in Roberts County. It is assumed that the Roberts County strategy will be implemented in two phases, with phase 1 being developed by 2060.
Table 4-16: Summary of Demands, Supplies, and Recommended Strategies for Amarillo
Treated Water Demands (AF/Y)1 Customers 1 2010 2020 2030 2040 2050 2060 City of Amarillo 42,329 45,817 49,079 52,794 56,848 60,188Manufacturing - Potter County 6,516 7,169 7,721 8,260 8,726 9,367City of Canyon 1,000 1,000 1,000 1,000 1,000 1,000Manufacturing - Randall County 300 300 300 300 300 300Palo Duro State Park 25 25 25 25 25 25Total Demand 50,170 54,311 58,125 62,379 66,899 70,880
Current Water Supply (AF/Y)
Sources 2010 2020 2030 2040 2050 2060 Ogallala - Randall County 2,830 1,600 1,300 1,000 800 600Ogallala - Potter County 0 0 0 0 0 0Ogallala - Carson County 11,000 10,323 8,886 7,609 6,510 5,682Ogallala - Roberts County 24,193 24,925 24,925 24,925 24,925 24,925Meredith (CRMWA) 12,050 18,062 18,062 18,062 18,062 18,062Ogallala - Deaf Smith 125 125 100 100 50 14Total Current Supply 50,198 55,035 53,273 51,696 50,347 49,283
Surplus or (Shortage) 28 724 (4,852) (10,683) (16,552) (21,597)
Supply from Strategy (AF/Y)

Chapter 4 March September 1, 2010 Evaluation of Water Management Strategies
4-65
Recommended Strategies 2010 2020 2030 2040 2050 2060 Conservation 0 1,375 2,453 2,639 2,841 3,012Potter County Well Field 0 9,46710, 10,2921 11,1821 11,1411 10,8311Roberts County Well Field 0 00 00 11,2100 11,2101 22,4201Total from Strategies 0 10,8421 12,7451 25,0311 25,1922 36,2632
1. Amarillo also provides treated wastewater to Xcel Energy. Time Intended to Complete Water conservation strategies should be in place by 2010 with water savings being noticed in 2020. The Potter County well field should be on-line by 2011. The Roberts County well field will be developed as additional supplies are needed. This is expected to occur by 2050. Quantity, Reliability and Cost The quantity of water should be sufficient. The reliability of conservation is considered moderate because much of the conservation plan must be implemented by the consumers. The conservation measures do not have any capital costs associated with them. Approximately 11,18214,384 acre-feet per year of additional water will be obtained from the Potter County well field and 11,210 acre-feet per year from each phase of the Roberts County well field. Reliability of groundwater in Potter County is moderate to high, depending on competing interests. The capital costs for developing the Potter County well field and transmission system are $128.5 million. In Roberts County, the reliability of Ogallala supplies is moderate to high since there are large quantities of undeveloped supply in this county, though competing interests may be present. The total capital cost for the Roberts County well field is $287.4 million, $143.7 million for each phase.The capital costs for developing the Potter County well field and transmission system are $76.5 million. In Roberts County, the reliability of Ogallala supplies is moderate to high since there are large quantities of undeveloped supply in this county, though competing interests may be present. The total capital cost for the Roberts County well field is $125.7 million. These costs could potentially be less if Amarillo and CRMWA jointly develop additional transmission capacity from Roberts County. Environmental Issues The environmental impacts from conservation and groundwater development are expected to be low. Once the specific locations of additional wells and alignments associated with infrastructure are identified, a detailed evaluation to determine environmental impacts, if any, will need to be performed. Impact on Water Resources and Other Management Strategies Water conservation may impact the amount of water returned to the system that might be available for reuse. The increased demands on the Ogallala will continue to deplete the storage in the aquifer. There are other users that may compete for groundwater supplies, but there is sufficient water in Potters and Roberts Counties to support these demands. Impact on Agriculture and Natural Resources Water conservation and the development of the proposed well fields are expected to have minimal impact on the agriculture and other natural resources. A small amount of agricultural

Chapter 4 March September 1, 2010 Evaluation of Water Management Strategies
4-66
lands may be affected by the transmission system associated with the well field, depending on the final transmission route. Other Relevant Factors There are no other identified relevant factors. Interbasin Transfer The recommended strategies do not require interbasin transfer permits. Social and Economic Impacts No negative social and economic impacts are expected from the implementation of these strategies. Impacts on Water Rights, Contracts, and Option Agreements The recommended strategies are not expected to impact water rights, contracts, or option agreements. Impact on Navigation The recommended strategies should have no impact on the navigable waters of the United States.

Chapter 4 March September 1, 2010 Evaluation of Water Management Strategies
4-67
4.9.3 City of Borger The City of Borger provides water to customers in Hutchinson County, including TCW Supply, Inc. and Hutchinson and Carson County manufacturing. The City receives blended water from CRMWA and operates wells for groundwater from the Ogallala aquifer. The City has a complex arrangement of trading water with several industries to most efficiently supply water to its customers. The City also sells treated wastewater to its manufacturing customers. Table 4-17 lists the projected demands and supplies for the City of Borger and its customers.
Table 4-17: Summary of Demands and Supplies for the City of Borger
Demands (AF/Y)
Customers 2010 2020 2030 2040 2050 2060 Borger 2,352 2,384 2,351 2,274 2,148 2,039Manufacturing 6,360 6,820 7,190 7,550 7,860 8,380County-other 56 57 57 55 52 49
TCW Supply 0 0 0 0 0 0
Total Demand 8,768 9,261 9,598 9,879 10,060 10,468
Current Water Supply (AF/Y)
Sources 2010 2020 2030 2040 2050 2060
Ogallala - Hutchinson Co. 4,500 3,825 3,251 2,764 2,349 1,997
Ogallala - Carson Co. 450 450 450 450 450 450
Reuse 1,045 1,045 1,045 1,045 1,045 1,045
Lake Meredith (CRMWA) 1,144 1,681 1,681 1,681 1,681 1,681Ogallala - Roberts Co. 2,282 3,829 3,829 3,829 3,829 3,829Total Current Supply 9,418 10,830 10,256 9,769 9,354 9,002
Surplus or (Shortage) 650 1,569 658 -110 -706 -1,466Recommended Strategies:
Conservation 0 24 71 114 107 102Additional Ogallala – Hutchinson Co.
0 0 1,000 21,000 2,000 2,000
Total from Strategies 0 24 1,071 21,114 2,107 2,102 Recommended Strategies - Implement conservation strategies - Purchase additional water from CRMWA - Develop additional groundwater (Ogallala aquifer)
Recommended Conservation Strategies - Implementation of water conservation plan - Water conservation pricing - System water audit
Chapter 4 March September 1, 2010 Evaluation of Water Management Strategies
4-68
Strategy Descriptions The recommended strategies include implementing conservation measures, purchasing additional water from CRMWA and developing additional groundwater from the Ogallala in Hutchinson County. Table 4-17 shows the amount of water supply associated with each of the recommended strategies. The yield of the City of Borger’s well field is expected to decline over time. It is anticipated that Borger will continue to operate groundwater system at levels similar to current pumpage. To do this, the City will need to install additional wells. To provide for additional manufacturing demands, the City of Borger can purchase additional water from CRMWA. For planning purposes, it is assumed that additional infrastructure will be needed; however, pending the additional purchase amount, there may be sufficient capacity in the existing infrastructure. Time Intended to Complete Water conservation strategies should be in place by 2010 with water savings being noticed in 2020. The Hutchinson County well field expansion should begin by 2030. Additional supply from CRMWA will be developed as needed. This is expected to occur by 2050. Quantity, Reliability and Cost The quantity of water should be sufficient. The reliability of conservation is considered moderate because much of the conservation plan must be implemented by the consumers. The conservation measures do not have any capital costs associated with them. Approximately 2,000 acre-feet per year of additional water will be obtained from the Hutchinson County well field and 1,000 acre-feet per year from CRMWA. Reliability of groundwater in Hutchinson County is moderate to high, depending on location and competing interests. The capital costs for expanding the Hutchinson County well field are $9.4 million. The capital costs for additional water from CRMWA are estimated at 4.4 million. Environmental Issues The environmental impacts from conservation and groundwater development are expected to be low. Once the specific locations of additional wells and alignments associated with infrastructure are identified, a detailed evaluation to determine environmental impacts, if any, will need to be performed. Impact on Water Resources and Other Management Strategies Water conservation may impact the amount of water returned to the system that might be available for reuse. The increased demands on the Ogallala will continue to deplete the storage in the aquifer. There are other users that may compete for groundwater supplies, but there is sufficient water in Hutchinson County to support these demands. Impact on Agriculture and Natural Resources Water conservation and the development of the proposed well fields are expected to have minimal impact on the agriculture and other natural resources. A small amount of agricultural lands may be affected by the transmission system associated with the well field, depending on the final transmission route.
Chapter 4 March September 1, 2010 Evaluation of Water Management Strategies
4-69
Other Relevant Factors There are no other identified relevant factors. Interbasin Transfer The recommended strategies do not require interbasin transfer permits. 4.9.4 City of Cactus The City of Cactus provides water to municipal and manufacturing customers in Moore County. Cactus currently obtains all of its supplies from the Ogallala aquifer in Moore County. Cactus is also a member of the Palo Duro River Authority. Table 4-18 lists the projected demands by customer, current supplies, and recommended strategies for Cactus to meet the projected water needs.
Recommended Strategies - Implement conservation strategies - Develop new wells in the Ogallala aquifer in Moore County
Recommended Conservation Strategies - Implementation of water conservation plan - Water conservation pricing - System water audit
Strategy Descriptions The recommended strategies for Cactus include implementing water conservation and developing new groundwater from the Ogallala aquifer with 6 new wells. The amount of water supply associated with each of these strategies is shown in Table 4-18. Time Intended to Complete Water conservation strategies should be in place by 2010 with water savings being noticed in 2020. Cactus will need to develop additional supplies between 2010 and 2020.
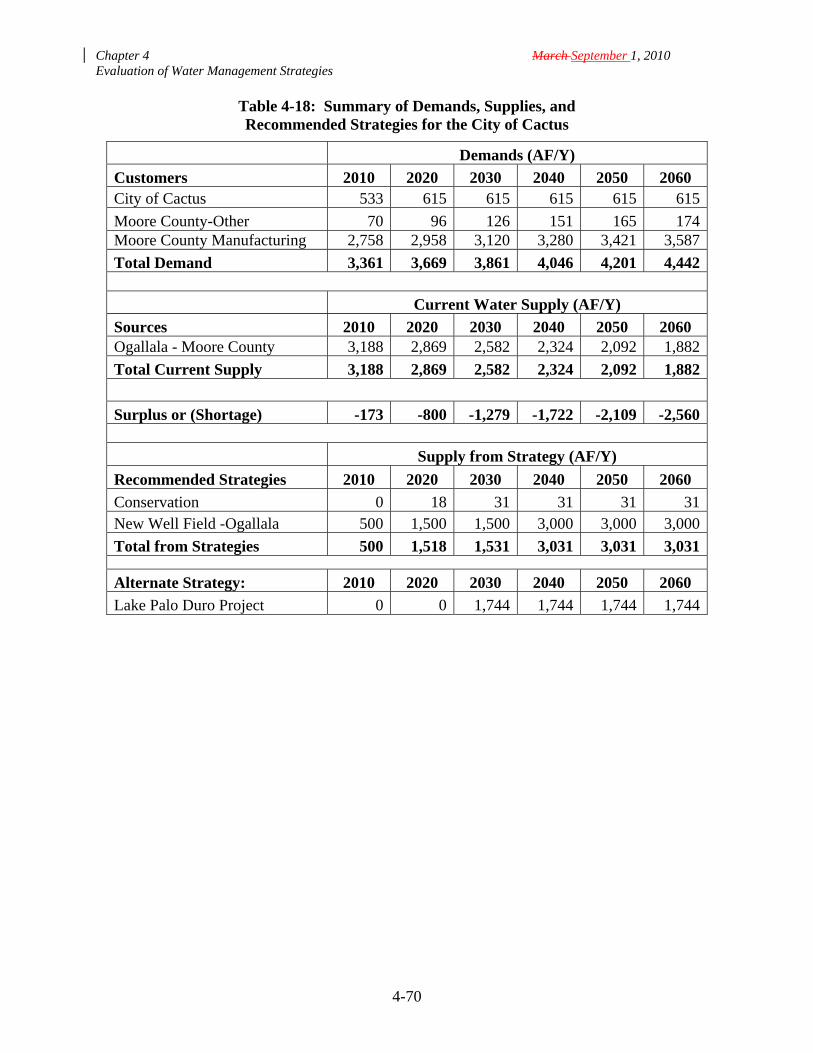
Chapter 4 March September 1, 2010 Evaluation of Water Management Strategies
4-70
Table 4-18: Summary of Demands, Supplies, and Recommended Strategies for the City of Cactus
Demands (AF/Y)
Customers 2010 2020 2030 2040 2050 2060 City of Cactus 533 615 615 615 615 615
Moore County-Other 70 96 126 151 165 174Moore County Manufacturing 2,758 2,958 3,120 3,280 3,421 3,587
Total Demand 3,361 3,669 3,861 4,046 4,201 4,442
Current Water Supply (AF/Y)
Sources 2010 2020 2030 2040 2050 2060 Ogallala - Moore County 3,188 2,869 2,582 2,324 2,092 1,882
Total Current Supply 3,188 2,869 2,582 2,324 2,092 1,882
Surplus or (Shortage) -173 -800 -1,279 -1,722 -2,109 -2,560
Supply from Strategy (AF/Y)
Recommended Strategies 2010 2020 2030 2040 2050 2060
Conservation 0 18 31 31 31 31New Well Field -Ogallala 500 1,500 1,500 3,000 3,000 3,000
Total from Strategies 500 1,518 1,531 3,031 3,031 3,031
Alternate Strategy: 2010 2020 2030 2040 2050 2060
Lake Palo Duro Project 0 0 1,744 1,744 1,744 1,744

Chapter 4 March September 1, 2010 Evaluation of Water Management Strategies
4-71
Quantity, Reliability and Cost The quantity of water should be sufficient. The reliability of conservation is considered moderate because much of the conservation plan must be implemented by the consumers. The conservation measures do not have any capital costs associated with them. Reliability of Ogallala supply is moderate to moderately-low since the aquifer is heavily used and availability depends on other water users. The capital cost for new wells is $10.9 million. Environmental Issues The environmental impacts from conservation and groundwater development are expected to be low. Once the specific locations of additional wells and alignments associated with infrastructure are identified, a detailed evaluation to determine environmental impacts, if any, will need to be performed. Impact on Water Resources and Other Management Strategies Water conservation may impact the amount of water returned to the system that might be available for reuse. The increased demands on the Ogallala will continue to deplete the storage in the aquifer. To prolong the life of the Ogallala, other users may need to reduce their demands. Impact on Agriculture and Natural Resources The recommended strategies are expected to have low to moderate impact on the agriculture and other natural resources. This strategy may reduce the irrigated acreage for farming as additional water rights acreage is purchased. This acreage could be used for dry land farming if needed, but may require crop changes. Other Relevant Factors There are no other identified relevant factors. Interbasin Transfer The recommended strategies do not require interbasin transfer permits. Social and Economic Impacts No negative social and economic impacts are expected from the implementation of these strategies. Impacts on Water Rights, Contracts, and Option Agreements The recommended strategies are not expected to impact water rights, contracts, or option agreements. Impact on Navigation The recommended strategies should have no impact on the navigable waters of the United States. Alternative Strategy As a member of the PDRA, Cactus is interested in developing a regional transmission system to use water from Palo Duro Reservoir. The Palo Duro Reservoir transmission project is an alternative strategy for Cactus. The project would have very little impact on the environment,
Chapter 4 March September 1, 2010 Evaluation of Water Management Strategies
4-72
agricultural or other natural resources. Once the pipeline route is established, a more detailed analysis of the impacts should be considered. No interbasin transfer permits would be required for the Palo Duro transmission project. The use of this supply might decrease lake levels and impact recreation uses on the lake from time to time. No other impacts are expected from this project. Cactus is expected to have a capital cost of $54.8 million associated with their portion of the project. 4.9.6 Greenbelt Municipal and Industrial Water Authority Greenbelt Municipal and Industrial Water Authority (Greenbelt M&IWA) owns and operates Greenbelt Reservoir on the Salt Fork of the Red River. As part of its water right, Greenbelt M&IWA also has the right to divert up to 4,030 acre-feet per year from Lelia Lake Creek. The Greenbelt M&IWA is located in Donley County and provides water to local municipalities through an extensive delivery system, including a 121-mile aqueduct. There are five member cities, including Clarendon, Hedley, and Childress in the PWPA and Quanah and Crowell in the Region B planning area. The Red River Authority is a non-voting member of the Greenbelt M&IWA. The estimated safe yield from the reservoir is nearly 6,900 acre-feet per year, reducing to 6,181 acre-feet per year by 2060. Greenbelt M&IWA provides water to several cities in the PWPA and Region B. Current projected demands on the Greenbelt M&IWA are shown in Table 4-19 and are not expected to exceed 5,000 acre-feet per year over the planning period. Based on the WAM analysis for Greenbelt Reservoir, Greenbelt M&IWA is not expected to have any water shortages during the planning period (2010-2060). However, recent drought in the PWPA has raised concerns about the reliability of the long-term supplies from the reservoir. Greenbelt M&IWA is currently investigating the possibility of supplementing its surface water supplies with groundwater. In addition to groundwater, the Authority has included the development of its water rights on Lelia Lake Creek as part of its long-range water supply plan. This is a long-term term project and will likely be developed beyond this planning period.
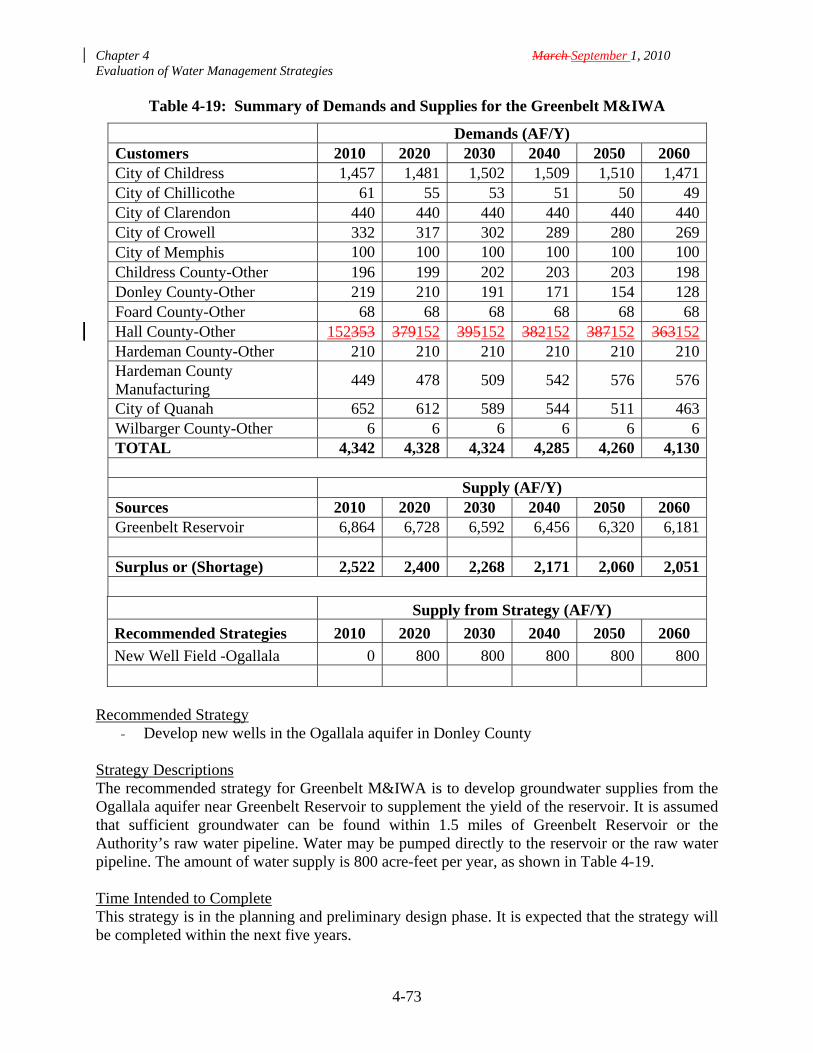
Chapter 4 March September 1, 2010 Evaluation of Water Management Strategies
4-73
Table 4-19: Summary of Demands and Supplies for the Greenbelt M&IWA
Demands (AF/Y) Customers 2010 2020 2030 2040 2050 2060 City of Childress 1,457 1,481 1,502 1,509 1,510 1,471City of Chillicothe 61 55 53 51 50 49City of Clarendon 440 440 440 440 440 440City of Crowell 332 317 302 289 280 269City of Memphis 100 100 100 100 100 100Childress County-Other 196 199 202 203 203 198Donley County-Other 219 210 191 171 154 128Foard County-Other 68 68 68 68 68 68Hall County-Other 152353 379152 395152 382152 387152 363152Hardeman County-Other 210 210 210 210 210 210Hardeman County Manufacturing
449 478 509 542 576 576
City of Quanah 652 612 589 544 511 463Wilbarger County-Other 6 6 6 6 6 6TOTAL 4,342 4,328 4,324 4,285 4,260 4,130
Supply (AF/Y)
Sources 2010 2020 2030 2040 2050 2060 Greenbelt Reservoir 6,864 6,728 6,592 6,456 6,320 6,181
Surplus or (Shortage) 2,522 2,400 2,268 2,171 2,060 2,051
Supply from Strategy (AF/Y)
Recommended Strategies 2010 2020 2030 2040 2050 2060
New Well Field -Ogallala 0 800 800 800 800 800
Recommended Strategy
- Develop new wells in the Ogallala aquifer in Donley County
Strategy Descriptions The recommended strategy for Greenbelt M&IWA is to develop groundwater supplies from the Ogallala aquifer near Greenbelt Reservoir to supplement the yield of the reservoir. It is assumed that sufficient groundwater can be found within 1.5 miles of Greenbelt Reservoir or the Authority’s raw water pipeline. Water may be pumped directly to the reservoir or the raw water pipeline. The amount of water supply is 800 acre-feet per year, as shown in Table 4-19. Time Intended to Complete This strategy is in the planning and preliminary design phase. It is expected that the strategy will be completed within the next five years.
Chapter 4 March September 1, 2010 Evaluation of Water Management Strategies
4-74
Quantity, Reliability and Cost The quantity of water should be sufficient. Reliability of groundwater supply is moderate since there is completion for water from the Ogallala in Donley County. The capital cost for a new well is $1.9 million. Environmental Issues The environmental impacts from groundwater development are expected to be low. Once the specific locations of additional wells and alignments associated with infrastructure are identified, a detailed evaluation to determine environmental impacts, if any, will need to be performed. Impact on Water Resources and Other Management Strategies The proposed well is located near eth reservoir in an area with little competition for groundwater. The strategy should not significantly impact other water resources or management strategies. The strategy may improve the water quality and quantity stored in Greenbelt Reservoir. Impact on Agriculture and Natural Resources The recommended strategy is expected to have low impact on the agriculture and other natural resources. Other Relevant Factors Greenbelt M&IWA will need to seek a groundwater permit from the Panhandle GCD. If the water is placed in Greenbelt Reservoir, the Authority may need to submit a water rights accounting plan to TCEQ. Interbasin Transfer The recommended strategies do not require interbasin transfer permits. Social and Economic Impacts No negative social and economic impacts are expected from the implementation of these strategies. Impacts on Water Rights, Contracts, and Option Agreements The recommended strategy is not expected to impact existing water rights, contracts, or option agreements. The well will be operated in conjunction with Greenbelt Reservoir in accordance with its existing water rights. Impact on Navigation The recommended strategies should have no impact on the navigable waters of the United States. 4.9.7 Mesa Water Inc. Mesa Water, Inc. currently owns and controls 210,000 acres of water rights in the PWPA. The majority of these water rights are in Roberts County with additional holdings in Ochiltree, Lipscomb, Hemphill, Hutchinson, Carson, Gray, and Wheeler Counties. Mesa’s water rights are within the regulation areas of the Panhandle GCD, the North Plains GCD and the Hemphill County UWCD. The Panhandle GCD has issued initial production permits to Mesa for the intended use of “municipal use in Texas”. The authorized rate is 1 acre-foot per acre of water right and is subject to District depletion management programs. Similar production limits are
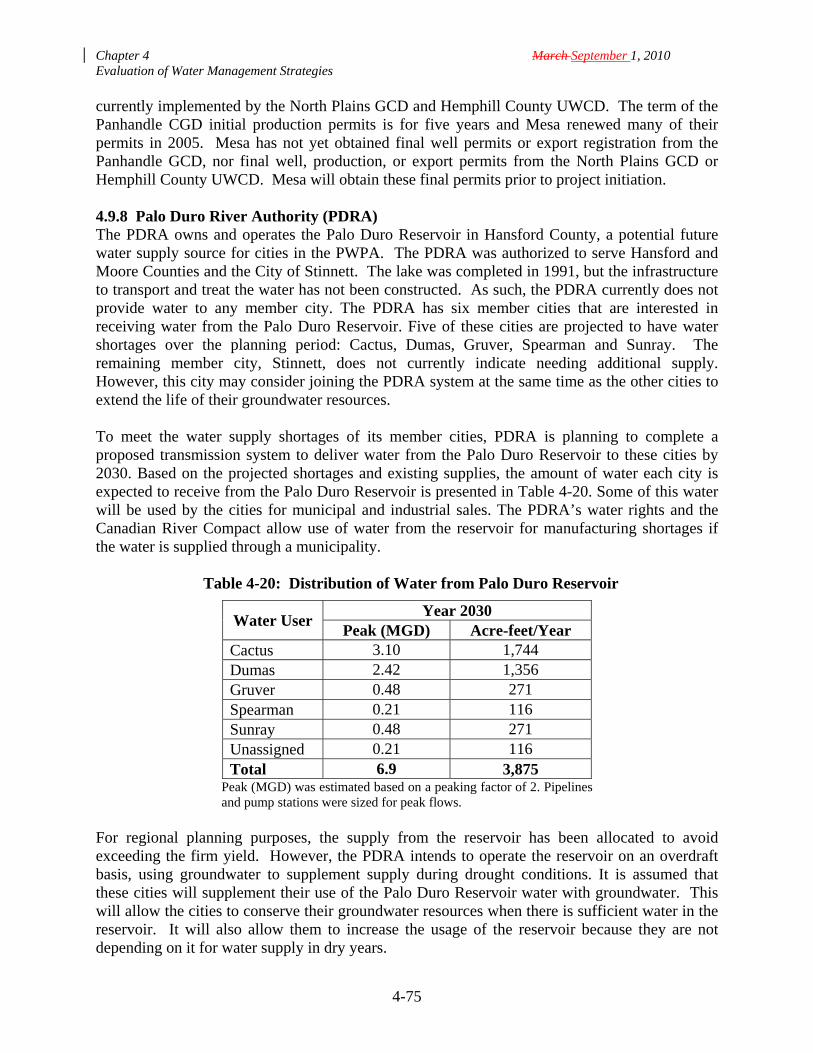
Chapter 4 March September 1, 2010 Evaluation of Water Management Strategies
4-75
currently implemented by the North Plains GCD and Hemphill County UWCD. The term of the Panhandle CGD initial production permits is for five years and Mesa renewed many of their permits in 2005. Mesa has not yet obtained final well permits or export registration from the Panhandle GCD, nor final well, production, or export permits from the North Plains GCD or Hemphill County UWCD. Mesa will obtain these final permits prior to project initiation. 4.9.8 Palo Duro River Authority (PDRA) The PDRA owns and operates the Palo Duro Reservoir in Hansford County, a potential future water supply source for cities in the PWPA. The PDRA was authorized to serve Hansford and Moore Counties and the City of Stinnett. The lake was completed in 1991, but the infrastructure to transport and treat the water has not been constructed. As such, the PDRA currently does not provide water to any member city. The PDRA has six member cities that are interested in receiving water from the Palo Duro Reservoir. Five of these cities are projected to have water shortages over the planning period: Cactus, Dumas, Gruver, Spearman and Sunray. The remaining member city, Stinnett, does not currently indicate needing additional supply. However, this city may consider joining the PDRA system at the same time as the other cities to extend the life of their groundwater resources. To meet the water supply shortages of its member cities, PDRA is planning to complete a proposed transmission system to deliver water from the Palo Duro Reservoir to these cities by 2030. Based on the projected shortages and existing supplies, the amount of water each city is expected to receive from the Palo Duro Reservoir is presented in Table 4-20. Some of this water will be used by the cities for municipal and industrial sales. The PDRA’s water rights and the Canadian River Compact allow use of water from the reservoir for manufacturing shortages if the water is supplied through a municipality.
Table 4-20: Distribution of Water from Palo Duro Reservoir
Water User Year 2030
Peak (MGD) Acre-feet/Year Cactus 3.10 1,744 Dumas 2.42 1,356 Gruver 0.48 271 Spearman 0.21 116 Sunray 0.48 271 Unassigned 0.21 116 Total 6.9 3,875
Peak (MGD) was estimated based on a peaking factor of 2. Pipelines and pump stations were sized for peak flows.
For regional planning purposes, the supply from the reservoir has been allocated to avoid exceeding the firm yield. However, the PDRA intends to operate the reservoir on an overdraft basis, using groundwater to supplement supply during drought conditions. It is assumed that these cities will supplement their use of the Palo Duro Reservoir water with groundwater. This will allow the cities to conserve their groundwater resources when there is sufficient water in the reservoir. It will also allow them to increase the usage of the reservoir because they are not depending on it for water supply in dry years.
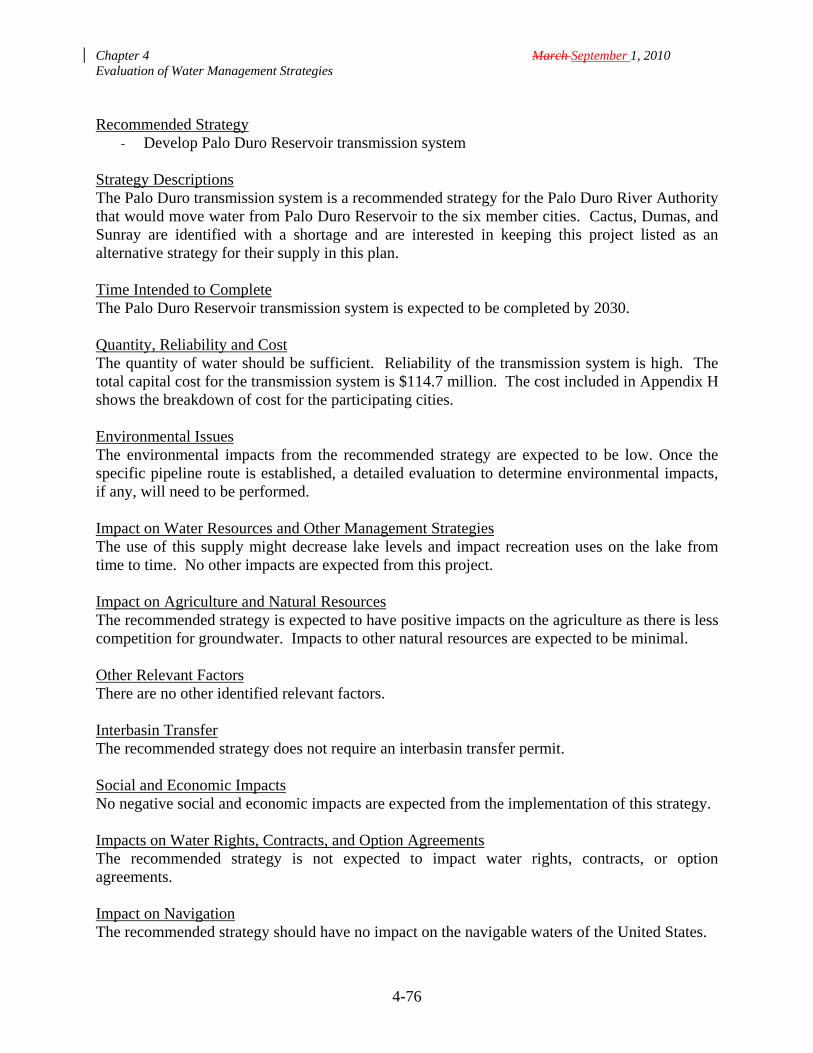
Chapter 4 March September 1, 2010 Evaluation of Water Management Strategies
4-76
Recommended Strategy
- Develop Palo Duro Reservoir transmission system
Strategy Descriptions The Palo Duro transmission system is a recommended strategy for the Palo Duro River Authority that would move water from Palo Duro Reservoir to the six member cities. Cactus, Dumas, and Sunray are identified with a shortage and are interested in keeping this project listed as an alternative strategy for their supply in this plan. Time Intended to Complete The Palo Duro Reservoir transmission system is expected to be completed by 2030. Quantity, Reliability and Cost The quantity of water should be sufficient. Reliability of the transmission system is high. The total capital cost for the transmission system is $114.7 million. The cost included in Appendix H shows the breakdown of cost for the participating cities. Environmental Issues The environmental impacts from the recommended strategy are expected to be low. Once the specific pipeline route is established, a detailed evaluation to determine environmental impacts, if any, will need to be performed. Impact on Water Resources and Other Management Strategies The use of this supply might decrease lake levels and impact recreation uses on the lake from time to time. No other impacts are expected from this project. Impact on Agriculture and Natural Resources The recommended strategy is expected to have positive impacts on the agriculture as there is less competition for groundwater. Impacts to other natural resources are expected to be minimal. Other Relevant Factors There are no other identified relevant factors. Interbasin Transfer The recommended strategy does not require an interbasin transfer permit. Social and Economic Impacts No negative social and economic impacts are expected from the implementation of this strategy. Impacts on Water Rights, Contracts, and Option Agreements The recommended strategy is not expected to impact water rights, contracts, or option agreements. Impact on Navigation The recommended strategy should have no impact on the navigable waters of the United States.
Chapter 4 March September 1, 2010 Evaluation of Water Management Strategies
4-77
4.10 Water Transfers and Water Marketing Companies Water users who have deficits and are considering alternative strategies for meeting shortages may consider purchasing water from other counties or nearby areas. To facilitate these water transfers, public and/or private water marketing companies may be formed. The PWPG recognizes that as it becomes economically feasible, there will be opportunities for public and/or private water marketing companies to transfer water from counties with developable groundwater supplies to counties currently showing deficits or counties outside of the PWPA. The economic feasibility of these transfers will depend on the distance the water must be transported, the ability of the water user group consuming the water to pay for the transported water, and the estimated project life-span for cost amortization. The PWPG received preliminary ideas on several water transfer concepts. None of those transfer concepts were included as recommended water management strategies in this plan. However, the PWPG expects to study and evaluate as a potential future water management strategy, the procurement of additional groundwater rights and associated water transfer concept(s) during the next planning cycle. This study could include the procurement of additional groundwater rights in the vicinity of CRMWA’s Roberts County well field and transmission line, other areas overlying the Ogallala aquifer, and construction of a second pipeline for the delivery of the additional groundwater to CRMWA’s customers. Any water management strategy will need to acquire an adequate quantity of groundwater rights while complying with all applicable water conservation district rules and honoring the PWPA planning guidelines. 4.11 Brush Control In 2000, the Texas State Soil and Water Conservation Board (TSSWCB) sponsored a study of the potential effect of brush control in the Canadian River watershed on surface water availability1. The study was conducted on the premise that shifting the vegetation composition from species with high evapotranspiration potential (i.e. trees, brush) to plants with lower evapotranspiration potential (i.e. grass) would increase surface water runoff and average water availability. The analysis focused on brush control options and benefits in the Lake Meredith watershed. According to the study, removal of moderate to heavy concentrations of mesquite and mixed brush would increase water availability by an average of 0.040 acre-foot per treated acre per year. The cost for the additional water was estimated at an average of $111 per acre-foot for the entire watershed, with cost per sub basin ranging from $26 to $91,400 per acre-foot of added water. Brush removal treatment would be necessary approximately every ten years to maintain this level of benefit. The study also found that upland brush control was not economic in areas of less than 19 inches of annual rainfall.
1 Texas State Soil and Water Conservation Board, “Canadian River Watershed, Brush Control Planning, Assessment and Feasibility Study,” December 2000.

Chapter 4 March September 1, 2010 Evaluation of Water Management Strategies
4-78
CRMWA initiated a program of providing financial assistance to landowners along the Canadian River and its tributaries downstream from Ute Dam in New Mexico. The program uses the continuous sign-up provisions of the CRP program of the USDA-NRCS with CRMWA paying the local cost shares, resulting in the treatment of 855 acres of salt cedar in 2004 by aerial spraying. Total cost of this work was nearly $162,000, with CRMWA paying 72%, NRCS funding 25% and one landowner paying the remainder. A similar program was initiated along the Texas portion of the Canadian River, based on the USDA-NRCS EQIP program (using $600,000 in federal EQIP funds along with allocated CRMWA funding to pay the local cost share), but early dormancy of the plants prevented any spraying in Texas in 2004. Eleven Texas landowners, comprising a total area of 2,094 acres, signed contracts with USDA-NRCS to treat their land. The program was reinitiated in 2005 and has been on-going since with approximately $3.1 million spent through 2009 to control salt cedar through herbicidal spraying. In addition to the chemical control of invasive species, CRMWA and Texas AgriLife Research Center at Bushland have been conducting pilot studies on biological control of salt cedar2. Three species of beetles have been released in the Lake Meredith watershed since April 2004. The success of these studies has been mixed. Texas AgriLife Research Entomology Program is continuing to adjust its methods to foster colonization of the beetles with the ultimate goal of significant salt cedar deforestation. The researchers are optimistic that the beetles will adapt within the Lake Meredith watershed and that biological control will be an integral component of reducing and controlling the infestation of salt cedar in the basin. This is an important component of the recommended water management strategies for water supplies in the PWPA. Based on findings of the Lake Meredith study (Appendix G), the increase in salt cedar in the Lake Meredith watershed appears to be a contributing factor to the decrease in stream flows to Lake Meredith. While there are likely several factors contributing to the hydrologic loss in the Lake Meredith watershed, the control of salt cedar is an action that can be undertaken. 4.12 Summary of Recommended Water Management Strategies The recommended water management strategies in the PWPA include:
Conservation, Developing new groundwater well fields in the Ogallala, and Dockum and Seymour
aquifers, and Purchasing water from wholesale providers as they develop new strategies, and Acquiring additional groundwater rights.
Conservation is an important strategy in the region, as it is the only recommended strategy for the large irrigation deficits projected for the PWPA. There are potential cumulative water savings of up to 29 million acre-feet over the planning period from these strategies for the region. For the counties with shortages, the recommended irrigation conservation water savings
2 AgriLife Research, “Saltcedar Biological Control: Review of 2009 Activities in the Lake Meredith Area and 2010 Plans”, 2009.
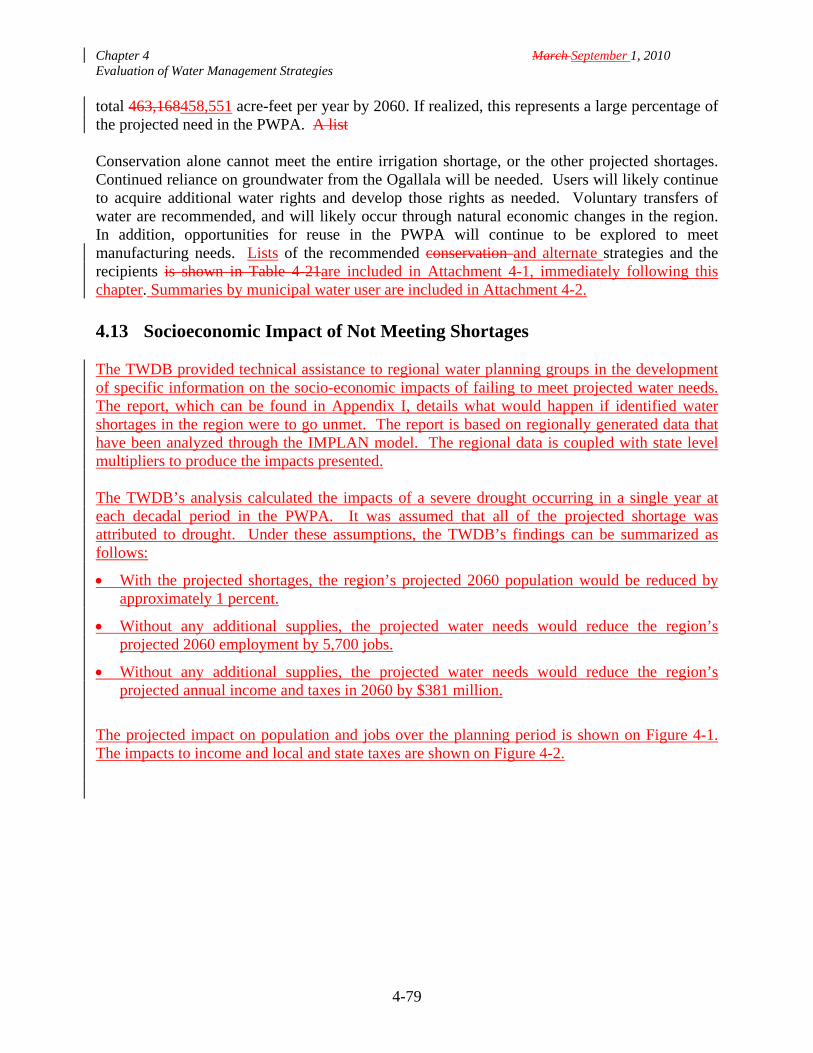
Chapter 4 March September 1, 2010 Evaluation of Water Management Strategies
4-79
total 463,168458,551 acre-feet per year by 2060. If realized, this represents a large percentage of the projected need in the PWPA. A list Conservation alone cannot meet the entire irrigation shortage, or the other projected shortages. Continued reliance on groundwater from the Ogallala will be needed. Users will likely continue to acquire additional water rights and develop those rights as needed. Voluntary transfers of water are recommended, and will likely occur through natural economic changes in the region. In addition, opportunities for reuse in the PWPA will continue to be explored to meet manufacturing needs. Lists of the recommended conservation and alternate strategies and the recipients is shown in Table 4-21are included in Attachment 4-1, immediately following this chapter. Summaries by municipal water user are included in Attachment 4-2. 4.13 Socioeconomic Impact of Not Meeting Shortages The TWDB provided technical assistance to regional water planning groups in the development of specific information on the socio-economic impacts of failing to meet projected water needs. The report, which can be found in Appendix I, details what would happen if identified water shortages in the region were to go unmet. The report is based on regionally generated data that have been analyzed through the IMPLAN model. The regional data is coupled with state level multipliers to produce the impacts presented. The TWDB’s analysis calculated the impacts of a severe drought occurring in a single year at each decadal period in the PWPA. It was assumed that all of the projected shortage was attributed to drought. Under these assumptions, the TWDB’s findings can be summarized as follows:
With the projected shortages, the region’s projected 2060 population would be reduced by approximately 1 percent.
Without any additional supplies, the projected water needs would reduce the region’s projected 2060 employment by 5,700 jobs.
Without any additional supplies, the projected water needs would reduce the region’s projected annual income and taxes in 2060 by $381 million.
The projected impact on population and jobs over the planning period is shown on Figure 4-1. The impacts to income and local and state taxes are shown on Figure 4-2.
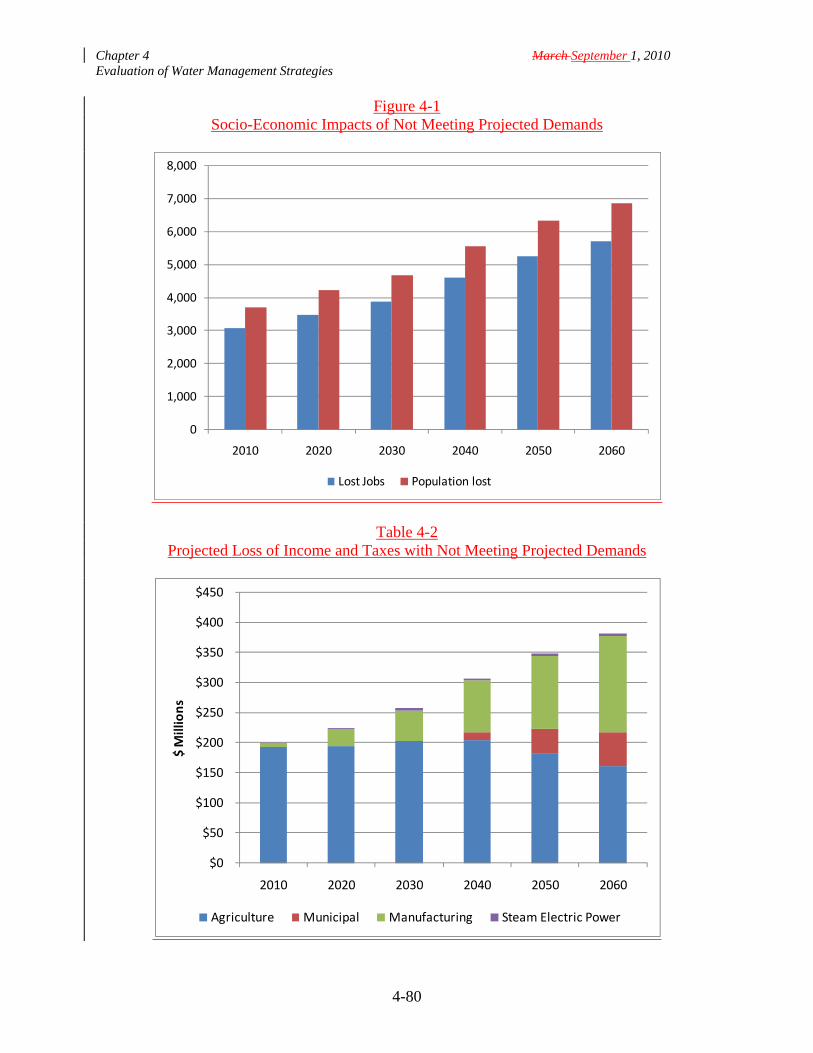
Chapter 4 March September 1, 2010 Evaluation of Water Management Strategies
4-80
Figure 4-1 Socio-Economic Impacts of Not Meeting Projected Demands
Table 4-2 Projected Loss of Income and Taxes with Not Meeting Projected Demands
0
1,000
2,000
3,000
4,000
5,000
6,000
7,000
8,000
2010 2020 2030 2040 2050 2060
Lost Jobs Population lost
$0
$50
$100
$150
$200
$250
$300
$350
$400
$450
2010 2020 2030 2040 2050 2060
$ M
illions
Agriculture Municipal Manufacturing Steam Electric Power

Chapter 4 March September 1, 2010 Evaluation of Water Management Strategies
4-81
The socioeconomic impact analysis report is being prepared by the Texas Water Development Board and the results will be included in the final regional water plan.

Chapter 4 March 1, 2010 Evaluation of Water Management Strategies
4-82
ATTACHMENT 4-1
Potentially Feasible Water Management Strategies

Chapter 4 March 1, 2010 Evaluation of Water Management Strategies
4-83
ATTACHMENT 4-2
Municipal Water User Group Summaries