http:// remember empirical (measured) frequency distributions
TRANSCRIPT
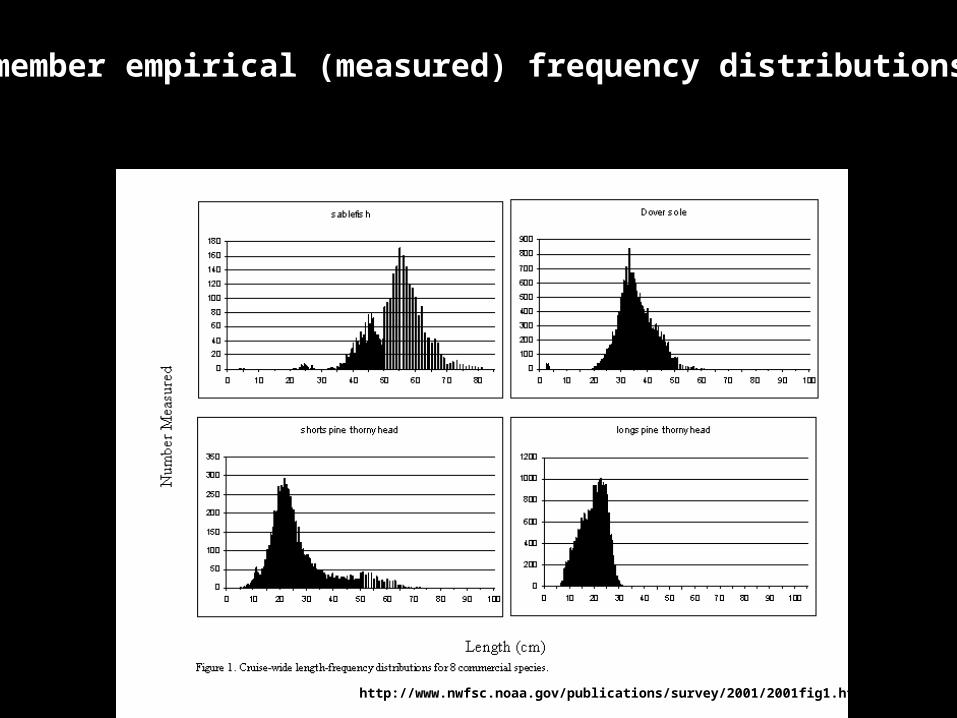
http://www.nwfsc.noaa.gov/publications/survey/2001/2001fig1.html
Remember empirical (measured) frequency distributions
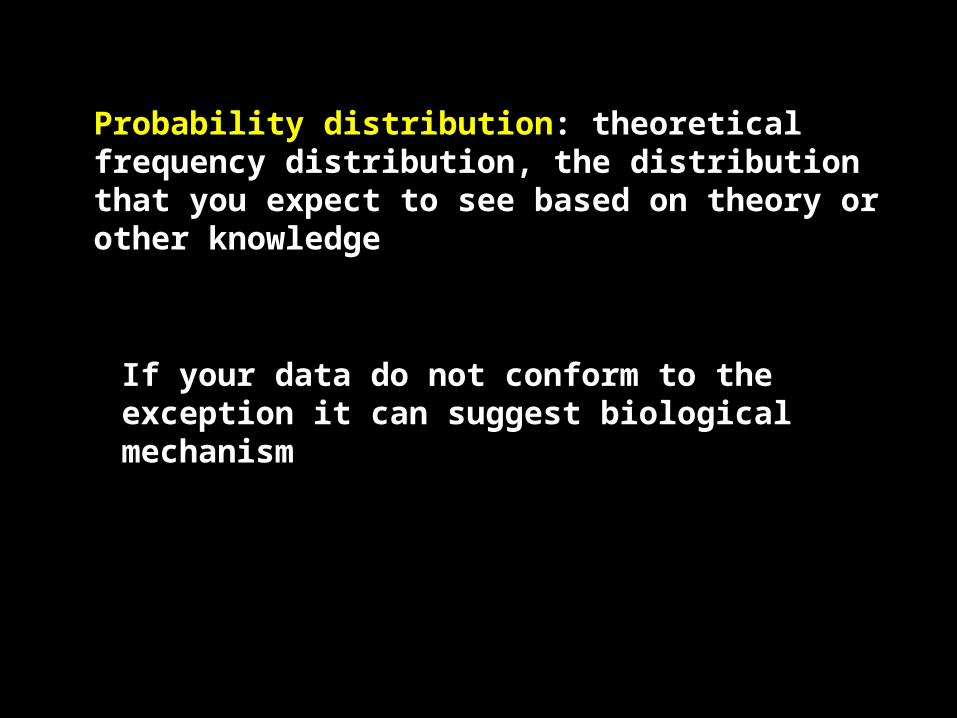
Probability distribution: theoretical frequency distribution, the distribution that you expect to see based on theory or other knowledge
If your data do not conform to the exception it can suggest biological mechanism
Basic ProbabilityRead very carefully S&R 5.1 or Zar Ch 5
S&R is better on this topic
Important concepts
How to calculate probabilitiesDifficulty in obtaining random and impendent samples
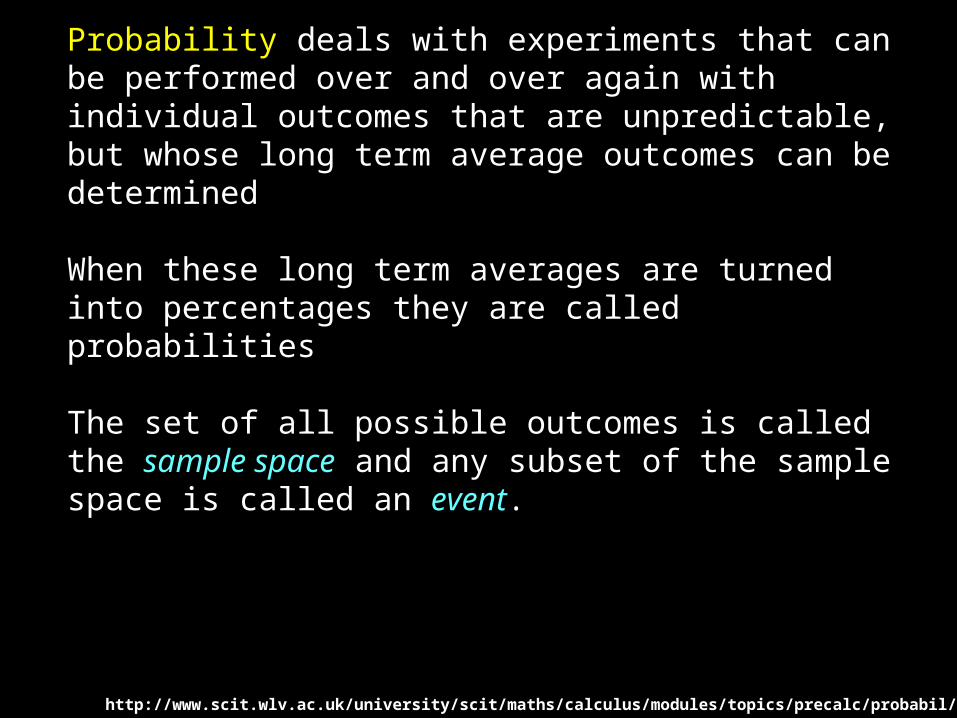
Probability deals with experiments that can be performed over and over again with individual outcomes that are unpredictable, but whose long term average outcomes can be determined
When these long term averages are turned into percentages they are called probabilities
The set of all possible outcomes is called the sample space and any subset of the sample space is called an event.
http://www.scit.wlv.ac.uk/university/scit/maths/calculus/modules/topics/precalc/probabil/learn.htm
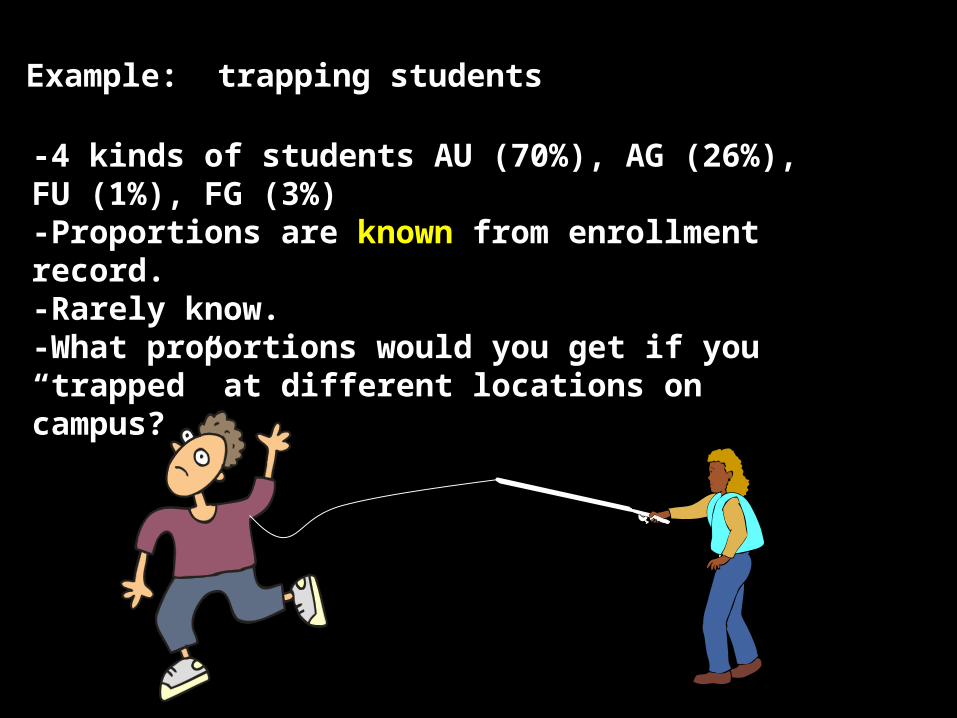
Example: trapping students
-4 kinds of students AU (70%), AG (26%), FU (1%), FG (3%)-Proportions are known from enrollment record. -Rarely know. -What proportions would you get if you “trapped” at different locations on campus?
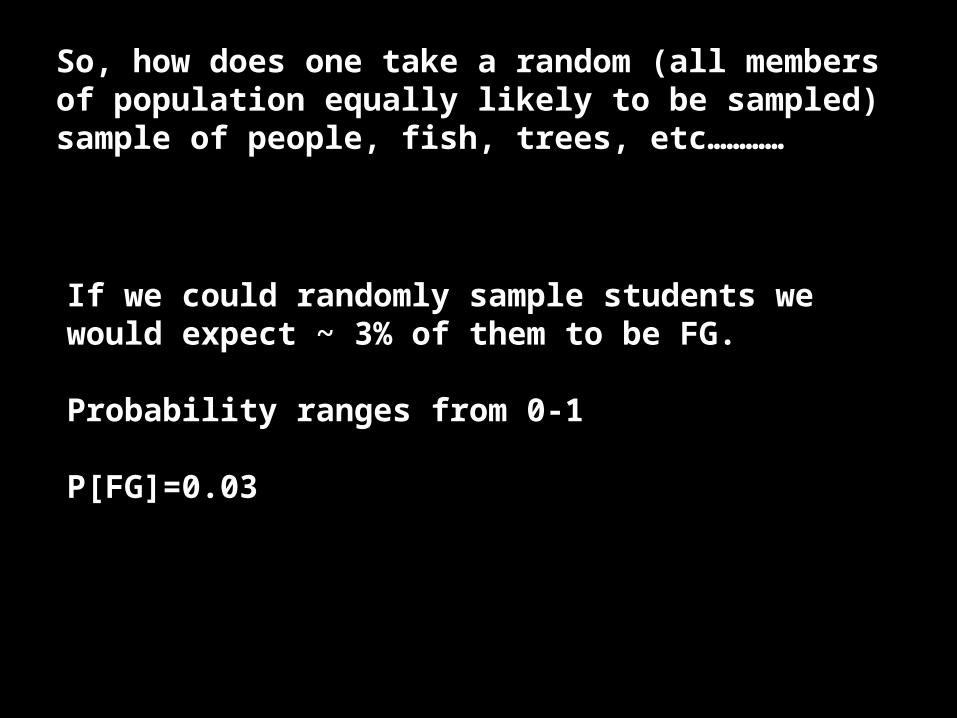
So, how does one take a random (all members of population equally likely to be sampled) sample of people, fish, trees, etc…………
If we could randomly sample students we would expect ~ 3% of them to be FG.
Probability ranges from 0-1
P[FG]=0.03
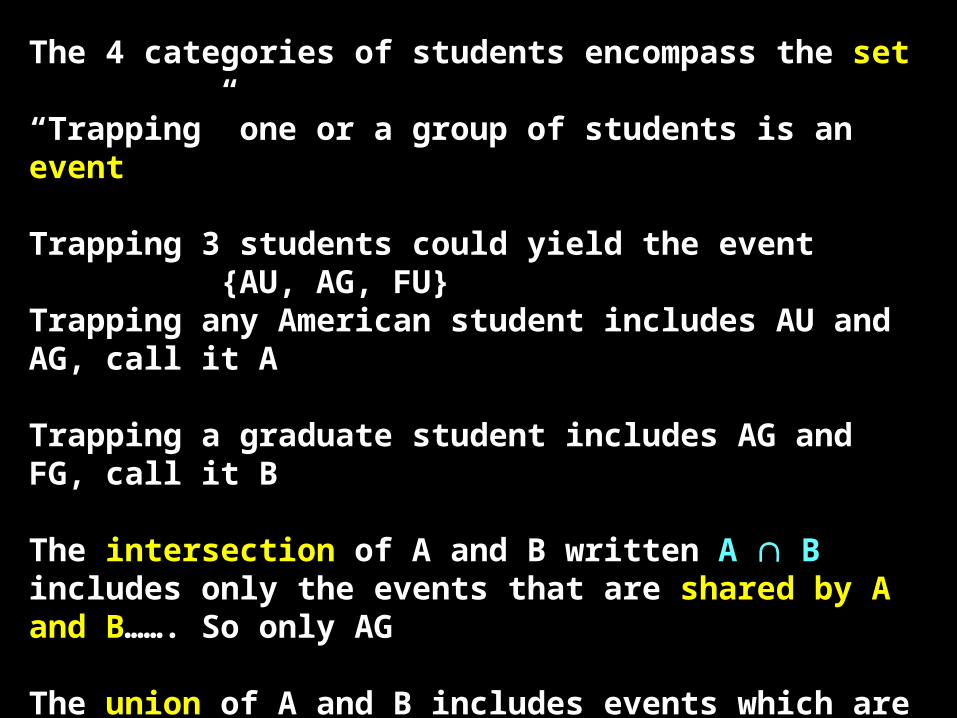
The 4 categories of students encompass the set
“Trapping” one or a group of students is an event
Trapping 3 students could yield the event{AU, AG, FU}
Trapping any American student includes AU and AG, call it A
Trapping a graduate student includes AG and FG, call it B
The intersection of A and B written A B includes only the events that are shared by A and B……. So only AG
The union of A and B includes events which are either A or B or both, written A B……. So {AG, AU, FG}
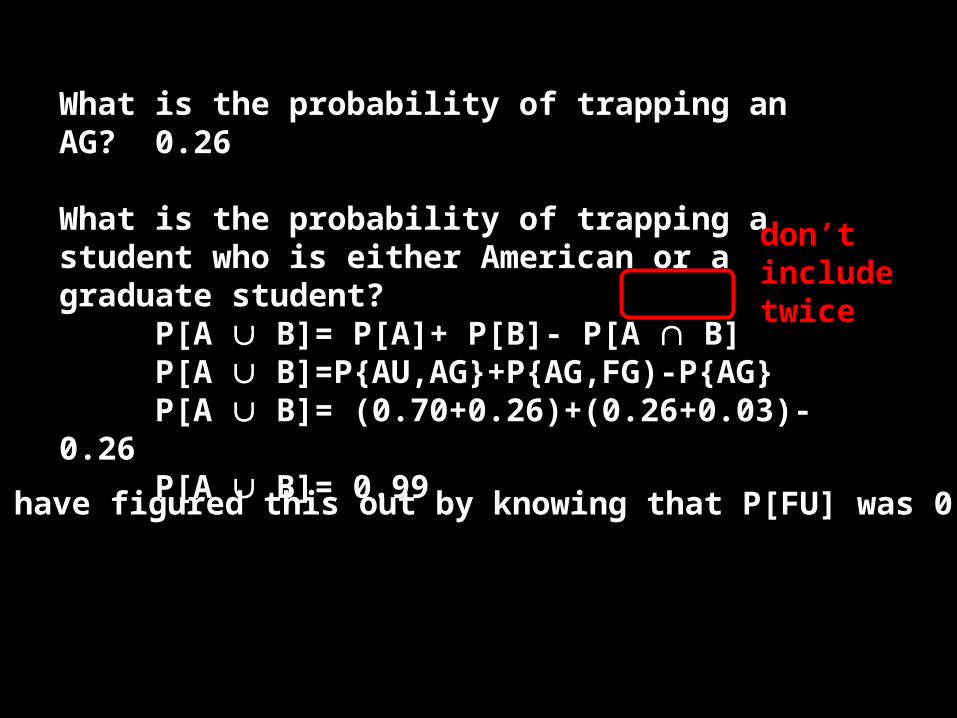
What is the probability of trapping an AG? 0.26
What is the probability of trapping a student who is either American or a graduate student?
P[A B]= P[A]+ P[B]- P[A B]P[A B]=P{AU,AG}+P{AG,FG)-P{AG}P[A B]= (0.70+0.26)+(0.26+0.03)-0.26P[A B]= 0.99
don’t include twice
Could have figured this out by knowing that P[FU] was 0.01!
Up till know, talking about “sampling” one student.
If we want to catch 2, we must catch one first and then a second.
Must decide whether or not to replace the first one
In very large populations, it doesn’t really matter.
Are the two students caught independent? Doesn’t relate to whether mom & dad still pay tuition!
Does the probability of catching student 1, affect the probability of catching student 2?
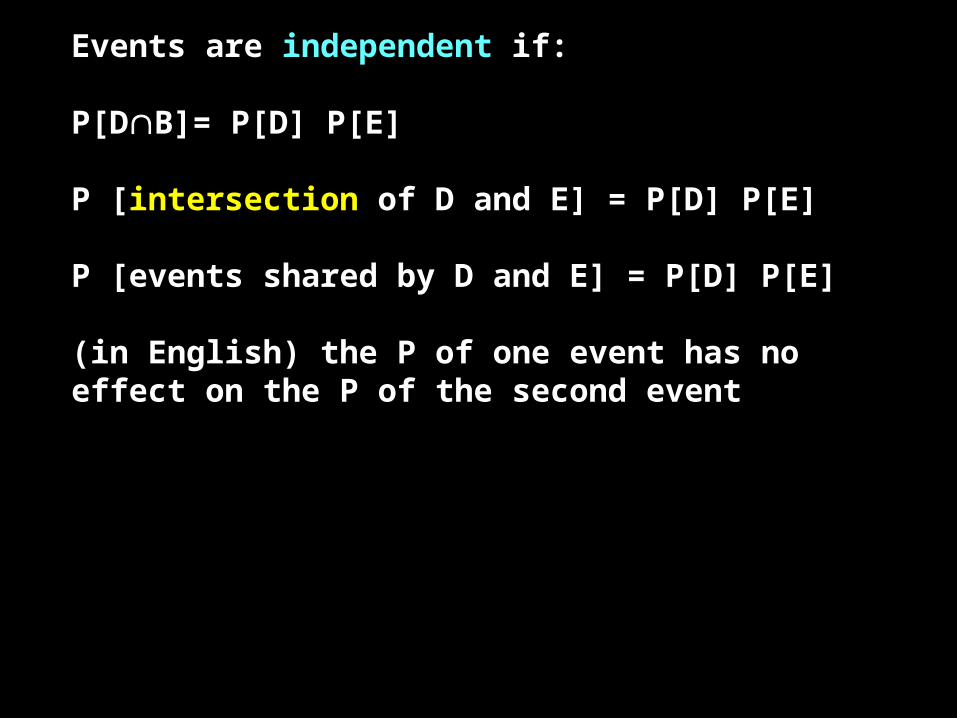
Events are independent if:
P[DB]= P[D] P[E]
P [intersection of D and E] = P[D] P[E]
P [events shared by D and E] = P[D] P[E]
(in English) the P of one event has no effect on the P of the second event
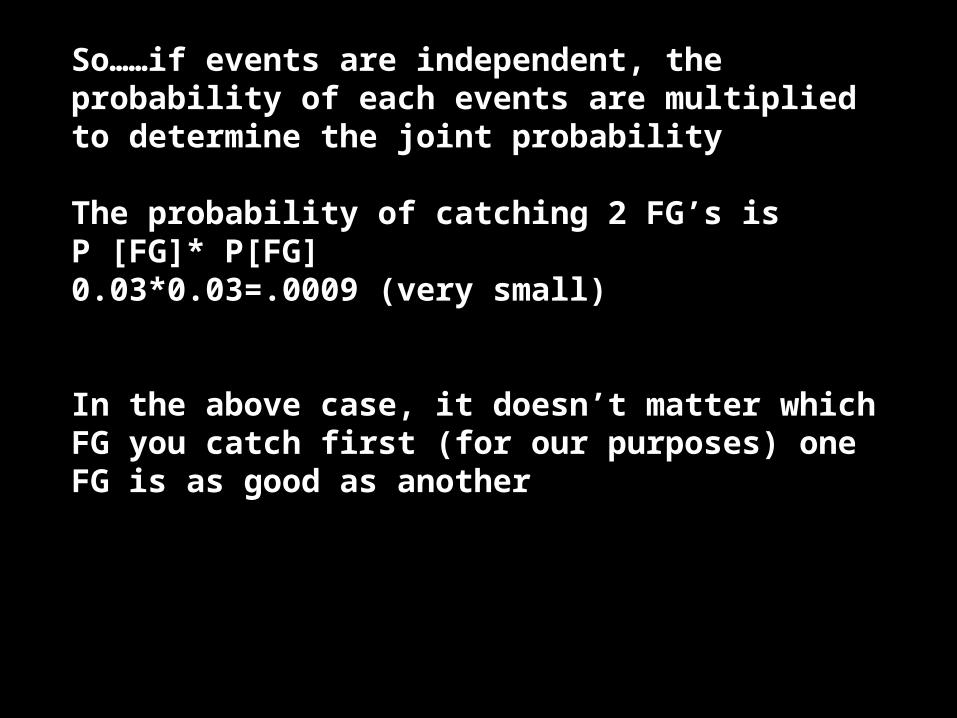
So……if events are independent, the probability of each events are multiplied to determine the joint probability
The probability of catching 2 FG’s isP [FG]* P[FG] 0.03*0.03=.0009 (very small)
In the above case, it doesn’t matter which FG you catch first (for our purposes) one FG is as good as another
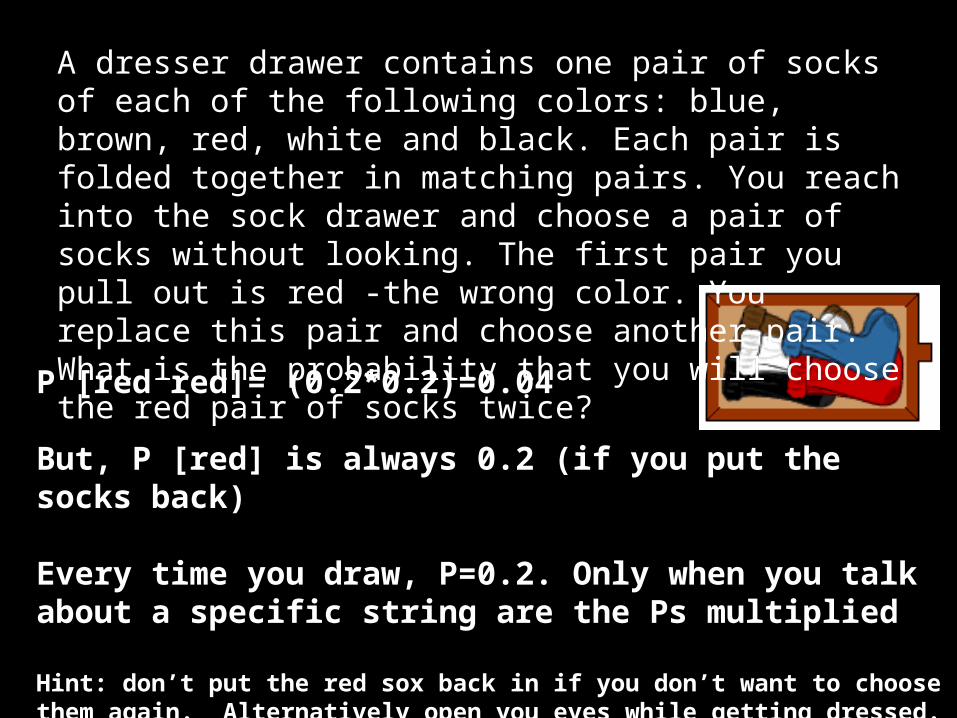
A dresser drawer contains one pair of socks of each of the following colors: blue, brown, red, white and black. Each pair is folded together in matching pairs. You reach into the sock drawer and choose a pair of socks without looking. The first pair you pull out is red -the wrong color. You replace this pair and choose another pair. What is the probability that you will choose the red pair of socks twice?
P [red red]= (0.2*0.2)=0.04
But, P [red] is always 0.2 (if you put the socks back)
Every time you draw, P=0.2. Only when you talk about a specific string are the Ps multiplied
Hint: don’t put the red sox back in if you don’t want to choose them again. Alternatively open you eyes while getting dressed.
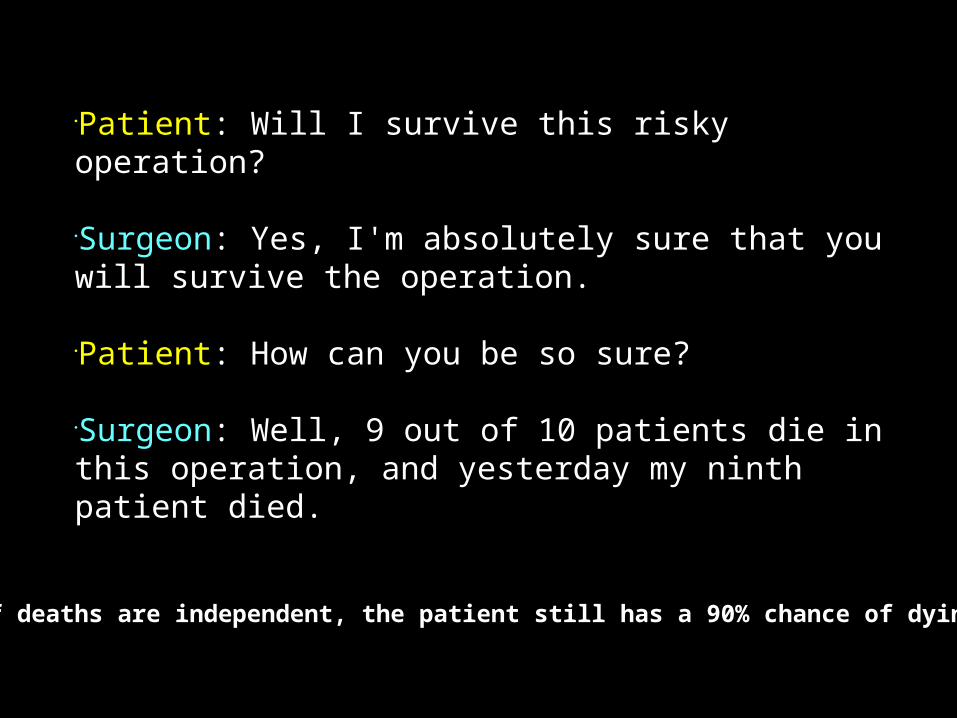
Patient: Will I survive this risky operation?
Surgeon: Yes, I'm absolutely sure that you will survive the operation.
Patient: How can you be so sure?
Surgeon: Well, 9 out of 10 patients die in this operation, and yesterday my ninth patient died.
If deaths are independent, the patient still has a 90% chance of dying!
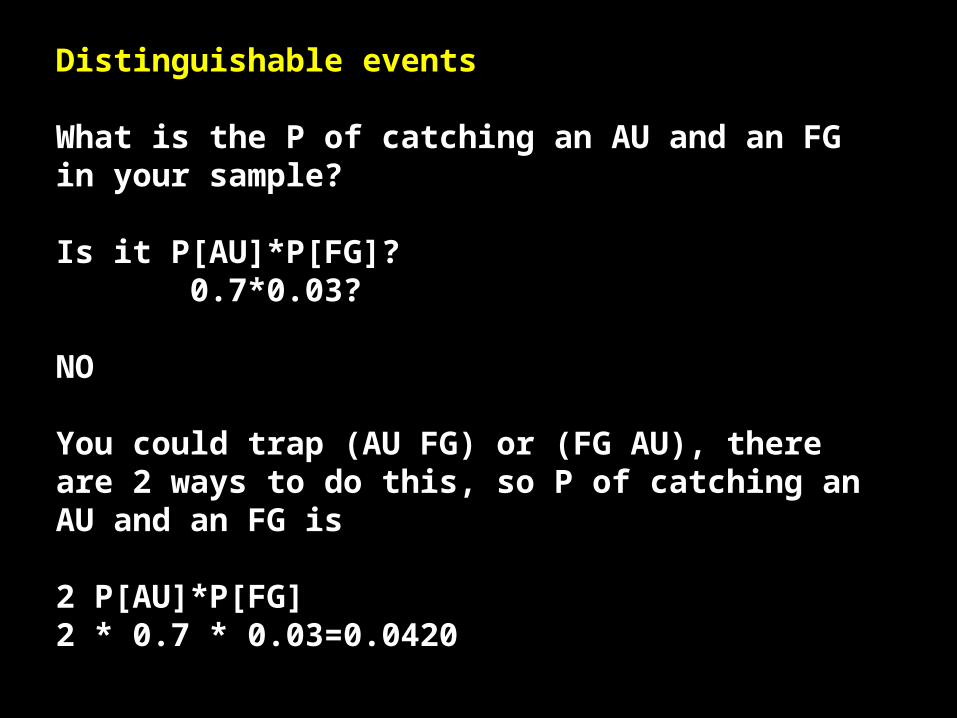
Distinguishable events
What is the P of catching an AU and an FG in your sample?
Is it P[AU]*P[FG]? 0.7*0.03?
NO
You could trap (AU FG) or (FG AU), there are 2 ways to do this, so P of catching an AU and an FG is
2 P[AU]*P[FG]2 * 0.7 * 0.03=0.0420
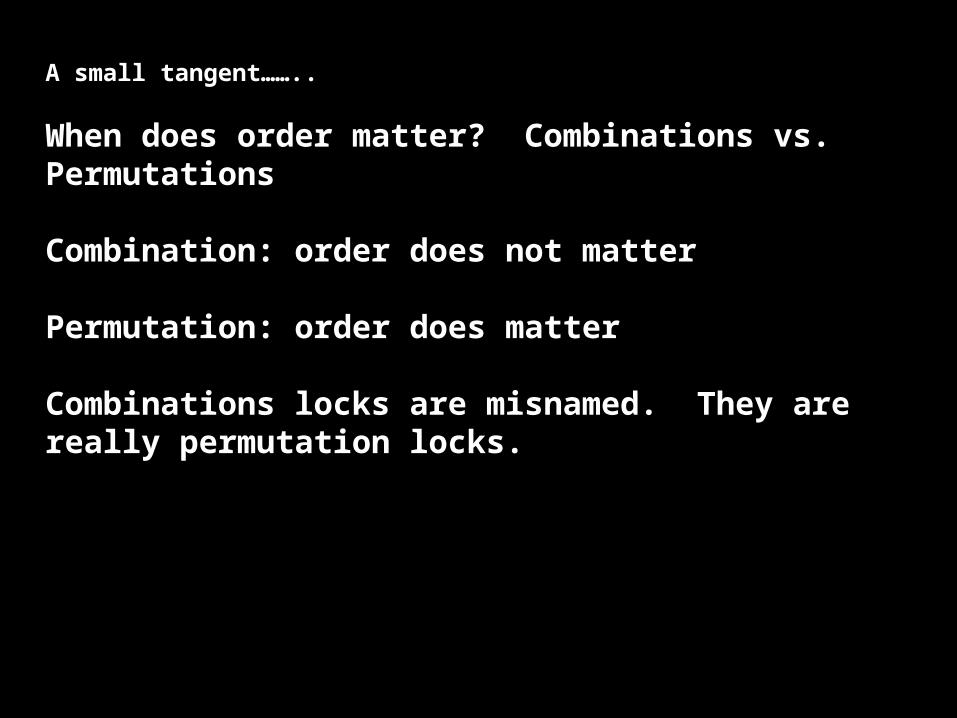
A small tangent……..
When does order matter? Combinations vs. Permutations
Combination: order does not matter
Permutation: order does matter
Combinations locks are misnamed. They are really permutation locks.
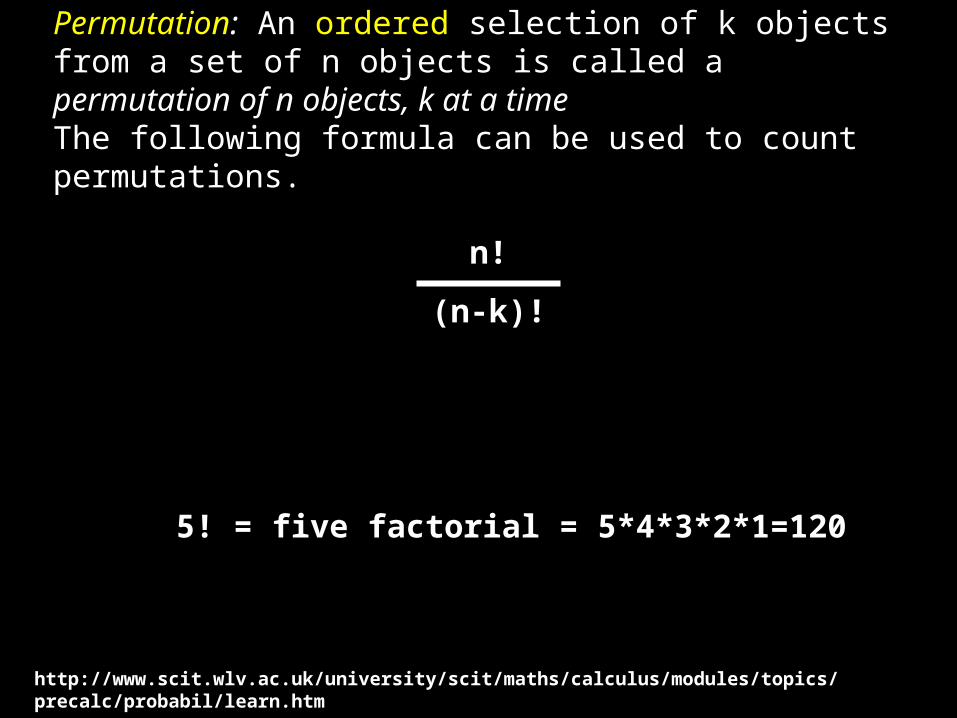
Permutation: An ordered selection of k objects from a set of n objects is called a permutation of n objects, k at a time The following formula can be used to count permutations.
n!
(n-k)!
5! = five factorial = 5*4*3*2*1=120
http://www.scit.wlv.ac.uk/university/scit/maths/calculus/modules/topics/precalc/probabil/learn.htm
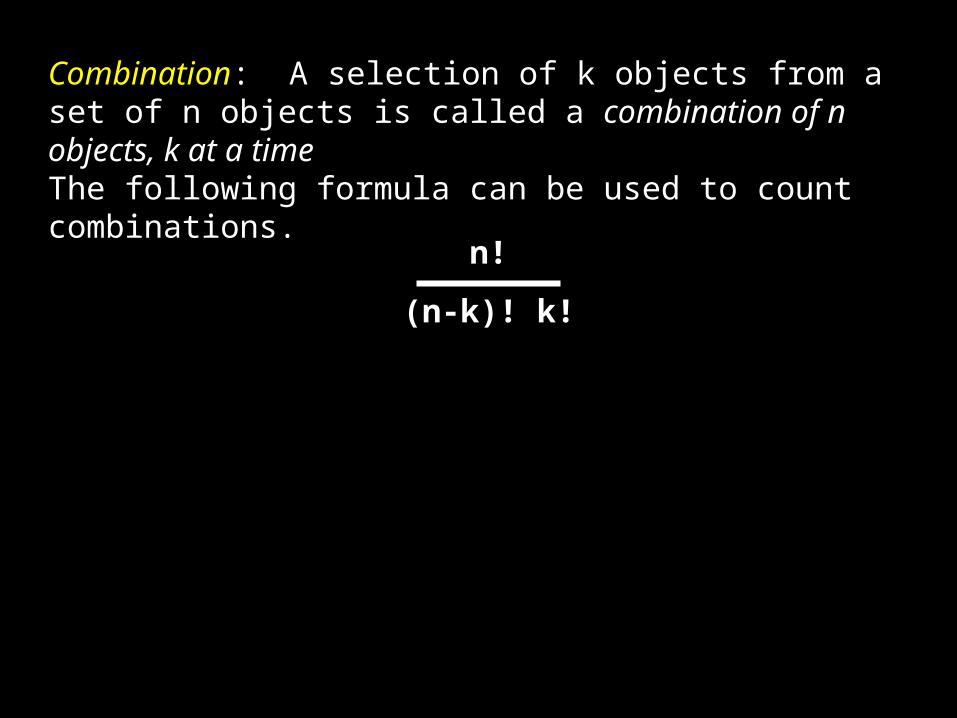
Combination: A selection of k objects from a set of n objects is called a combination of n objects, k at a time The following formula can be used to count combinations.
n!
(n-k)! k!
Another small tangent……..
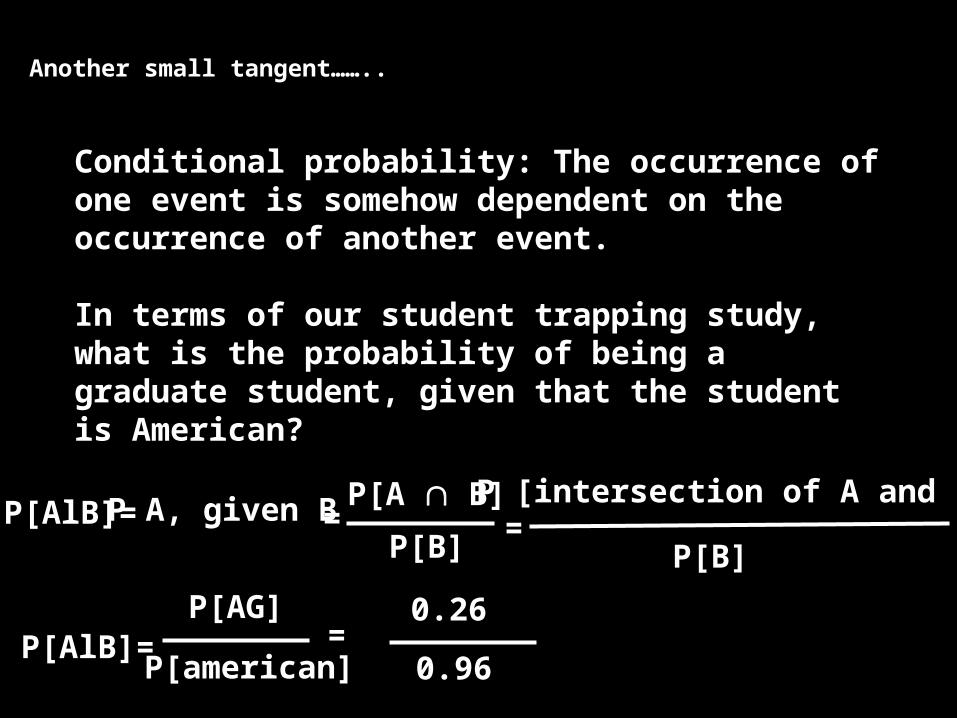
Conditional probability: The occurrence of one event is somehow dependent on the occurrence of another event.
In terms of our student trapping study, what is the probability of being a graduate student, given that the student is American?
P[AlB]=P[A B]
P[B]
P [intersection of A and B]
P[B]
P[AlB]=P[AG]
P[american]
=
=
P A, given B =
0.26
0.96
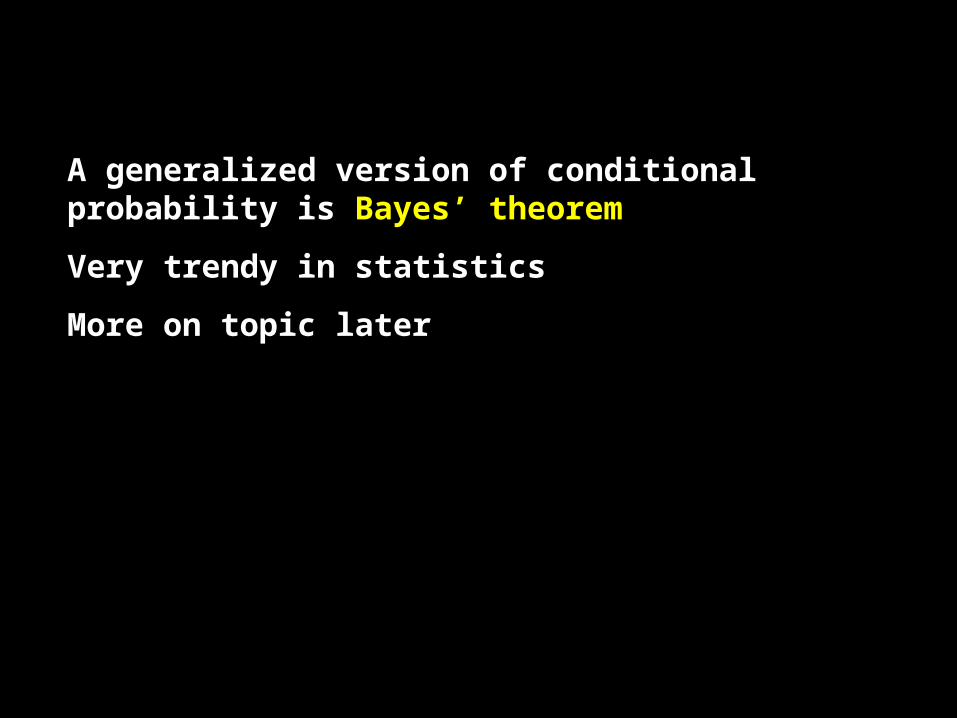
A generalized version of conditional probability is Bayes’ theorem
Very trendy in statistics
More on topic later
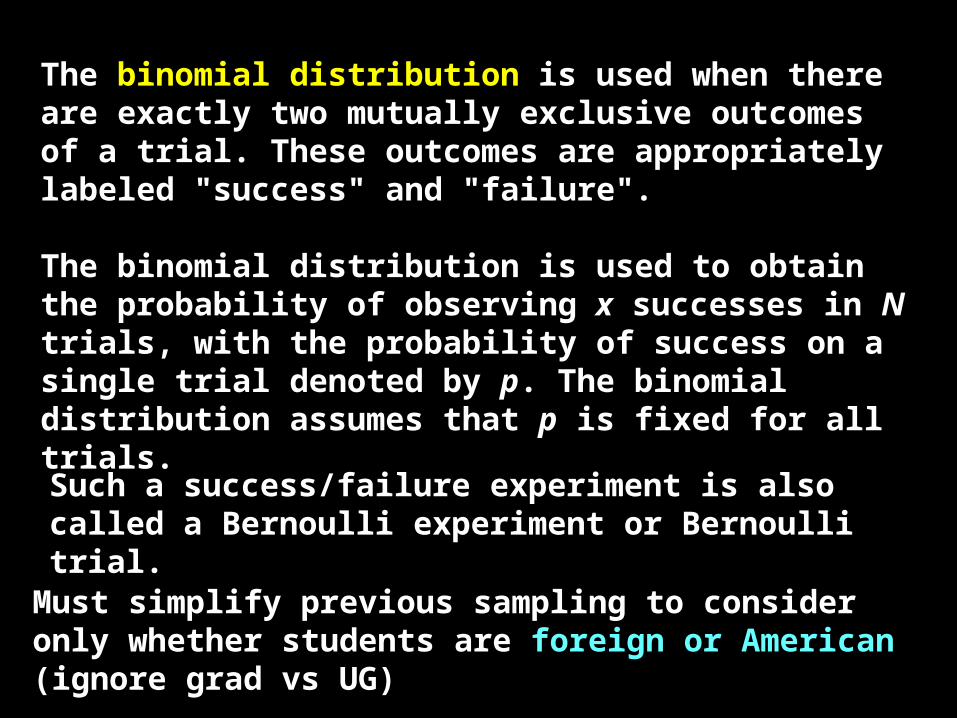
The binomial distribution is used when there are exactly two mutually exclusive outcomes of a trial. These outcomes are appropriately labeled "success" and "failure".
The binomial distribution is used to obtain the probability of observing x successes in N trials, with the probability of success on a single trial denoted by p. The binomial distribution assumes that p is fixed for all trials.
Must simplify previous sampling to consider only whether students are foreign or American (ignore grad vs UG)
Such a success/failure experiment is also called a Bernoulli experiment or Bernoulli trial.
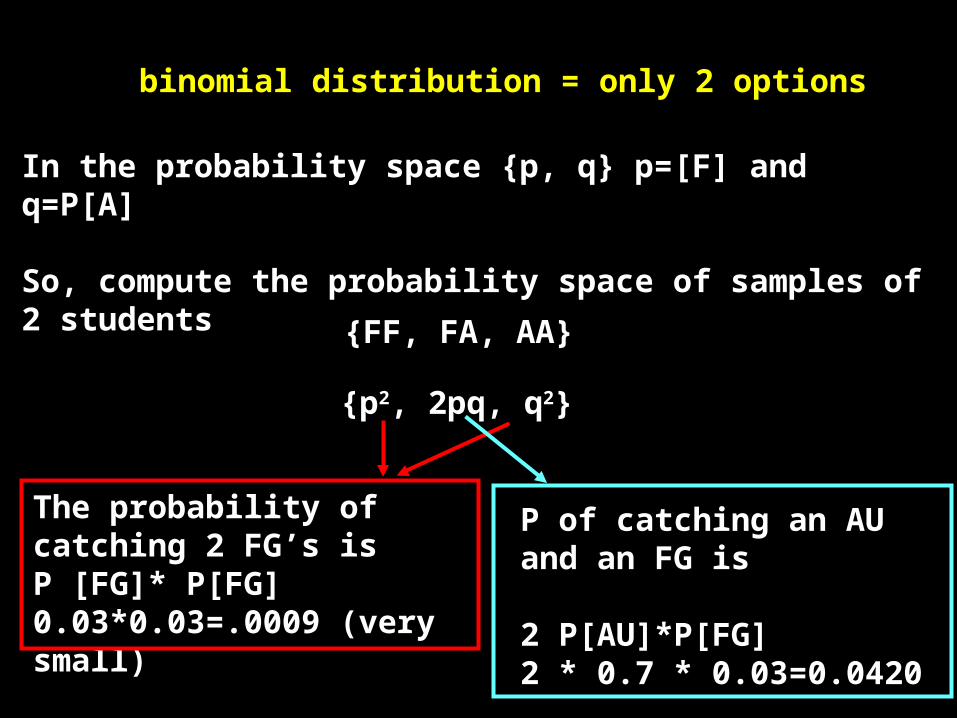
binomial distribution = only 2 options
In the probability space {p, q} p=[F] and q=P[A]
So, compute the probability space of samples of 2 students
{FF, FA, AA}
{p2, 2pq, q2}
The probability of catching 2 FG’s isP [FG]* P[FG] 0.03*0.03=.0009 (very small)
P of catching an AU and an FG is
2 P[AU]*P[FG]2 * 0.7 * 0.03=0.0420
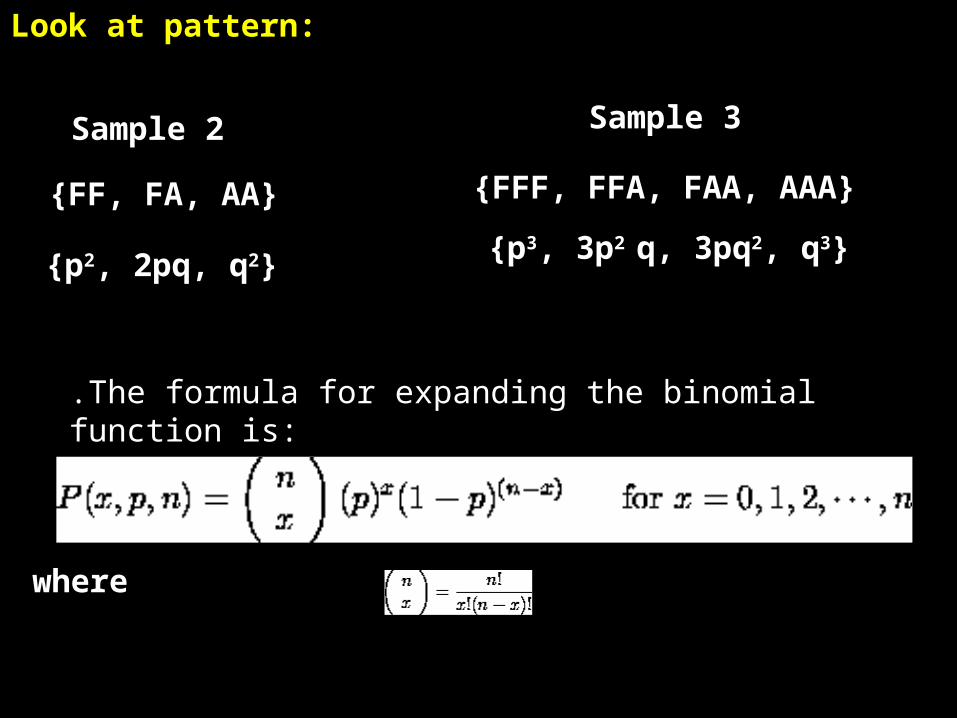
.The formula for expanding the binomial function is:
where
{FF, FA, AA}
{p2, 2pq, q2}
Look at pattern:
{FFF, FFA, FAA, AAA}
{p3, 3p2 q, 3pq2, q3}
Sample 2 Sample 3
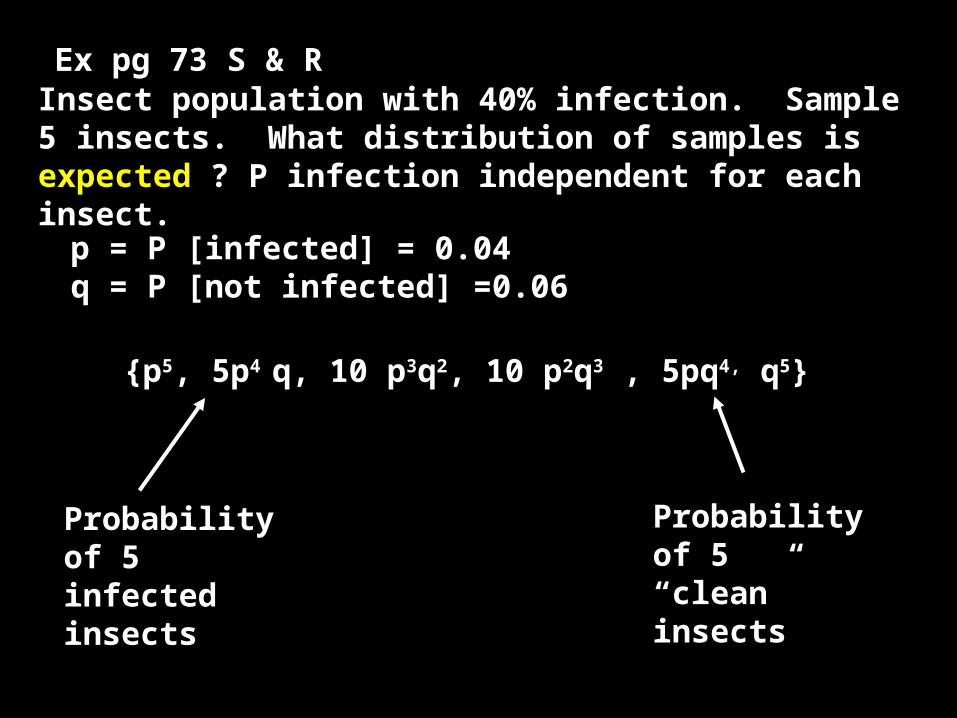
Ex pg 73 S & R
{p5, 5p4 q, 10 p3q2, 10 p2q3 , 5pq4, q5}
Insect population with 40% infection. Sample 5 insects. What distribution of samples is expected ? P infection independent for each insect.
p = P [infected] = 0.04q = P [not infected] =0.06
Probability of 5 infected insects
Probability of 5 “clean” insects
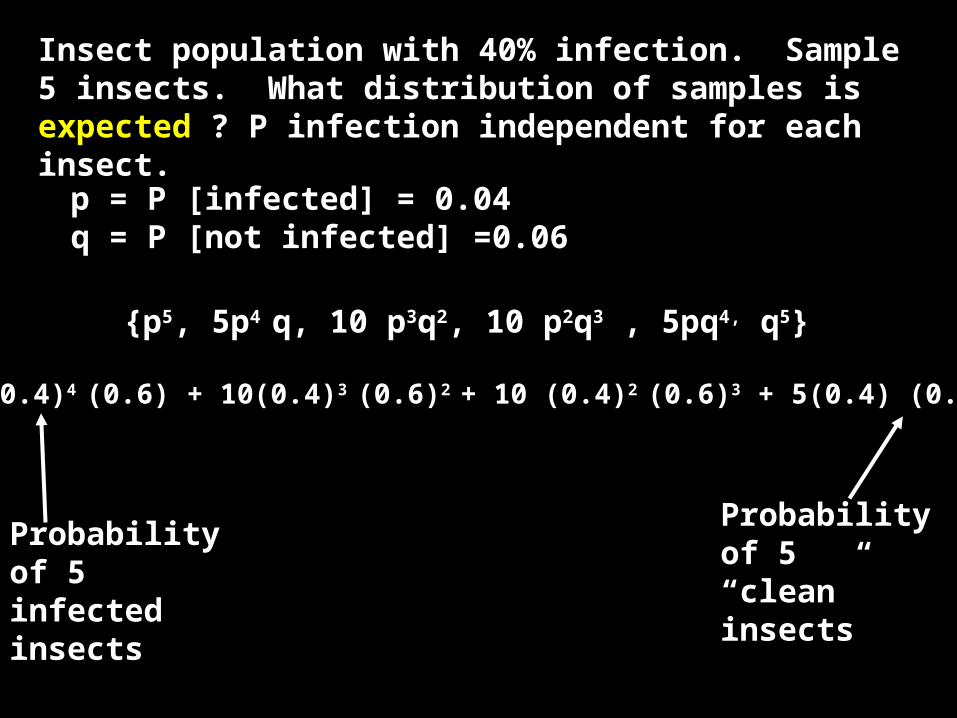
{p5, 5p4 q, 10 p3q2, 10 p2q3 , 5pq4, q5}
Insect population with 40% infection. Sample 5 insects. What distribution of samples is expected ? P infection independent for each insect.
p = P [infected] = 0.04q = P [not infected] =0.06
(0.4)5 + 5(0.4)4 (0.6) + 10(0.4)3 (0.6)2 + 10 (0.4)2 (0.6)3 + 5(0.4) (0.6)4 + (0.6)5
Probability of 5 infected insects
Probability of 5 “clean” insects
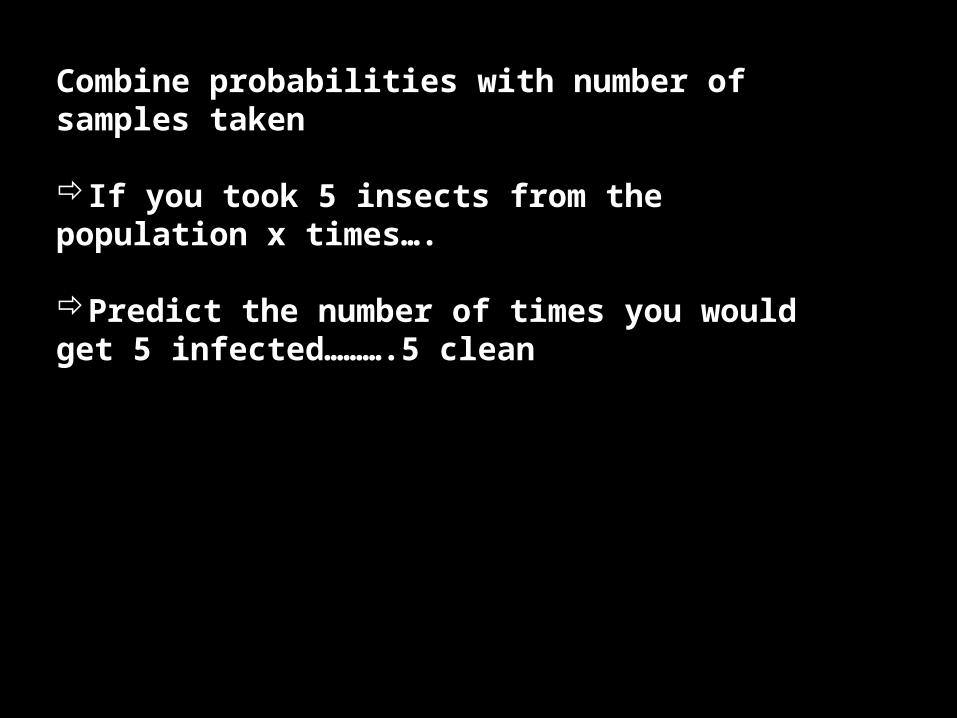
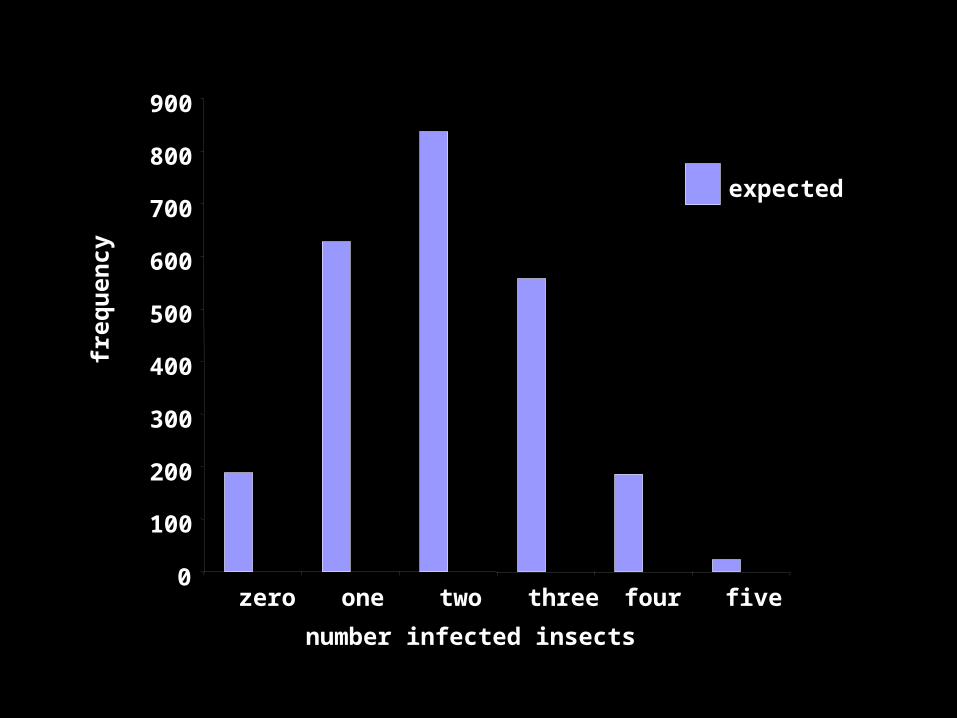
Combine probabilities with number of samples taken
If you took 5 insects from the population x times….
Predict the number of times you would get 5 infected……….5 clean
0
100
200
300
400
500
600
700
800
900
zero one two three four five
number infected insects
freq
uen
cy
expected
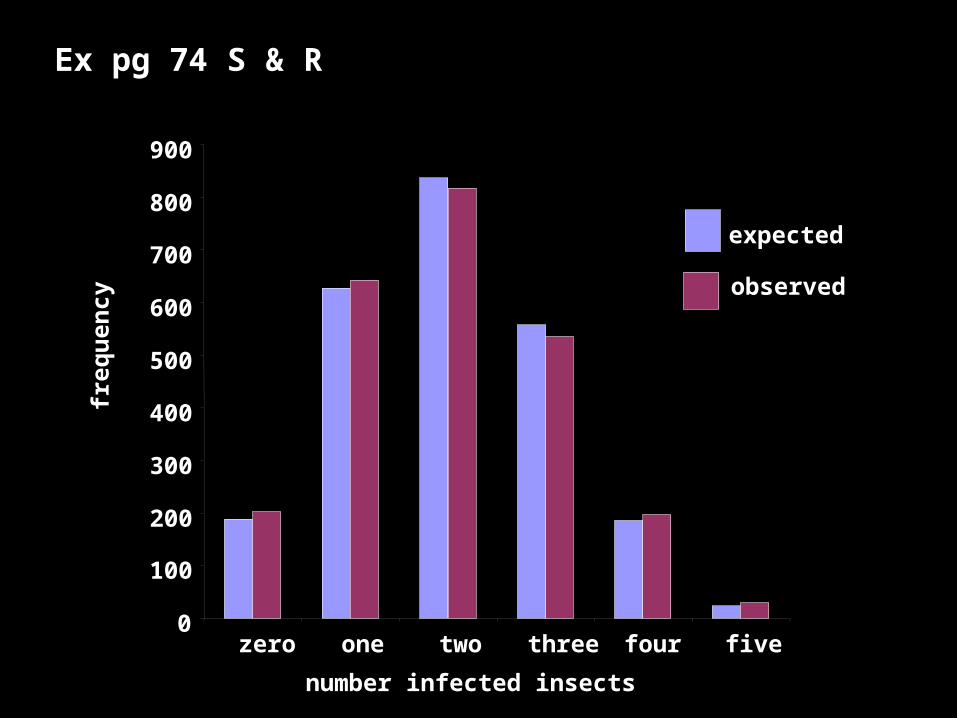
Compare your expected frequency to a real, observed frequency when you actually collect the samples
How well do they match up?
0
100
200
300
400
500
600
700
800
900
zero one two three four five
number infected insects
freq
uen
cy
expected
observed
Ex pg 74 S & R
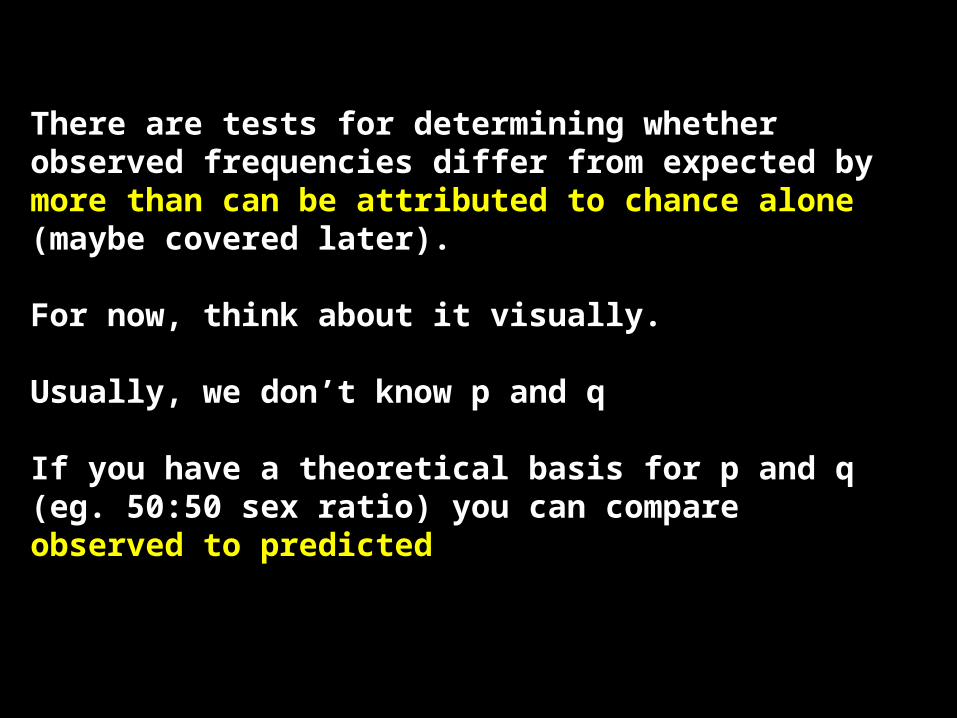
There are tests for determining whether observed frequencies differ from expected by more than can be attributed to chance alone (maybe covered later).
For now, think about it visually.
Usually, we don’t know p and q
If you have a theoretical basis for p and q (eg. 50:50 sex ratio) you can compare observed to predicted