http:// watch the world grow
TRANSCRIPT
• http://www.100people.org/statistics_100stats.php?section=statistics• http://desip.igc.org/mapanim.html• Watch the world grow• http://www.ined.fr/en/everything_about_population/animations/world_population/• Teaching human population animation• http://www.youtube.com/watch?v=kDK1OaFvtls• Hans brief mortality; Statistics in Motion• http://www.poodwaddle.com/clocks/worldclock/• Statistics• http://www.youtube.com/watch?v=PHmwZ96_Gos&feature=player_embedded• 5 min version of shift happens (better music)• http://www.youtube.com/watch?v=pMcfrLYDm2U&feature=player_embedded• 8:19 version of shift happens, original; better for pops (slow music)
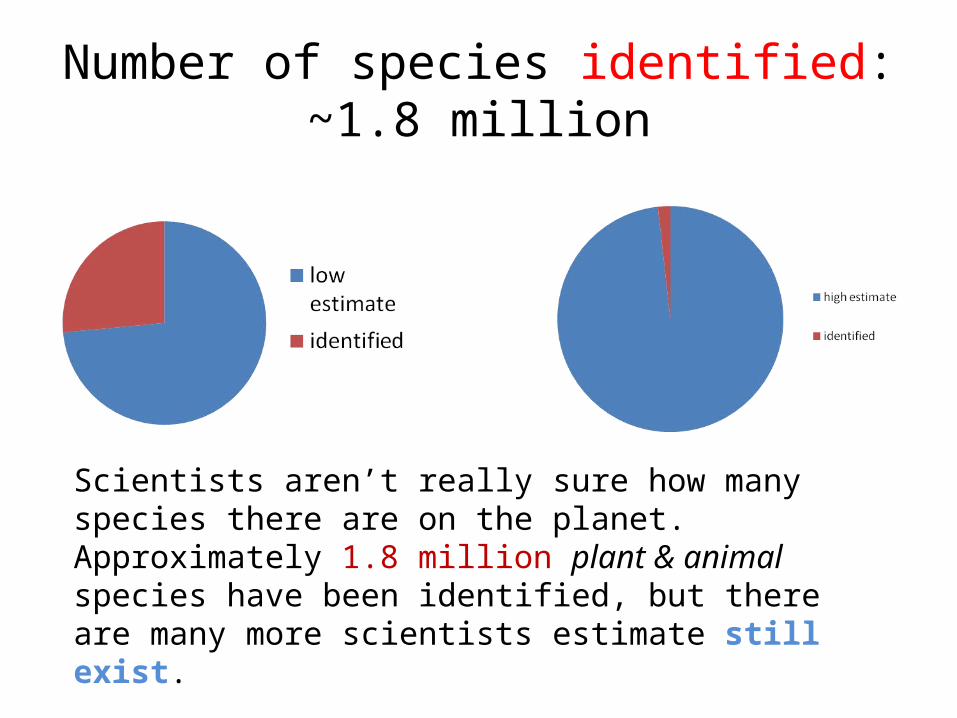
Number of species identified: ~1.8 million
Scientists aren’t really sure how many species there are on the planet. Approximately 1.8 million plant & animal species have been identified, but there are many more scientists estimate still exist.
5 million (low) – 100 million (high) estimate
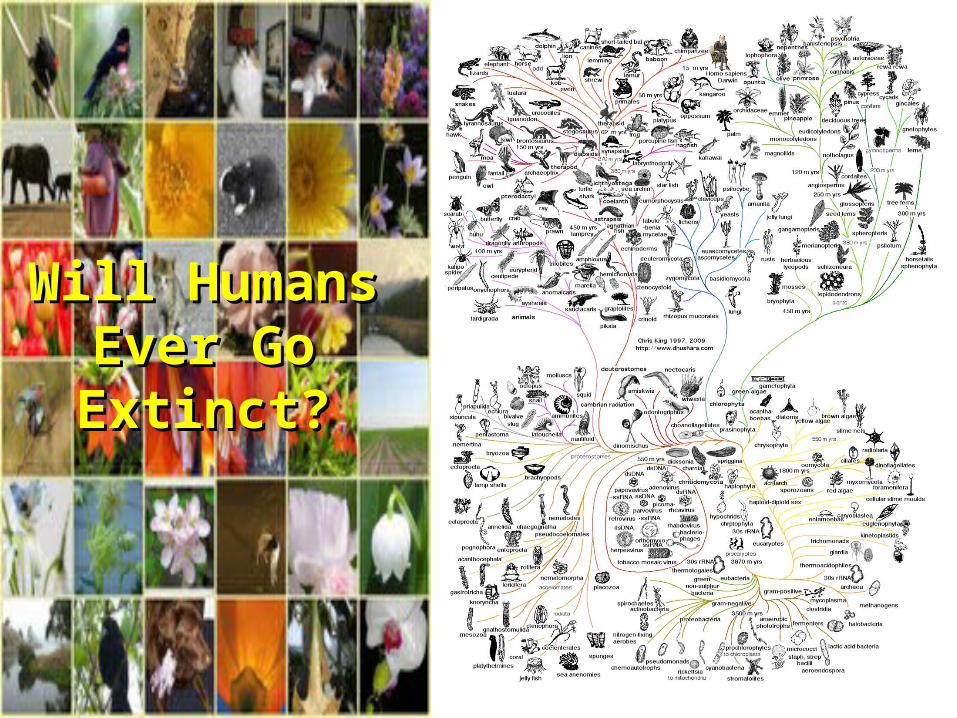
Will Humans Will Humans Ever Go Ever Go Extinct?Extinct?
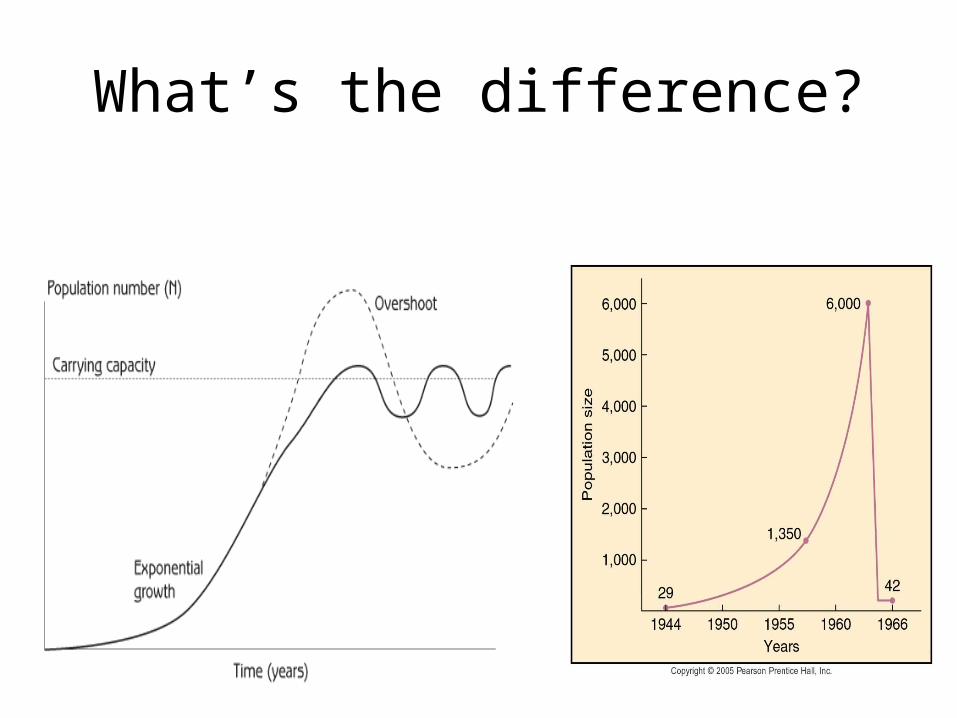
What’s the difference?

History of population growth
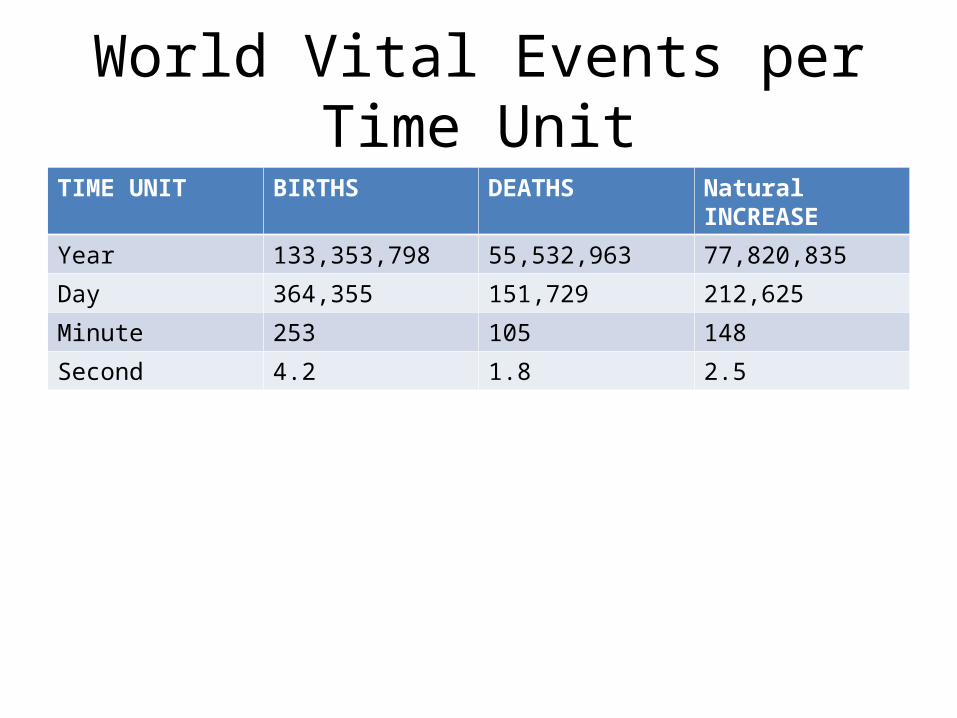
World Vital Events per Time UnitTIME UNIT BIRTHS DEATHS Natural INCREASE
Year 133,353,798 55,532,963 77,820,835
Day 364,355 151,729 212,625
Minute 253 105 148
Second 4.2 1.8 2.5

Populations • Is a J-shaped growth curve sustainable?• What factors will limit it?• What are the benefits of having a large
population?• What are the drawbacks of having a large
population?• How have humans (K-strategists) achieved a J-
shaped curve instead of an S?
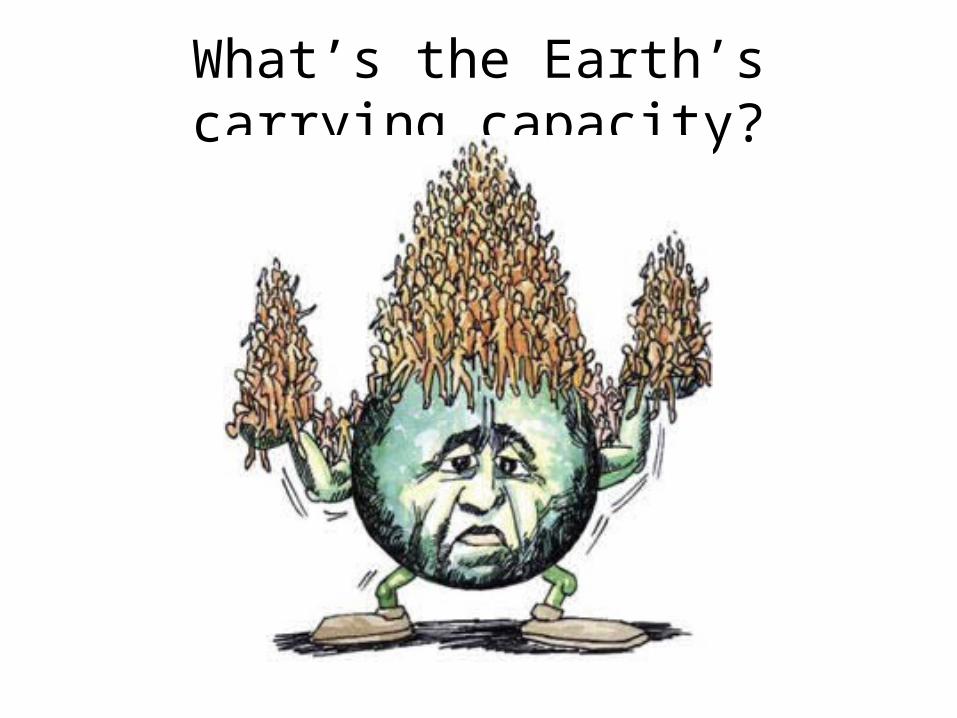
What’s the Earth’s carrying capacity?
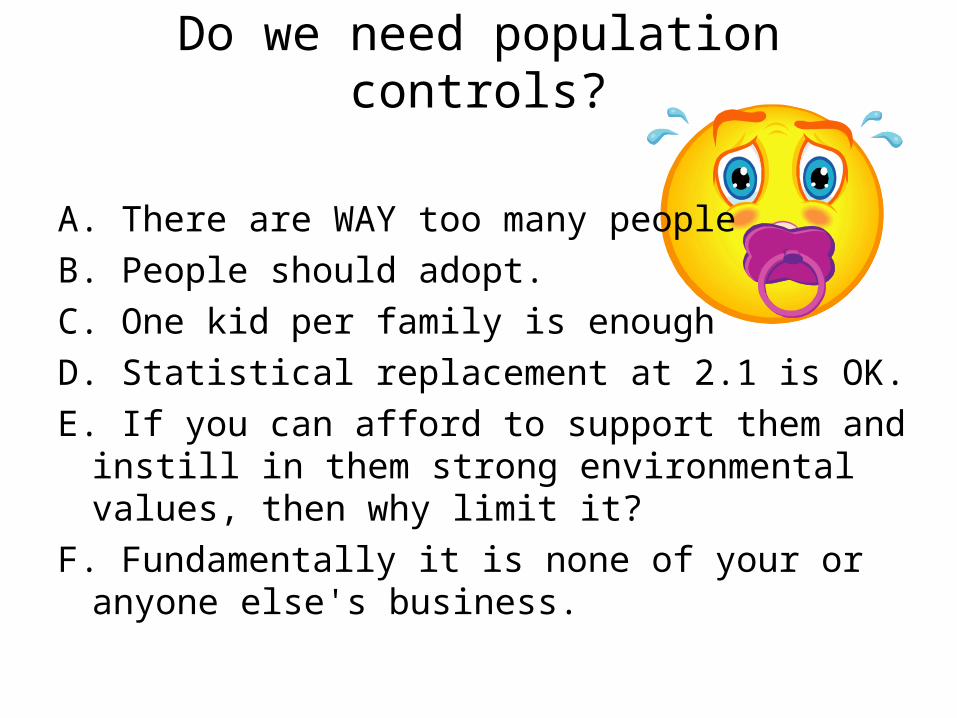
Do we need population controls?
A. There are WAY too many peopleB. People should adopt.C. One kid per family is enoughD. Statistical replacement at 2.1 is OK.E. If you can afford to support them and instill in them
strong environmental values, then why limit it?F. Fundamentally it is none of your or anyone else's
business.
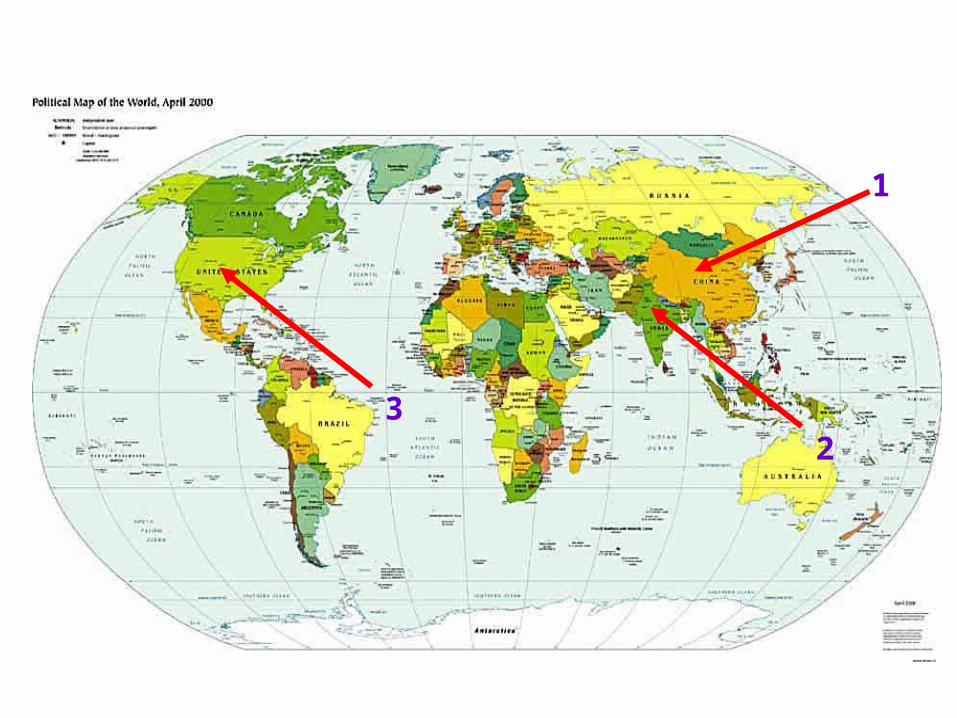
1
23

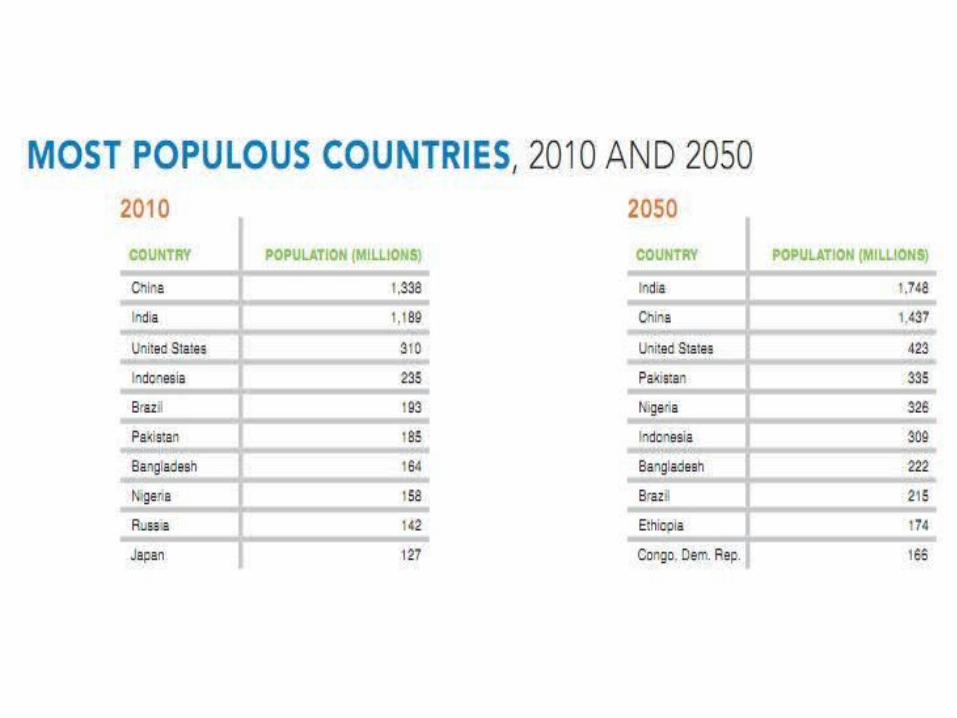
Top countries36% of world population
4.5%

DEVELOPED VS DEVELOPING
What does each mean?
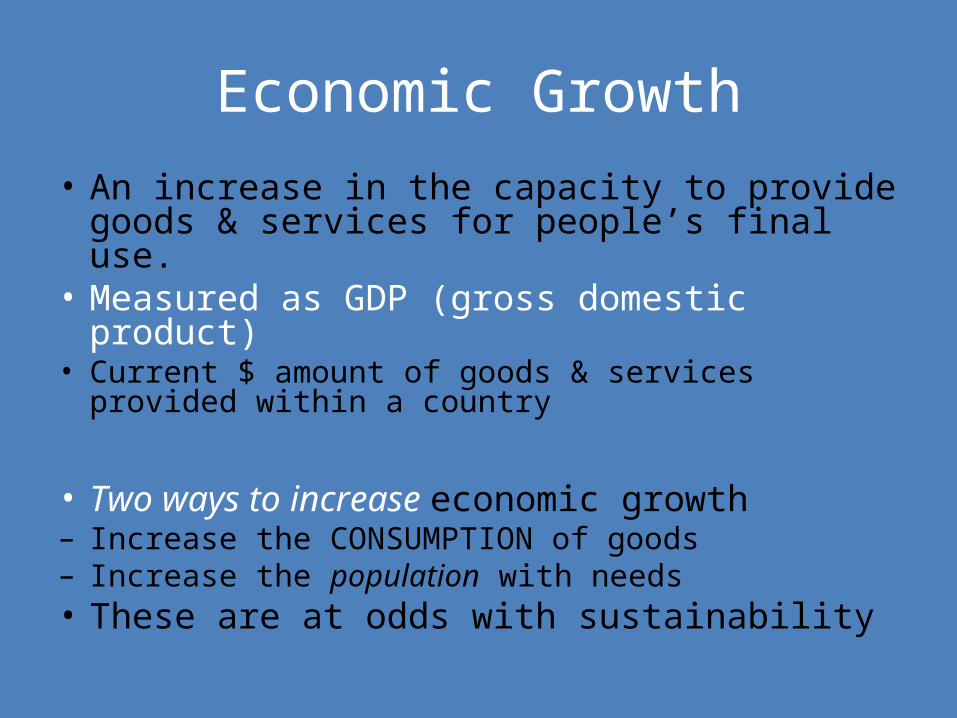
Economic Growth
• An increase in the capacity to provide goods & services for people’s final use.
• Measured as GDP (gross domestic product)• Current $ amount of goods & services provided within a
country
• Two ways to increase economic growth– Increase the CONSUMPTION of goods– Increase the population with needs• These are at odds with sustainability
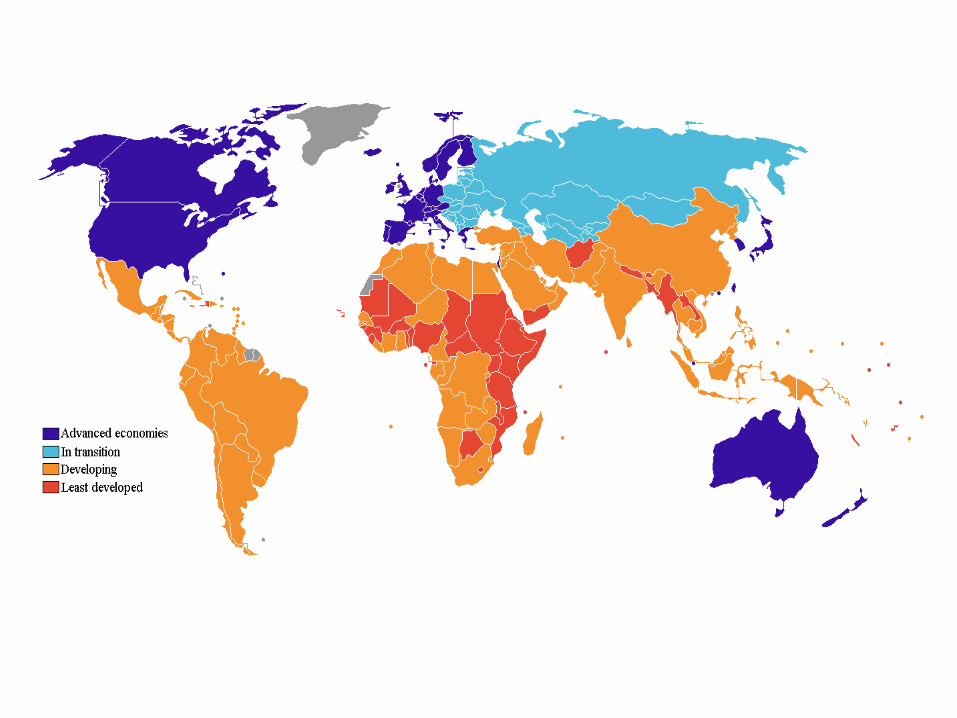

Developing vs. Developed
• Per capita GNP <$4,000• Low to moderate
industrialization• Rural, agricultural,
illiterate, poor• 80% of world’s
population– 50% of population is under
age 15– 15% of wealth– 10-20% of resource usage
• Per capita GNP >$4,000• Highly industrialized• Urban, industrial,
educated, & wealthy
• 20% of world’s population– 85% of wealth– 80 - 90% of resource usage– 75% of the pollution (90%
of hazardous waste)
• Annual growth rate– US population growth rate…0.963%
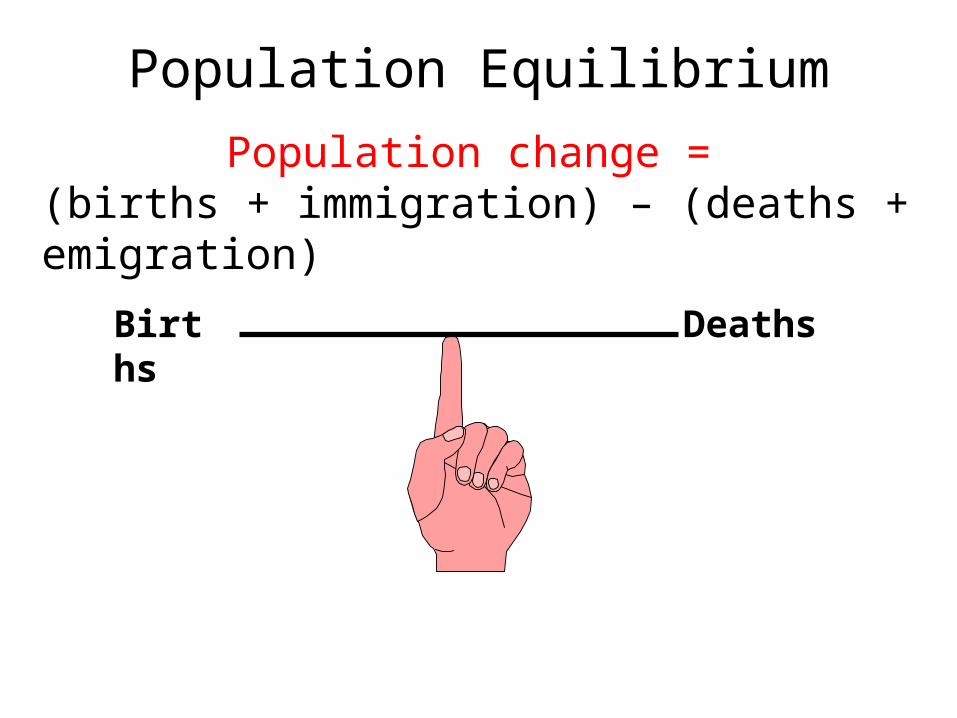
Population Equilibrium
Births Deaths
Population change = (births + immigration) – (deaths + emigration)
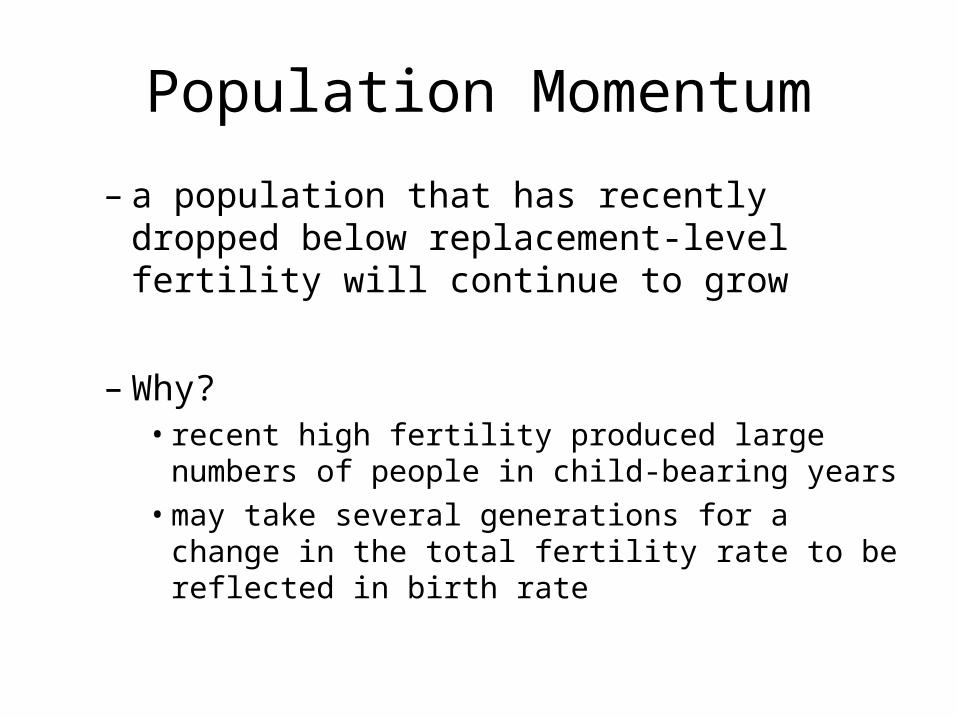
Population Momentum
– a population that has recently dropped below replacement-level fertility will continue to grow
– Why?• recent high fertility produced large numbers of people
in child-bearing years • may take several generations for a change in the total
fertility rate to be reflected in birth rate
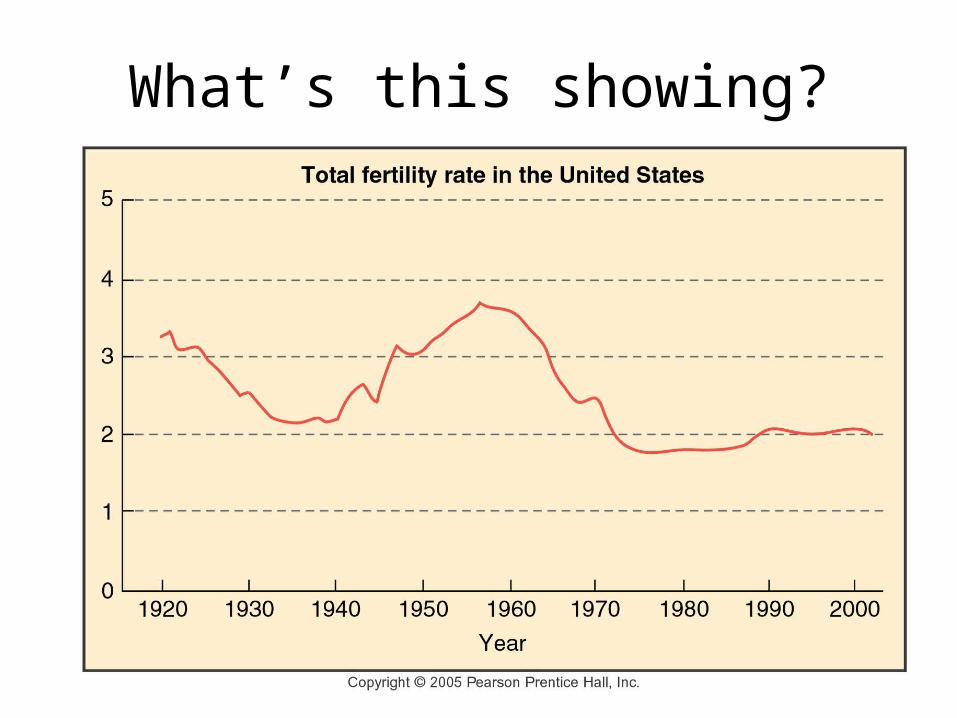
What’s this showing?
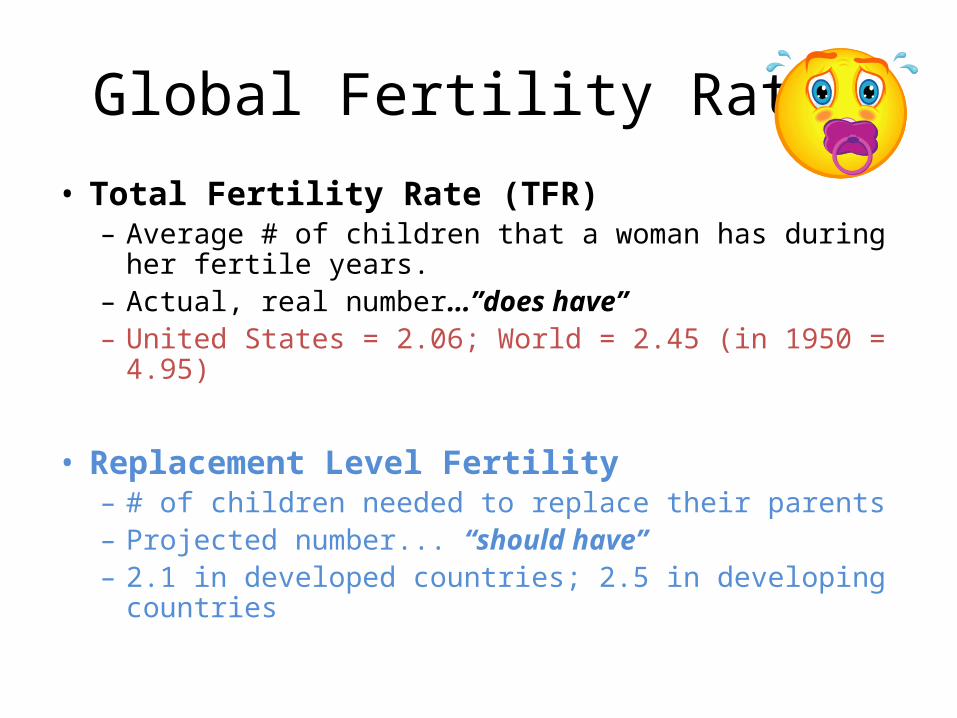
Global Fertility Rates
• Total Fertility Rate (TFR)– Average # of children that a woman has during her fertile
years.– Actual, real number…”does have” – United States = 2.06; World = 2.45 (in 1950 = 4.95)
• Replacement Level Fertility – # of children needed to replace their parents– Projected number... “should have”– 2.1 in developed countries; 2.5 in developing countries
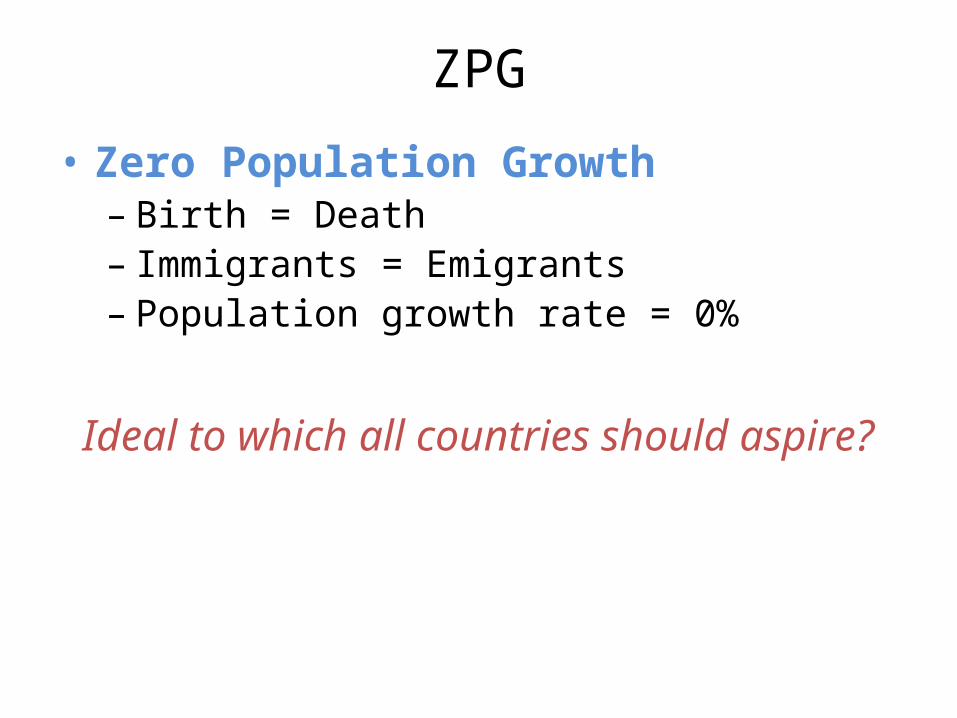
ZPG
• Zero Population Growth– Birth = Death– Immigrants = Emigrants– Population growth rate = 0%
Ideal to which all countries should aspire?
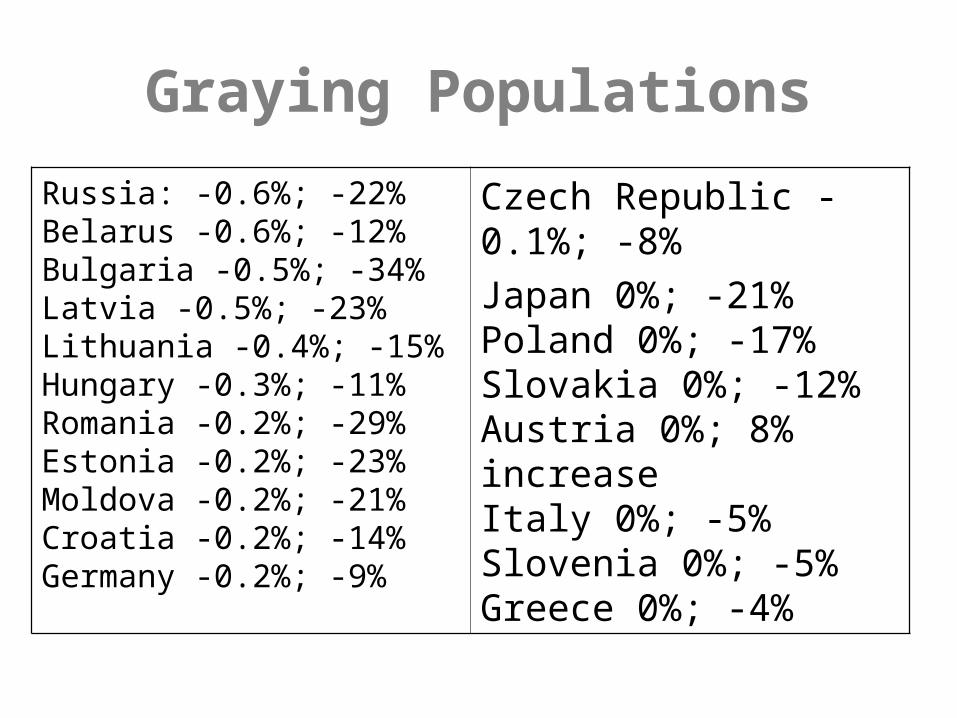
Graying Populations
Russia: -0.6%; -22%Belarus -0.6%; -12%Bulgaria -0.5%; -34%Latvia -0.5%; -23%Lithuania -0.4%; -15%Hungary -0.3%; -11%Romania -0.2%; -29%Estonia -0.2%; -23%Moldova -0.2%; -21%Croatia -0.2%; -14%Germany -0.2%; -9%
Czech Republic -0.1%; -8% Japan 0%; -21%Poland 0%; -17%Slovakia 0%; -12%Austria 0%; 8% increaseItaly 0%; -5%Slovenia 0%; -5%Greece 0%; -4%
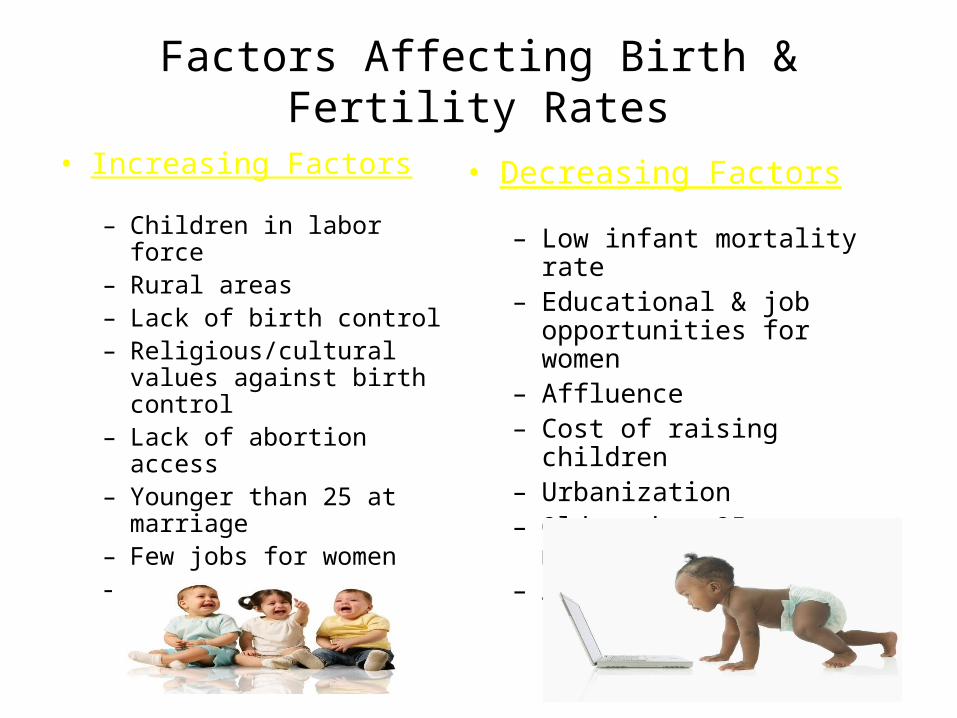
Factors Affecting Birth & Fertility Rates
• Increasing Factors
– Children in labor force– Rural areas– Lack of birth control– Religious/cultural values
against birth control– Lack of abortion access– Younger than 25 at marriage– Few jobs for women– Lack of educational
opportunities
• Decreasing Factors
– Low infant mortality rate– Educational & job opportunities
for women– Affluence– Cost of raising children– Urbanization– Older than 25 at marriage– Availability of pension systems
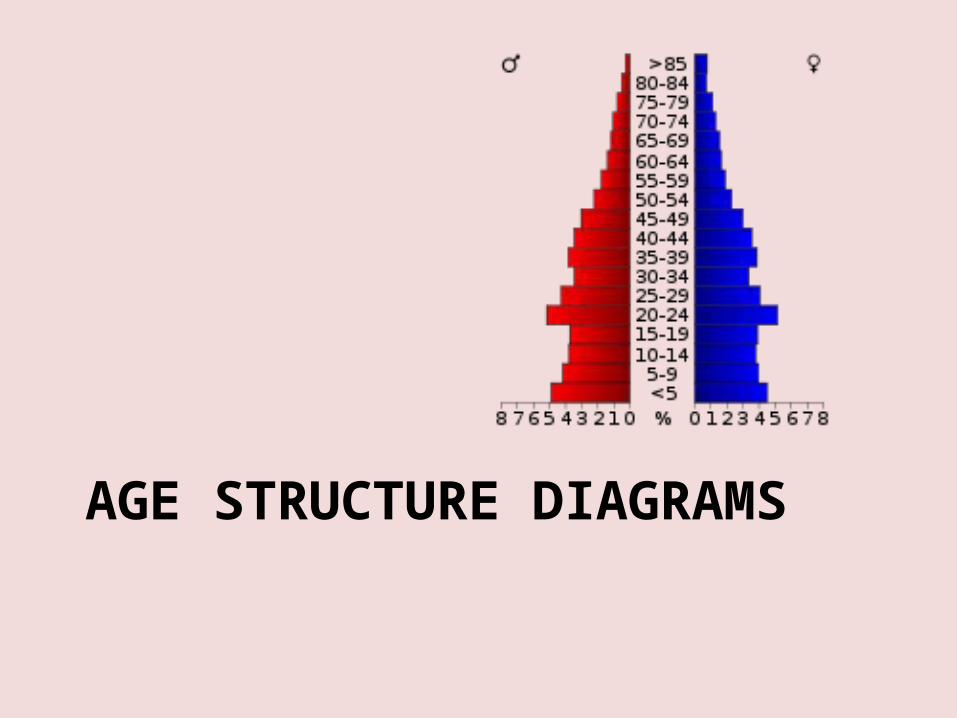
AGE STRUCTURE DIAGRAMS
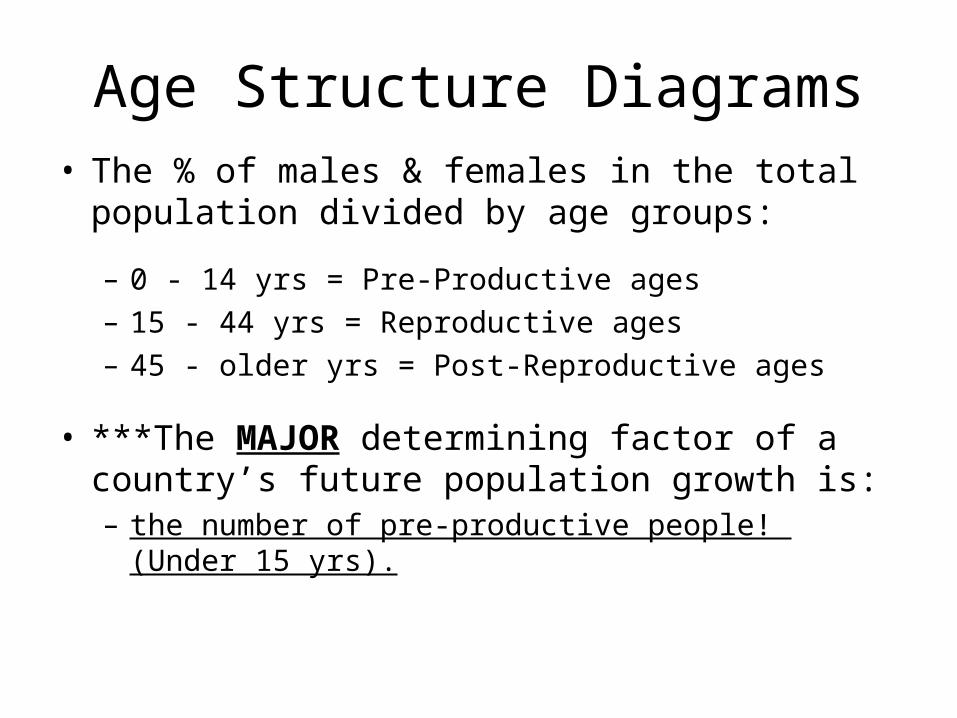
Age Structure Diagrams• The % of males & females in the total population
divided by age groups:
– 0 - 14 yrs = Pre-Productive ages– 15 - 44 yrs = Reproductive ages– 45 - older yrs = Post-Reproductive ages
• ***The MAJOR determining factor of a country’s future population growth is: – the number of pre-productive people! (Under 15 yrs).
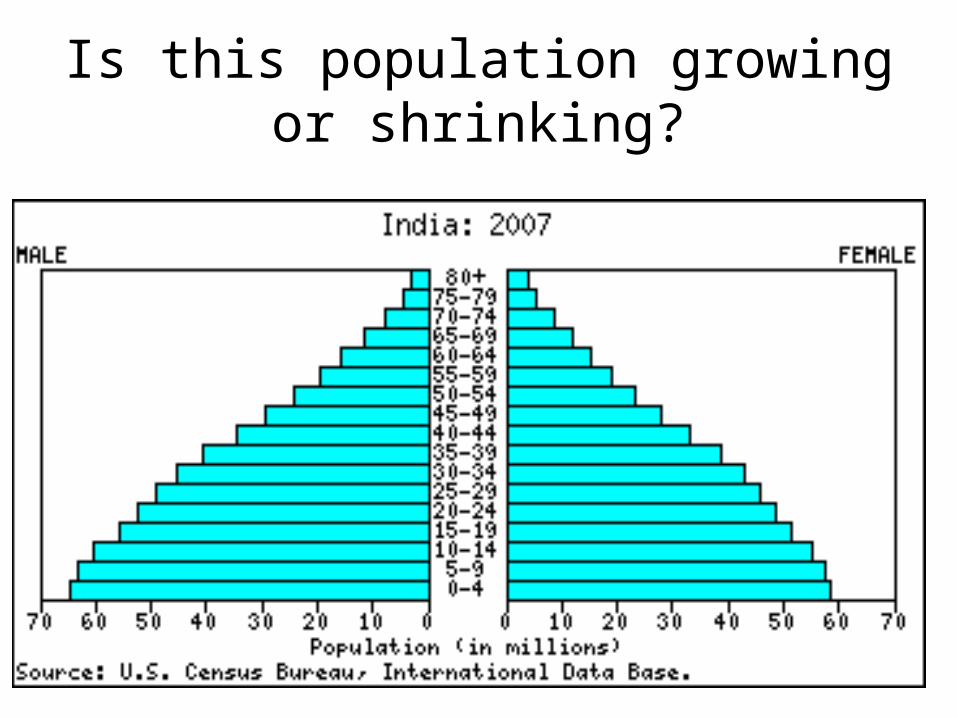
Is this population growing or shrinking?
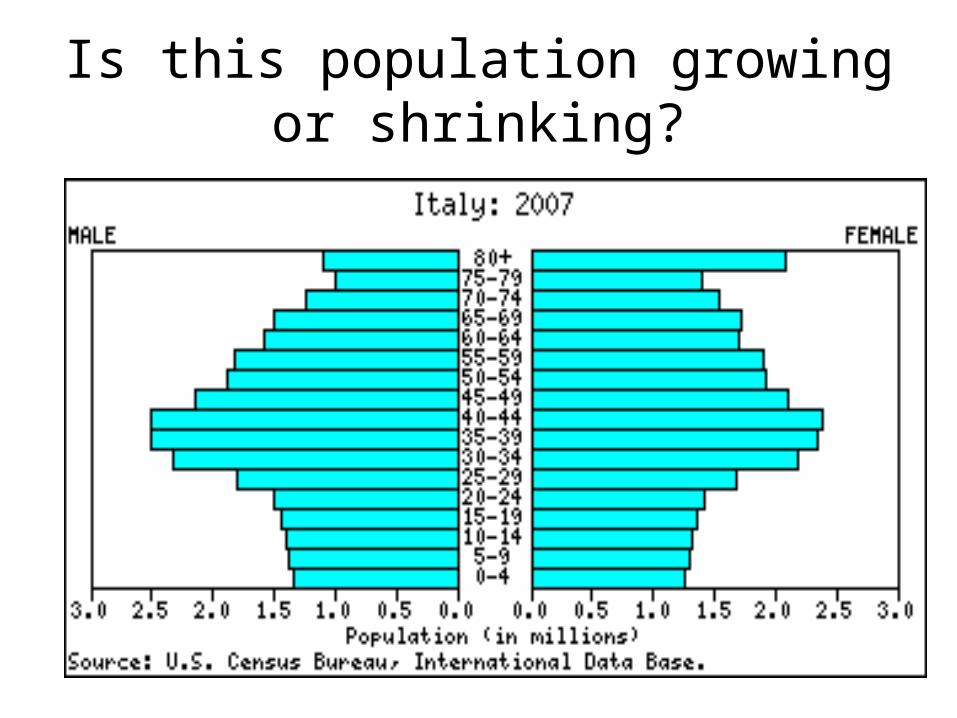
Is this population growing or shrinking?
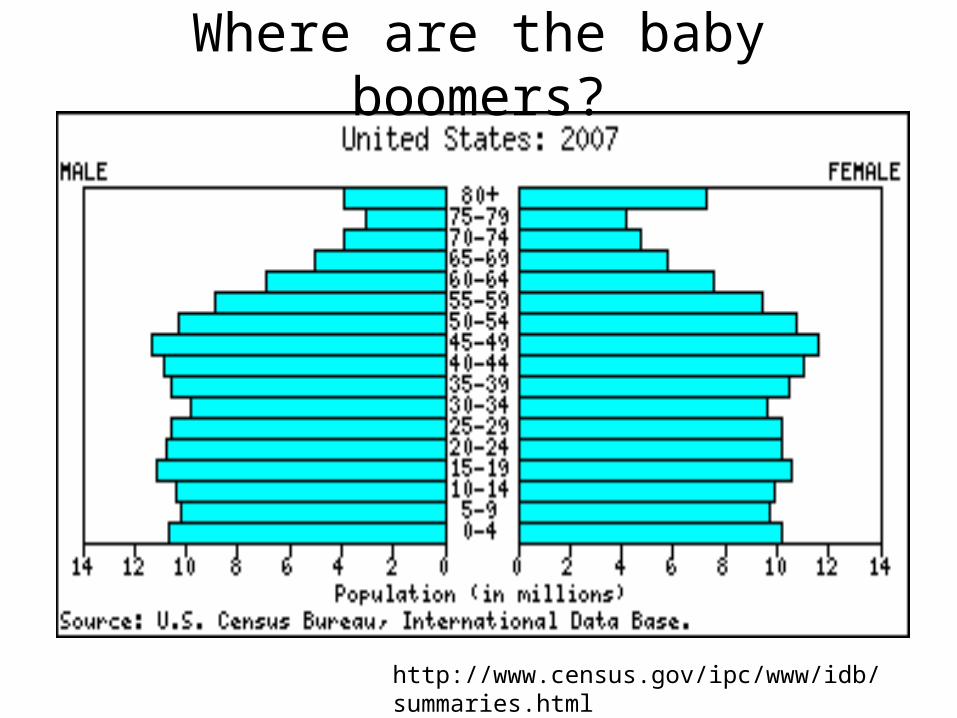
Where are the baby boomers?
http://www.census.gov/ipc/www/idb/summaries.html
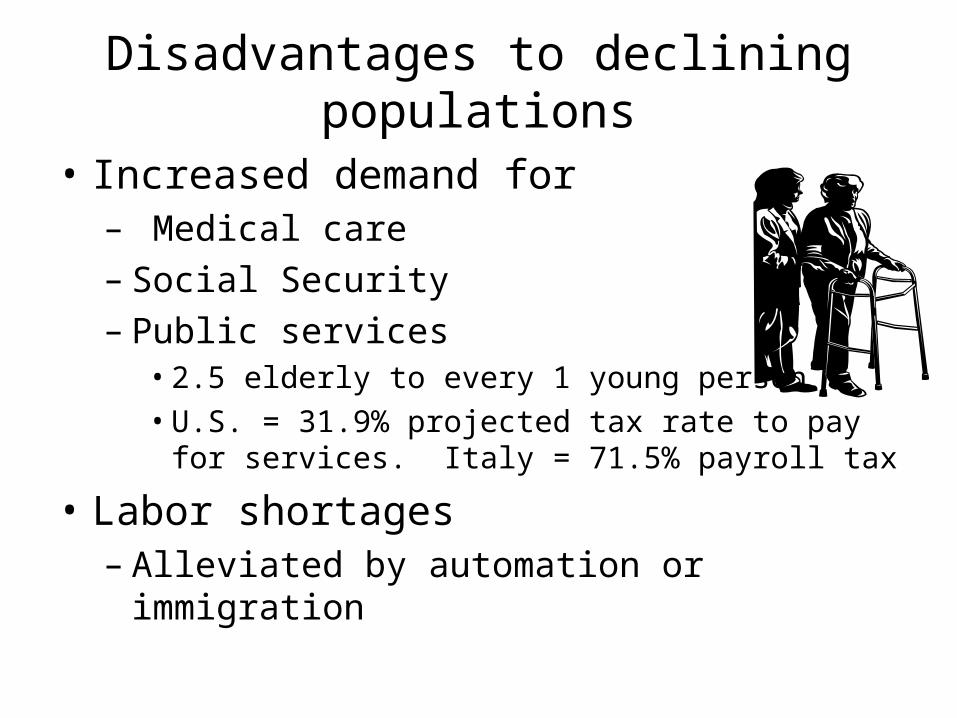
Disadvantages to declining populations
• Increased demand for– Medical care– Social Security– Public services• 2.5 elderly to every 1 young person• U.S. = 31.9% projected tax rate to pay for services. Italy
= 71.5% payroll tax
• Labor shortages– Alleviated by automation or immigration

Projecting Future Populations: Developed Countries
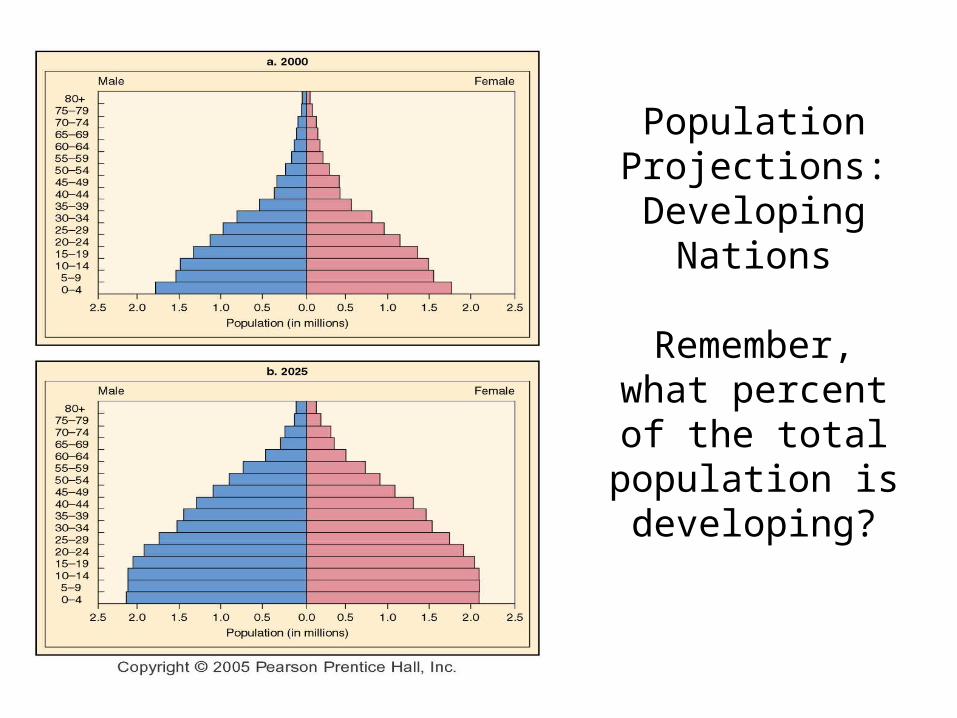
Population Projections: Developing
Nations
Remember, what percent of the
total population is developing?

Tragedy of the Commons

Congratulations!! Congratulations!! You’ve just won You’ve just won
$1,000,000!!$1,000,000!!• How can you sustain your wealth?– What’s that mean?– You never run out of that original 1 million
• Assume you invest this 1 million w/10% interest. How much can you spend annually and live sustainably? – $100,000….why?– What if you spend $200,000 a year? How soon
will your money be gone?

What is it?
• Commons = areas of land that belong to whole village
• People grazed cows/sheep there– put as many animals as they could
• “If I don’t use this resource someone else will”
So, what’s the problem?
• Short term interests of individuals vs.
• Long term well being of society
Sustainability
• meeting the needs of the present without damaging the environment or depleting a resource for future generations
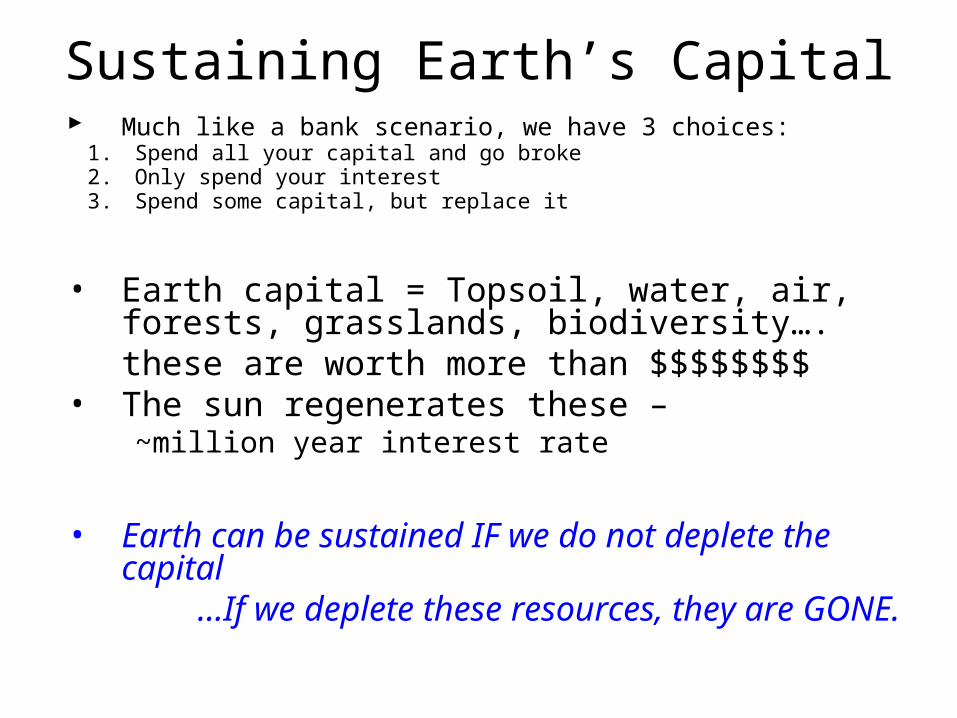
Sustaining Earth’s Capital Much like a bank scenario, we have 3 choices:
1. Spend all your capital and go broke2. Only spend your interest3. Spend some capital, but replace it
• Earth capital = Topsoil, water, air, forests, grasslands, biodiversity….
these are worth more than $$$$$$$$• The sun regenerates these –
~million year interest rate
• Earth can be sustained IF we do not deplete the capital
…If we deplete these resources, they are GONE.
• Begins with unregulated access to a resource owned by no one.
• Harvest based on largest amount over the shortest period of time.
• No thought given to sustainable harvests.
• Usually ends with no resource for anyone.
• http://www.youtube.com/watch?v=FuIxDMj3DNA
Tragedy of the Commons
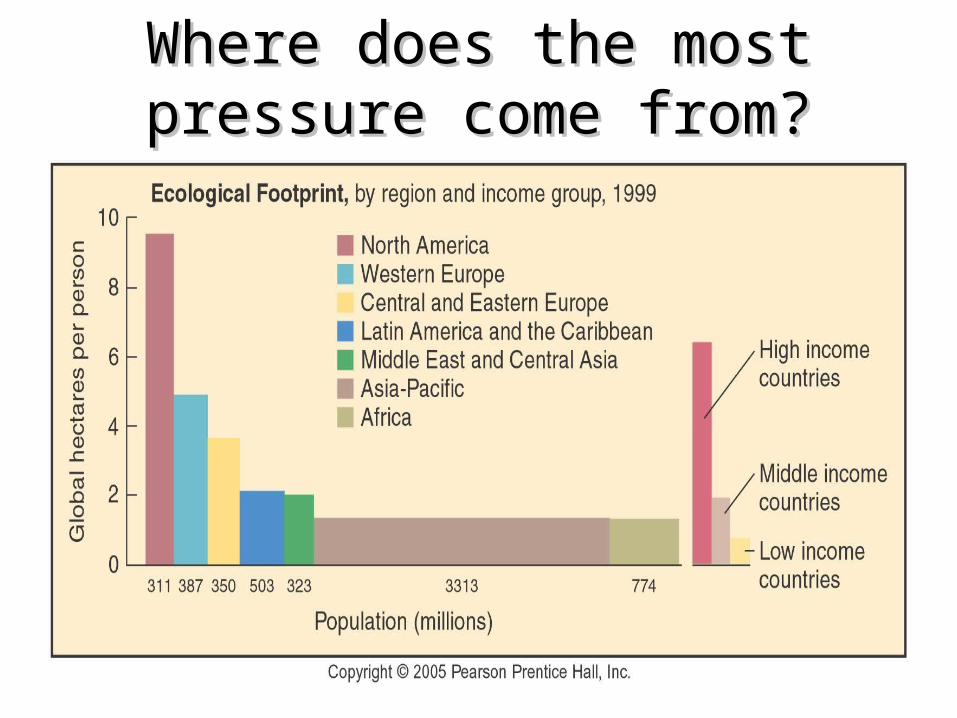
Where does the most pressure Where does the most pressure come from?come from?
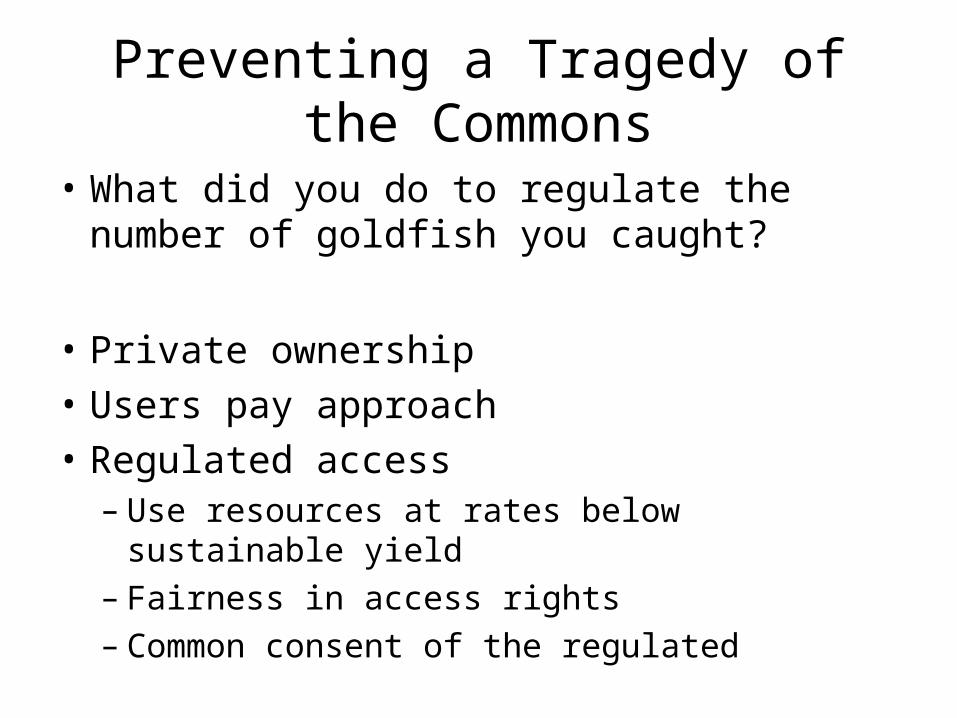
• What did you do to regulate the number of goldfish you caught?
• Private ownership• Users pay approach• Regulated access– Use resources at rates below sustainable yield– Fairness in access rights– Common consent of the regulated
Preventing a Tragedy of the Commons
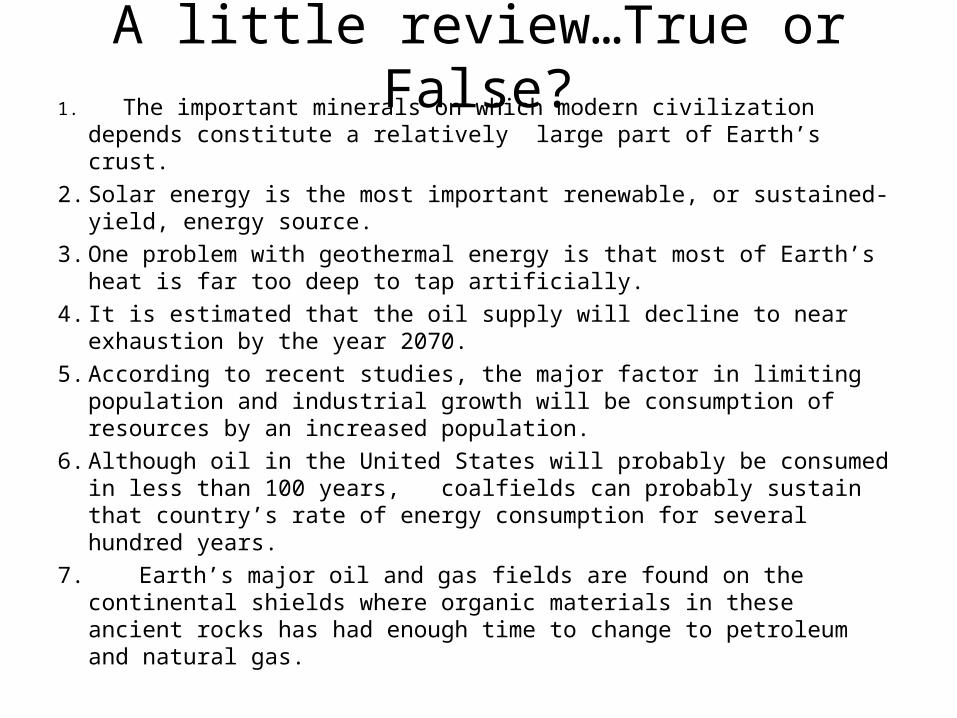
A little review…True or False?1. The important minerals on which modern civilization depends constitute a
relatively large part of Earth’s crust.2. Solar energy is the most important renewable, or sustained-yield, energy
source.3. One problem with geothermal energy is that most of Earth’s heat is far
too deep to tap artificially.4. It is estimated that the oil supply will decline to near exhaustion by the
year 2070.5. According to recent studies, the major factor in limiting population and
industrial growth will be consumption of resources by an increased population.
6. Although oil in the United States will probably be consumed in less than 100 years, coalfields can probably sustain that country’s rate of energy consumption for several hundred years.
7. Earth’s major oil and gas fields are found on the continental shields where organic materials in these ancient rocks has had enough time to change to petroleum and natural gas.
Answers
1. False2. True3. True4. True5. True6. True7. False (much younger rocks)
• Sustainable Society– Manages its economy & population size without
using the resources to the point of failing to replenish.
• Earth Capital = Earth’s air, water, soil, wildlife, minerals, fossil fuels…etc…
Living Sustainably
• Common property resources – Owned by no one (or everyone) for free
• Clean air, open ocean, its fish, migratory birds, public lands
Tragedy of the Commons

CHINA’S 1-CHILD POLICY
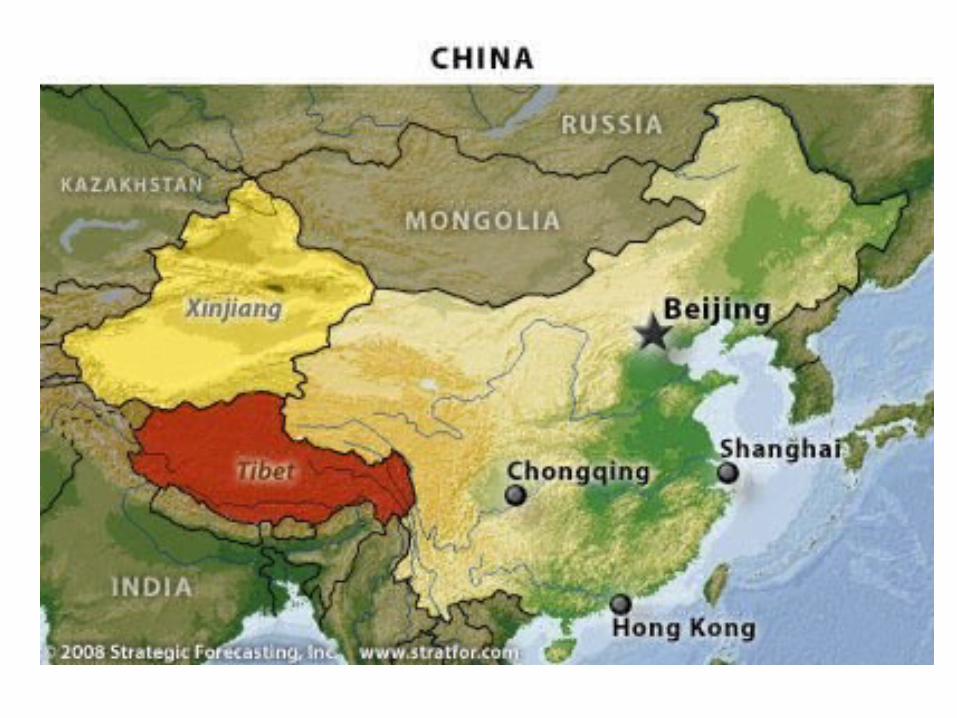
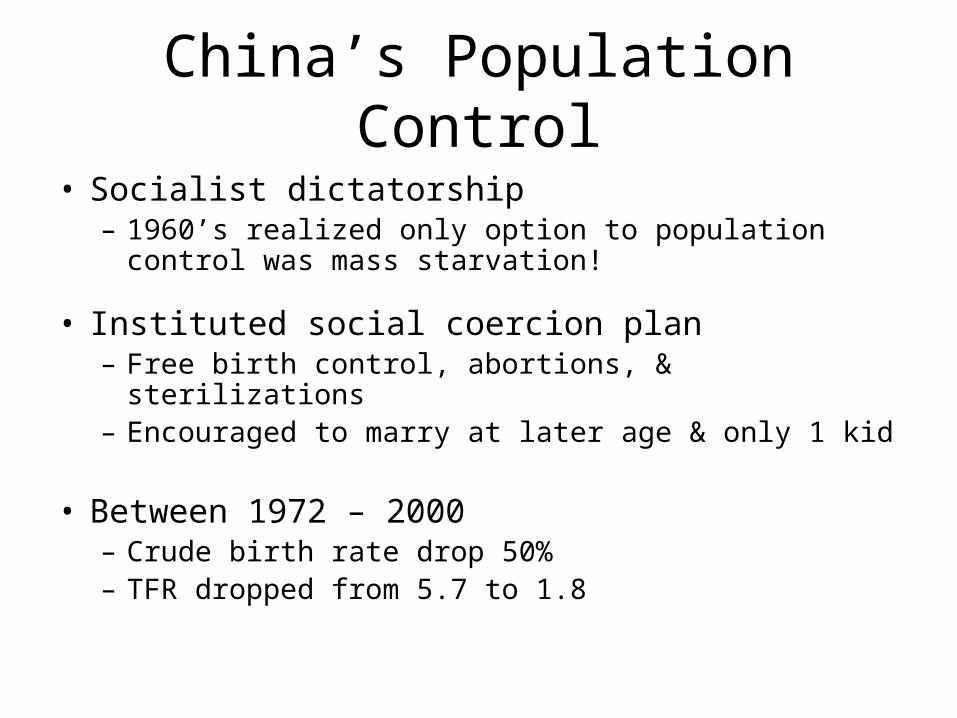
• Socialist dictatorship– 1960’s realized only option to population control was mass
starvation!
• Instituted social coercion plan– Free birth control, abortions, & sterilizations– Encouraged to marry at later age & only 1 kid
• Between 1972 – 2000– Crude birth rate drop 50%– TFR dropped from 5.7 to 1.8
China’s Population Control
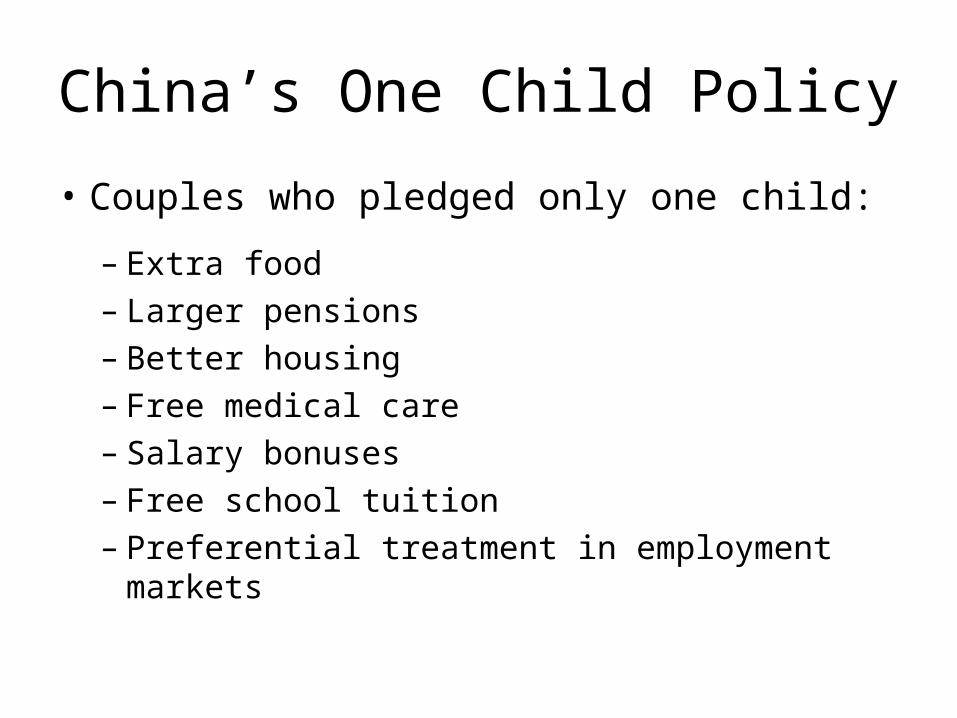
• Couples who pledged only one child:
– Extra food– Larger pensions– Better housing– Free medical care– Salary bonuses– Free school tuition– Preferential treatment in employment markets
China’s One Child Policy
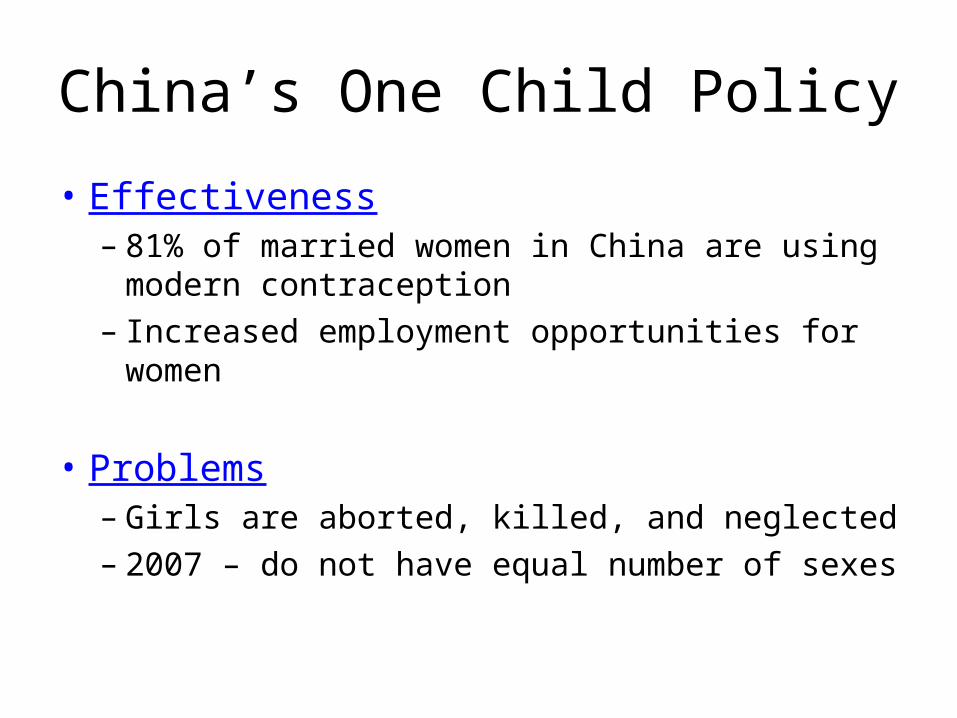
• Effectiveness– 81% of married women in China are using modern
contraception– Increased employment opportunities for women
• Problems– Girls are aborted, killed, and neglected– 2007 – do not have equal number of sexes
China’s One Child Policy