html.investis.comhtml.investis.com/b/big-yellow-plc/reports/ar2016/pdfs/big_yellow_a… · big...
TRANSCRIPT

Big Yellow Group PLC
2 The Deans, Bridge Road,Bagshot, Surrey GU19 5AT
Tel: 01276 470190Fax: 01276 470191e-mail: [email protected]
bigyellow.co.uk
You can accessmore information about us on our website
Big Yellow Group PLC
Annual Report & Accounts 2016
Get some space in your life.™
Big Yellow
Group
PLC A
nnual Report &
Accounts 2016Thinking about
our CustomersIt’s the reason we exist
Thinking aboutour CustomersIt’s the reason we exist
At Big Yellow we believe storage
should be the easy bit
Welcome
to th
e U
K’s
bra
nd
lea
der
inself storage

We have delivered astrong performance in2016, another year ofrevenue, cash flow,earnings and dividendgrowth.
people
service
security
locations
facilities
innovation
growth
We are the innovative leaders in the UK self storage industry providing individualsand businesses with an unrivalled product, the best locations, the best qualityfacilities and the strongest brand. We have great people who deliver the bestcustomer service. We achieve this because we encourage a culture ofpartnership within the business and reward our people for their contribution.
Big Yellow Group PLC is the UK’s brand leader in self storage. Big Yellow now operates from a platform of 89 stores, including 16 stores branded as Armadillo SelfStorage, in which the Group has a 20% interest. We own afurther seven Big Yellow self storage development sites(including two extensions sites), of which two haveplanning consent. The current maximum lettable area ofthis platform is 5.3 million sq ft. When fully built out theportfolio will provide approximately 5.7 million sq ft offlexible storage space. Of the Big Yellow stores and sites,96% by value are held freehold and long leasehold; withthe remaining 4% short leasehold.
The Group has pioneered the development of the latestgeneration of self storage facilities, which utilise state of the art technology and are located in high profile,accessible, main road locations. Our focus on the locationand visibility of our Big Yellow stores, coupled with ourexcellent customer service and our market leading onlineplatform, has made us the most recognised brand namein the UK self storage industry.
We remain…Britain’s favourite self storage company.
01
Welcome
Over the following pages:
We outline the core qualities of our business and explain how we stay ahead of the game.
Nicholas Vetch, Executive Chairman of Big Yellow, commented:
“Against a backdrop of slower economic activity compared to the prior year, we arepleased to have delivered another year of occupancy, revenue and earnings growth. Our main focus remains on driving earnings through occupancy growth over the nextfew years as we target our next goal of 85% across the portfolio.
We will continue to innovate, by improving our digital platform and operations to growour market share and leverage our market leading brand. In addition, our focus willremain on London and the South East (80% of revenue) and large regional cities wherebarriers to entry are at their highest, and supply remains very constrained.
The Big Yellow investment proposition is simple; sustainable earnings and dividendgrowth from a secure capital structure. There will inevitably be setbacks but asmanagement we will continue to focus on the long term achievement of theseobjectives whilst managing risk to minimise mistakes. The much-overlooked power ofcompounding should do the rest.”
The success of Big Yellow as a business depends on all of us striving for those 1%improvements and workingtogether, understanding thateach and every one of usmakes a critical contributionto our success.
Delivering that little Extra…
02
A Year ofFurther AchievementBut our focus remains on the Future
The Big Yellowinvestment propositionis simple; sustainableearnings and dividendgrowth from a securecapital structure.
Driving occupancy,revenue and cash flow growth

03
Strong growth opportunities
Our MarketplaceDemand for self storage comes from a number of different market segments
House movers, either in the rental or owner occupied sector continue to be a keyelement of our customer base. Demand also comes from people decluttering theirspace constrained homes, treating Big Yellow as a spare room. Key life events whichinvariably create a need for storage are also an important driver of demand;maybe moving abroad for a job, inheriting possessions, getting married orseparating, homeowners carrying out home improvements or students needingspace during the holidays.
We also have demand from businesses large and small. Our business customersinclude retailers, e-tailers, professional service companies, hospitality companiesand importers/exporters.
Big Yellow provides the perfect solution in providing cost effective, flexible and riskfree storage for stock, distribution or archiving purposes.
Big Yellow is wellplaced to benefit from the growing self storage market,given the strength of our brand, andonline platform whichdelivers approximately86% of our prospectenquiries.
ConversionInto
Quality Returns
Strong Growth
Opportunities
Attractive Market
Dynamics
Evergreen Income Streams
Our CompetitiveAdvantage
OurProven Model
04
The market leadingbrand, with the largestonline market share
> The Big Yellow brand has unprompted awareness more than five times higherthan its nearest competitor in London and six times higher across the rest of the UK
> Largest online market share of web visits at 34% to 40% against 36 largest UKoperators, across the year ended 31 March 2016. (Source: Connexity Hitwise)
> Nurturing growth from strong digital channels including a new improvedmobile site which accounted for 35% of total web visits in March 2016
> Other marketing activities include consumer PR, social media, sponsorship of community projects and charitable activities
> £4 million marketing investment for the year
Our BrandThe UK’s favourite self storage company
By creating onepowerful brandnationwide, Big Yellowis front of mind formore customers in our market than ourcompetitors, withsignificant potential to increase this brandawareness.
All of our people share apassion for delivering theservice our customersdeserve, helping them getthrough stressful life changessuch as moving home.
That is our Brand

05
Our Unrivalled ServiceA Brand based on People
Our friendly andhelpful staff are one of the main reasonswhy customers chooseBig Yellow. Over 13,000online reviews of ourcustomer service aretestament to this.
We are about much more than just storage. We are about people and theirpossessions. Whether it’s a house move, setting up a business or a DIY project, weunderstand these are all key life moments where it can get a bit stressful. At BigYellow, our people help to take the stress away. We work hard to understand ourcustomers’ requirements and give the best service possible whether it is face toface, over the phone or through our user friendly website, mobile site or online chat.Our customer support centre is also on hand seven days a week to provide anadditional layer of customer service.
Customer reviews are published on the website and show an extremely high levelof satisfaction. We also invite customers to submit reviews to a third party reviewsite which are currently averaging 9.3 out of 10.
We put the customer at the heart of our business
Our recruiting and trainingprogrammes help us maintainand develop the right calibreof people to ensure success.
Our people are our mostimportant asset

06
SecurityThat is second to none
We are the only major UK operator where every roomin every store is individually alarmed.
Secure perimeter fencing, electronic coded gates,intruder alarms, PIN code entry and CCTV which ismonitored 24 hours a day, provide additional levels ofsecurity for our customers.
The importance of security and the need for vigilanceis communicated to all store staff and reinforcedthrough regular training.
The highest levels of security in the UK self storage industry
We provide the highestlevels of security inthe UK self storageindustry. We haveinvested significantlyto ensure our customersenjoy peace of mind.
Our digital CCTV systems are monitored24 hours a day, providing an additionallevel of security especially for customerswith extended hours access.
Ensuring Peace of Mind

InnovationAlways looking to the future
07
We are always lookingfor innovative ways tohelp our customers’lives and make thebusiness moreenvironmentallysustainable.We are continually improving our digital channels for
our online visitors to provide the best online experiencepossible to help them make informed choices abouttheir self storage requirements.
Video store tours, intuitive online FAQs, easy tounderstand size guides and online chat all help ourvisitors understand what storage size they need andhow storing at Big Yellow works.
We make it easy online for customers to reserve theirspace, buy boxes and packing materials and check in,saving them valuable time once they get to the store.
Innovative building design is part of our commitmentto a more sustainable business. We incorporate thelatest technologies such as energy efficient lighting andsolar panels to reduce our carbon footprint andproduce our own renewable energy.
Continually improving our digital platforms
Mobile is a convenient way forour online visitors to find astore, get a quote and evenreserve and check in online.35% of our online visitors comethrough the mobile website.
Customer Focussed
NOTTINGHAM
COLCHESTER
NORWICH
PETERBOROUGH
DERBY
CAMBRIDGE
BRIGHTON
TUNBRIDGE WELLS
CHELTENHAM
SOUTHEND
CHELMSFORDLUTON
MILTON KEYNES
SHEFFIELD BRAMALL LANE
BIRMINGHAM
STOKE-ON-TRENT
CHESTER CHEADLE
MACCLESFIELD
SHEFFIELD PARKWAY SHEFFIELD WESTBAR SHEFFIELD HILLSBOROUGH
HULL
STOCKPORT
WARRINGTONMANCHESTER
LEEDS
LIVERPOOL SOUTHLIVERPOOL
LIVERPOOL NORTH
STOCKTON
MORECAMBE
EDINBURGH
DUNDEE
NEWCASTLE
CANTERBURY
7
A1(M)
M4
M3
M40
M2
M20
ROMFORD
ILFORDDAGENHAMBARKING
WEST NORWOOD
BALHAM ELTHAM
NEW CROSS
BYFLEET CROYDON ORPINGTON
BECKENHAM BROMLEY
SUTTON
KINGSTONNEW MALDEN
TOLWORTH
MERTON
WANDSWORTHBATTERSEA
KENNINGTON
SHEEN
FULHAM
NORTH KENSINGTON
RICHMONDTWICKENHAM x2
HOUNSLOWCHISWICK
NORTH FINCHLEY
EAST FINCHLEY
BOW
EDMONTON
ENFIELDWATFORD
STAPLES CORNER
HANGER LANEEALING GYPSY CORNER
WEST MOLESEY
NINE ELMSCAMBERWELL
KINGS CROSS
> London– 43 stores and sites
08
Our PortfolioAn extensive national network
Our customers like our modern, highly visible, purposebuilt stores which are situated in easily accessiblelocations.
We have opened our Enfield store on the A10 in London and our central Cambridge store in the year.Big Yellow acquired two stores from Lock and Leave at Nine Elms and Twickenham, and Armadillopurchased Canterbury and West Moseley from thesame operator. This and our other high profile storelocations contribute to the growing awareness of selfstorage and our brand.
We have an unrivalled portfolio across London,the South East and large metropolitan cities, with anetwork of 89 stores.
Our customers like ourmodern, highly visible,purpose built storeswhich are situated ineasily accessiblelocations.
London
73 easy to find, high profilelocations provide convenience for customers and unmissableexposure for the Big Yellow brand.
16 Armadillo stores furtherbroaden our national coverage
High profile locations.
89 highly visiblestores reinforce our brand 24/7
>Outside London– 51 stores and sites
GLOUCESTER OXFORD x2 HIGH WYCOMBE
GUILDFORD CENTRAL
CAMBERLEY
READING
POOLE
PORTSMOUTH
GUILDFORD
BRISTOL ASHTON GATE
BRISTOL CENTRALSLOUGH
SWINDON
CARDIFF
73 Big Yellow stores
5 New Big Yellow stores under development
KEY
16 Armadillo stores

10 Highlights12 Chairman’s Statement14 Strategic Report
14 Our Strategy and Business Model16 Operational and Marketing Review20 Proforma Portfolio Summary – Big Yellow Stores21 Our Stores25 Portfolio Summary – Armadillo Stores26 Store Performance29 Financial Review34 Risk and Uncertainties38 Corporate Social Responsibility Report54 Assurance Statement on the
Corporate Social Responsibility Report56 Directors, Officers and Advisers57 Directors’ Report60 Corporate Governance Report64 Report of the Nominations Committee66 Remuneration Report80 Audit Committee Report83 Statement of Directors’ Responsibilities84 Independent Auditors’ Report to the Members of
Big Yellow Group PLC 89 Consolidated Statement of Comprehensive Income90 Consolidated Balance Sheet91 Consolidated Statement of Changes in Equity92 Consolidated Cash Flow Statement92 Reconciliation of Net Cash Flow to Movement in
Net Debt93 Notes to the Financial Statements118 Company Balance Sheet119 Company Cash Flow Statement120 Company Statement of Changes in Equity121 Notes to the Financial Statements124 Ten Year Summary
09
Contents
self storage
company
Britain’s
favourite

10
HighlightsStrong Operating PerformanceDelivers 15% Earnings Growth(3)
Year ended Year ended
31 March 31 March %
Financial metrics 2016 2015 Growth
Revenue £101.4m £84.3m 20Like-for-like revenue(1) £87.6m £79.9m 10Adjusted profit before tax(2) £49.0m £39.4m 24Adjusted diluted EPRA earnings per share(3) 31.1p 27.1p 15Dividend – final 12.8p 11.3p 13 – total 24.9p 21.7p 15Cash flow from operating activities (after net finance costs) £55.5m £42.4m 31
Store metrics
Occupancy growth(4) 185,000 sq ft 267,000 sq ft (31)Occupancy – like-for-like stores (%)(4) 76.7% 73.2% 3.5pptsAverage net achieved rent per sq ft(4) £25.73 £25.10 3
Statutory metrics
Profit before tax £112.2m £105.2m 7Basic earnings per share 71.9p 72.5p (1)
(1) Like-for-like revenue excludes the 12 Partnership stores (acquired December 2014), Chester (acquired January 2015), Enfield (opened April 2015) andCambridge (opened January 2016), and management fees earned from the Partnership in the prior year
(2) See note 10.(3) Adjusted earnings per share – see note 12.(4) See Portfolio Summary and Operating and Financial Review.
Highlights> Strong revenue performance driving 15% increase in adjusted earnings per share and total dividend
> Store platform expanded by 282,000 sq ft:
– Two new freehold stores opened at Enfield and Cambridge
– Acquisition of four store Lock and Leave portfolio in April 2016 for £21 million
– Nine Elms and Twickenham acquired by Big Yellow
– Canterbury and West Molesey acquired by Armadillo
> Acquisition of prime London development sites in Kings Cross and Camberwell
Another year of growth in all our key operating metrics

11
We have deliveredoccupancy, cash flowand earnings growth for the seventh year in a row.
Consistency delivered
2012 2013 2014 2015 201615
20
25
30
35
40
45
50
55
23.625.5
29.2
39.4
49.0
Adjusted profitbefore tax (£m)
+ 24%
2012 2013 2014 2015 20160.0
5.0
10.0
15.0
20.0
25.0
30.0
10.011.0
16.4
21.7
24.5
Dividend per share (pence)
+ 15%
2012 2013 2014 2015 201610
15
20
25
30
35
18.219.3
20.5
27.1
31.1
Adjusted earningsper share (pence)
+ 15%
2012 2013 2014 2015 201650.0
60.0
70.0
80.0
90.0
100.0
110.0
65.769.7
72.2
84.3
101.4
Revenue (£m) + 20%
2012 2013 2014 2015 201650%
55%
60%
65%
70%
75%
80%
63.564.8
69.8
73.275.3
Occupancy (%) + 3%
2012 2013 2014 2015 2016£20.00
£21.00
£22.00
£23.00
£24.00
£25.00
£26.00
£27.00 26.49
24.65
26.15
25.23
25.90
Closing net rent (per sq ft) + 3%
Big Yellow Group PLC (“Big Yellow”, “the Group” or “the Company”), the UK’s brand leader in self storage, is pleased to announce resultsfor the year ended 31 March 2016.
Against a backdrop of slower economic activity compared to the prioryear, we are pleased to have delivered another year of occupancy,revenue and earnings growth. Our main focus remains on drivingearnings through occupancy growth over the next few years as wetarget our next goal of 85% across the portfolio.
Like-for-like closing Group occupancy is up 3.5 percentage points to76.7% compared to 73.2% at 31 March 2015, in line with the guidancegiven in May 2015.
Average rental growth over the year was 2.5% with closing net rent of£25.90, representing an increase of 2.7% from the same time last year.The like-for-like revenue growth in the Group was 10% compared to lastyear, this excludes the 12 Partnership stores, existing storeacquisitions made last year and new store openings in the year. Giventhat our central overhead and operating expense is largely embeddedin the business, this revenue growth has dropped through into a 15%increase in adjusted earnings per share and in the dividend per sharefor the year.
Awareness of self storage and the market generally is growing year onyear, as more people use the product, and with continued marketingfrom all industry players, we are seeing improving levels of referral andrepeat use.
We will continue to innovate, by improving our digital platform andoperations to grow our market share and leverage our market leadingbrand. In addition, our focus will remain on London and the South East(80% of revenue) and large regional cities where barriers to entry arehighest, and supply remains very constrained.
Financial resultsRevenue for the year was £101.4 million (2015: £84.3 million), an increase of 20%. Cash inflows from operating activities (after interestcosts) increased by £13.1 million (31%) to £55.5 million for the year(2015: £42.4 million).
The Group made an adjusted profit before tax in the year of £49.0 million (2015: £39.4 million), up 24%. This translated into a 15% increase in adjusted earnings per share to 31.1p (2015: 27.1p),the growth of which is lower as a result of the placing of an additional14.4 million shares in November 2014 to part fund the acquisition ofthe remaining interest in the 12 Big Yellow Limited Partnership stores.
The Group has net bank debt of £295.0 million at 31 March 2016 (2015: £277.1 million). This represents approximately 26% (2015: 27%)of the Group’s gross property assets totalling £1,126.2 million (2015: £1,022.8 million) and 33% (2015: 35%) of the adjusted netassets of £899.0 million (2015: £801.4 million).
The Group’s interest cover for the year, expressed as the ratio of cashgenerated from operations against interest paid (per the cash flowstatement) was 6.2 times (2015: 5.4 times).
Investment in new capacity Creating new capacity in our core area of London and the South Eastis increasingly challenging. Sites are scarce, and faced with a housingemergency, policy makers are focussed on residential provision at theexpense of commercial. As London’s population grows, these pressuresare likely to intensify. The bad news is that it makes it difficult to buildnew stores for Big Yellow, but conversely leaves our existing platformnear irreplaceable.
We opened our 60,000 sq ft store in Enfield in April 2015, on aprominent location on the A10. Our 60,000 sq ft store in centralCambridge opened in January 2016. We intend to commenceconstruction of our store in central Guildford in the second half of the year, and anticipate it opening in Autumn 2017.
Given the competition for land in central London we are very pleasedto have acquired two prime sites at Kings Cross and Camberwell. KingsCross is a one acre site on which we intend to develop a new build storeof in excess of 90,000 sq ft, subject to planning. Camberwell is in Zone 2to the south of London Bridge, and we intend to develop a new buildstore of 65,000 to 70,000 sq ft, subject to planning. There is interimrental income on these two sites while we pursue planning, which willmitigate the increase in our variable rate interest expense.
These sites, together with Guildford Central, extensions at our existingBattersea and Wandsworth stores, and development sites in Newcastle and Manchester (the last four all subject to planning) willprovide in excess of an additional 400,000 sq ft of capacity.
During the year we have successfully re-geared our existing 125 year,long leasehold interest on our proposed self storage site at WaterStreet, Manchester to 250 years, and in addition sold the surplusindustrial land to Manchester City Council for £8 million.
12
Chairman’s Statement
The Big Yellow investment proposition is simple;sustainable earnings and dividend growth from a secure capital structure.
GrowthOf Revenue and Earnings
At 31 March 2016, the future cost of the current pipeline of sevendevelopment sites and extensions, six of which are subject to planning,is provisionally estimated to be approximately £55 million. Thisexcludes any net proceeds that may be received on the redevelopmentof our Battersea store and adjoining retail units into a mixed usescheme of residential, retail and self storage.
In April 2016, we acquired the Lock and Leave portfolio. Big Yellowacquired two stores in London, at Nine Elms (65,000 sq ft MLAfreehold) and Twickenham (25,000 sq ft MLA, 19 years unexpiredleasehold), for £13.5 million and £1.1 million respectively, totalling£14.6 million. The Nine Elms store is approximately 85% occupied andsits neatly between our strong performing Kennington and Batterseastores, and our aim will be to drive revenue and cash flow through yieldmanagement. The Twickenham store is adjacent to our existing freehold73,000 sq ft highly occupied store. The freehold stores in Canterbury(37,000 sq ft MLA) and West Molesey (35,000 sq ft MLA) were acquiredby Armadillo for £6.4 million, and again we expect to drive operationalperformance under our management.
DividendsThe Group’s dividend policy is to distribute 80% of full year adjustedearnings per share. The final dividend declared is 12.8 pence per share.The dividend declared for the year of 24.9 pence per share representsan increase of 15% from 21.7 pence per share last year.
Our peopleIn February of this year, we were included in the Sunday Times Best100 Companies to work for in the mid-size category, an independentassessment of our employee engagement and culture. This isparticularly pleasing, as from the inception of the business we havetried to create a culture which is accessible, apolitical, non-hierarchical,socially responsible, and very importantly a fun and enjoyable place to work. No business can succeed without motivated andhardworking people.
OutlookExternal forces are complex and are unlikely to be assisted by commentfrom us, so we concentrate on matters that we can influence.
The Big Yellow investment proposition is simple; sustainable earnings anddividend growth from a secure capital structure. There will inevitablybe setbacks but as management we will continue to focus on the longterm achievement of these objectives whilst managing risk tominimise mistakes. The much-overlooked power of compoundingshould do the rest.
Nicholas VetchChairman23 May 2016
13
In February of thisyear, we were includedin the Sunday TimesBest 100 Companies to work for.
No business cansucceed withoutmotivated andhardworking people.

Our strategy from the outset has been to develop Big Yellow into themarket leading self storage brand, delivering excellent customerservice, with a great culture and highly motivated employees. We continue to be the market leading brand, with unpromptedawareness of over six times that of our nearest competitor (source: YouGov survey, April 2016). We concentrate on developing ourstores in main road locations with high visibility, where our distinctivebranding generates high awareness of Big Yellow. Our recentaccreditation in the Best 100 Companies to work for is pleasing as anindependent assessment of our employee engagement, and ourcustomer satisfaction survey scores remain very high, with an averagenet promoter score of over 70%, and average customer satisfactionscores of 9.3 out of 10.
Self storage demand from businesses and individuals at any givenstore is linked in part to local economic activity, consumer andbusiness confidence, all of which are inter-related. Fluctuations inhousing activity whether in the rented or owner occupied sector, arealso a factor and in our view influence the top slice of demand over andabove a core occupancy. This has been demonstrated by the resilienceof our like-for-like stores since September 2007 despite a collapse inhousing activity and GDP over the period 2007 to 2009. As can be seenfrom the ten year summary, the performance of our stores wasrelatively resilient during the downturn, and within that London andthe South East proved to be less volatile.
Local GDP and hence business and housing activity are greatest in thelarger urban conurbations and in particular London and the South East,from where we derive 80% of our revenue. Furthermore, people andbusinesses are space constrained in these more densely populatedareas. Barriers to entry in terms of competition for land and difficultyaround obtaining planning are also highest in more urbanised locations.
Over the last 17 years we have built a portfolio of 73 Big Yellow selfstorage centres, largely freehold, purpose-built and focussed onLondon, the South East and large metropolitan cities. 63% of our currentstore revenue derives from within the M25; for London and the SouthEast, the proportion of current store revenue is 80%.
Our Big Yellow stores are on average 63,000 sq ft, compared to an industryaverage of approximately 43,000 sq ft (source: The Self StorageAssociation 2016 UK Annual Survey). The upside from filling our largerthan average sized stores is, in our view, only possible in largemetropolitan markets, where self storage demand from domestic andbusiness customers is the highest. As the operating costs of our assetsare relatively fixed, larger stores in bigger urban conurbations, particularlyLondon, drive higher revenues and higher operating margins.
We continue to believe that the medium term opportunity to createshareholder value will be principally achieved by increasing occupancyand rental yield in our existing platform to drive revenue, the majorityof which flows through to the bottom line.
Our key objectives remain:
> leveraging our market leading brand position to generate newprospects, principally from our digital, mobile and desktop platforms;
> focusing on training, selling skills, and customer satisfaction tomaximise prospect conversion and referrals;
> growing occupancy and net rent so as to drive revenue optimallyat each store;
> maintaining a focus on cost control, so revenue growth istransmitted through to earnings growth;
> selectively adding to the portfolio through new site developmentand existing store acquisitions;
> maintaining a conservative capital structure in the business withGroup interest cover of a minimum of five times; and
> producing sustainable returns for shareholders through a lowleverage, low volatility, high distribution REIT.
In the sixteen years since flotation in May 2000, Big Yellow hasdelivered a Total Shareholder Return (“TSR”), including dividendsreinvested, of 15.9% per annum, in aggregate 938% at the closing priceof 774.5p on 31 March 2016. This compares to 6.9% per annum for theFTSE Real Estate Index and 4.3% per annum for the FTSE All Share indexover the same period. This demonstrates the power of compoundingover the longer term.
14
Strategic Report
Our Strategy and Business Model
Our Strategic Reportdiscusses the following areas:> Our strategy and business model > Operational and marketing review> Store performance> Financial review> Principal risks and uncertainties> Going concern basis and viability statement> Corporate social responsibility
ApprovalThis report was approved by the Board of Directors on 23 May 2016 and signed on its behalf by:
James Gibson John TrotmanChief Executive Chief Financial Officer
15
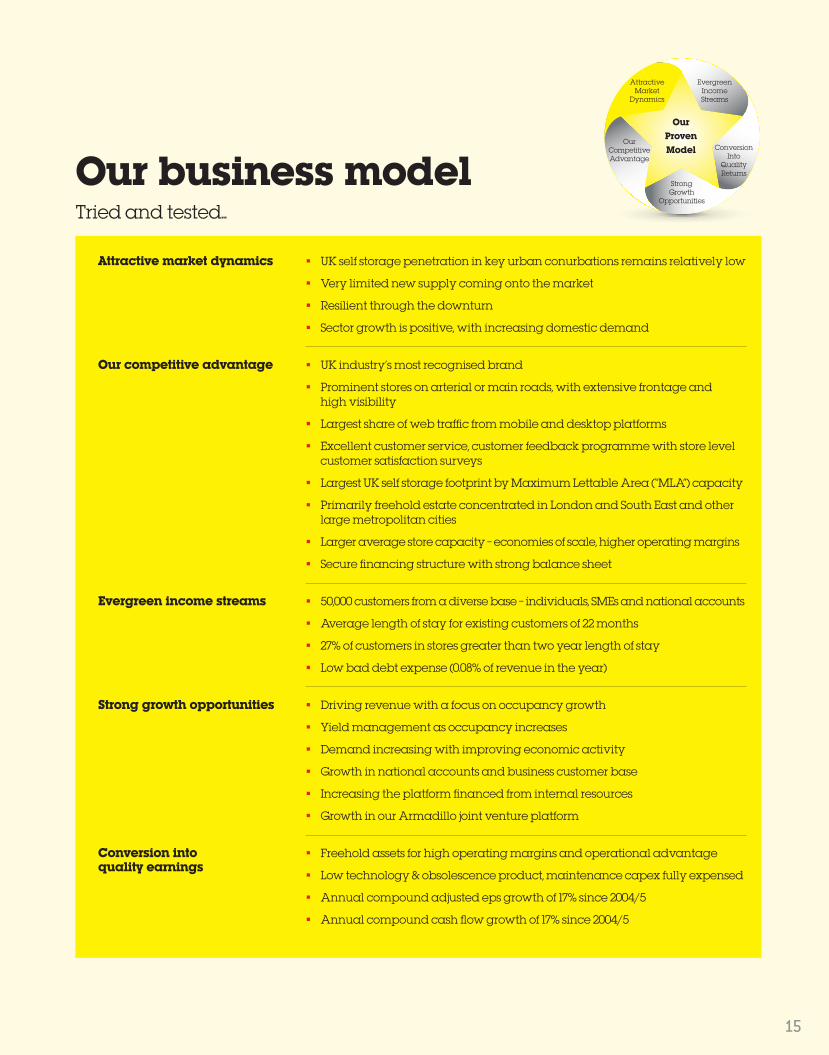
Our business modelTried and tested...
ConversionInto
Quality Returns
Strong Growth
Opportunities
Attractive Market
Dynamics
Evergreen Income Streams
Our CompetitiveAdvantage
OurProven Model
Attractive market dynamics . UK self storage penetration in key urban conurbations remains relatively low
. Very limited new supply coming onto the market
. Resilient through the downturn
. Sector growth is positive, with increasing domestic demand
Our competitive advantage . UK industry’s most recognised brand
. Prominent stores on arterial or main roads, with extensive frontage and high visibility
. Largest share of web traffic from mobile and desktop platforms
. Excellent customer service, customer feedback programme with store levelcustomer satisfaction surveys
. Largest UK self storage footprint by Maximum Lettable Area (“MLA”) capacity
. Primarily freehold estate concentrated in London and South East and otherlarge metropolitan cities
. Larger average store capacity – economies of scale, higher operating margins
. Secure financing structure with strong balance sheet
Evergreen income streams . 50,000 customers from a diverse base – individuals, SMEs and national accounts
. Average length of stay for existing customers of 22 months
. 27% of customers in stores greater than two year length of stay
. Low bad debt expense (0.08% of revenue in the year)
Strong growth opportunities . Driving revenue with a focus on occupancy growth
. Yield management as occupancy increases
. Demand increasing with improving economic activity
. Growth in national accounts and business customer base
. Increasing the platform financed from internal resources
. Growth in our Armadillo joint venture platform
Conversion into . Freehold assets for high operating margins and operational advantage quality earnings . Low technology & obsolescence product, maintenance capex fully expensed
. Annual compound adjusted eps growth of 17% since 2004/5
. Annual compound cash flow growth of 17% since 2004/5
The self storage marketIn the recently published 2016 Self Storage Association UK Survey, only41% of those surveyed had a reasonable or good awareness of selfstorage, in line with findings from our own research. Furthermore, only7% of the 2,075 adults surveyed were currently using self storage orwere thinking of using self storage in the next year. This indicates acontinued opportunity for growth and with increasing use, togetherwith the ongoing marketing efforts of everyone in the industry, weanticipate awareness will grow.
Growth in new facilities across the industry has been largely in regionalareas of the UK and in particular in smaller towns. In London in 2015,we believe there were six new store openings last year (including ourEnfield store), and three closures of stores for redevelopment intoalternative uses. Between 2010 and 2015 average industry openingshave been approximately 11 per year, which compares to an averageof 34 per year in the preceding four years.
The Self Storage Association (“SSA”) estimates that the UK industry ismade up of approximately 1,077 self storage facilities (of which 195are purely container operations), providing 37.6 million sq ft of selfstorage space, equating to 0.6 sq ft per person in the UK. This comparesto 7.8 sq ft per person in the US, 1.8 sq ft per person in Australia and0.1 sq ft for mainland Europe, where the roll-out of self storage is amore recent phenomenon (source: Fedessa European Self StorageAnnual Survey 2015). 357 self storage facilities in the UK are held by large operators (defined as those managing 10 facilities or more),which represents 40% of the total number of self storage centres, butwe would estimate approximately 50% to 60% of total capacity.
Big Yellow is well placed to benefit from the growing self storagemarket, given the strength of our brand, and online platform whichdelivers approximately 86% of our prospect enquiries. Our portfolio isstrategically focussed on London, the South East and largemetropolitan cities, where barriers to entry and economic activity areat their highest.
KPIsThe key performance indicators of our stores are occupancy and rentalyield, which together drive the revenue of the business. These are threekey measures which are focussed on by the Board, and are reportedon a weekly basis. Over the course of past five years, both occupancyand revenue have grown significantly. Rental yield was relatively stablebetween 2011 and 2012, reduced following the introduction of VAT in2013, grew by 6.1% in the year to 31 March 2014, and decreased by3.5% in 2015 principally reflecting the acquisition of the Big YellowLimited Partnership stores, a regional portfolio, at a lower average netrent per sq ft. In the current year, net rent has increased by 2.7%. Ourkey focus is on continuing to grow occupancy, with rental yield growthfollowing once the stores have reached higher occupancy levels.
Adjusted profit before tax, adjusted earnings per share anddistributions to shareholders are our other KPIs. We have deliveredcompound eps growth of 14% over the past five years, and compounddividend growth of 26% over the same period. Compound adjusted epsgrowth since 2004/5 is 17%. We have illustrated the Group’sperformance in these measures over the past five years on page 11.
Operational and Marketing Review
OverviewWe now have a portfolio of 73 open and trading Big Yellow stores, witha further five development sites and two extension opportunities. The current maximum lettable area of this platform is 4.6 million sq ft.When fully built out the portfolio will provide approximately 5.0 millionsq ft of flexible storage space.
In addition we operate from 16 Armadillo stores which are principallylocated in northern towns and cities, and operate from a platform of0.7 million sq ft.
Access to capital and bank facilities has improved in the last couple of years, however this is mainly for larger well-capitalised groups,rather than necessarily the smaller, independent operators. Growth innew openings over the last five years has averaged just over 1% of totalcapacity per annum, down significantly from the previous decade.Additionally, in our core markets in London and the South East, veryhigh land values driven by competing uses such as residential, is making the creation of new supply very difficult for all operators. We believe that we are in a relatively strong position given the strengthof our balance sheet and our proven property development expertise,together with our ability to access funding to exploit the right opportunity.
16
Strategic Report (continued)
Our Strategy and Business Model (continued)

OperationsThe Big Yellow store model is well established. The “typical” store has60,000 sq ft of net lettable storage area and takes some three to fiveyears to achieve 80% plus occupancy. Some stores have taken longerthan this given they opened just before or during the downturn. The average room size occupied in the portfolio is currently 67 sq ft,in line with last year.
The store is open seven days a week and is initially run by three staff,with a part time member of staff added once the store occupancyjustifies the need for the extra administrative and sales workload.
The drive to improve store operating standards and consistency acrossthe portfolio remains a key focus for the Group. Excellent customerservice is at the heart of our business objectives, as a satisfiedcustomer is our best marketing tool. We measure customer servicestandards through a programme of mystery shopping and onlinecustomer reviews, all externally managed. Over the year, we haveachieved an average net promoter score of over 70%, and averagecustomer satisfaction scores of 9.3 out of 10.
We have a team of nine Area Managers in place who have on averageworked for Big Yellow for twelve years. They develop and support thestores to drive the growth of the business.
The store bonus structure rewards occupancy growth, sales growthand cost control through quarterly targets based on occupancy andstore profitability, including the contribution from ancillary sales ofinsurance and packing materials. Information on bonus build up iscirculated monthly and stores are consulted in preparing their owntargets and budgets each quarter, leading to improved visibility, abetter understanding of sales lines and control of operating costs.
We believe that as a consumer-facing branded business it is paramountto maintain the quality of our estate and customer offering. Wetherefore continue to invest in preventative maintenance, storecleaning and the repair and replacement of essential equipment, suchas lifts and gates. The ongoing annual expenditure is approximately£30,000 per store, which is included within cost of sales. This excludesour rolling programme of store makeovers, which typically take placeevery five years, at a cost of approximately £20,000 per store.
DemandOf the customers moving into our stores in the last year, surveysundertaken indicate approximately 46% are house move related, eithercustomers renting storage space whilst moving within the rental sectoror the owner occupied sector. During the year 11% of our customerswho moved in took storage space as a spare room for decluttering andapproximately 32% of our customers used the product because someevent has occurred in their lives generating the need for storage; theymay be moving abroad for a job, have inherited possessions, aregetting married or divorced, are students who need storage during theholidays, or homeowners developing into their lofts or basements. The balance of 11% of our customer demand during the year came from businesses.
Our business customers range across a number of industry types,such as retailers, e-tailers, professional service companies, hospitalitycompanies and importers/exporters. These businesses store stock,documents, equipment, or promotional materials all requiring aconvenient flexible solution to their storage, either to get started or tofree up more expensive space.
We have seen solid demand from business customers, as they seek acost effective, flexible, convenient solution to their storagerequirements, preferring self storage to the commitment of a longerlease, and given the difficulty of renting alternative mini-warehousingspace in urban areas, particularly London.
Business customers typically stay longer than domestic customers,and also on average occupy larger rooms. Whilst only representing 11%of new customers during the year, businesses represent 19% of ouroverall customer numbers, occupying 35% of the space in our storesat 31 March 2016, domestic customers occupy 65%. The average roomsize occupied by business customers is 121 sq ft, compared to 54 sq ftfor domestic customers. This compares with the 2016 SSA UK AnnualSurvey result for the industry as a whole which had 59% of spaceoccupied by domestic customers and 41% of space by businesses. Wewould expect to have a higher proportion of domestic customers givenour focus on London and other large metropolitan cities.
We have a dedicated national accounts team for business customerswho wish to occupy space in multiple stores. These accounts are billedand managed centrally. We have four full time members of staffworking on growing and managing our national account customers.The national accounts team can arrange storage at short notice at anylocation for our customers. In smaller towns where we do not haverepresentation, we have negotiated sub-contract arrangements withother operators who meet certain operating standards.
17
For unprompted brand awareness, our recall acrossthe UK as a whole is more than six times that of ournearest competitor.

Marketing and eCommerceOur marketing strategy continues to focus on driving customersatisfaction and response through our multiple digital platforms.
For the last ten years, we have commissioned a YouGov survey to helpus monitor our brand awareness. In our most recent survey, conductedin April 2016, we used a statistically robust sample size of 1,044respondents in London and 2,084 for the rest of the UK. The surveyhas shown our prompted awareness to be at 74% in London, two andhalf times higher than our nearest competitor and 38% for the rest ofthe UK, over three times higher than our nearest competitor.
For unprompted brand awareness, our recall in London is 49%, morethan five times higher than our nearest competitor and for the rest ofthe UK it is 20%, more than six times higher than our nearestcompetitor; across the UK as a whole it is more than six times ournearest competitor. These surveys continue to prove we are the UK’sbrand leader in self storage (source: YouGov, April 2016). The UK SelfStorage Association has also conducted a brand awareness surveywith similar results.
OnlineThe Big Yellow website, whether accessed by desktop, tablet orsmartphone, delivers the largest share of prospects, accounting for86% of all sales leads across the year ended 31 March 2016. Telephoneis the first point of contact for 9% of prospects and walk-in enquiries,where we have had no previous contact with a prospect, represent 5%.
We have the largest online market share of web visits to self storagecompany websites in the UK. Across the year ended 31 March 2016,our online market share of web visits ranged from 34% to 40%. Ournearest competitor ranged from 14% to 19% online market share forthe same period (source: Connexity Hitwise 36 largest UK operators).
We continually monitor and improve the website user journey to makethe experience as informative, customer focussed and intuitive aspossible. Our mobile strategy is central to this. By the end of March2016, smartphones and tablets accounted for 50% of all web visits.Specifically, smartphones alone accounted for 35% of web visits inMarch 2016, up from 32% in March 2015. The rate of growth in the useof mobiles and tablets is slowing, which may be an indication of amaturing market for these devices, and many of our customerscontinue to access our digital platforms through desktop computersand laptops.
Whether it is through desktop, tablet or mobile, our customers enjoy aseamless experience whichever digital route they choose. Our latestmobile optimised website was launched in May 2015 with enhancedusability and features. We are continually developing helpful and timesaving online tools such as check-in online, online FAQs, video storetours and online chat. These all help the customer to make an informedchoice about their self storage requirements.
Online customer reviewsConsistent with our strategy of putting the customer at the heart of our business, our online customer reviews generate real-timefeedback from customers as well as providing positive word of mouthreferral to our web visitors. Through our ‘Big Impressions’ customerfeedback programme, we ask our new customers to rate our productand service and with the users permission, we then publish theseindependent reviews on the website. There are currently over 13,200reviews published.
The Big Impressions programme also generates customer feedback ontheir experience when they move out of a Big Yellow store and alsofrom those prospects who decided not to store with us. In addition, thisprogramme reinforces best practice of customer service at our storeswhere customer reviews and mystery shop results are transparentlyaccessible at all levels.
In addition, we also gain real-time insight from customers who submitreviews to TrustPilot, the well-known third party customer review site.These reviews are currently averaging 9.3 out of 10.
We also regularly monitor Google reviews and mentions of Big Yellowwithin the social mediums of Twitter, online forums and blogs. We usethis insight to continually improve our service offering.
Driving online trafficSearch engines are the most important acquisition tool for us,accounting for the majority of traffic to our website. We continue toinvest in search engine optimisation (“SEO”) techniques both on andoff the site. This helps us to maintain our high positions for the mostpopular and most searched for terms such as “storage” and “selfstorage” in the organic listings on Google.
The sponsored search listings remain the largest source of paid fortraffic and we ensure our prominence in these listings is balanced witheffective landing pages to maximise site conversion.
This year, we have also continued with online display advertising onwebsites which are targeted to our core audience groups. This activityperforms both a direct response and branding role.
Efficiencies in online spend are continuing into the year ending 31 March 2017, ensuring the return on investment is maximised fromall of our different online traffic sources. Online marketing budgets willcontinue to remain fluid and be directed towards the media with thebest return on investment.
18
Strategic Report (continued)
Our Strategy and Business Model (continued)

Social mediaSocial media continues to be complementary to our existing marketingchannels. Our activity is most focussed on Twitter, not only monitoringand answering queries regarding self storage, but also posting our owncreative tweets, tips and advice. The Big Yellow YouTube channel is usedto showcase our stores to web prospects through a video store tour.We use both domestic and business versions to help prospectsexperience the quality of the product without the need for them to visitthe store in person. Our online blog is updated regularly with tips andadvice for homeowners and businesses as well as summaries of ourcharitable and CSR initiatives.
PRWe have used PR stories in the year to help raise the awareness of BigYellow and the benefits of self storage to different audience groups.These have focussed on the flexible benefits of using self storage atdifferent key life events such as having a baby and dealing with divorceand separation. These stories help to promote the wider uses of BigYellow Self Storage and have generated both national and regionalmedia coverage online and offline. They are also supported by radiointerviews which allow us to talk about the benefits of Big Yellow.
BudgetDuring the year the Group spent approximately £4.0 million onmarketing (4% of total store revenue). We have increased the budgetfor the year ahead to £4.2 million with a focus on delivering moreprospects to our stores from our digital channels.
Cyber securityThe Group receives specialist advice and consultancy in respect ofcyber security and we have dedicated in-house monitoring and regularreviews of our security systems. We also limit the retention ofcustomer data to the minimum requirement.
During the year we have continued to invest in digital security,implementing new intrusion detection systems as well as thereplacement of existing systems such as firewalls. Policies andprocedures are under regular review and benchmarked againstindustry best practice by our consultants. These policies also includedefend, detect and response policies.
19
We have the largestonline market share of web visits to selfstorage companywebsites in the UK.
20
Strategic Report (continued)
Proforma Portfolio Summary – Big Yellow Stores
2016 2015 Mature(1) Established Developing Total Mature Established Developing Total
Number of stores(2) 56 11 4 71 56 11 2 69
At 31 MarchTotal capacity (sq ft) 3,495,000 704,000 265,000 4,464,000 3,495,000 704,000 145,000 4,344,000Occupied space (sq ft) 2,689,000 538,000 136,000 3,363,000 2,589,000 503,000 86,000 3,178,000Percentage occupied 76.9% 76.4% 51.3% 75.3% 74.1% 71.4% 59.3% 73.2%Net rent per sq ft £26.78 £21.73 £24.32 £25.90 £25.97 £21.44 £24.19 £25.23
For the yearREVPAF(3) £23.78 £19.20 £14.48 £22.59 £22.21 £17.18 £13.48 £21.09Average occupancy 76.3% 73.4% 51.9% 74.7% 73.1% 68.0% 49.1% 71.5%Average annual rent psf £26.55 £21.88 £24.05 £25.73 £25.92 £21.04 £23.37 £25.10
£000 £000 £000 £000 £000 £000 £000 £000
Self storage income 70,853 11,302 2,745 84,900 65,017 10,068 1,666 76,751Other storage related income(4) 12,036 2,116 416 14,568 10,990 1,923 267 13,180Ancillary store rental income 228 102 24 354 153 102 21 276Total store revenue 83,117 13,520 3,185 99,822 76,160 12,093 1,954 90,207Direct store operating costs(excluding depreciation) (24,202) (4,353) (1,531) (30,086) (23,041) (4,269) (1,046) (28,356)Short and long leasehold rent(5) (1,893) – – (1,893) (1,941) – – (1,941)
Store EBITDA(6) 57,022 9,167 1,654 67,843 51,178 7,824 908 59,910Store EBITDA margin 68.6% 67.8% 51.9% 68.0% 67.2% 64.7% 46.5% 66.4%
Deemed cost £m £m £m £m
To 31 March 2016 364.0 130.9 56.6 551.5Capex to complete 0.8 0.1 0.3 1.2
Total 364.8 131.0 56.9 552.7
(1) The mature stores have been open for more than six years at 1 April 2015. The established stores have been open for between three and six years at 1 April 2015 and thedeveloping stores have been open for fewer three years at 1 April 2015.
(2) The Group acquired the 66.7% of Big Yellow Limited Partnership that it did not previously own on 1 December 2014. The results of the stores in the Partnership have beenincluded in the results above in full for the prior year to give a clearer understanding of the underlying performance of all Big Yellow stores. The table below shows the results for the prior year excluding the period when the stores were not wholly owned, reconciled with the reported statutory results for the year ended 31 March 2015.
2015Partnership
Proforma results as an above associate Statutory£000 £000 £000
Store revenue 90,207 (7,476) 82,731Store EBITDA 59,910 (4,659) 55,251
(3) Total store revenue divided by the average maximum lettable area in the year.(4) Packing materials, insurance and other storage related fees.(5) Rent for six mature short leasehold properties accounted for as investment properties and finance leases under IFRS with total self storage capacity of 398,000 sq ft, and a long
leasehold lease-up store with a capacity of 64,000 sq ft.(6) Store earnings before interest, tax, depreciation, amortisation, and an allocation of central overhead.

21
Our Stores
Our Portfolio Unrivalled in the UKAn unrivalled portfolio of stores across London, the South East and other large metropolitan cities.
Gypsy Corner, April 2014MLA – 70,000 sq ft
Chiswick, April 2012MLA – 75,000 sq ft
New Cross, February 2012MLA – 62,000 sq ft
Stockport, September 2011MLA – 65,000 sq ft
Eltham, April 2011MLA – 70,000 sq ft
Camberley, January 2011MLA – 68,000 sq ft
Cambridge, January 2016MLA – 60,000 sq ft
Chester, February 2015MLA – 69,000 sq ft
Enfield, April 2015MLA – 60,000 sq ft
Oxford 2, July 2014MLA – 35,000 sq ft
High Wycombe, June 2010MLA – 60,000 sq ft

22
Our Portfolio (continued)
Reading, December 2009MLA – 62,000 sq ft
Edinburgh, July 2009MLA – 63,000 sq ft
Birmingham, February 2009MLA – 60,000 sq ft
Merton, March 2008MLA – 70,000 sq ft
Ealing Southall, November 2007MLA – 57,000 sq ft
Sheffield Bramall Lane,September 2009 MLA – 60,000 sq ft
Twickenham, May 2009MLA – 73,000 sq ft
Sheen, December 2008MLA – 64,000 sq ft
Fulham, March 2008MLA – 139,000 sq ft
Sutton, July 2007MLA – 70,000 sq ft
Poole, August 2009MLA – 55,000 sq ft
Liverpool, March 2009MLA – 60,000 sq ft
Sheffield Hillsborough, October 2008 MLA – 60,000 sq ft
Balham, March 2008MLA – 60,000 sq ft
Gloucester, December 2006MLA – 50,000 sq ft
Nottingham, August 2009MLA – 67,000 sq ft
Bromley, March 2009MLA – 71,000 sq ft
Kennington, May 2008MLA – 66,000 sq ft
Barking, November 2007MLA – 64,000 sq ft
Edmonton, October 2006 MLA – 75,000 sq ft

23
Kingston, August 2006MLA – 62,000 sq ft
Bristol Central, March 2006MLA – 64,000 sq ft
Tolworth, November 2004MLA – 56,000 sq ft
Byfleet, November 2003MLA – 48,000 sq ft
Colchester, December 2002MLA – 54,000 sq ft
Bristol Ashton Gate, July 2006MLA – 61,000 sq ft
North Kensington, December 2005 MLA – 51,000 sq ft
Watford, August 2004MLA – 64,000 sq ft
Chelmsford, April 2003MLA – 54 ,000 sq ft
Bow, November 2002MLA – 132,000 sq ft
Finchley East, May 2006MLA – 54,000 sq ft
Leeds, July 2005MLA – 76,000 sq ft
Swindon, April 2004MLA – 53,000 sq ft
Finchley North, March 2003MLA – 62,000 sq ft
Brighton, October 2002MLA – 59,000 sq ft
Tunbridge Wells, April 2006MLA – 57,000 sq ft
Beckenham, May 2005MLA – 71,000 sq ft
Orpington, December 2003MLA – 64,000 sq ft
West Norwood, January 2003MLA – 57,000 sq ft
Guildford, June 2002MLA – 55,000 sq ft

24
Our Portfolio (continued)
New Malden, May 2002MLA – 81,000 sq ft
Cardiff, October 2001MLA – 74,000 sq ft
Wandsworth, April 2001MLA – 47,000 sq ft
Romford, November 2000MLA – 70,000 sq ft
Hanger Lane, October 1999MLA – 66,000 sq ft
Hounslow, December 2001MLA – 54,000 sq ft
Portsmouth, October 2001MLA – 61,000 sq ft
Luton, March 2001MLA – 41,000 sq ft
Milton Keynes, September 2000MLA – 61,000 sq ft
Oxford, August 1999MLA – 33,000 sq ft
Battersea, December 2001MLA – 34,000 sq ft
Norwich, September 2001MLA – 47,000 sq ft
Southend, March 2001MLA – 57,000 sq ft
Cheltenham, April 2000MLA – 50,000 sq ft
Croydon, July 1999MLA – 80,000 sq ft
Ilford, November 2001MLA – 58,000 sq ft
Dagenham, July 2001MLA – 51,000 sq ft
Staples Corner, March 2001MLA – 112,000 sq ft
Slough, February 2000MLA – 67,000 sq ft
Richmond, May 1999MLA – 35,000 sq ft

25
PORTFO
LIO SU
MMARY
Strategic Report (continued)
Proforma Portfolio Summary – Armadillo Stores(1)
March March2016 2015
Number of stores 14 14
At 31 March:Total capacity (sq ft) 673,000 673,000Occupied space (sq ft) 477,000 463,000Percentage occupied 70.9% 68.8%Net rent per sq ft £15.59 £15.09
For the year:REVPAF £13.33 £12.73Average occupancy 70.7% 68.9%Average annual rent psf £15.64 £15.44
£000 £000
Self storage income 7,428 7,146Other storage related income 1,531 1,408Ancillary store rental income 9 10
Total store revenue 8,968 8,564Direct store operating costs (excluding depreciation) (3,681) (3,616)Leasehold rent (411) (411)
Store EBITDA(2) 4,876 4,537Store EBITDA margin 54.4% 53.0%
Cumulative capital expenditure £m
To 31 March 2016 43.5To complete 0.6
Total capital expenditure 44.1
(1) Please note the Group acquired an interest in Armadillo 1 on 16 April 2014 and in Armadillo 2 on 3 February 2015. The results shown for the comparative period are to providereaders with a clearer understanding of the performance of the portfolios. Please see note 13d for further details.
(2) Store earnings before interest, tax, depreciation, amortisation, and management fees charged by Big Yellow to the Armadillo portfolios (see note 26).
We had a strong quarter to June with good net move-in growth. The second quarter peaked in August and then many of our studentsand short term house moves vacate in September and October, leadingto a net loss in occupied rooms and sq ft occupancy.
In the final quarter we have seen a return to growth in net occupiedrooms and increased occupancy in the stores by 123,000 sq ft. The table below illustrates the move-in performance in the year. Giventhe weaker economic backdrop to deliver broadly the same number ofmove-ins was a satisfactory performance.
26
Strategic Report (continued)
Store Performance
Total move-ins Total move-ins Net move-ins Net sq ft Year ended Year ended Year ended Year endedStore move-ins 31 March 2016 31 March 2015 % 31 March 2016 31 March 2016
April to June 20,112 20,196 0% 4,460 146,000July to September 21,763 21,873 (1%) (1,183) 54,000October to December 16,643 16,897 (2%) (1,998) (138,000)January to March 16,920 16,131 5% 1,420 123,000
Total 75,438 75,097 0% 2,699 185,000
In all Big Yellow stores, the occupancy growth in the current year was185,000 sq ft, against an increase of 267,000 sq ft in the prior year(the prior year figure excludes 79,000 sq ft of occupancy acquired withthe acquisitions of Chester and Oxford 2). This growth represents anaverage of 2,606 sq ft per store (2015: 3,870 sq ft per store).
The prior year increase included a one-off short term national accountmove-in of 25,000 sq ft who vacated in April 2015. Adjusting this outof both years would show current year occupancy growth of 210,000sq ft compared to 242,000 sq ft in the prior year.
Growth for Growth for Occupancy Occupancy year to year to 31 March 2016 31 March 2015 31 March 2016 31 March 2015Store occupancy summary 000 sq ft 000 sq ft 000 sq ft 000 sq ft
56 mature stores 2,689 2,589 100 14111 established stores 538 503 35 844 developing stores 136 86 50 42
Total – all 71 stores 3,363 3,178 185 267
The 56 mature stores are 76.9% occupied compared to 74.1% at thesame time last year. The 11 established stores have grown inoccupancy from 71.4% to 76.4%. The four developing stores added50,000 sq ft of occupancy in the year to reach closing occupancy of51.3%. Overall store occupancy has increased in the year from 73.2%to 75.3%. On a like-for-like basis, closing occupancy was 76.7%, anincrease of 3.5 percentage points.
70 of the stores open at the year end are trading profitably at theEBITDA level, with Cambridge the exception, having opened in January2016, and expected to break even in summer 2016.
Pricing and rental yieldWe have continued our sales promotion offer throughout the year of“50% off for up to your first 8 weeks storage”. Our Price Promise is alsoused to match competitors’ prices if the product is comparable. Pricingis dynamically generated and takes into account customer demandand local competition.
In the year ended 31 March 2016, the average growth in the netachieved rent per sq ft was 2.5% compared to 2.6% in the prior year.We remain focussed on occupancy and the outcome on portfolioaverage rental growth is merely a by-product of the yield managementat each store.
As our portfolio is now at a higher level of occupancy, our pricing modelis increasingly reducing promotions and is raising asking prices whereindividual units are in scarce supply. This lowering of promotions,coupled with price increases to existing and new customers, leads toan increase in net achieved rents. The table below illustrates this,showing the growth in net rent per sq ft for the portfolio over the period(the table below excludes Enfield and Cambridge which opened in the year).
Net rent per sq ftAverage occupancy Number growth overin the year of stores the year
0 to 60% 4 (1.9%)60 to 70% 13 1.6%70 to 80% 28 2.3%Above 80% 24 4.1%

The table below shows the average key metrics across the store portfolio for the year ended 31 March 2016:
Mature stores Established stores Developing stores
Store capacity 62,400 64,000 66,250Sq ft occupied per store at 31 March 2016 48,000 48,900 34,000% occupancy 76.9% 76.4% 51.3%Revenue per store (£000) 1,484 1,229 796EBITDA per store (£000) 1,018 833 414
EBITDA margin 68.6% 67.8% 51.9%
Development pipelineWe have planning consent to construct a new store in central Guildford,which we anticipate opening in Autumn 2017. We own a further sixdevelopment sites for which planning is to be negotiated, including twoexisting stores where planning is being sought to extend and redevelop.
We recently surrendered our 125 year lease in Manchester to the CityCouncil for £8 million and took a new 250 year lease on a site of 0.8 acres for which planning for a self storage centre will be sought.We also have an option to re-acquire an additional 0.7 acres if ourplanning application is unsuccessful.
Included within our development programme are London sites at KingsCross and Camberwell, acquired during the year. Kings Cross is a oneacre site on which we intend to develop a new build store of in excessof 90,000 sq ft, subject to planning. Camberwell is in Zone 2 to thesouth of London Bridge, and we intend to develop a new build store of65,000 to 70,000 sq ft, subject to planning.
In December 2014 we acquired the freehold interest of our existing34,000 sq ft store in Battersea, which had 12 years remaining on theoccupational lease together with a 14,100 sq ft retail unit let to Halfordson an annual rent of £458,000 with 6 years unexpired, part of whichis sublet to Pets at Home. This increased the freehold ownership of ourportfolio and protected our position in this important central Londonlocation. In the medium term, we will redevelop the 1.5 acre site toinclude a larger Big Yellow store together with other uses.
27
Armadillo Self StorageIn April 2014 we acquired the portfolio of 10 Armadillo stores, whichwe have been managing since 2009, with an Australian consortium.The Armadillo platform was grown in February 2015 with theacquisition of a further four stores following the purchase of BigStorage by the Group and its subsequent disposal to a company inwhich the Group has a 20% interest, with the balance held by anAustralian consortium.
In April 2016 we acquired a further two stores into the Armadilloplatform in Canterbury and West Molesey, for £6.4 million. This takesthe Armadillo platform to 16 stores and 745,000 sq ft of MLA.
Armadillo is a lower-frills brand, with largely freehold conversions ofexisting buildings, with a minimum capacity of 30,000 sq ft, in townswhere we would not typically locate a Big Yellow. Armadillo provides anumber of operational advantages to the Group, such as a widerplatform to sell to national accounts, more opportunities for staffpromotion, and more efficient use of the Company’s marketing and central overhead costs. The Group will consider other opportunitiesto add to the Armadillo platform if the right stores or portfolios become available.

The status of the Group’s development pipeline is summarised in the table below:
The Group acquired trading stores from Lock and Leave at Nine Elms and Twickenham in April 2016 for £14.6 million. Beyond this acquisition,there is currently no committed capital expenditure for the next financial year, although the Group intends to start the construction of Guildfordin the second half of the year.
The Group manages the construction and fit-out of its stores in-house, as we believe it provides both better control and quality, and we have anexcellent record of building stores on time and within budget.
28
Strategic Report (continued)
Store Performance (continued)
Site Location Status Anticipated capacity
Guildford Prime location in centre of Guildford onWoodbridge Meadows
Minor amendments to existingplanning consent being sought. Storedue to open in Autumn 2017, cost tocomplete of £5.5 million
56,000 sq ft
Manchester Prime location on Water Street incentral Manchester
Planning under negotiation 60,000 sq ft
Wandsworth,London
Possible extension of 27,000 sq ft toexisting 47,000 sq ft store
Planning under negotiation Additional 27,000 sq ft
Camberwell,London
Located in prominent location onSouthampton Way
Site recently acquired, planningapplication to be prepared
65,000 to 70,000 sq ft
Kings Cross,London
Prominent location on York Way Site recently acquired, planningapplication to be prepared
In excess of 90,000 sq ft
Battersea,London
Prominent location on junction of Lombard Road and York Road (South Circular)
Potential redevelopment of Big Yellowstore and adjoining retail in a mixeduse residential scheme to increase ourself storage capacity
Early design discussions with theBorough Council
Up to an additional 50,000 sq ft
Newcastle Prime location on Scotswood Road Negotiations ongoing with existinglong leasehold tenant to obtain vacant possession
50,000 sq ft to 60,000 sq ft
Financial results
RevenueTotal revenue for the year was £101.4 million, an increase of £17.1 million (20%) from £84.3 million in the prior year. Like-for-likerevenue for the year was £87.6 million, an increase of 10% from theprior year (2015: £79.9 million). Like-for-like revenue excludes the 12 Partnership stores (acquired December 2014), Chester (acquiredJanuary 2015), Enfield (opened April 2015) and Cambridge (openedJanuary 2016); the prior period figure also excludes management feesearned from Big Yellow Limited Partnership.
Other sales (included within the above), comprising the selling ofpacking materials, insurance and storage related charges, represented17.2% of storage income for the year (2015: 16.8%) and generatedrevenue of £14.6 million for the year, up 24% from £11.8 million in 2015.On a like-for-like basis, the increase in other sales was 9%.
The other revenue earned by the Group is management fee income,largely from the Armadillo Partnerships, and tenant income on siteswhere we have not started development.
Operating costsCost of sales comprises principally of the direct store operating costs,including store staff salaries, utilities, business rates, insurance, a fullallocation of the central marketing budget and repairs and maintenance.
The breakdown of the portfolio’s operating costs on a proforma basis(with the Partnership stores in full in both years) compared to the prioryear is shown in the table below (see Portfolio Summary):
29
Financial Review
Year ended Year ended % of store 31 March 2016 31 March 2015 operatingCategory £000 £000 % increase costs in 2016
Cost of sales (insurance and packing materials) 2,149 2,035 6% 7%Staff costs 8,001 7,512 7% 27%General & Admin 1,183 1,134 4% 4%Utilities 1,406 1,431 (2%) 5%Property Rates 9,544 9,144 4% 32%Marketing 3,865 3,431 13% 13%Repairs / Maintenance 2,240 2,088 7% 7%Insurance 992 912 9% 3%Computer Costs 440 442 0% 1%Irrecoverable VAT 266 227 17% 1%
Total 30,086 28,356 6%
Cost of sales in the income statement has increased by £5.2 million(19%) to £32.6 million (2015: £27.4 million). Of this increase £2.9 million arises as a result of including a full year of the operatingcosts of the Partnership stores acquired on 1 December 2014.
In the table above which shows the Partnership stores as if they had been owned for a full year, the operating costs have increased by£1.7 million. £0.8 million of this increase is due to new stores atEnfield, Cambridge and the full year impact of Chester. The remainingincrease of £0.9 million (representing a 3% increase on the prior yearon a like for like basis) is due to an increased investment in marketing,inflationary increases, coupled with the prior year figure being reducedby rates rebates at couple of stores.
Administrative expenses in the income statement have increased by£0.4 million compared to the prior year. This is due principally to anincrease of £0.5 million in the share based payment charge offset by areduction in legal and professional fees. In addition, it is important tonote that of our total £8.9 million administrative expense for the year,£2.5 million relates to the non-cash share based payments charge.
Like-for-like revenue for the year was £87.6 million, an increase of 10% fromthe prior year (2015: £79.9 million).
Delivering results

Basic earnings per share for the year was 71.9p (2015: 72.5p) and fullydiluted earnings per share was 71.6 p (2015: 71.9p). Diluted EPRAearnings per share based on adjusted profit after tax was up 15% to31.1p (2015: 27.1p) (see note 12). The percentage increase is lowerthan that reported for adjusted profit before tax due to the impact ofplacing an additional 14.4 million shares on 19 November 2014 to partfund the acquisition of the Big Yellow Limited Partnership stores.
REIT statusThe Group converted to a Real Estate Investment Trust (“REIT”) inJanuary 2007. Since then the Group has benefited from a zero tax rateon the Group’s qualifying self storage earnings. The Group only paystax on the profits attributable to our residual business, comprisingprimarily of the sale of packing materials and insurance, and feesearned from the management of the Armadillo portfolio.
REIT status gives the Group exemption from UK corporation tax onprofits and gains from its qualifying portfolio of UK stores. Revaluationgains on developments and our existing open stores will be exemptfrom corporation tax on capital gains, provided certain criteria are met.
The Group has a rigorous internal system in place for monitoringcompliance with criteria set out in the REIT regulations. On a monthlybasis, a report to the Executive on compliance with these criteria iscarried out. To date, the Group has complied with all REIT regulations,including forward looking tests.
TaxationThere is a tax charge in the current year of £0.2 million. This comparesto a tax credit in the prior year of £0.4 million. In the prior year the Groupreceived a refund of £0.2 million in relation to the REIT conversioncharge for two properties and there was a £0.3 million credit due to afavourable difference between the tax provision and actual tax liability.
The current year tax charge reflects an increase in profits in ourresidual business, in part offset by deductions allowed for taxpurposes from the exercise of share options.
DividendsThe Board is recommending the payment of a final dividend of 12.8pence per share in addition to the interim dividend of 12.1 pence, givinga total dividend for the year of 24.9 pence, an increase of 15% from theprior year.
REIT regulatory requirements determine the level of Property IncomeDividend (“PID”) payable by the Group. On the basis of the full yeardistributable reserves for PID purposes, a PID of 18.1 pence per shareis payable (31 March 2015: 16.1 pence). The balance of the total annualdividend represents an ordinary dividend declared at the discretion ofthe Board, in line with our policy to distribute 80% of our adjustedearnings per share in each reporting period.
30
Strategic Report (continued)
Financial Review (continued)
Store EBITDAStore EBITDA for the year included in the income statement was £67.8 million, an increase of £12.5 million (23%) from £55.3 million forthe year ended 31 March 2015. The increase including the Partnershipstores on a proforma basis in the prior year is 13% (2015: £59.9 million)(see Portfolio Summary).
The overall EBITDA margin for all Big Yellow stores during the year was68.0%, compared to 66.4% last year.
Interest expense on bank borrowings The gross bank interest expense for the year was £11.2 million, anincrease of £1.1 million from the prior year. This reflects the higher debtlevels following the acquisition of the Partnership stores in December2014 and capital expenditure in the current year, partly offset by areduction in the Group’s average cost of debt. The average cost ofborrowing during the year was 3.6% compared to 3.9% in the prior year.
Total interest payable has increased in the statement of comprehensiveincome from £10.7 million to £11.9 million principally due to theincrease in the gross bank interest expense mentioned above.Capitalised interest decreased by £0.2 million from the prior year. The interest capitalised in the year is principally on our Cambridgedevelopment.
Profit before taxThe Group made a profit before tax in the year of £112.2 million,compared to a profit of £105.2 million in the prior year.
After adjusting for the gain on the revaluation of investment propertiesand other matters shown in the table below, the Group made anadjusted profit before tax in the year of £49.0 million, up 24% from£39.4 million in 2015. 2016 2015Profit before tax analysis £m £m
Profit before tax 112.2 105.2Gain on revaluation of investment properties (58.0) (64.5)Movement in fair value on interest rate derivatives – 2.3Gains on surplus land (4.8) (1.3)Share of non-recurring gains in associates (0.4) (2.3)
Adjusted profit before tax 49.0 39.4
The movement in the adjusted profit before tax from the prior year isillustrated in the table below: £m
Adjusted profit before tax – year ended 31 March 2015 39.4Increase in gross profit 11.8Increase in net interest payable (1.1)Increase in administrative expenses (0.4)Decrease in share of recurring profit of associates (0.5)Decrease in capitalised interest (0.2)
Adjusted profit before tax – year ended 31 March 2016 49.0
31
The table below summarises the declared dividend for the year: 31 March 31 MarchDividend (pence per share) 2016 2015
Interim dividend – PID 12.1p 10.4p – discretionary nil p nil p – total 12.1p 10.4p
Final dividend – PID 6.0p 5.7p – discretionary 6.8p 5.6p – total 12.8p 11.3p
Total dividend – PID 18.1p 16.1p – discretionary 6.8p 5.6p – total 24.9p 21.7p
Subject to approval by shareholders at the Annual General Meeting tobe held on 22 July 2016, the final dividend will be paid on 28 July 2016.The ex-div date is 16 June 2016 and the record date is 17 June 2016.
Cash flow growthThe Group is strongly cash generative and draws down from its longerterm committed facilities as required to meet obligations.
A summary of the cash flow for the year is set out in the table below: Year ended Year ended 31 March 2016 31 March 2015 £000 £000
Cash generated from operations 66,215 51,875Net finance costs (including tax) (10,748) (9,478)
Free cash flow 55,467 42,397Capital expenditure (44,575) (42,786)Finance lease payments (967) (918)Acquisition of Big Yellow Limited Partnership – (37,406)Acquisition of Big Storage Limited – (15,114)Asset sales (including Big Storage Limited) 7,835 10,429Receipt from Capital Goods Scheme 184 3,557Investment in associates (net of dividends received) 270 (3,620)
Cash flow after investing activities 18,214 (43,461)Ordinary dividends (36,443) (27,890)Issue of share capital 378 77,094Non-recurring finance costs – (4,057)Net movement on Big Storage loans – 4,241Repayment of Partnership loan – (57,000)Increase in borrowings 26,864 55,966
Net cash inflow 9,013 4,893Opening cash and cash equivalents 8,194 3,301
Closing cash and cash equivalents 17,207 8,194Closing debt (312,198) (285,334)
Closing net debt (294,991) (277,140)
Free cash flow pre-capital expenditure increased by 31% to £55.5million for the year (2015: £42.4 million). In the year capitalexpenditure outflows were £44.6 million, down from £95.3 million inthe prior year (including acquisitions).
The capital expenditure during the year principally relates to theacquisition and construction of our new store in Cambridge and theacquisition of development sites at Kings Cross and Camberwell. Wehave also continued to invest in fitting out further Phase 2 space atour existing stores.
During the prior year we acquired an existing store in Oxford, thefreehold of Chester, the freehold of our store in Battersea and paid thedeposit on acquiring a site in Cambridge. We also constructed ourEnfield store and invested in Phase 2 fit outs. Additionally, we acquiredthe two thirds share of Big Yellow Limited Partnership and acquired,and subsequently disposed of the share capital of Big Storage Limitedwith four stores excluding the leasehold interest in Chester.
The cash flow after investing activities was a net inflow of £18.2 millionin the year, compared to an outflow of £43.5 million in 2015; theimprovement being due to one off acquisitions in the prior year asexplained above. The non-recurring finance costs in the prior yearrelate to £1.4 million of payments made to cancel interest ratederivatives and £2.6 million relating to arrangement fees paid for theM&G and senior debt loans.
Balance sheet
PropertyThe Group’s 71 stores and 5 stores under development at 31 March2016, which are classified as investment properties, have been valuedindividually by Cushman & Wakefield (“C&W”) and this has resulted inan investment property asset value of £1,126.2 million, comprising£1,050.3 million (93%) for the 65 freehold (including two longleaseholds) open stores, £41.9 million (4%) for the six short leaseholdopen stores and £34.0 million (3%) for the five freehold investmentproperties under construction. Revaluation Value at movementAnalysis of property portfolio 31 March 2016 in year
Investment property £1,092.2m £62.0mInvestment property under construction £34.0m (£4.0m)
Total £1,126.2m £58.0m
Investment propertyThe valuations in the current year have grown from the prior year, witha revaluation surplus of £62.0 million on the open Big Yellow stores. Of this increase £12.4 million is due to an improvement in the cap rateused in the valuations. £64.0 million of the increase in value is due tothe growth in cash flow from the assets and the operating assumptionsadopted in the valuations. These factors are in part offset by anincrease in the purchasers’ costs assumed in the valuation from 5.8%to a range of 6.1% to 6.8% reflecting the new progressive SDLT rates brought into force in March 2016, which reduced the valuationby £14.4 million.
Strategic Report (continued)
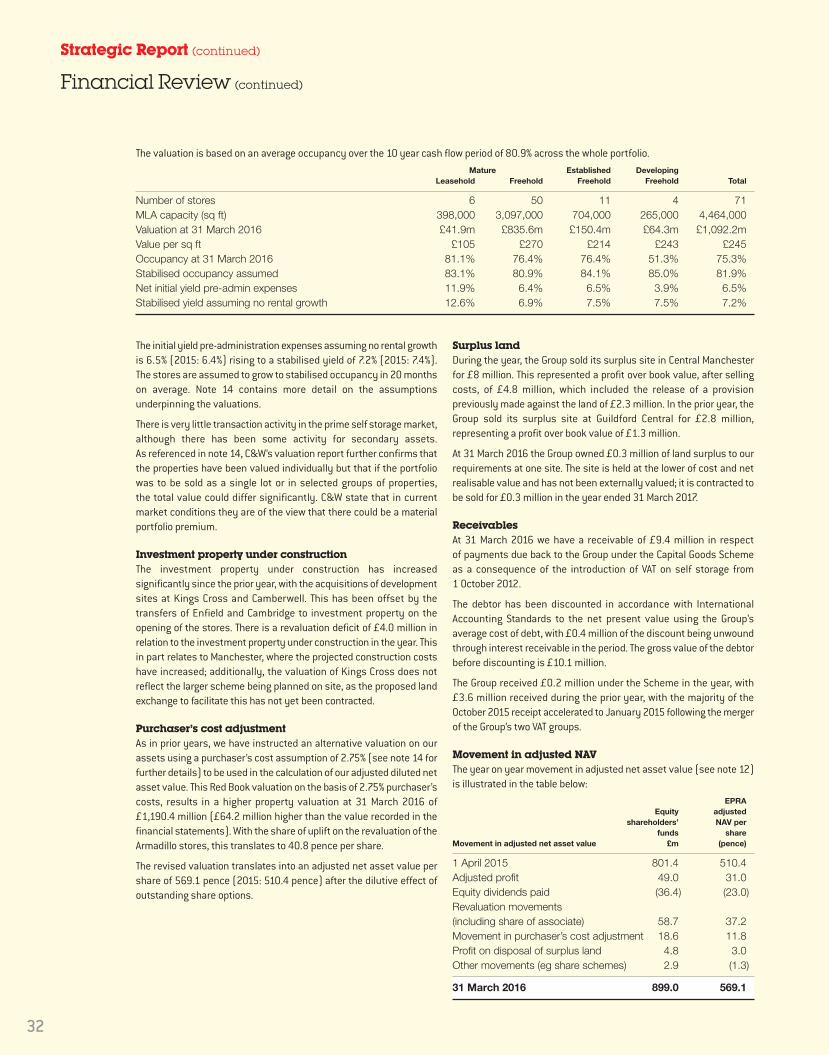
Financial Review (continued)
The valuation is based on an average occupancy over the 10 year cash flow period of 80.9% across the whole portfolio. Mature Established Developing Leasehold Freehold Freehold Freehold Total
Number of stores 6 50 11 4 71MLA capacity (sq ft) 398,000 3,097,000 704,000 265,000 4,464,000Valuation at 31 March 2016 £41.9m £835.6m £150.4m £64.3m £1,092.2mValue per sq ft £105 £270 £214 £243 £245Occupancy at 31 March 2016 81.1% 76.4% 76.4% 51.3% 75.3%Stabilised occupancy assumed 83.1% 80.9% 84.1% 85.0% 81.9%Net initial yield pre-admin expenses 11.9% 6.4% 6.5% 3.9% 6.5%Stabilised yield assuming no rental growth 12.6% 6.9% 7.5% 7.5% 7.2%
The initial yield pre-administration expenses assuming no rental growthis 6.5% (2015: 6.4%) rising to a stabilised yield of 7.2% (2015: 7.4%). The stores are assumed to grow to stabilised occupancy in 20 monthson average. Note 14 contains more detail on the assumptionsunderpinning the valuations.
There is very little transaction activity in the prime self storage market,although there has been some activity for secondary assets. As referenced in note 14, C&W’s valuation report further confirms thatthe properties have been valued individually but that if the portfoliowas to be sold as a single lot or in selected groups of properties, the total value could differ significantly. C&W state that in currentmarket conditions they are of the view that there could be a materialportfolio premium.
Investment property under construction The investment property under construction has increasedsignificantly since the prior year, with the acquisitions of developmentsites at Kings Cross and Camberwell. This has been offset by thetransfers of Enfield and Cambridge to investment property on theopening of the stores. There is a revaluation deficit of £4.0 million inrelation to the investment property under construction in the year. Thisin part relates to Manchester, where the projected construction costshave increased; additionally, the valuation of Kings Cross does notreflect the larger scheme being planned on site, as the proposed landexchange to facilitate this has not yet been contracted.
Purchaser’s cost adjustmentAs in prior years, we have instructed an alternative valuation on ourassets using a purchaser’s cost assumption of 2.75% (see note 14 forfurther details) to be used in the calculation of our adjusted diluted netasset value. This Red Book valuation on the basis of 2.75% purchaser’scosts, results in a higher property valuation at 31 March 2016 of£1,190.4 million (£64.2 million higher than the value recorded in thefinancial statements). With the share of uplift on the revaluation of theArmadillo stores, this translates to 40.8 pence per share.
The revised valuation translates into an adjusted net asset value pershare of 569.1 pence (2015: 510.4 pence) after the dilutive effect ofoutstanding share options.
32
Surplus land During the year, the Group sold its surplus site in Central Manchesterfor £8 million. This represented a profit over book value, after sellingcosts, of £4.8 million, which included the release of a provisionpreviously made against the land of £2.3 million. In the prior year, theGroup sold its surplus site at Guildford Central for £2.8 million,representing a profit over book value of £1.3 million.
At 31 March 2016 the Group owned £0.3 million of land surplus to ourrequirements at one site. The site is held at the lower of cost and netrealisable value and has not been externally valued; it is contracted tobe sold for £0.3 million in the year ended 31 March 2017.
ReceivablesAt 31 March 2016 we have a receivable of £9.4 million in respect of payments due back to the Group under the Capital Goods Schemeas a consequence of the introduction of VAT on self storage from 1 October 2012.
The debtor has been discounted in accordance with InternationalAccounting Standards to the net present value using the Group’saverage cost of debt, with £0.4 million of the discount being unwoundthrough interest receivable in the period. The gross value of the debtorbefore discounting is £10.1 million.
The Group received £0.2 million under the Scheme in the year, with£3.6 million received during the prior year, with the majority of theOctober 2015 receipt accelerated to January 2015 following the mergerof the Group’s two VAT groups.
Movement in adjusted NAVThe year on year movement in adjusted net asset value (see note 12)is illustrated in the table below: EPRA Equity adjusted shareholders’ NAV per funds shareMovement in adjusted net asset value £m (pence)
1 April 2015 801.4 510.4Adjusted profit 49.0 31.0Equity dividends paid (36.4) (23.0)Revaluation movements (including share of associate) 58.7 37.2Movement in purchaser’s cost adjustment 18.6 11.8Profit on disposal of surplus land 4.8 3.0Other movements (eg share schemes) 2.9 (1.3)
31 March 2016 899.0 569.1
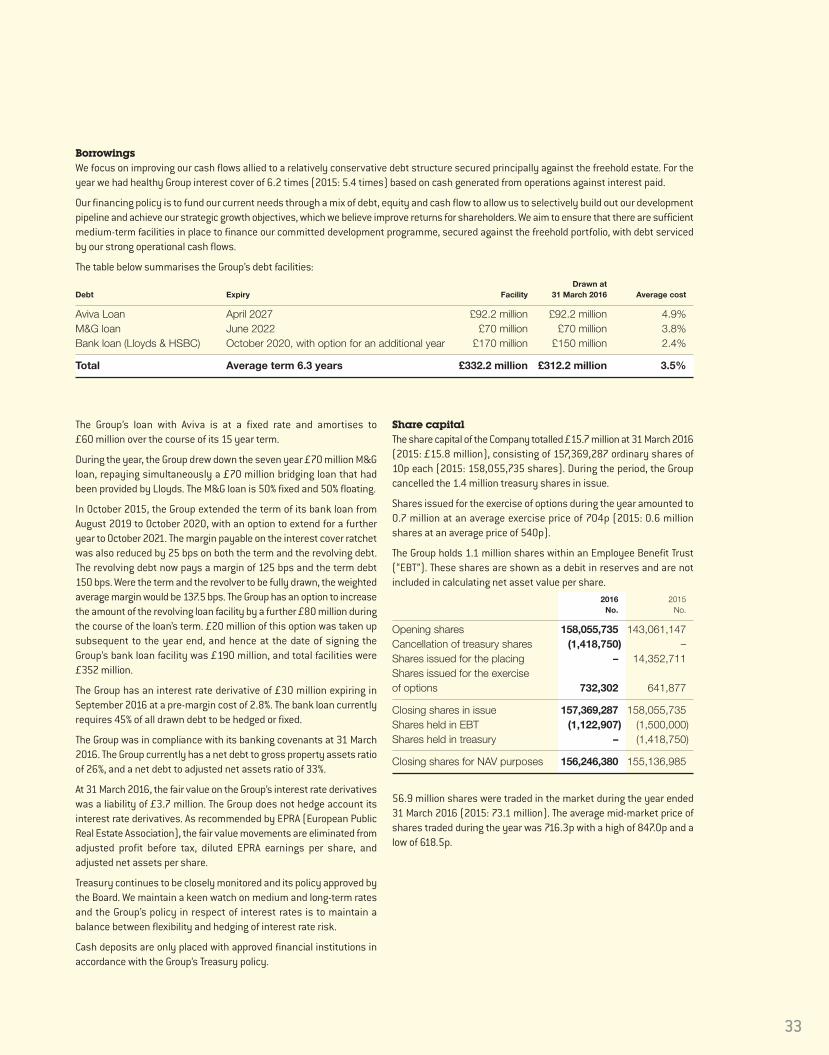
33
The Group’s loan with Aviva is at a fixed rate and amortises to £60 million over the course of its 15 year term.
During the year, the Group drew down the seven year £70 million M&Gloan, repaying simultaneously a £70 million bridging loan that hadbeen provided by Lloyds. The M&G loan is 50% fixed and 50% floating.
In October 2015, the Group extended the term of its bank loan fromAugust 2019 to October 2020, with an option to extend for a furtheryear to October 2021. The margin payable on the interest cover ratchetwas also reduced by 25 bps on both the term and the revolving debt.The revolving debt now pays a margin of 125 bps and the term debt150 bps. Were the term and the revolver to be fully drawn, the weightedaverage margin would be 137.5 bps. The Group has an option to increasethe amount of the revolving loan facility by a further £80 million duringthe course of the loan’s term. £20 million of this option was taken upsubsequent to the year end, and hence at the date of signing theGroup’s bank loan facility was £190 million, and total facilities were£352 million.
The Group has an interest rate derivative of £30 million expiring inSeptember 2016 at a pre-margin cost of 2.8%. The bank loan currentlyrequires 45% of all drawn debt to be hedged or fixed.
The Group was in compliance with its banking covenants at 31 March2016. The Group currently has a net debt to gross property assets ratioof 26%, and a net debt to adjusted net assets ratio of 33%.
At 31 March 2016, the fair value on the Group’s interest rate derivativeswas a liability of £3.7 million. The Group does not hedge account itsinterest rate derivatives. As recommended by EPRA (European PublicReal Estate Association), the fair value movements are eliminated fromadjusted profit before tax, diluted EPRA earnings per share, andadjusted net assets per share.
Treasury continues to be closely monitored and its policy approved bythe Board. We maintain a keen watch on medium and long-term ratesand the Group’s policy in respect of interest rates is to maintain abalance between flexibility and hedging of interest rate risk.
Cash deposits are only placed with approved financial institutions inaccordance with the Group’s Treasury policy.
BorrowingsWe focus on improving our cash flows allied to a relatively conservative debt structure secured principally against the freehold estate. For theyear we had healthy Group interest cover of 6.2 times (2015: 5.4 times) based on cash generated from operations against interest paid.
Our financing policy is to fund our current needs through a mix of debt, equity and cash flow to allow us to selectively build out our developmentpipeline and achieve our strategic growth objectives, which we believe improve returns for shareholders. We aim to ensure that there are sufficientmedium-term facilities in place to finance our committed development programme, secured against the freehold portfolio, with debt servicedby our strong operational cash flows.
The table below summarises the Group’s debt facilities: Drawn atDebt Expiry Facility 31 March 2016 Average cost
Aviva Loan April 2027 £92.2 million £92.2 million 4.9%M&G loan June 2022 £70 million £70 million 3.8%Bank loan (Lloyds & HSBC) October 2020, with option for an additional year £170 million £150 million 2.4%
Total Average term 6.3 years £332.2 million £312.2 million 3.5%
Share capital The share capital of the Company totalled £15.7 million at 31 March 2016(2015: £15.8 million), consisting of 157,369,287 ordinary shares of10p each (2015: 158,055,735 shares). During the period, the Groupcancelled the 1.4 million treasury shares in issue.
Shares issued for the exercise of options during the year amounted to0.7 million at an average exercise price of 704p (2015: 0.6 millionshares at an average price of 540p).
The Group holds 1.1 million shares within an Employee Benefit Trust(“EBT”). These shares are shown as a debit in reserves and are notincluded in calculating net asset value per share. 2016 2015 No. No.
Opening shares 158,055,735 143,061,147Cancellation of treasury shares (1,418,750) –Shares issued for the placing – 14,352,711Shares issued for the exercise of options 732,302 641,877
Closing shares in issue 157,369,287 158,055,735Shares held in EBT (1,122,907) (1,500,000)Shares held in treasury – (1,418,750)
Closing shares for NAV purposes 156,246,380 155,136,985
56.9 million shares were traded in the market during the year ended31 March 2016 (2015: 73.1 million). The average mid-market price ofshares traded during the year was 716.3p with a high of 847.0p and alow of 618.5p.

Strategic Report (continued)
Financial Review (continued)
Armadillo Self StorageThe Group has a 20% investment in Armadillo Storage Holding CompanyLimited and a 20% investment in Armadillo Storage Holding Company2 Limited. In the consolidated accounts of Big Yellow Group PLC, ourinvestments in the vehicles are treated as associates using the equityaccounting method.
The combined occupancy of the portfolios is 477,000 sq ft, against a totalcapacity of 673,000 sq ft, with growth of 14,000 sq ft over the year.The stores’ occupancy at 31 March 2016 was 70.9% (31 March 2015:68.8%). The net rent achieved at 31 March 2016 by the Armadillo storesis £15.59 per sq ft, an increase of 3% from the same time last year.Revenue increased by 5% to £9.0 million for the year to 31 March 2016(2015: £8.6 million).
The Armadillo Partnerships made a combined operating profit of £4.3 million in the year, of which Big Yellow’s share is £0.9 million. After net interest costs, the revaluation of investment properties(valued by Jones Lang Lasalle), deferred tax on the revaluation surplusand interest rate derivatives, the profit for the year was £5.6 million,of which the Group’s share was £1.1 million.
Big Yellow has a five year management contract in place in eachPartnership. For the year to 31 March 2016, the Group earnedmanagement fees of £0.7 million. The Group’s share of the declareddividend for the year is £0.4 million, representing a 10% yield on ourinvestment for the year.
34
Principal risks and uncertaintiesThe Directors have carried out a robust assessment of the principal risks facing the Company, including those that would threaten its businessmodel, future performance, solvency or liquidity.
The section below details the principal risks and uncertainties that are considered to have the most material impact on the Group’s strategy andobjectives. These key risks are monitored on an ongoing basis by the Executive Directors, and considered fully by the Board in its annual risk review.
Risk and impact
Self storage market riskThere is a risk to the business that theself storage market does not grow in linewith our projections, and that economicgrowth in the UK is below expectations,which could result in falling demand anda loss of income.
MitigationThe UK economy is projected to grow at approximately 2% in 2016, and is now ahead of the levelof output last achieved in 2007 before the global financial crisis. Self storage has provedrelatively resilient through the crisis, with our revenue and earnings increasing over the last sixyears. As the economy has recovered in the past few years, the market risk has fallen in line withincreasing occupancy.
Self storage is a relatively immature market in the UK compared to other self storage marketssuch as the United States and Australia, and we believe has further opportunity for growth.Awareness of self storage and how it can be used by domestic and business customers isrelatively low throughout the UK, although higher in London. The rate of growth of branded selfstorage on main roads in good locations has historically been limited by the difficulty ofacquiring sites at affordable prices and obtaining planning consent. The lack of availability ofcredit within the economy has further reduced this rate of growth since the start of thedownturn, and new store openings within the sector have slowed to an average of 11 stores peryear over the past six years, down from a peak of 34 per year in 2005-2009.
Our performance during the downturn was relatively resilient, although not immune. We believethat the resilience of our performance is due to a combination of factors including:
> a prime portfolio of freehold self storage properties;> a focus on London and the South East and other large metropolitan cities, which have proved
more resilient during the downturn and where the drivers in the self storage market are attheir strongest and the barriers to competition are at their highest;
> the strength of operational and sales management;> continuing innovation to deliver the highest levels of customer service;> the UK’s leading self storage brand, with high public awareness and online strength; and> strong cash flow generation and high operating margins, from a secure capital structure.
We have a large current storage customer base of approximately 50,000 spread across theportfolio of stores and many thousands more who have used Big Yellow over the years. In anymonth, customers move in and out at the margin resulting in changes in occupancy. This is aseasonal business and typically we see growth over the spring and the summer months, withthe seasonally weaker periods being the winter months.
The Group’s like-for-like occupancy has increased by 3.5 percentage points in the year from73.2% to 76.7%.
35
Property riskThere is a risk that we will be unable toacquire new development sites whichmeet management’s criteria. This wouldimpact on our ability to grow the overallstore platform.
Given the recent acquisitions of sites inLondon, the risk to the Group from failureto obtain planning has increased fromthe prior year.
Our management has significant experience in the property industry generated over many yearsand in particular in acquiring property on main roads in high profile locations and obtainingplanning consents. We do take planning risk where necessary, that said, the availability of land,and competition for it makes acquiring new sites challenging.
The planning process remains difficult with some planning consents taking in excess of twelvemonths to achieve. Our in-house development team and our professional advisers havesignificant experience in obtaining planning consents for self storage centres.
We manage the construction of our properties very tightly. The building of each site is handledthrough a design and build contract, with the fit out project managed in-house using anestablished professional team of external advisers and sub-contractors who have worked with usfor many years to our Big Yellow specification. We carried out an external benchmarking of ourconstruction costs and tendering programme in the year, which had satisfactory results.
Valuation riskThe valuations of the Group’s investmentproperties may fall due to externalpressures or the impact of performance.
Lack of transactional evidence in the self storage sector leads to moresubjective valuations.
The valuations are carried out by independent, qualified external valuers who value a significantproportion of the UK self storage industry.
The portfolio is diverse with approximately 50,000 customers currently using our stores for awide variety of reasons.
There is significant headroom on our loan to value banking covenants.
Treasury risk
The Group may face increased costs fromadverse interest rate movements.
Our financing policy is to fund our current needs through a mix of debt, equity and cash flow toallow us to selectively build out the remaining development pipeline and achieve our strategicgrowth objectives, which we believe improve returns for shareholders. We have made it clear thatwe believe optimal leverage for a business such as ours should be LTV in the range 20% to 30%and this informs our management of treasury risk.
We aim to ensure that there are sufficient medium-term facilities in place to finance ourcommitted development programme, secured against the freehold portfolio, with debt servicedby our strong operational cash flows.
We have a fixed rate loan in place from Aviva Commercial Finance Limited, with 11 yearsremaining. In the year, the Group drew down on a seven year £70 million loan from M&GInvestments, which is 50% fixed and 50% floating. For our bank debt, we borrow at floating ratesof interest and use swaps to hedge our interest rate exposure. Our policy is to have at least 45%of our total borrowings fixed, with the balance floating paying margin over LIBOR. At 31 March2016 50% of the Group’s total borrowings were fixed or subject to interest rate derivatives. TheGroup’s interest cover ratio for the year to 31 March 2016 was 6.2 times, which has increasedfrom 5.4 times in the prior year.
The Group reviews its current and forecast projections of cash flow, borrowing and interest coveras part of its monthly management accounts. In addition, an analysis of the impact of significanttransactions is carried out regularly, as well as a sensitivity analysis assuming movements ininterest rates and occupancy in the stores on gearing and interest cover. This sensitivity testingunderpins the viability statement below.
The Group regularly monitors its counterparty risk. The Group monitors compliance with itsbanking covenants closely. During the year it complied with all its covenants, and is forecast todo so for the foreseeable future.
Credit riskThe Group is exposed to a credit risk fromits customers.
Our customers are required to pay a deposit when they start to rent a self storage room and arealso required to pay in advance for their four-weekly storage charges. The Group is therefore notexposed to a significant credit risk. 81% of our current customers pay by direct debit; howeverof new customers moving into the business in the last year 83% have paid by direct debit.Businesses often prefer to pay by cheque or BACS. Since 2007 we have not seen an increasein the levels of bad debts and arrears. In the year to 31 March 2016 our bad debt expenserepresented 0.08% of revenue in the year, a reduction from 0.15% in the prior year.

Strategic Report (continued)
Financial Review (continued)
36
Taxation risk The Group is exposed to changes in the taxregime affecting the cost of corporationtax, VAT and Stamp Duty Land Tax (“SDLT”),for example the imposition of VAT on selfstorage from 1 October 2012.
We regularly monitor proposed and actual changes in legislation with the help of our professionaladvisers, through direct liaison with HMRC, and through trade bodies to understand and, ifpossible, mitigate or benefit from their impact.
The Government announced a review of property rates last year. This is a significant cost to thebusiness, and we are monitoring any potential impact from a revision in the basis of assessmentor taxation.
Real Estate Investment Trust(“REIT”) riskThe Group is exposed to potential taxpenalties or loss of its REIT status byfailing to comply with the REIT legislation.
The Group has internal monitoring procedures in place to ensure that the appropriate rules andlegislation are complied with. To date all REIT regulations have been complied with, includingprojected tests.
Human resources riskOur people are key to our success and assuch we are exposed to a risk of highstaff turnover, and a risk of the loss ofkey personnel.
With the economy improving andunemployment falling, the risk of higherstaff turnover and difficulty in finding theright employees increases.
We have developed a professional, lively and enjoyable working environment and believe oursuccess stems from attracting and retaining the right people. We encourage all our staff to buildon their skills through appropriate training and regular performance reviews. We believe in anaccessible and open culture and everyone at all levels is encouraged to review and challengeaccepted norms, so as to contribute to the performance of the Group.
We were pleased to be ranked 80th in the Sunday Times Best 100 Companies to Work For surveyin 2016.
Security risk The Group is exposed to the risk of thedamage or loss of store due to vandalism,fire, or natural incidents such as flooding.This may also cause reputational damage.
The safety and security of our customers, their belongings, and stores remains a key priority. To achieve this we invest in state of the art access control systems, individual room alarms,digital CCTV systems, intruder and fire alarm systems and the remote monitoring of all our storesoutside of our trading hours. We are the only major operator in the UK self storage industry thathas every room in every store individually alarmed.
We have implemented customer security procedures in line with advice from the Police andcontinue to work with the regulatory authorities on issues of security, reviewing our operationalprocedures regularly. The importance of security and the need for vigilance is communicated toall store staff and reinforced through training and routine operational procedures. We havecontinued to run courses for all our staff to enhance the awareness and effectiveness of ourprocedures in relation to security.
Cyber riskThere have been a number of high profilecyber-attacks / data security breachesover the last 12 months and the Groupconsiders the risks to the website andinternal systems to have increased overthe year.
This risk hasn’t increased any faster forthe Group than anyone else; we considerthat the threats in the entire digitallandscape continue to increase. Theresults of any breach may result inreputational damage, or customercompensation, causing a loss of marketshare and income.
The Group receives specialist advice and consultancy in respect of cyber security and we havededicated in-house monitoring and regular reviews of our security systems. We also limit theretention of customer data to the minimum requirement.
During the year we have continued to invest in digital security, implementing new intrusiondetection systems as well as the replacement of existing systems such as firewalls. Policies andprocedures are under regular review and benchmarked against industry best practice by ourconsultants. These policies also include defend, detect and response policies.

Internal auditThe Group does not have a formal internal audit function because theBoard has concluded that the internal controls systems are sufficientfor the Group at this time. However, the Group employs a StoreCompliance Manager responsible for reviewing store operational andfinancial controls. He reports to the Chief Financial Officer, and alsomeets with the Audit Committee at least once a year. This role issupported by an Assistant Store Compliance Manager, enablingadditional work and support to be carried out across the Group’s storeportfolio. The Store Compliance team visit each operational store twicea year to carry out a detailed store audit. These audits areunannounced and the Store Compliance team carry out detailed testson financial management within the stores, administrative standards,and operational standards. Part of the store staff’s bonus is based onthe scores they achieve in these audits. The results of each audit arereviewed by the Chief Financial Officer, the Financial Controller and theHead of Store Operations.
GOING CONCERNA review of the Group’s business activities, together with the factorslikely to affect its future development, performance and position areset out in the Strategic Report. The financial position of the Group, itscash flows, liquidity position and borrowing facilities are shown in thebalance sheet, cash flow statement and accompanying notes in thefinancial statements. Further information concerning the Group’sobjectives, policies and processes for managing its capital; its financialrisk management objectives; details of its financial instruments andhedging activities; and its exposures to credit risk and liquidity riskcan be found in this Report and in the notes to the financial statements.
After reviewing Group and Company cash balances, borrowing facilities,forecast valuation movements and projected cash flows, the Directorsbelieve that the Group and Company have adequate resources tocontinue operations for the foreseeable future. In reaching thisconclusion the Directors have had regard to the Group’s operating planand budget for the year ending 31 March 2017 and projectionscontained in the longer-term business plan which covers the period toMarch 2020. The Directors have considered carefully the Group’strading performance and cash flows as a result of the uncertain globaleconomic environment and the other principal risks to the Group’sperformance and are satisfied with the Group’s positioning. For thisreason, they continue to adopt the going concern basis in preparingthe financial statements.
VIABILITY STATEMENTThe Directors have assessed the Group’s viability over a four yearperiod to March 2020. This is based on the Group’s long term strategicplan with the period selected to give greater certainty over theforecasting assumptions used.
In making their assessment, the Directors took account of the Group’scurrent financial position, including committed capital expenditure. TheDirectors also assessed the potential financial impact of the variousrisks and uncertainties set out in the report above on the Group’s cashflows, REIT compliance and financial covenants and the likelyeffectiveness of the mitigating options detailed. The Directors haveassumed that funding for the business in the form of equity and bankand insurance debt will be available in all plausible market conditions.
Based on this assessment the Directors have a reasonable expectationthat the Company and the Group will be able to continue in operatingand meet all their liabilities as they fall due to March 2020.
37

1.0 INTRODUCTIONBig Yellow recognises that a high level of Corporate Social Responsibility (“CSR”), linked to clear commercial objectives, will create a moresustainable business and increase shareholder and customer value. Our CSR policy covers all of our operations, as a self storage provider,a real estate developer, an employer and a participant in our local communities.
Big Yellow seeks to meet the demand for self storage from businesses and private individuals providing the storage space for their commercialand/or domestic needs, whilst aiding local employment creation and contributing to local community regeneration.
2.0 CSR EXECUTIVE SUMMARYBig Yellow is pleased to deliver another year of steady CSR progress across the Group. Our focus over the last 12 months has delivered thefollowing benefits:
• Our successful entry into the Sunday Times 100 Best Companies to Work For, after a survey response rate of 81% from our team –compared to an average of 63% from other companies. We achieved a Two Star Status in the Best Companies Accreditation, with only21% of the entrants bettering our status.
• Supporting 14 different local charities elected by our stores and by our head office teams; our people undertook a variety of activitiesfor these (and a few other) charities and raised over £45,000 of funds during the year. At the same time Big Yellow and Armadillo SelfStorage donated the equivalent of over £753,000 of free storage in the same period.
• Big Yellow’s Health & Safety record on our construction sites and at our stores maintained its exemplary high standards. Measured byboth the number of recorded Minor Injuries – and by RIDDOR (Reporting of Injuries, Diseases and Dangerous Occurrences Regulation)– our high standards of health and safety have continued to be delivered to our customers, staff, contractors and other visitors.Furthermore, we have continued to manage our construction sites under the controlling factors of the CCS (Considerate ConstructorsScheme).
• Our continued investment in LED lighting – and in fuel efficient gas heating systems at our flexi-offices – has delivered reduced carbonemissions in both absolute and like-for-like measures. Our total annual Carbon emissions are now 35.2% lower than our peak year of2011. Furthermore – if we look at these emissions in relation to our occupancy – our carbon per square metre occupied is down 58.0%from our 2011 peak.
• We have continued to open new stores with sustainable energy generation investments. In the last 12 months our new solar investmentat Enfield (a new store) has added to our supply chain, which has now grown by 335% since 2011. Our 17 stores with solar energysystems now generate 15.4% of the total electricity they need from sustainable sources.
• We continue to benchmark our CSR performance against credible certifications where we consider them to be relevant. 42% of ourstores hold EPC’s (Energy Performance Certificates), the majority of which are rated A or B. We have assessed a selection of stores tocomply with the UK Energy Savings Opportunity Scheme (ESOS) and are considering the outcome of these surveys for future sustainableinitiatives. We continue to participate in sustainable benchmarking initiatives such as the FTSE4Good, EPRA, Carbon Disclosure Project(CDP) and the Global Real Estate Sustainability Benchmark (GRESB).
Finally, we continue to plan for the future and to continue to deliver sustainable benefits to the Group. We aim to reduce our GreenhouseGas Emissions (GHG) from the 2008 peak by 40.4% by 2020. We will achieve this by continuing our investment in LED lighting, solar PVsystems on our store roofs and other sustainable initiatives identified from our ESOS surveys.
38
Strategic Report (continued)
Corporate Social Responsibility Report
Big Yellow recognises that a high level of Corporate Social Responsibility (“CSR”),linked to clear commercial objectives, will create a more sustainable business andincrease shareholder and customer value.

39
2.1 OUR PEOPLEOur people are at the heart of Big Yellow’s business, bringing our values to life through the service that they provide, and bringing the energyand passion that drives us to become an ever more responsible and sustainable business.
We recognise that recruiting, retaining and motivating individuals with talent and integrity – and ensuring that we listen to our people andmaximise their skills and performance - is key to the continued success of our Company.
We encourage a culture of partnership within the business and believe in staff participating in corporate performance through benefits,such as bonus schemes and share incentives. We recognise and reward the exceptional performance, achievements and ideas of our peoplethrough a Points Recognition Scheme, and awarded £55,000 of points to our staff for the year ended 31 March 2016.
Wellbeing and Support We aim to promote employee wellbeing through a range of flexible working options which include flexitime, staggered hours, home workingand sabbaticals. We provide Childcare Vouchers along with a comprehensive range of medical support and advice through our privatehealthcare scheme and occupational health providers. We have arranged corporate gym membership on a national basis, as well as a “Cycleto Work” scheme and Employee Assistance Programmes.
Communication and Engagement We continue to recognise the importance of communication and consultation with our people and provide an annual spring conference,regular formal and informal meetings, quarterly newsletters and weekly operational updates. In addition, the Directors and seniormanagement spend a significant amount of time in the stores and are accessible to employees at all levels.
In February 2016, we were named as one of the Sunday Times 100 Best Companies to Work For. We are particularly proud of this achievementgiven a total of 1,336 companies initially applied to participate in this process and we achieved a survey response rate of 81%, comparedto an average of 62.6%.
In addition, we also achieved Two Star Status in the Best Companies Accreditation. In total, 768 companies gained accreditation, with only21% having bettered us in achieving three stars. Our Two Star Status demonstrates that we have achieved outstanding levels of employeeengagement within the Company.
Training and Development We continue to promote the development of staff through ongoing training and regular performance appraisals. For the year ended 31 March2016 a total of 960 days training was provided across the Company, comprising of both sales and operational training and personal andmanagement development.
Our “Big Impressions” customer experience programme continued throughout the year, with one element of the programme being re-designedto further support our teams in completely understanding and fulfilling the needs of our customers.
During the last year, ten staff have completed our personal development programme designed specifically for Assistant Store Managers,with four of those people having subsequently been promoted to the position of Store Manager. Eight Assistant Store Managers are currentlyparticipating in the programme, to prepare them for their future progression within the Company.
As a result of this programme and our other internal training and development programmes, 55% of our store based staff have been promotedfrom within the business to their existing position.
We recognise the importance ofsupporting local community projectsand charities through fundraising anddonating free storage space.
During the year we donated space inour stores worth approximately£753,000 to charities.

40
Strategic Report (continued)
Corporate Social Responsibility Report (continued)
2.0 CSR EXECUTIVE SUMMARY (continued)Community We recognise the importance of contributing within the local community and we encourage our people to develop close links with charities,schools and other institutions, both locally and nationally, to help to build more economically sustainable environments.
For the year ended 31 March 2016, we recognised and supported 14 different Company charities which were elected by our store and headoffice teams. Our people undertook a variety of activities for both these and other charities, with donations also being made by the Company.
Throughout the year a total of £29,000 was raised for our Company charities and £16,000 was raised for other charities.
Examples of our fundraising activities have included:
The Anne Rowling ClinicOne of our team members ran the Edinburgh Half Marathon, Great North Run and Great Birmingham Run and raised nearly £1,600 for theAnne Rowling Clinic, which is a charitable University of Edinburgh research facility focusing on a wide range of neurological conditions,especially neurodegenerative diseases.
“Donations from the dedicated fundraising efforts of John Laffey, from Big Yellow Self Storage are already making an impact on thelives of patients with MS and other neurodegenerative diseases. The research work at the Anne Rowling Regenerative Neurology Clinicwill help us to apply the latest discoveries in regenerative medicine to neurodegenerative diseases and we are committed to discoveringtherapies that will slow, stop or even reverse the damage that these diseases cause. Our patients are grateful for the generous donationsand have asked us to pass on their thanks to both John and Big Yellow. We would like to thank John for running so hard and far to raiseawareness and funds for the Anne Rowling Clinic”.
Kerry Mackay, Individual Giving Officer, The Anne Rowling Clinic
British Heart Foundation Nine of our stores have acted as “Donation Stations” for the British Heart Foundation, raising a total of just under £23,000 for the year frombags of unwanted clothes and household goods, which will support the charity’s pioneering heart research, as well as the care of peopleliving with heart disease.
In addition a further £3,200 has been raised across the year by various members of staff completing sponsored swims, runs and cycle rides.
“We are delighted with the continued support we have received from Big Yellow staff and customers over the last few years. We’re verygrateful for the unwanted items that have been donated. By selling these in British Heart Foundation shops and stores, and fundraisingactivities that have taken place, over £45,000 has been raised to date which will help fund our life saving research. It’s wonderful tohave the support of Big Yellow and we are looking forward to another successful year of our partnership”
Clare Appleby, Corporate Partnerships Account Manager, British Heart Foundation
Go Dad RunBig Yellow provided sponsorship of £20,000 for the Go Dad Run in June 2015, the aim of which is to raise awareness of, and funds for,Prostate Cancer UK through a series of 5k and 10k runs.
House of St BarnabusA total of £3,500 was raised at a Big Yellow hosted lunch for our construction suppliers to support this London based charity, whose aim isto make lasting employment a reality for those affected by homelessness and social exclusion.
Southwark Tigers Rugby ClubDuring the last year, Big Yellow has provided sponsorship of £2,500 to this inner city junior rugby club whose aim is to benefit young peoplethrough the skills learnt in the game of rugby and make it affordable and attractive to all.
“Big Yellow Storage have always been a keen supporter of Southwark Tigers Rugby Club, the first inner city rugby club in Britain.Whenever the club needs a boost, when the kit starts to look tatty, or new balls are required, the Company steps up immediately tohelp. The support of Big Yellow has helped us immensely. We are now encouraging Southwark council to build an artificial rugby pitchthat will allow us to really develop rugby in the area”.
Vernon Neve-Dunn, Chairman, Southwark Tigers Rugby Club
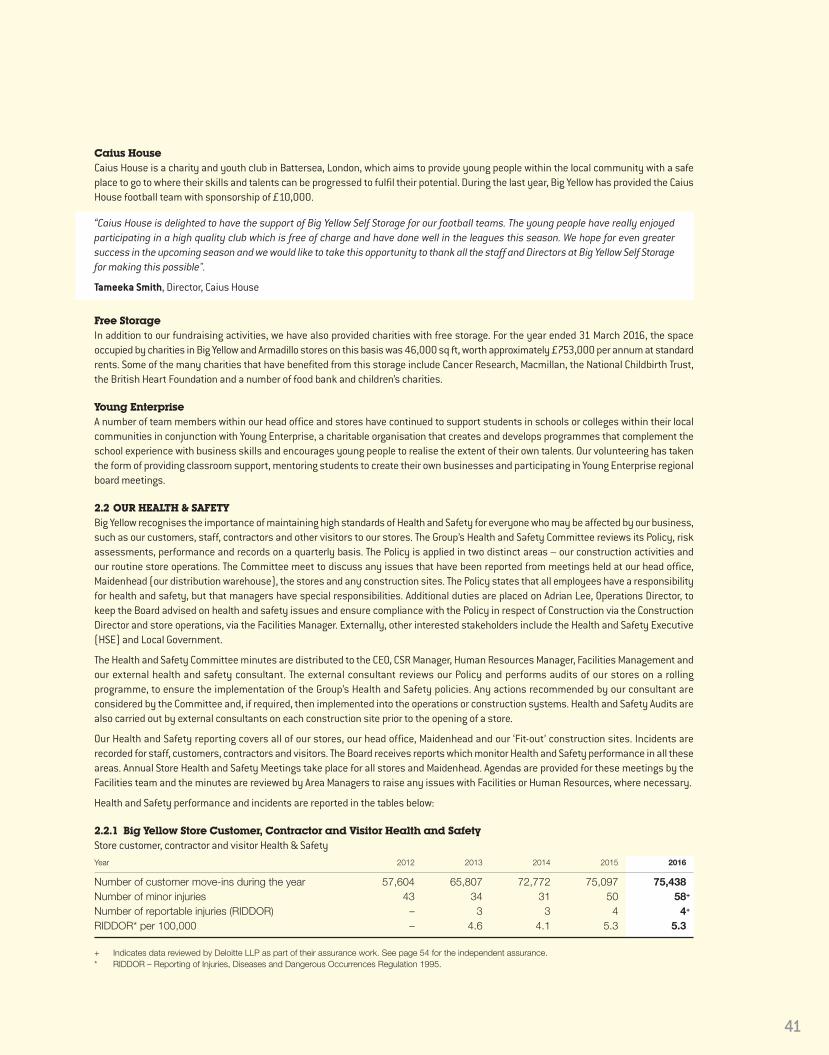
41
Caius HouseCaius House is a charity and youth club in Battersea, London, which aims to provide young people within the local community with a safeplace to go to where their skills and talents can be progressed to fulfil their potential. During the last year, Big Yellow has provided the CaiusHouse football team with sponsorship of £10,000.
“Caius House is delighted to have the support of Big Yellow Self Storage for our football teams. The young people have really enjoyedparticipating in a high quality club which is free of charge and have done well in the leagues this season. We hope for even greatersuccess in the upcoming season and we would like to take this opportunity to thank all the staff and Directors at Big Yellow Self Storagefor making this possible".
Tameeka Smith, Director, Caius House
Free Storage In addition to our fundraising activities, we have also provided charities with free storage. For the year ended 31 March 2016, the spaceoccupied by charities in Big Yellow and Armadillo stores on this basis was 46,000 sq ft, worth approximately £753,000 per annum at standardrents. Some of the many charities that have benefited from this storage include Cancer Research, Macmillan, the National Childbirth Trust,the British Heart Foundation and a number of food bank and children’s charities.
Young Enterprise A number of team members within our head office and stores have continued to support students in schools or colleges within their localcommunities in conjunction with Young Enterprise, a charitable organisation that creates and develops programmes that complement theschool experience with business skills and encourages young people to realise the extent of their own talents. Our volunteering has takenthe form of providing classroom support, mentoring students to create their own businesses and participating in Young Enterprise regionalboard meetings.
2.2 OUR HEALTH & SAFETYBig Yellow recognises the importance of maintaining high standards of Health and Safety for everyone who may be affected by our business,such as our customers, staff, contractors and other visitors to our stores. The Group’s Health and Safety Committee reviews its Policy, riskassessments, performance and records on a quarterly basis. The Policy is applied in two distinct areas – our construction activities andour routine store operations. The Committee meet to discuss any issues that have been reported from meetings held at our head office,Maidenhead (our distribution warehouse), the stores and any construction sites. The Policy states that all employees have a responsibilityfor health and safety, but that managers have special responsibilities. Additional duties are placed on Adrian Lee, Operations Director, tokeep the Board advised on health and safety issues and ensure compliance with the Policy in respect of Construction via the ConstructionDirector and store operations, via the Facilities Manager. Externally, other interested stakeholders include the Health and Safety Executive(HSE) and Local Government.
The Health and Safety Committee minutes are distributed to the CEO, CSR Manager, Human Resources Manager, Facilities Management andour external health and safety consultant. The external consultant reviews our Policy and performs audits of our stores on a rollingprogramme, to ensure the implementation of the Group’s Health and Safety policies. Any actions recommended by our consultant areconsidered by the Committee and, if required, then implemented into the operations or construction systems. Health and Safety Audits arealso carried out by external consultants on each construction site prior to the opening of a store.
Our Health and Safety reporting covers all of our stores, our head office, Maidenhead and our ‘Fit-out’ construction sites. Incidents arerecorded for staff, customers, contractors and visitors. The Board receives reports which monitor Health and Safety performance in all theseareas. Annual Store Health and Safety Meetings take place for all stores and Maidenhead. Agendas are provided for these meetings by theFacilities team and the minutes are reviewed by Area Managers to raise any issues with Facilities or Human Resources, where necessary.
Health and Safety performance and incidents are reported in the tables below:
2.2.1 Big Yellow Store Customer, Contractor and Visitor Health and SafetyStore customer, contractor and visitor Health & Safety Year 2012 2013 2014 2015 2016
Number of customer move-ins during the year 57,604 65,807 72,772 75,097 75,438Number of minor injuries 43 34 31 50 58+
Number of reportable injuries (RIDDOR) – 3 3 4 4+
RIDDOR* per 100,000 – 4.6 4.1 5.3 5.3
+ Indicates data reviewed by Deloitte LLP as part of their assurance work. See page 54 for the independent assurance.* RIDDOR – Reporting of Injuries, Diseases and Dangerous Occurrences Regulation 1995.

42
Strategic Report (continued)
Corporate Social Responsibility Report (continued)
2.2.1 Big Yellow Store Customer, Contractor and Visitor Health and Safety (continued)The number of customer move-ins increased this year by 0.5%. There were a total of 62 incidents, four of which were sustained by customersand were reportable. One reportable incident (by a contractor) was reported by the contractor directly to the HSE. Minor injuries includedbreaks, cuts and bruises from the handling of customer possessions, equipment and vehicles. The 58 minor injuries occurred whilecustomers (on the whole) handled possessions, bins and pallets. This year our staff training schedules provided customers with fire, healthand safety risk assessments, which raised awareness of the potential for personal injuries. 12 minor injuries were due to visitor deliveries,involving minor cuts and bruises from doors and pallet handling. There were no Fatal Injuries, Notices+ or Prosecutions during the yearended 31 March 2016.
2.2.2 Big Yellow Staff
Store and head office staff health and safetyYear ended 31 March 2012 2013 2014 2015** 2016
Average number of staff 279 286 289 300 318+
Number of Minor Injuries 11 15 13 15 10+
Number of Reportable Injuries (“RIDDOR”)* – 3 1 1 1+
Annual Injury Incidence Rate (“AIIR”) /100,000 staff – 1,049 346 333 314+
+ Indicates data reviewed by Deloitte LLP. See page 54 for their independent assurance report.* AIIR = (Number of staff reportable injuries / Average number of staff (x 100,000).** The Armadillo stores are not included in the scope of Health and Safety Data for 2016. All historic data has been restated to reflect this.
Big Yellow staff numbers increased by 6% and there was a reduction in Minor Injuries from 15 to 10. The Minor Injuries were cuts and bruisesrelating to waste disposal, and the handling of boxes and pallets. There was one Reportable Injury involving a work related fork lift truckincident. Overall, the Annual Injury Incidence Rate decreased by 5.7%, against a store staff increase. Store staff were also involved in assistingcustomers in completing fire, health and safety training risk assessment questionnaires. There were no Fatal Injuries, Notices+ orProsecutions during the year ended 31 March 2016.
2.2.3 Big Yellow Construction Big Yellow’s new store at Enfield was opened at the start of the year and during the year our Cambridge store was fitted out for self storage.14 existing stores also had internal storage partition extension works carried out. Construction fit-out contractors and visitor health and safetyYear ended 31 March 2012 2013 2014 2015 2016
Number of total Man Days 6,511 610 3,315 3,005 6,560Number of Minor Injuries 1 – 2 1 3Number of Reportable Injuries (RIDDOR) – – – – –
The number of Man Days worked was more than double the previous year, mainly due to the Fit Out of our newly acquired Cambridge building.Three minor injuries and eight near misses were recorded, with high safety standards being maintained. The Cambridge site was alsomanaged under the Considerate Constructors Scheme (CCS) which promotes high standards of health and safety management. No FatalInjuries, Notices, Reportable Injuries or Prosecutions occurred, indicating a well-controlled environment for staff, contractors and visitors.Health and Safety performance continues to be reviewed in preparation for our next new store development at Guildford in 2016.
At Cambridge a new storage facility was provided after the extensive refurbishment of a former warehouse, located adjacent to a well-established retail park close to the city centre. Under the CCS Big Yellow Construction was rated ‘Excellent’ for ‘Securing Everyone’sSafety’ and scored ‘Very Good’ ratings in: ‘Valuing the Workforce’, ‘Respect for the Community’, ‘Protecting the Environment’ and ‘Caringabout site Appearance’.
A limited level of assurance is provided for select Health and Safety performance data. This assurance was undertaken by Deloitte LLP inaccordance with the International Standards on Assurance Engagements 3000 Revised (ISAE 3000).

43
3.0 ENVIRONMENTAL RESPONSIBILITYOur CSR Policy sets out how we manage the impact of our business on society and the local environment, to control our risks and manageour opportunities in a sustainable manner.
Big Yellow has been classified as having a “low environmental impact” by the Ethical Investment Research Index Series (“EIRIS”) because itis involved in ‘Support Services’. Notwithstanding this, and in order to maintain an efficient and sustainable business for its stakeholders,Big Yellow has continued to commit significant resources to the environmental and social aspects of its storage operations, real estateportfolio, new store developments and site acquisitions.
We report energy use carbon emissions in compliance with the Companies Act and Climate Change Regulation on Reporting Greenhouse Gas(“GHG”) Emissions for listed companies. For the detailed application of our report see our ‘Basis of Reporting’ at: http://corporate.bigyellow.co.uk/csr.
We therefore provide a summary in the Directors’ Report of Scope 1 (onsite gas, solar electricity generation and refrigerant use) and Scope 2(off site power station grid supplied electricity) for carbon dioxide equivalent (CO2e) emissions. We have used the DEFRA DECC Version 2.1(2015, Expiry 31 May 2016) conversion factors, for annual GHG emission calculations.
3.1 Energy Use, Efficiency and Reductions from 2011 (Peak Energy Benchmark) This year we are reporting our key performance indicators and identifying them using the codes from the Global Reporting Initiative (GRI)and the European Public Real Estate Association (EPRA), at the request of some of our stakeholders. A comparable annual ‘same store’portfolio electricity use and carbon emission KPI will also be used. Our materiality threshold for energy use is 5% and for carbon emissionsis > 1%. A limited level of assurance is provided for our Scope 1 and 2 energy use and GHG emissions. This assurance was undertaken byDeloitte LLP in accordance with the International Standard on Assurance Engagements 3000 (ISAE 3000 Revised).
GRI Absolute Electricity Use & Reductions from Peak Energy (Elec-Abs/G4-ENS3)Year ended 31 March 2012 2013 2014 2015 2016
Electricity use (kWh) 13,588,703 13,153,960 11,688,629 9,643,341 9,376,085+
Electric Reductions (%) (2.4%) (5.5%) (16.1%) (30.7%) (32.7%)
+ Indicates data reviewed by Deloitte LLP. See page 54 for their independent assurance report.
Note: 2011 was our peak electricity use benchmark (13,925,217 kWh).
This year continuing electricity efficiency programmes have provided an absolute reduction of 32.7% from our peak use in 2011. Re-lamping withLED, has contributed an extra 2.8% to the annual reduction in 2016.
GRI Absolute Gas Use & Reductions (‘Fuels-Abs’ F4-EN3)Year ended 31 March 2012 2013 2014 2015 2016
Gas use (kWh) 742,086 716,508 652,181 602,563 592,257Gas Reductions (%) – (3.4%) (12.1%) (18.8%) (20.2%)
+ Indicates data reviewed by Deloitte LLP. See page 54 for their independent assurance report.
Note: 2012 was peak gas use benchmark.
Gas use for the heating of our eight flexi offices reached a peak in December 2012, due to the coldest winter month since records began.The annual reductions in gas use to 2016 have been mainly due to milder but wetter winters. Flexi-office occupancy variations also reduceheating demand occasionally, but occupancy has been relatively constant, ranging from 82.5% to 87.9%. This year, gas use reduced by 20.2%from the peak use in 2012.

44
Strategic Report (continued)
Corporate Social Responsibility Report (continued)
3.1 Energy Use, Efficiency and Reductions from 2011 (Peak Energy Benchmark) (continued)
Total Energy (Electricity and Gas) kWh Use ReductionsYear ended 31 March 2012 2013 2014 2015 2016
Total Energy Use (kWh) 14,330,789 13,870,468 12,340,810 10,245,904 9,968,342Total Reductions (%) (1.7%) (4.9%) (15.4%) (29.7%) (31.6%)*Gas Materiality % 5.2% 5.2% 5.3% 5.8% 5.9%*
* Gas use materiality in 2016 is 0.9% above the 5% threshold and is just significant for reporting purposes, as a percentage of total gas and electricity kWh use.
Note: 2011 was the year of peak energy use (14,581,234 kWh).
Our combined energy use has reduced by 31.6% our from peak energy use in 2011, mainly due to our investment in motion sensor lighting,energy efficient LED re-lamping and 17 roof top solar electricity installations. Over the last year combined gas and electricity use reducedby 2.7%. Our gas use ‘materiality’ is 5.9% of total gas and electricity use and remains just above the materiality level (>5%). This is partlydue to significant long term annual reductions in electricity use, compared to reductions achieved in gas use.
Energy kWh (Electricity and Gas) Intensity
Energy (Electricity and Gas) Intensity / Occupied Space (m2) (Energy-INT/CRE1) % changeYear ended 31 March 2012 2013 2014 2015 2016 from peak
Energy (kWh) 14,330,789 13,870,468 12,340,810 10,245,904 9,968,342 (31.6%)Occupancy (m2) 228,356 244,521 263,101 283,732 304,964 54.1%kWh / Occupancy 62.8 56.7 46.9 36.1 32.7 (55.6%)GIFA (m2) 572,194 582,872 582,872 605,419 621,050 13.9%kWh/GIFA (m2) 25.0 23.8 21.2 16.9 16.1 (39.7%)
+ Indicates data reviewed by Deloitte LLP. See page 54 for their independent assurance report.
Note: 2011 was the Peak Energy Use year (14,581,234 kWh / 197,884 = 73.7 kWh/occupancy m2; GIFA 545,490 m2 and 26.7 kWh/GIFA).
As our annual energy use reduced, and customer occupancy increased, energy intensity per occupied space reduced by 55.6% from ourpeak energy benchmark in 2011. In the year ended 31 March 2016, energy use per occupied space decreased by 9.4%. Energy use per grossinternal floor area has also reduced by 39.7%, as the portfolio has grown and become more energy efficient. Energy (Electricity and Gas) Intensity / Revenue (Energy-INT/CRE1) % changeYear ended 31 March 2012 2013 2014 2015 2016 from peak
Energy (kWh) 14,330,789 13,870,468 12,340,810 10,245,904 9,968,342 (31.6%)Revenue (£000) 65,663 69,671 72,196 84,276 382 63.8%kWh / £ Revenue 0.22 0.20 0.17 0.12 0.10 (58.3%)
+ Indicates data reviewed by Deloitte LLP. See page 54 for their independent assurance report.
Note: 2011 was the Peak Energy Use year (14,581,234 kWh / 61,885,000 = 0.24 kWh / £ Revenue).
Energy use intensity per annual revenue decreased by 58.3% from the peak energy benchmark in 2011 and reduced by 16.7% in the yearended 31 March 2016.
3.2 Mandatory Greenhouse Gas (GHG) Emissions Statement – SummaryThe ISAE 3000 Standard provides an evaluation of both quantitative and qualitative aspects of our carbon management. We report ourabsolute gross energy use for our wholly owned stores, our head office in Bagshot, and our packing materials warehouse in Maidenhead.Our environmental report does not include any of the 16 Armadillo stores, in which the Group has a 20% interest.
Our new store openings at Enfield and Cambridge were completed this year.
This year our key performance indicators are identified using GRI and EPRA codes, at the request of some of our stakeholders. The yearended 31 March 2011 is our peak energy use and carbon emission benchmark year, due to a previous period of increased energy use dueto new store openings and increased occupancy.
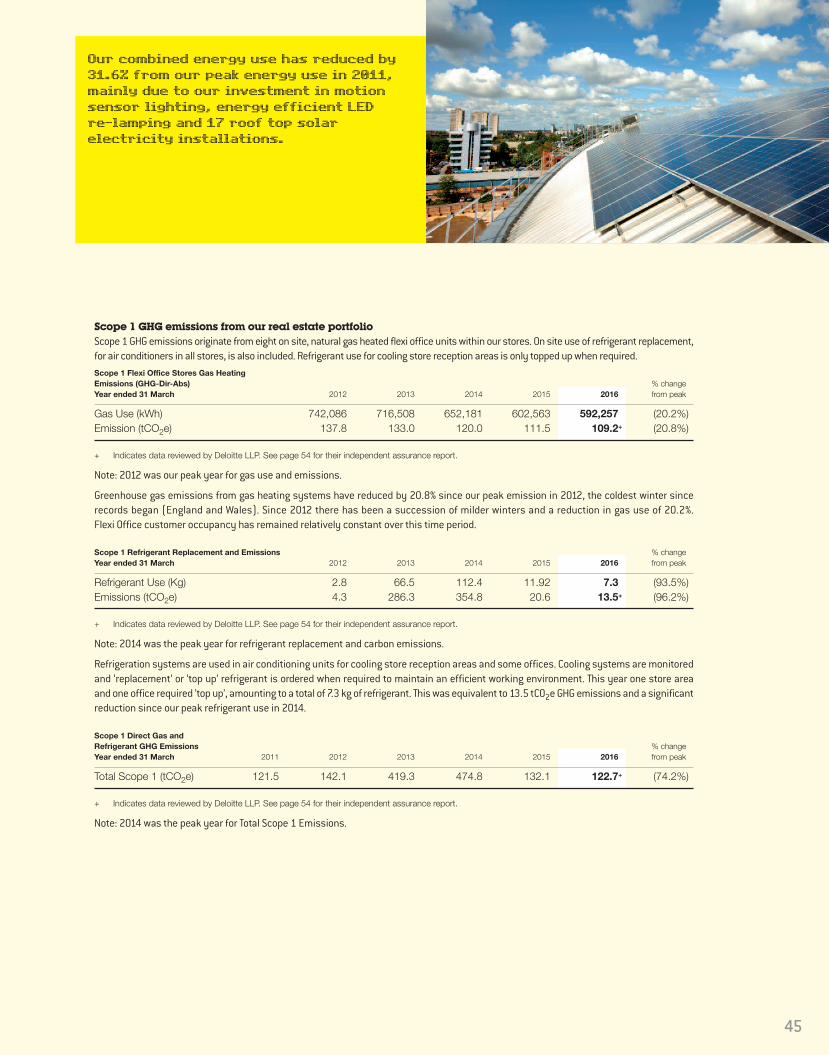
45
Our combined energy use has reduced by31.6% from our peak energy use in 2011,mainly due to our investment in motionsensor lighting, energy efficient LEDre-lamping and 17 roof top solarelectricity installations.
Scope 1 GHG emissions from our real estate portfolio Scope 1 GHG emissions originate from eight on site, natural gas heated flexi office units within our stores. On site use of refrigerant replacement,for air conditioners in all stores, is also included. Refrigerant use for cooling store reception areas is only topped up when required. Scope 1 Flexi Office Stores Gas Heating Emissions (GHG-Dir-Abs) % changeYear ended 31 March 2012 2013 2014 2015 2016 from peak
Gas Use (kWh) 742,086 716,508 652,181 602,563 592,257 (20.2%)Emission (tCO2e) 137.8 133.0 120.0 111.5 109.2+ (20.8%)
+ Indicates data reviewed by Deloitte LLP. See page 54 for their independent assurance report.
Note: 2012 was our peak year for gas use and emissions.
Greenhouse gas emissions from gas heating systems have reduced by 20.8% since our peak emission in 2012, the coldest winter sincerecords began (England and Wales). Since 2012 there has been a succession of milder winters and a reduction in gas use of 20.2%. Flexi Office customer occupancy has remained relatively constant over this time period.
Scope 1 Refrigerant Replacement and Emissions % changeYear ended 31 March 2012 2013 2014 2015 2016 from peak
Refrigerant Use (Kg) 2.8 66.5 112.4 11.92 7.3 (93.5%)Emissions (tCO2e) 4.3 286.3 354.8 20.6 13.5+ (96.2%)
+ Indicates data reviewed by Deloitte LLP. See page 54 for their independent assurance report.
Note: 2014 was the peak year for refrigerant replacement and carbon emissions.
Refrigeration systems are used in air conditioning units for cooling store reception areas and some offices. Cooling systems are monitoredand ‘replacement’ or ‘top up’ refrigerant is ordered when required to maintain an efficient working environment. This year one store areaand one office required ’top up’, amounting to a total of 7.3 kg of refrigerant. This was equivalent to 13.5 tCO2e GHG emissions and a significantreduction since our peak refrigerant use in 2014.
Scope 1 Direct Gas and Refrigerant GHG Emissions % changeYear ended 31 March 2011 2012 2013 2014 2015 2016 from peak
Total Scope 1 (tCO2e) 121.5 142.1 419.3 474.8 132.1 122.7+ (74.2%)
+ Indicates data reviewed by Deloitte LLP. See page 54 for their independent assurance report.
Note: 2014 was the peak year for Total Scope 1 Emissions.

46
Strategic Report (continued)
Corporate Social Responsibility Report (continued)
Scope 1 GHG emissions from our real estate portfolio (continued)Total Scope 1 gas and refrigerant greenhouse gas emissions in 2016 reduced to 122.7 tCO2e, similar to the low 2011 emission levels. This represents a 74.2% reduction from our peak use in 2014, due to less heating gas use and less refrigerant ‘top up’ required in airconditioning units, following significant replacements in 2013 and 2014.
Scope 1 Onsite Direct ‘Self Supply’ Solar: Grid Electricity Displaced, Export, Income and SavingsYear ended 31 March 2011 2012 2013 2014 2015 2016
Solar Generation (kWh) 107,074 134,297 208,807 285,832 314,068 358,279+
Total Grid Savings (£)* 31,439 41,540 74,724 100,468 106,607 115,216Solar % of Grid (kWh) 0.8% 1.0% 1.6% 2.4% 3.3% 3.8%
+ Indicates data reviewed by Deloitte LLP. See page 54 for their independent assurance report.* Total Grid Savings = Solar kWh payments from energy companies + Grid kWh displacement (rate of 9p per kWh).
Our ‘onsite’ roof mounted solar panel generation supplies low carbon electricity to 17 stores and provides an increasing source of energyfor the Group. Solar electricity generation this year was 358,279 kWh; an increase of 14.1% on last year’s generation. Big Yellow has generateda total of 1,408,357 kWhs of solar electricity since 2011. About 30-40% of the solar electricity generated is exported to the National Grid.Total ‘Feed in Tariff’ revenue from energy company payments and ‘off grid’ savings totalled £115,216 this year and has saved £469,994since 2011. In 2016, solar electricity generation contributed 3.8 % of our total store electricity use.
Scope 2 Offsite ‘Grid Supplied’ Electricity Use, GHG Emissions and Tax ReductionsOur electricity supply from ‘off site’ power stations (Scope 2 Energy) provided around 95% of our total annual energy supplied, in the yearended 31 March 2016.Scope 2 Electricity, GHG Emissions and CCL Tax Reductions (GHG-Indir-Abs) % changeYear Ended 31 March 2012 2013 2014 2015 2016 from peak
Electricity (kWh) use 13,588,703 13,153,960 11,688,629 9,643,341 9,376,085+ (32.7%)Emissions (tCO2e) 6,143 6,051 5,207 4,776 4,333.5+ (35.9%)Electricity Cost (£)* 1,345,276 1,456,266 1,236,905 1,131,048 1,072,896 (27.3%)CCL Tax (p/kWh) 0.509 0.524 0.541 0.554 0.559 30%CCL Tax (£) 69,167 68,927 63,236 53,424 52,412 (12.5%)
+ Indicates data reviewed by Deloitte LLP. See page 54 for their independent assurance report.* Grid electricity cost excluding VAT and including CCL Tax 2011, was 0.430 p/kWh or £59,878).
Note: 2011 was the peak electricity use (13,925,217 kWh/6,758 tCO2e) and cost (£1,476,266) benchmark for future reductions.
Electricity use has reduced by 32.7% and Scope 2 GHG emissions have reduced by 35.9% since our peak electricity use in 2011. In the lastyear electricity use has reduced by 2.8% and GHG emissions have reduced by 9.3%. These reductions are partially due to decreases in theelectricity emission factor since last year, our continued investments in energy efficient LED re-lamping and larger capacity roof top solarinstallations at our new stores.
Our annual average carbon emission reduction over the last five years has been 7.2% per year; double what the commercial property sectorrequires to meet the UK Government’s GHG emissions reduction target of a 34% reduction by 2020 (or 3.5% per year to 2050). Our energyefficiency investment programmes have achieved an electricity cost reduction of 27.3% since 2011. Although the CCL Tax on electricity hasincreased from 0.430p/kWh (2011) to 0.559p/kWh (2016), an increase of 30%, we have managed to reduce our CCL Tax by 12.5% since 2011.

47
Absolute and ‘Like for Like’ Electricity and tCO2e ‘Like for Like’ Reductions
GRI and EPRA standards (G4-EN3 / Elec-LFL) ReductionsYear ended 31 March 2015 2016 (%)
‘Abs’ Electric (kWh) 9,643,341 9,376,085+ (2.8%)‘LFL’ Electric (kWh)* 9,504,542 8,821,059 (7.2%)tCO2e** 4,698 4,077 (13.2%)
+ Indicates data reviewed by Deloitte LLP. See page 54 for their independent assurance report.* Not including: Head Office; Distribution Depot; new build stores (Enfield and Cambridge) & acquisition stores (Oxford 2 and Chester).** kWh conversion factor 2015 = 0.49426; kWh conversion factor 2016 = 0.46219.
The ‘Like for Like’ store portfolio over the last two financial years, excluding non-store buildings (Head Office and Distribution Depot), newstores (Enfield and Cambridge) and store acquisitions (Oxford 2 and Chester), has been assessed. The data indicates that the ‘same store’electricity use reduced by 7.2% (absolute reduction of 2.8%).
Climate Change Act 2008; ‘Carbon Reduction Commitment’ (“CRC”) Annual Tax Reporting The Department of Energy and Climate Change (“DECC”) and the Environment Agency (“EA”) are stakeholders in the policy for reducingenergy demand from large private sector organisations.
CRC Carbon & Tax ReductionsYear end 31 March 2011 2012 2013 2014 2015
Total tCO2* 7,608 7,521 7,598 6,415 5,408Reduction in tCO2 (%) – (1.1%) (0.1%) (15.7%) (28.9%)Tax Rates (£/tCO2) 12.00 12.00 12.00 12.00 16.40Tax Payments (£) 91,296 90,252 91,176 76,980 88,691Tax Reductions (%) ** – (1.1%) (0.1%) (15.7%) (2.9%)
* tCO2 Grid supplied electricity, gas and self-supplied solar PV electricity.** Reductions in CRC Tax from 2011 peak energy use.
Note: 2016 CRC emissions and tax will be reported in June 2016.
The CRC Tax on emissions from our use of electricity, gas and self-supplied solar electricity generation rose from £12.00/tCO2 to £16.40 in2015, and will continue to rise to £18.30 in 2019. Under the CRC Tax scheme, our total tCO2 emissions reduced by 28.9%, but our CRC Taxreduction from 2011 to 2015 was 2.9%, due to a 26.8% increase in the 2015 Tax rate. Big Yellow has further plans to invest in external energyefficient lighting; solar ‘roof top’ installations and accurate solar performance monitoring to manage costs and savings efficiently, until themerger of the CRC Tax with the ‘Climate Change Levy’ is confirmed in 2020.
This year we disclose our ’Scope 2’ (Off site) power station electricity use and emissions, as our most ‘material’ energy use by ‘Dual Reporting’.This is to compare the difference in our ‘location based’ (National Grid) and ‘market based’ (British Gas Electricity supply) emissions. The table below shows that carbon dioxide emissions that are ‘Location Based’ are almost double the ‘Market Based’ conversion factor (tCO2).This is because the British Gas ‘Fuel Mix Disclosure’ for electricity generation is based on a lower carbon mix of: 33% natural gas; 31% nuclearenergy; 23% renewables; 11% coal; and 2% of ‘other fuels’. This disclosure raises consumer awareness of the lower carbon content of ‘marketbased’ emissions as well as cost.
‘Duel’ Carbon Reporting – Scope 2 Electricity Conversion Factors 2016
Electricity Supply Basis Electricity Use & Conversion Factors Carbon Emissions
National Grid ‘Location Based’ 9,376,085+ kWh x 0.4585 4,299 tCO2British Gas ‘Market Based’ 9,376,085 kWh x 0.2400 2,250 tCO2
+ Indicates data reviewed by Deloitte LLP. See page 54 for their independent assurance report.
Note: Electricity Market Supplier Conversion Factors (CFs) BG (2015-2016).

48
Strategic Report (continued)
Corporate Social Responsibility Report (continued)
Total Scope 1 and 2 Emissions In the year ended 31 March 2016, total Scope 1 and Scope 2 GHG emissions achieved a reduction of 35.2% from peak energy use in 2011,exceeding last year’s 28.7% reduction. Total GHG Emission Reductions (tCO2e) (GHG-Dir-Abs and GHG-Indir-Abs) % changeYear ended 31 March 2011 2012 2013 2014* 2015 2016 from peak
Scope 1 Totals 121.5 140.6 419.0 474.8 132.0 122.7+ (74.2%)Scope 2 Totals 6,758.0 6,143.0 6,051.0 5,207.0 4,776.0 4,333.5+ (35.9%)Total (tCO2e) 6,879.5 6,283.6 6,470.0 5,681.8 4,908.0 4,456.2+ (35.2%)
+ Indicates data reviewed by Deloitte LLP. See page 54 for their independent assurance report.* Peak emissions for Scope 1.
2011 was the Peak emissions and benchmark year for long term performance assessment for Scope 2
These reductions were mainly due to Scope 2 supplied electricity emissions. Our energy use strategy aims to reduce emissions, annualenergy costs and carbon taxation by proportional percentages. It has also created an income from energy company payments for generationand exporting excess electricity to the Grid from our solar electricity generation investments.
Scope 1 emissions from our stores represent only 2.8% of our combined Scope 1 and 2 emissions. In the year ended 31 March 2016, lessrefrigerant replacement was required for the third year in succession and the type used had a lower GHG emission conversion factor, resultingin a significant reduction in GHG Emissions from our peak refrigerant replacement in 2015. GHG emissions from flexi office gas heating arealso indicating a constant reduction in tCO2e in the year ended 31 March 2016, due to milder but wetter winters since 2012.
GHG Emission Intensity (Scope 1 and 2) Our key emission “intensity” indicators are based on annual growth using customer occupancy and revenue and gross internal floor area (“GIFA”).
Scope 1 and 2 GHG Emission Intensity / Occupied Space And Revenue (GHG-Int) % changeYear ended 31 March 2011 2012 2013 2014 2015 2016 from peak
Total (tCO2e) 6,879.5 6,283.6 6,470.0 5,681.8 4,908.0 4,456.2+ (35.2%)Occupancy (m2) 197,884 228,356 244,521 263,101 283,732 304,964 54.1%kgCO2e /Occy. 34.8 27.5 26.5 21.6 17.3 14.6+ (58.0%)Revenue (£000) 61,885 65,663 69,671 72,196 84,276 101,382 63.8%kgCO2e/£ Rev. 0.11 0.10 0.09 0.08 0.06 0.04+ (63.6%)GIFA (m2) 545,490 572,194 582,872 582,872 605,419 621,050 13.9%kgCO2e /GIFA m2 12.6 11.0 11.1 9.7 8.1 7.2+ (42.9%)
+ Indicates data reviewed by Deloitte LLP. See page 54 for their independent assurance report.
Note: Peak GHG emissions year is 2011.
From our peak GHG emissions in 2011, emissions per customer occupied space have reduced by 58.0% and by 63.6% per revenue. GHGemission intensity per our store portfolio gross internal floor area has reduced by 42.9%. Our future GHG carbon reduction programme is toinvest in external LED re-lamping and solar electricity generation investments where viable. More store specific energy saving opportunityscheme (ESOS) have also been programmed for future years.

49
Extending our landscaping to greenwalls and roofs is environmentallybeneficial. These features allow excessrainwater to be absorbed, helpsmoderate the temperature of the localenvironment, provides habitat for localwildlife and is more aestheticallyappealing – softening the landscape.
3.3 Long Term Energy Electricity Management Scope 2 GHG Emission Targets and ReductionsThe Climate Change Act (2008) has set a national target to reduce GHG emissions by 34% by 2020 and we aim to achieve this target. As part of the UK commercial property sector, Big Yellow has been reducing its energy use by energy efficient and renewable energytechnology since its first electricity peak use in 2008.Scope 1 and 2 GHG Emission Reductions and Targets (%) From 2008 Year ended 31 March 2008 2009 2010 2011 2012 2013
tCO2e 6,487* 6,383 6,287 6,880* 6,284 6,470% reductions – (1.6%) (3.1%) 6.1% (3.1%) (0.3%)
Scope 1 and 2 GHG Emission Reductions and Targets (%) From 2008 Continued Year ended 31 March 2014 2015 2016 2017*** 2018 2019 2020
tCO2e 5,682 4,908 4,456+ – – – –% reductions (12.4%) (24.3%) (31.3 %) (33.7%) (36.0%) (38.3%) (40.4%)
+ Indicates data reviewed by Deloitte LLP. See page 54 for their independent assurance report.* 2011 peak electricity use due to occupancy growth.
Note: 2008 peak use due to new store development and occupancy growth.
We have been achieving a 4.5% annual average reduction of GHG emissions from 2008 to 2016. From 2017, we will adopt the UK commercialproperty sector ‘Real Estate Environmental target’ of a 3.5% annual GHG emission reduction to align with the Government’s 2050 goal.To achieve this target our future programmes of re-lamping stores externally with energy efficient lighting is planned to begin in the yearending 31 March 2017. Additional investment in roof mounted solar installations at our new and existing stores is also proposed for the yearending 31 March 2017. We will also use our ‘Energy Saving Opportunity Scheme’ (ESOS) report to implement other energy efficiencyinvestments where we consider they are appropriate.

50
Strategic Report (continued)
Corporate Social Responsibility Report (continued)
Big Yellow Store Portfolio Asset CertificationsThis year we are reporting some of our key performance indicators and identifying them using the codes from the Global Reporting Initiative(GRI) and the European Public Real Estate Association (EPRA). This is at the request of some of our stakeholders, to assess sustainabledevelopment performance.
Number of Certified Assets (EPRA ‘Cert-Tot’ and GRI ‘CRE8’) Total Number of EPC and BREEAM Certificates and Ratings
Energy Building Research Performance Establishment Environmental Gross Internal Floor AreaNo. Store Certification (EPCs) Assessment Methodology (“BREEAM”) Certification (GIFA) m2
1 Balham B – 8,3612 Barking A – 8,3603 Birmingham C – 8,3614 Bromley B – 9,8675 Camberley A – 8,8496 Cambridge B – 7,2647 Chiswick B – 10,6788 Chester E – 8,1799 Ealing B – 7,88710 Edinburgh D+ – 8,77911 Eltham C – 9,79312 Enfield B BREEAM ‘Excellent’ (75.5%) 8,36713 Fulham B – 19,37014 Gypsy Corner B – 9,70715 High Wycombe B – 8,43116 Kennington B – 9,33917 Liverpool Edge Lane C – 8,36118 Merton B – 9,75519 New Cross B – 8,62320 Nottingham C – 9,05821 Oxford D – 4,26622 Poole C – 7,38623 Reading A BREEAM ‘Excellent’ (76.7%) 8,64024 Richmond B – 4,85525 Sheen B BREEAM ‘Excellent’ (76.1%) 8,91926 Sheffield Bramall Lane B – 8,36127 Sheffield Hillsborough B – 8,36128 Stockport B – 8,28829 Sutton B – 9,75530 Twickenham A+ – 10,591
“Green” stores 30 BREEAM covers 25,926 m2 across three stores 258,924 m2
71 Total 42% Certified 4.2% of Portfolio 621,050 m2
Energy Performance Certification (‘EPC’) LegislationAs owners of property who lease space to members of the public, we were required to display EPCs to our customers from 1st October 2008.Certification is required at new store openings, store acquisitions and when solar panels are retrofitted onto older stores. We have provided30 EPCs to date in our stores, representing 42% of the portfolio. Of the stores certified 73% have high ‘A’ or ‘B’ ratings, mainly due to energyefficient internal LED re-lamping and investment in low carbon electricity, heating and cooling ‘self-supply’, such as solar and ground sourceheat pump installations. Considering that the whole portfolio has internal energy efficient LED lighting, apart from a few recent acquisitions,we are comfortable that the pre-October 2008 stores will at least achieve the EPC ‘B’ rating in the future, when the opportunity arises.
Building Research Establishment Environmental Assessment Methodology (‘BREEAM’)BREEAM certification is sometimes a local planning requirement for our stores, especially for new developments in high density urbanenvironments. The methodology assesses impacts and opportunities for enhancing the design and construction environmental aspects.The certification includes a review of new store energy, sustainable building materials, water efficiency, waste recycling and ecology. The review also includes social aspects of the building life include its resource management, health, well-being, modes of transport andpollution reduction. Our BREEAM ratings are mainly ‘Excellent’ scoring in the 75 – 76% range and highest in the areas of land use and ecology;transport; waste; pollution; and energy efficiency.

51
4.0 SCOPE 3 – VOLUNTARY SUPPLY CHAIN GHG EMISSIONSScope 3 supply chain emissions represent GHG emissions during electricity supplier transmission and distribution to our stores.Scope 3 – Electricity Supply and Distribution GHG Emission Losses % changeYear ended 31 March 2011 2012 2013 2014 2015 2016 from peak
Electric (kWh) 13,925,217 13,588,703 13,153,960 11,688,629 9,643,341 9,376,085+ (32.7%)Scope 2 (tCO2e) 6,758 6,143 6,051 5,207 4,776 4,333+ (35.9%)Scope 3 (tCO2e) 544 525 501 445 417 355 (34.7%)Total (tCO2e) 7,302 6,668 6,552 5,652 5,193 4,688 (35.8%)
+ Indicates data reviewed by Deloitte LLP. See page 54 for their independent assurance report.
Note: Peak energy use and benchmark year was 2011.
Note: Transmission and Distribution Conversion Factor 2016 (0.03816).
Our energy efficiency programmes within our stores have reduced electricity demand and emission from our supplier’s power stations. Totaltransmission and distribution losses have reduced by 35.8% since 2011, compared to a 28.9% reduction last year.Scope 3 – Store Waste Supply Chain Recycling and Landfill GHG Emissions (Waste-Abs)Year ended 31 March 2011 2012 2013 2014 2015 2016
Waste Recycling (t) 266 263 259 265 273 296Landfill waste (t) 37.3 36.8 34.6 37.0 38.2 58.9Landfill GHG tCO2e* 10.8 10.7 10.0 10.7 11.0 17.0
* 2016 Landfill gas conversion factor = 0.2892.
Waste generation in self storage is assessed as a “low environmental impact”. The majority of non-hazardous bulk office waste is segregatedby our staff and then further recycling by our waste contractor for paper and cardboard takes place after collection. This year 296 tonnesof waste was recycled and 58.9 tonnes went to landfill. Landfill GHG emissions are estimated to be 17.0 tCO2e. These emission levelsrepresent a negligible percentage of our combined Scope 1 and 2 emissions and are below the materiality threshold for future carbonemission reporting.New Store Construction ‘Fit-Out’ Waste Management Performance (Waste-Abs)Year ended 31 March 2011 2012 2013 2014 2015 2016
Tonnage 147.5 152.3 12.9 78.9 14.5 13.6Waste Recycled (%) 93.2 96.0 100 95 100 92.8Plasterboard Recycled (%) 100 34.0 – 100 100 100
In October 2015, our new Cambridge store ‘Fit Out’ contractors recycled 92.8% of our waste (13.6 tonnes) as follows: hard-core and brick(41%); wood (31%); plastic (11%); metals (9%); card/paper (3%); polythene (2%); bagged waste (2%); and plasterboard (1%). All of our newstores sign up to the ‘Considerate Constructors Scheme’ and achieve Energy Performance Certification (EPC) ‘B’ rating with LED lighting asstandard and roof top solar installations installed where viable.
Water use has been assessed as a “low environmental impact” for self storage (usage of 28,486 m3). Our data has provided an average of(20.3 tCO2e) emissions per year. This represents less than 0.5% of combined Scope 1 and 2 emissions, which is below the materialitythreshold for carbon emissions. Water use monitoring is continued in order to review water use efficiency.

5.0 STAKEHOLDERSBig Yellow engages with all of its main stakeholders to provide information and to gain useful feedback from a variety of groups, as described below.
Government Legislation and StandardsEU Energy Efficiency Directive; ‘The UK Energy Savings Opportunities Scheme’ (“ESOS”)We appointed an accredited Assessor, measured all of our energy consumption and determined significant areas of use. ESOS was enforcedby the Environment Agency (“EA”) and involved the audit of four representative stores from our portfolio. We assessed future energy savings,other than the technologies that we had already programmed and invested in. We completed the audits in November 2015, before theDecember deadline, and have considered changes to our future budget for investing in viable energy saving technologies as a result.
Investor Communications The Carbon Disclosure Project (“CDP”) 2016The CDP is a global initiative by investors designed to encourage companies (and their suppliers) to publish information on their carbonemissions and climate change strategies, as a measure of their carbon emissions reduction efficiency.
The CDP Performance and Number of InvestorsYear 2010 2011 2012 2013 2014 2015
Disclosure Score 65/100 – 67/100 71/100 85/100 93/100Performance Score B – C D B CNumber of investors 534 – 655 722 799 884Annual increase in investors – – – 10.2% 10.7% 10.6%
Our ‘Disclosure Scores’ have improved from 2010 to 2015, as we achieved 93/100 for ‘reporting transparency’ in 2015. Our latest survey(to be submitted in June 2016) will provide an update with more detail addressing ‘Climate Change Performance’. The ‘C’ Band performancewas the average for ‘Financials’ in 2015. Big Yellow’s ‘number of investors’ has also increased year on year by approximately 10%.
The Global Real Estate Sustainability Benchmark (“GRESB”) ‘Green Star Status’GRESB collects information regarding the sustainability performance of property companies and funds. This includes information onperformance indicators, such as energy efficiency, GHG emission, water and waste reductions. The Survey also covers broader issues suchas sustainability risk assessments, performance improvement, and engagement with employees, customers, suppliers and localcommunities. GRESB continued to rate Big Yellow with a ‘Green Star Status’ in 2015. In Europe (and globally) we were ranked with sustainabilityscores in the top quartile of ‘management and policy’ and ‘implementation and measurement’. The benchmark results allow us to identifythe areas where we can improve, both in absolute terms and relative to our peers. We are able to provide our existing and potential investorswith information regarding our environmental and social governance performance, in the current real estate investment market.
52
Strategic Report (continued)
Corporate Social Responsibility Report (continued)

6.0 CSR PROGRAMME FOR THE YEAR ENDING 31 MARCH 2017Big Yellow will continue to focus on its most significant environmental and financial aspects of its business impact, energy use and carbonemissions. Energy efficiency and low carbon supply programmes have been trialled and have been implemented since 2008. We will reviewand consider further energy reduction strategies within our store operations for carbon and financial savings. For the year ahead ourprogrammes, objectives and targets are highlighted in the table below.
More details of CSR policies, previous reports and awards can be found on our investor relations website at http://corporate.bigyellow.co.uk/csr.aspx
Objectives From 2011 Benchmark
Programme CSR Strategy
External store lighting programmed for LEDre-lamping in the year ending 31 March 2017.
Assess new and acquired stores within theportfolio for efficient LED re-lampinginternally and externally.
GHG Emission Reduction
Implement more specific ESOS advice.Review potential tax reduction as tCO2 taxrate increases.
CRC
Solar installation on new build Guildford storeand two retrofit installations on Colchesterand Eltham stores.
Solar installations to increase with newbuild portfolio growth, acquisitions andexisting retro-fit stores.
Increase Solar Energygeneration, revenue and savings
Maintain membership within the FTSE4 GoodIndex series ratings and engaging withresearchers.
Provided data on the Big Yellow website toupdate research requests on our supplychain, labour standards and the ‘ModernSlavery Act’.
FTSE4 Good Investor Governancepositioning
To increase and maintain our highperformance and interest form a wider rangeof investors.
Use our annual carbon performance data inthe CDP survey 2015 to improve our ratings.
CDP Communications
Strengthen and maintain the leading ‘GreenStar’ position in the GRESB upper quadrant.
Maintain our upper quartile ranking scoresin ‘management and policy’ and‘implementation and measurement’.
GRESB
Invest in continued training and awarenessof staff in routine health and safety policy,procedures, management and reporting.
Continually maintain and improve high standards of recording and reporting customer, staff, visitor, and contractor incidents.
Health and Safety
Regular staff meetings and informationbulletins on CSR progress and ‘ClimateChange’.
Continue raising CSR awareness througharea staff presentations and internalcommunications.
Staff and CSR awareness
53
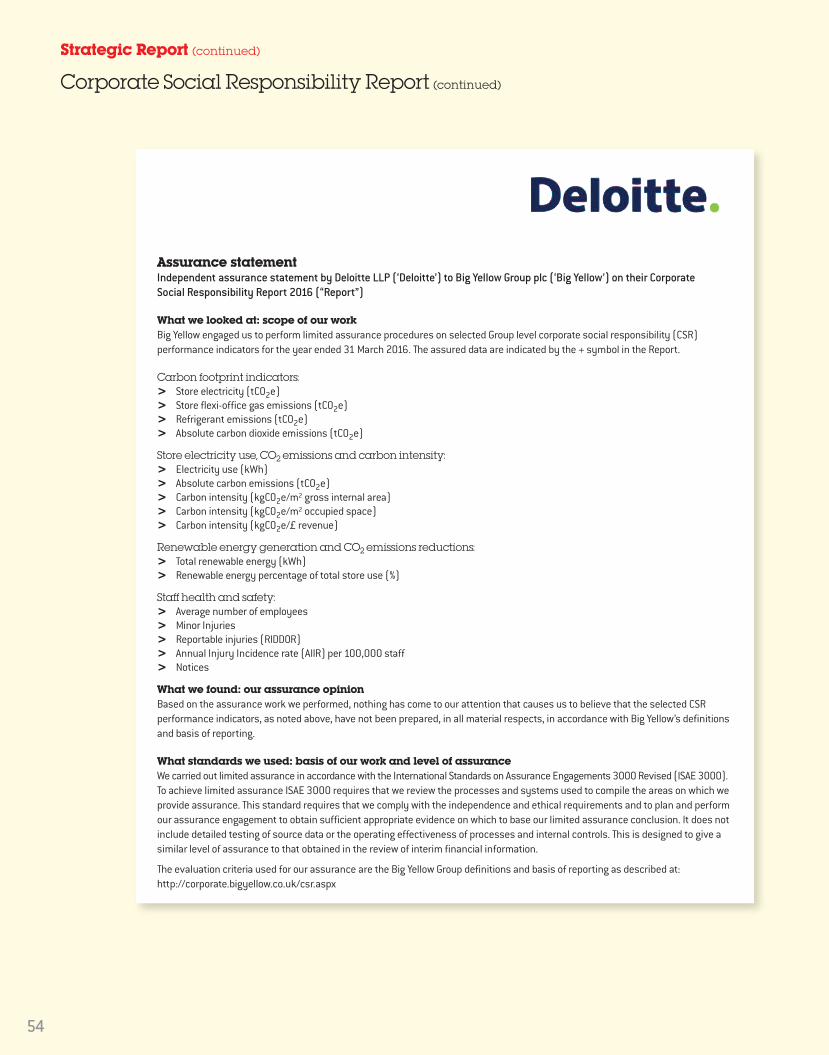
54
Assurance statementIndependent assurance statement by Deloitte LLP (‘Deloitte’) to Big Yellow Group plc (‘Big Yellow’) on their Corporate Social Responsibility Report 2016 (“Report”)
What we looked at: scope of our workBig Yellow engaged us to perform limited assurance procedures on selected Group level corporate social responsibility (CSR)performance indicators for the year ended 31 March 2016. The assured data are indicated by the + symbol in the Report.
Carbon footprint indicators:> Store electricity (tCO2e)> Store flexi-office gas emissions (tCO2e)> Refrigerant emissions (tCO2e)> Absolute carbon dioxide emissions (tCO2e)
Store electricity use, CO2 emissions and carbon intensity:> Electricity use (kWh)> Absolute carbon emissions (tCO2e)> Carbon intensity (kgCO2e/m2 gross internal area)> Carbon intensity (kgCO2e/m2 occupied space)> Carbon intensity (kgCO2e/£ revenue)
Renewable energy generation and CO2 emissions reductions:> Total renewable energy (kWh)> Renewable energy percentage of total store use (%)
Staff health and safety:> Average number of employees> Minor Injuries> Reportable injuries (RIDDOR)> Annual Injury Incidence rate (AIIR) per 100,000 staff> Notices
What we found: our assurance opinionBased on the assurance work we performed, nothing has come to our attention that causes us to believe that the selected CSRperformance indicators, as noted above, have not been prepared, in all material respects, in accordance with Big Yellow’s definitionsand basis of reporting.
What standards we used: basis of our work and level of assuranceWe carried out limited assurance in accordance with the International Standards on Assurance Engagements 3000 Revised (ISAE 3000).To achieve limited assurance ISAE 3000 requires that we review the processes and systems used to compile the areas on which weprovide assurance. This standard requires that we comply with the independence and ethical requirements and to plan and performour assurance engagement to obtain sufficient appropriate evidence on which to base our limited assurance conclusion. It does notinclude detailed testing of source data or the operating effectiveness of processes and internal controls. This is designed to give asimilar level of assurance to that obtained in the review of interim financial information.
The evaluation criteria used for our assurance are the Big Yellow Group definitions and basis of reporting as described at:http://corporate.bigyellow.co.uk/csr.aspx
Strategic Report (continued)
Corporate Social Responsibility Report (continued)

55
What we did: our key assurance proceduresConsidering the risk of material error, our multi-disciplinary team of CSR assurance specialists planned and performed our workto obtain all the information and explanations we considered necessary to provide sufficient evidence to support our assuranceconclusion. Our work was planned to mirror Big Yellow’s own group level compilation processes, tracing how data for each indicatorwithin our assurance scope was collected, collated and validated by corporate head office and included in the Report.
Key procedures we carried out included:
> Gaining an understanding of Big Yellow’s systems through interview with management responsible for CSR management and reporting systems at corporate head office;
> Reviewing the systems and procedures to capture, collate, validate and process data for the assured performance dataincluded in the Report. We did not test back to source data; and
> Reviewing the content of the 2016 CSR Report against the findings of our work and making recommendations for improvementwhere necessary.
Big Yellow’s responsibilitiesThe Directors are responsible for the preparation of the Report and for the information and statements contained within it. They are responsible for determining the CSR goals, performance and for establishing and maintaining appropriate performancemanagement and internal control systems from which the reported information is derived.
Deloitte’s responsibilities, independence and team competenciesOur responsibility is to independently express a conclusion on the performance data for the year ended 31 March 2016. Weperformed the engagement in accordance with Deloitte’s independence policies, which cover all of the requirements of theInternational Federation of Accountants Code of Ethics and in some cases are more restrictive. We confirm to Big Yellow that wehave maintained our independence and objectivity throughout the year, including the fact that there were no events or prohibitedservices provided which could impair that independence and objectivity in the provision of this engagement.
This report is made solely to Big Yellow in accordance with our engagement letter. Our work has been undertaken so that we mightstate to the company those matters we are required to state to them in an assurance report and for no other purpose. To the fullestextent permitted by law, we do not accept or assume responsibility to anyone other than Big Yellow for our work, for this report, orfor the conclusions we have formed.
Deloitte LLP London, United Kingdom 23 May 2016

Company Secretary and Registered officeShauna Beavis2 The DeansBridge RoadBagshotSurreyGU19 5AT
Company Registration No. 03625199
BankersLloyds Bank plcHSBC Bank plcAviva Commercial Finance LimitedM&G Investments Limited
SolicitorsCMS Cameron McKenna LLPLester Aldridge LLP
Financial advisers and stockbrokersJ P Morgan Cazenove
Independent AuditorDeloitte LLPChartered Accountant and Statutory Auditors
ValuersCushman & Wakefield LLPJones Lang LaSalle
Executive DirectorsNicholas Vetch, aged 55, Executive Chairman, is a co-founder of Big Yellow in September 1998. Prior to that, he was joint Chief Executive of Edge Properties plc,which he co-founded in 1989 which was subsequently listed on the Official List of the London Stock Exchange in 1996 and then sold to Grantchester Propertiesplc in 1998. He is also a Non-Executive Director of Local Shopping REIT plc.
James Gibson, aged 55, Chief Executive Officer and co-founder of Big Yellow Group PLC in September 1998. He is a Chartered Accountant by background havingtrained with Arthur Andersen & Co. where he specialised in the property and construction sectors, before leaving in 1989. He was Finance Director of Heron PropertyCorporation Limited and then Edge Properties plc which he joined in 1994. Edge Properties was listed on the Official List of the London Stock Exchange in 1996and then sold to Grantchester Properties plc in 1998. He is also a Non-Executive Director and shareholder of AnyJunk Limited, a Non-Executive Director and investorin Moby Self Storage, a Brazilian Self Storage start-up, and a Trustee of the London Children’s Ballet.
Adrian Lee,aged 50, Operations Director, was previously a Senior Executive at Edge Properties plc, which he joined in 1996. Prior to that he was a corporate financierat Lazard for five years, having previously qualified as a surveyor at Knight Frank. He was appointed to the Board in May 2000.
John Trotman, aged 38, Chief Financial Officer, is a Chartered Accountant having trained with Deloitte LLP, where he specialised in the real estate sector and selfstorage. On leaving Deloitte in 2005, John worked for a subsidiary of the Kajima Corporation. He joined Big Yellow in June 2007, and was appointed to the Board inSeptember 2007. He is a Director of the UK Self Storage Association.
Non-Executive DirectorsTim Clark, aged 65, Non-Executive Director. He was a partner in Slaughter and May, one of the leading international law firms in the world, for 25 years; initiallyworking as a corporate and M&A adviser to a range of companies and institutions and then for the last seven years as senior partner (before retiring in April 2008).He is the Chair of Water Aid UK, and a Senior Adviser to G3, and to Chatham House. He is also a member of the International Chamber of Commerce UK GoverningBody, the Advisory Board of Uria Menendez, the Board of the Royal National Theatre and the Development Committee of the National Gallery. He is Chairman of thetrustees of the Economist Trust and a member of the Audit Committee of the Wellcome Trust. He was appointed to the Board in August 2008, is the Senior IndependentDirector and is Chairman of the Remuneration and Nomination Committees.
Richard Cotton, aged 60, Non-Executive Director, headed the real estate corporate finance team at JP Morgan Cazenove until April 2009, and subsequent to thatwas a Managing Director of Forum Partners. Richard is currently the Chairman of Centurion Properties and a Non-Executive Director of Helical Bar plc as well as aMember of the Commercial Development Advisory Group of Transport for London. Richard joined the Board in July 2012.
Georgina Harvey, aged 51, Non-Executive Director, started her media career at Express Newspapers plc where she was appointed Advertising Director in 1994.She joined IPC Media Ltd in 1995 and went on to form IPC Advertising in 1998, where she was Managing Director. She was a member of the Board of IPC Media from2000 and was Managing Director of the Regionals division of Trinity Mirror from 2005 to 2012, overseeing its transition to a digital platform. She is currently a Non-Executive Director of William Hill plc and of McColl's Retail Group plc. She joined the Board in July 2013.
Steve Johnson, aged 52, Non-Executive Director, started his career at Bain in the 1980s before joining Asda in 1993, where he carried out a number of roles,culminating in Marketing Director. He left Asda in 2000, to join GUS as a Sales & Marketing Director, departing in 2002 to take up his first CEO role at Focus DIY,where he remained until 2007. He joined Woolworths as part of the final turnaround team in late 2008. He has most recently been working as an operating executivefor TPG, and was also the Executive Chairman of Dreams plc between July 2011 and October 2012. He is currently Executive Chairman of Poundworld. He joinedthe Board in September 2010.
Mark Richardson, aged 59, Non-Executive Director, retired from Deloitte in 2008 after a career there of 29 years, the last 19 as an audit partner specialising inclients in the Real Estate and Construction sectors. Mark is a trustee of the Natural History Museum Development Trust, a trustee of WWF-UK, and he is also atrustee and treasurer of the children’s communication charity ICAN. He was appointed to the Board in July 2008 and is chairman of the Audit Committee.
Directors, Officers and Advisers
56
Governance

57
Directors’ Report
The Directors present their Annual Report on the affairs of the Group, together with the audited financial statements and auditor’s report for the year ended31 March 2016. The Report on Corporate Governance on pages 60 to 63 forms part of this report.
Details of significant events since the balance sheet date are included in note 25 to the financial statements. An indication of likely future developments inthe business of the Company is included in the strategic report.
Information about the use of financial instruments by the Company and its subsidiaries is given in note 18 to the financial statements.
DividendsThe Directors are recommending the payment of a final dividend of 12.8 pence per share for the year (2015: 11.3 pence per ordinary share). An interimdividend of 12.1 pence per share was paid in the year (2015: 10.4 pence per share).
A property income dividend of 18.1 pence is payable for the year, of which 12.1 pence per share was paid with the interim dividend, and 6.0 pence per sharewas proposed for the final dividend.
Subject to approval by shareholders at the Annual General Meeting to be held on 22 July 2016, the final dividend will be paid on 28 July 2016. The Ex-div dateis 16 June 2016 and the Record date is 17 June 2016.
From April 2016 dividend tax credits will be replaced by an annual £5,000 tax-free allowance on dividend income across an individual’s entire share portfolio.Above this amount, individuals will pay tax on their dividend income at a rate dependent on their income tax bracket and personal circumstances. The Companywill continue to provide registered shareholders with a confirmation of the dividends paid by Big Yellow Group PLC and this should be included with any otherdividend income received when calculating and reporting total dividend income received. It is the shareholder’s responsibility to include all dividend incomewhen calculating any tax liability. This change was announced by the Chancellor, as part of the UK government Budget, in July 2015.
Disclosure of Greenhouse Gas (“GHG”) EmissionsCompanies Act 2006; Climate Change, the GHG Emissions Director’s Reports Regulations 2013From October 2013, all listed companies are required to report annual quantities of GHG emissions (measured as Carbon Dioxide Equivalent (CO2e)) as follows:
> Scope 1 – significant direct emission sources, such as our flexi-office gas heating and air conditioner coolant replacement - currently fit out ‘gas oil’ useemissions and one Company van diesel fuel use emissions are assessed as ‘not material’;.
> Scope 2 – significant indirect or offsite power station electricity supply emissions to our stores; and> Scope 3 – Electricity supplier ‘transmission and distribution’ emissions – currently, voluntary GHG emissions, from our waste and water supply chains
are not assessed as material.
Summary of Scope 1 and 2 Total Carbon Footprint (GHG carbon equivalent emissions (tCO2e))Including store electricity, gas, coolant, generator gas oil and van dieselYear 2011 2012 2013 2014 2015 2016
Total Scope 1 and 2 GHG Emissions (tCO2e) 6,879.5 6,283.6 6,470.0 5,681.8 4,908.0 4,456.2Scope 3 Electricity Transmission Losses 544 525 501 445 417 355Kg CO2e / Annual Revenue (£) 0.11 0.10 0.09 0.08 0.06 0.04Kg CO2e / Customer Occupancy (m2) 32.0 26.0 26.5 22.6 17.3 14.6Kg CO2e/GIFA m2 12.6 11.0 11.1 9.8 7.7 7.2
Note: Our materiality threshold for carbon emissions is > 1%
Further information on GHG emissions and on other sustainability initiatives at Big Yellow is provided in our Corporate Social Responsibility Report.
Capital structureDetails of the authorised and issued share capital, together with details of the movements in the Company's issued share capital during the year are shownin note 22. The Company has one class of ordinary shares which carry no right to fixed income. Each share carries the right to one vote at general meetingsof the Company.
There are no specific restrictions on the size of a holding nor on the transfer of shares, which are both governed by the general provisions of the Articles ofAssociation and prevailing legislation. The Directors are not aware of any agreements between holders of the Company's shares that may result in restrictionson the transfer of securities or on voting rights.
Details of employee share schemes are set out in note 23, and details of shares held by the Company’s Employee Benefit Trust are set out in note 22.
No person has any special rights of control over the Company's share capital and all issued shares are fully paid.
With regard to the appointment and replacement of Directors, the Company is governed by its Articles of Association, the Corporate Governance Code, theCompanies Acts and related legislation. The Articles themselves may be amended by special resolution of the shareholders. The powers of Directors aredescribed in the Report on Corporate Governance on page 60.
There are a number of agreements that take effect, alter or terminate upon a change of control of the Company such as commercial contracts, bank loanagreements, property lease arrangements and employees' share plans. Furthermore, the Directors are not aware of any agreements between the Companyand its Directors or employees that provide for compensation for loss of office or employment that occurs because of a takeover bid.
During the year the Company issued 732,302 shares to satisfy the exercise of share options (2015: 641,877).

Directors The Directors of the Company who served throughout the year and to the date of approval of the financial statements were as follows:
Tim Clark Senior Independent Director
Richard Cotton Non-Executive DirectorJames Gibson Chief Executive OfficerGeorgina Harvey Non-Executive DirectorSteve Johnson Non-Executive DirectorAdrian Lee Operations DirectorMark Richardson Non-Executive DirectorJohn Trotman Chief Financial OfficerNicholas Vetch Executive Chairman
Biographical details of the Executive and Non-Executive Directors standing for re-election are set out on page 56.
Directors’ indemnitiesThe Company purchases liability insurance covering the Directors and officers of the Company and its subsidiaries.
Political contributionsNo political donations were made by the Company in either the current or preceding financial year.
Substantial shareholdingsThe Company had been notified, in accordance with Chapter 5 of the Disclosure and Transparency rules, of the following voting rights as a shareholder of theCompany at 31 March 2016 and 23 May 2016.
Percentage of Percentage ofvoting rights voting rights
No. of and issued No. of and issuedordinary shares share capital ordinary shares share capital 31 March 2016 31 March 2016 23 May 2016 23 May 2016
Cohen & Steers Inc 15,363,236 9.8% 14,812,547 9.4%Old Mutual Plc 9,922,701 6.3% 9,873,313 6.3%Blackrock Inc 9,220,257 5.9% 9,055,671 5.8%Wellington Management Company 4,667,674 3.0% 7,317,607 4.7%Standard Life Investments 5,983,778 3.8% 5,983,778 3.8%PGGM Investments 5,380,776 3.4% 5,380,776 3.4%State Street Global Advisors Limited 4,990,101 3.2% 4,774,575 3.0%
The interest of the Directors in the share capital of the Company is shown on page 77 of the Remuneration Report.
Purchase of own sharesThe Company was granted authority at the AGM in 2015 to purchase its own shares up to a total aggregate value of 10% of the issued nominal capital. That authority expires at this year’s AGM and a resolution will be proposed for its renewal. During the year the Company made no purchases of its own shares.
Employee consultationThe Group seeks to ensure employee commitment to its objectives in a number of ways. Strategic changes are communicated directly to all staff who areencouraged to address queries to the Executive Directors. The Directors’ executive meetings are frequently held in stores and in addition Directors and seniormanagement visit the stores on a regular basis. Furthermore, there are regular team briefings at store level to provide employees with information about theperformance of and initiatives in their store. A wide range of information is also communicated across the Group’s Intranet, including the e-publication of theGroup’s financial results and all press releases, the publication of a quarterly newsletter, and the publication of a weekly operations bulletin.
Employees are encouraged to participate in the Group’s performance through Employee Share Schemes and performance related bonuses. 39% of eligibleemployees participate in the Group’s Sharesave Scheme.
The Group’s recruitment policy is committed to promote equality, judging neither by race, nationality, religion, age, gender, disability, sexual orientation, norpolitical opinion and to treat all stakeholders fairly.
Disabled employeesApplications for employment by disabled persons are always fully considered, bearing in mind the aptitudes of the applicant concerned. In the event ofmembers of staff becoming disabled every effort is made to ensure that their employment with the Group continues and that appropriate training is arranged.It is the policy of the Group that the training, career development and promotion of disabled persons should, as far as possible, be identical to that of other employees.
Directors’ Report (continued)
58
Human Rights Big Yellow respects Human Rights and aims to provide assurance to internal and external stakeholders that we are committed to human rights and theprinciples of the Universal Declaration of Human Rights.
We are committed to creating and maintaining a positive and professional work environment that reflects and respects the basic rights of freedom to lead adignified life, free from fear or want, and where stakeholders are free to express their independent beliefs. Our employment policies and practices reflect aculture where decisions are made solely on the basis of individual capability and potential in relation to the needs of the business.
Modern Slavery ActThe Group is committed to ensuring that there is no modern slavery or human trafficking in our supply chains or in any part of our business. Our Anti-slaveryPolicy reflects our commitment to acting ethically and with integrity in all our business relationships and to implementing and enforcing effective systemsand controls to ensure slavery and human trafficking is not taking place anywhere in our supply chains. Our policy is published in full on our website.
AuditorIn respect of each Director of the Company, at the date when this report was approved, to the best of their knowledge and belief:
> so far as each Director is aware, there is no relevant audit information of which the Company’s auditor is unaware; and > each Director has taken all the steps that he might have reasonably been expected to take as a Director in order to make himself aware of any relevant
audit information and to establish that the Company’s auditor is aware of that information.
This confirmation is given and should be interpreted in accordance with s418 of the Companies Act 2006.
The auditor, Deloitte LLP has expressed their willingness to continue in office as auditor and a resolution to reappoint them will be proposed at the forthcomingAnnual General Meeting.
Approved by the Board of Directors and signed on behalf of the Board
Shauna BeavisCompany Secretary23 May 2016
59

INTRODUCTIONThe Company is committed to the principles of corporate governance contained in the UK Corporate Governance Code that was issued in 2014 by the FinancialReporting Council (“the Code”) for which the Board is accountable to shareholders. The Board also takes account of the corporate governance guidelines ofinstitutional shareholders and their representative bodies.
At Big Yellow, we aim to create a culture in which integrity, openness and fairness are rewarded.
We continue to review the composition of the Board to ensure that it has the appropriate skills, knowledge and balance for the effective stewardship of theCompany. There have been no changes to the composition of the Board in the year.
The Board has overall responsibility for the manner in which the Company runs its affairs.
Statement of compliance with the CodeThroughout the year ended 31 March 2016, the Company has been in compliance with the Code provisions set out in section 1 of the 2014 UK CorporateGovernance Code.
Statement about applying the principles of the CodeThe Company has applied the principles set out in the Code, including both the main principles and the supporting principles, by complying with the Code asreported above. Further explanation of how the principles and supporting principles have been applied is set out below and in the Nominations CommitteeReport, the Remuneration Report and the Audit Committee Report.
LEADERSHIPThe Board’s role is to provide entrepreneurial leadership of the Company within a framework of prudent and effective controls which enables risk to be assessedand managed.
Chairman and Chief ExecutiveThe division of responsibilities between the Chairman and the Chief Executive has been agreed by the Board and encompasses the following parameters:
> the Chairman’s role is to provide continuity, experience, governance and strategic advice, while the Chief Executive provides leadership, drives theday-to-day operations of the business and works with the Chairman on overall strategy;
> the Chairman, working with the Senior Independent Non-Executive Director, is viewed by investors as the ultimate steward of the business and the guardianof the interests of all the shareholders;
> the Board believes that the Chairman and the Chief Executive work together to provide effective and complementary stewardship;> the Chairman:
> takes overall responsibility for the composition and capability of the Board; and> consults regularly with the Chief Executive and is available on a flexible basis for providing advice, counsel and support to the Chief Executive.
> the Chief Executive:> manages the Executive Directors and the Group’s day-to-day activities;> prepares and presents to the Board strategic options for growth in shareholder value;> sets the operating plans and budgets required to deliver agreed strategy; and> ensures that the Group has in place appropriate risk management and control mechanisms.
The Directors believe it is essential for the Group to be led and controlled by an effective Board that provides entrepreneurial leadership within a framework ofsound controls which enables risk to be assessed and managed. The Board is responsible for setting the Group’s strategic aims, its values and standards andensuring the necessary financial and human resources are in place to achieve its goals. The Board ensures that its obligations to shareholders and otherstakeholders are understood and met. The Board also regularly reviews the performance of management.
EFFECTIVENESSComposition of the BoardThe Nominations Committee is responsible for reviewing the Board Composition, and makes recommendations to the Board on the appointment of Directors.There are five independent Non-Executive Directors on the Board, with Tim Clark being the Senior Independent Director. The Company complies with theCombined Code in that at least half of The Board is comprised of independent Non-Executive Directors.
All of the Non-Executive Directors bring considerable knowledge, judgement and experience to Board deliberations. Non-Executive Directors do not participate in anyof the Company’s share option or bonus schemes and their service is non-pensionable. The Non-Executive Directors are encouraged to communicate directly withExecutive Directors between formal Board meetings. The Non-Executive Directors meet at least once a year without the Executive Directors being present.
The Non-Executive Directors scrutinise the performance of management in meeting agreed goals and objectives and monitor the reporting of performance.They are required to satisfy themselves on the integrity of the financial information and that financial controls and systems of risk management are robustand defensible. They are responsible for determining appropriate levels of remuneration for Executive Directors and have a prime role in appointing and, wherenecessary, removing Executive Directors, and in succession planning.
Corporate Governance Report
60

EFFECTIVENESS (continued)Composition of the Board (continued)The tenure of the independent Non-Executive Directors at 31 March 2016 is set out below:
THE BOARD AND ITS COMMITTEESStanding committees of the BoardThe Board has Audit, Remuneration and Nominations Committees, each of which has written terms of reference. They deal clearly with the authorities and dutiesof each Committee and are formally reviewed annually. Copies of these terms of reference are available on the Company’s website. Each of these Committeesis comprised of Independent Non-Executive Directors of the Company who are appointed by the Board on the recommendation of the Nominations Committee.
All of the Committees are authorised to obtain legal or other professional advice as necessary; to secure, where appropriate, the attendance of external advisersat its meetings and to seek information required from any employee of the Company in order to perform its duties.
The Chairman of each Committee reports the outcome of the meetings to the Board. The Company Secretary is secretary to each Committee.
Attendance at meetings of the individual Directors at the Board Meetings that they were eligible to attend is shown in the table below:Director Position Number of meetings attended
Tim Clark Non-Executive Director ������Richard Cotton Non-Executive Director ������James Gibson Chief Executive Officer ������Georgina Harvey Non-Executive Director ������Steve Johnson Non-Executive Director ������Adrian Lee Operations Director ������Mark Richardson Non-Executive Director ������John Trotman Chief Financial Officer ������Nicholas Vetch Executive Chairman ������
attendedabsent
Adrian Lee missed one meeting due to an unavoidable diary conflict.
The Board meets approximately once every two months to discuss a whole range of significant matters including strategic decisions, major asset acquisitionsand performance. A procedure to enable Directors to take independent professional advice if required has been agreed by the Board and formally confirmedby all Directors.
There is a formal schedule of matters reserved for the Board’s attention including the approval of Group strategy and policies; major acquisitions and disposals,major capital projects and financing, Group budgets and material contracts entered into other than in the normal course of business. The Board also considersmatters of non-financial risk as part of its review of the Group’s risk register.
At each Board meeting, the latest available financial information is produced which consists of detailed management accounts with the relevant comparisonsto budget. A current trading appraisal is given by the Executive Directors.
61
years
2.8
3.8
5.6
7.7
7.8
0 1 2 3 4 5 6 7 8
Georgina Harvey
Richard Cotton
Steve Johnson
Tim Clark
Mark Richardson

Information and professional developmentAll Directors are provided with detailed financial information throughout the year. On a weekly basis they receive a detailed occupancy report showing theperformance of each of the Group’s open stores. Management accounts are circulated to the Executive monthly and a detailed Board pack is distributed aweek prior to each Board meeting.
All Directors are kept informed of changes in relevant legislation and changing commercial risks with the assistance of the Company’s legal advisers andauditor where appropriate. The professional development requirements of Executive Directors are identified and progressed as part of each individual’s annualappraisal. All new Directors are provided with a full induction programme on joining the Board.
Non-Executive Directors are encouraged to attend seminars and undertake external training at the Company’s expense in areas they consider to be appropriatefor their own professional development. Each year, the programme of senior management meetings is tailored to enable meetings to be held at the Company’sproperties. During the year, the Executive Directors made visits to all of the Group’s stores.
ACCOUNTABILITYRisk management and internal controlThe Group operates a rigorous system of risk management and internal control, which is designed to ensure that the possibility of misstatement or loss iskept to a minimum. There is a comprehensive system in place for financial reporting and the Board receives a number of reports to enable it to carry out thesefunctions in the most efficient manner. These procedures include the preparation of management accounts, forecast variance analysis and other ad hocreports. There are clearly defined authority limits throughout the Group, including those matters which are reserved specifically for the Board.
The Board has applied principle C.2 of the UK Corporate Governance Code by establishing a continuous process for identifying, evaluating and managing thesignificant risks the Group faces and for determining the nature and extent of the significant risks it is willing to take in achieving its strategic objectives. TheBoard regularly reviews the process, which has been in place from the start of the year to the date of approval of this report and which is in accordance withrevised guidance on internal control published in October 2005 (the Turnbull Guidance). The Board is also responsible for the Group's system of internal controland for reviewing its effectiveness. Such a system is designed to manage rather than eliminate the risk of failure to achieve business objectives, and can onlyprovide reasonable and not absolute assurance against material misstatement or loss.
In compliance with provision C.2.1 of the Code, the Board regularly reviews the effectiveness of the Group's risk management and internal control systems.The Board's monitoring covers all controls, including financial, operational and compliance controls and risk management. It is based principally on reviewingreports from management to consider whether significant risks are identified, evaluated, managed and controlled and whether any significant weaknessesare promptly remedied and indicate a need for more extensive monitoring. The Board has also performed a specific assessment for the purpose of this AnnualReport. This assessment considers all significant aspects of risk management and internal control arising during the period covered by the report, includingthe work carried out by the Group’s Store Compliance team. The Audit Committee assists the Board in discharging its review responsibilities.
A formal risk identification and assessment exercise has been carried out resulting in a risk framework document summarising the key risks, potential impactand the mitigating factors or controls in place. The Board have a stated policy of reviewing this risk framework at least once a year or in the event of a materialchange. The risk identification process also considered significant non-financial risks.
During the reviews, the Directors:
> challenged the framework to ensure that the list of significant risks to business objectives is still valid and complete;> considered new and emerging risks to business objectives and included them in the framework if significant;> ensured that any changes in the impact or likelihood of the risks are reflected in the risk framework; and> ensured that there are appropriate action plans in place to address unacceptable risks.
The results of the exercise have been communicated to the Board and the Audit Committee. This was in the form of a summary report which included:
> a prioritised summary of the key risks and their significance;> any changes in the list of significant risks or their impact and likelihood since the last assessment;> new or emerging risks that may become significant objectives in the future;> progress on action plans to address significant risks; and> any actual or potential control failures or weaknesses during the period (including “near misses”).
During the course of its review of the risk management and internal control systems, the Board has not identified, nor been advised of any failings orweaknesses which it has determined to be significant, consistent with the prior year. Therefore, a confirmation in respect of necessary actions has not beenconsidered appropriate.
Corporate Governance Report (continued)
62

GOING CONCERNThe Group’s activities, and a fair review of the business, are included in the Strategic Report on pages 14 to 28. The financial position of the Group, includingits cash flow, liquidity, and committed debt facilities are discussed in the Financial Review on pages 29 to 37.
The Directors have a reasonable expectation that the Group and Company have adequate resources to continue operations for the foreseeable future. Theyhave therefore continued to adopt the going concern basis in preparing the financial statements.
SHAREHOLDER RELATIONSThe Board aims to achieve clear reporting of financial performance to all shareholders and acknowledges the importance of an open dialogue by both Executiveand Non-Executive Directors with its institutional shareholders. The Board believes that the Annual Report and Accounts play an important part in presentingall shareholders with an assessment of the Group’s position and prospects.
The Company has an active dialogue with its shareholders through a programme of investor meetings which include formal presentation of the full and halfyear results. The Executive Directors have participated in investor conferences and meetings during the year, throughout the United Kingdom, and also in theUnited States and the Netherlands. During the year ended 31 March 2016, the Chief Executive and other Executive Directors carried out 168 meetings with UKand overseas institutional shareholders and potential investors. These meetings comprised group and individual presentations and tours of our stores.
The Board also welcomes the interest of private investors and believes that, in addition to the Annual Report and the Company’s website, the Annual GeneralMeeting is an ideal forum at which to communicate with investors and the Board encourages their participation. At each Board Meeting, the Board is updatedon any shareholding meetings that have taken place, and any views expressed or issues raised by the shareholders in these meetings.
Any queries raised by a shareholder, either verbally or in writing, are answered immediately by whoever is best placed on the Board to do so. Directors areintroduced to shareholders at the AGM, including the identification of Non-Executive Directors and Committee Chairmen. The number of proxy votes cast inthe resolution is announced at the AGM.
63

Report of the Nominations Committee
64
IntroductionThe Committee is responsible for reviewing the Composition of the Board. It also makes recommendations for membership of the Board and consideringsuccession planning for Directors. The Committee is also responsible for evaluating Board and Committee performance.
Committee members and attendanceMember Position Number of meetings attended
Tim Clark Chairman and Senior Independent Director Richard Cotton Member Georgina Harvey Member Steve Johnson Member Mark Richardson Member
attendedabsent
The Nominations Committee is responsible for reviewing the structure, size and composition of the Board and giving consideration to succession planning forDirectors and other senior Executives. Where changes are required, it is also responsible for the identification, selection and proposal to the Board for approvalof persons suitable for appointment or reappointment to the Board, whether as Executive or Non-Executive Directors and to seek approval from the RemunerationCommittee to the remuneration and terms and conditions of service of any proposed Executive Director appointment. The Chairman of the Committee presentsreports to the Board as appropriate to enable the Board as a whole to agree the appointments of new Directors. The Committee meets at least once a year andotherwise as required and as determined by its members.
The terms and conditions of appointment for the Non-Executive Directors is available for inspection at the Company’s Head Office during normal working hours.They are also available for inspection at the Company’s AGM.
Board performance evaluationIn 2014, the Board engaged Lomond Consulting to undertake an evaluation of the performance of the Board and its Committees. The aim was to seek to identifyareas where the performance and the procedures of the Board may be improved. The scope of the review was agreed between the Chairman of the Committeeand the Chief Executive.
Each Director completed a questionnaire on the performance of the Board, its Committees and the Chairman. The responses were anonymous to enable anopen and honest sharing of views. Lomond Consulting then produced a report showing the results of the review. The Board has committed to carry out anexternal performance evaluation every three years. In the intervening years the Board undertakes an evaluation of its own performance and that of itsCommittee and its individual members, with reference to the most recent external evaluation of its performance. The Board intends to carry out an externalevaluation of its performance during the year ending 31 March 2017.
During the current year, the Executive Chairman evaluated the performance of the other Executive Directors, and the performance of the Chairman wasevaluated by the Senior Independent Non-Executive Director. It was considered that the individuals, the Committees and the Board as a whole were operatingeffectively, with appropriate procedures put in place for minor areas identified for improvement.
Succession planningThe Board comprises a team of four Executive Directors, two of whom were co-founders of the Company, complemented by Non-Executive Directors who havewide business experience and skills as well as a detailed understanding of the Group’s philosophy and strategy. Continuity of experience and knowledge,particularly of self storage, within the executive team is particularly important in a focussed long-term business such as Big Yellow.
It is a key responsibility of the Committee to advise the Board on succession planning. The Committee ensures that any future changes in the Board’scomposition are foreseen and effectively managed. In the event of unforeseen changes, the Committee ensures that management and oversight of the Group’sbusiness and long-term strategy will not be affected.
The Committee also addresses the development and continuity of the Senior Management team below Board level.
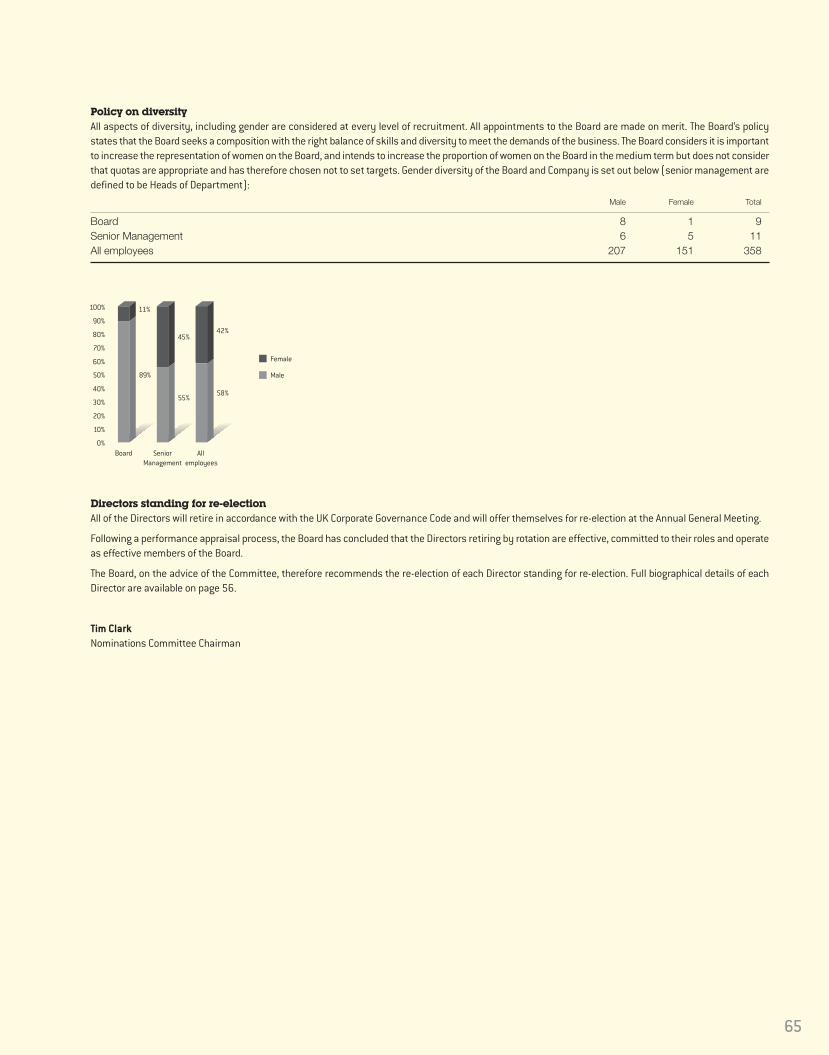
Policy on diversityAll aspects of diversity, including gender are considered at every level of recruitment. All appointments to the Board are made on merit. The Board’s policystates that the Board seeks a composition with the right balance of skills and diversity to meet the demands of the business. The Board considers it is importantto increase the representation of women on the Board, and intends to increase the proportion of women on the Board in the medium term but does not considerthat quotas are appropriate and has therefore chosen not to set targets. Gender diversity of the Board and Company is set out below (senior management aredefined to be Heads of Department):
Male Female Total
Board 8 1 9Senior Management 6 5 11All employees 207 151 358
Directors standing for re-electionAll of the Directors will retire in accordance with the UK Corporate Governance Code and will offer themselves for re-election at the Annual General Meeting.
Following a performance appraisal process, the Board has concluded that the Directors retiring by rotation are effective, committed to their roles and operateas effective members of the Board.
The Board, on the advice of the Committee, therefore recommends the re-election of each Director standing for re-election. Full biographical details of eachDirector are available on page 56.
Tim ClarkNominations Committee Chairman
65
Board SeniorManagement
All employees
0%
20%
30%
40%
50%
60%
70%
80%
90%
100%
10%
11%
89%
55%
45%
58%
42%
Female
Male

INTRODUCTIONThis report is on the activities of the Remuneration Committee for the period from 1 April 2015 to 31 March 2016. It sets out a summary of the Directors’Remuneration Policy (“the Policy”) which was approved by shareholders in July 2015 and remuneration details for the Executive and Non-Executive Directorsof the Company. It has been prepared in accordance with Schedule 8 of the Large and Medium-size Companies and Groups (Accounts and Report) Regulations2013 (the “Regulations”).
The report is divided into three main areas:
> the annual statement by the Remuneration Committee Chairman;> the summary of the approved Policy; and> the annual report on Directors’ remuneration.
The Companies Act 2006 requires the auditor to report to the shareholders on certain parts of the Remuneration Report and to state whether, in their opinion,those parts of the report have been properly prepared in accordance with the Regulations. The parts of the annual report on Directors’ remuneration that aresubject to audit are indicated in the report. The annual statement by the Remuneration Committee Chairman and the summary of the approved RemunerationPolicy are not subject to audit.
Remuneration ReportYear ended 31 March 2016
66
ANNUAL STATEMENT BY THE REMUNERATION COMMITTEE CHAIRMANDear Shareholder,
I am very pleased to present the Directors’ Remuneration Report for the year ended 31 March 2016. This report has been prepared by the RemunerationCommittee and approved by the Board.
Business conditions and Group performance in the year ended 31 March 2016The business conditions and performance of the Group in the year ended 31 March 2016 are described more fully in the Chairman's Statement andthe Operating and Financial Review of this Annual Report. In summary:
> the business of the Group performed strongly;> in an improving economic environment, Big Yellow remained the clear UK brand leader in self storage and delivered occupancy, cash flow and
earnings growth for the seventh year in a row;> revenue, cash flow and adjusted profit before tax increased by 20%, 31% and 24% respectively;> like-for-like occupancy was increased by 3.5 ppts;> the capital structure has been further strengthened with interest cover of 6.2 times; > the Group acquired land for development in key strategic locations in London; and> dividends are being increased by 15%.
Policy on executive remunerationThe policy of the Company is to ensure that the executive remuneration packages are designed to attract, motivate and retain Directors of high calibreand reward the Executive Directors for protecting and enhancing value for shareholders.
I am pleased that shareholders overwhelmingly approved the Directors’ Remuneration Policy (“the Policy”) put forward at the July 2015 AGM whichaimed to achieve these objectives. The remuneration decisions made by the Committee in the last year were informed by these principles andconformed with the Policy. The Policy aims to provide:
> remuneration to the Directors which is fair to the Directors both generally and in the context of the remuneration of other staff of the Companyand the returns to shareholders; and
> a balance of short and long term incentives which provide a strong link between reward and individual and Group performance to align theinterests of the Executive Directors with the interests of shareholders.
The Committee believes that the success of the remuneration policy is reflected in the length of service, stability and strong performance of theExecutive Director team. Two of the Executive Directors were founders of the Company while the other two have been Executive Directors for 17 yearsand nine years respectively. The Executive Directors have significant interests in the shares of the Company, each in excess of two times base salarywhich is the Company’s shareholding guideline for Executive Directors. The Executive Directors are interested in shares comprising approximately9% of the share capital of the Company (including unvested share incentives held).
The Committee will continue to carry out periodic reviews of the Policy to ensure its relevance in light of changes to the business and wider marketand will seek shareholder approval for any amendments. Having said that, the Committee does not intend to make any revisions at the 2016 AGM, tothe Policy approved in 2015.
A summary of the approved Policy is provided in the Directors’ Remuneration Policy section of the Directors’ Remuneration Report and the full Policyis available online http://corporate.bigyellow.co.uk/investors/governance/remuneration-policy.aspx

67
Remuneration changes during the yearAll of the changes in remuneration in the year ended 31 March 2016 were within the Policy.
Within the aggregate figure for Executive Director remuneration, the changes during the year were:
> Base salary: increased by £30,000 (3%) – of which the main change was an increase in the salary of one Director to reflect his progress in therole, the other increases were 2%, in line with increases provided to staff
> Taxable benefits: increased by £1,000 (5%) > Annual bonus: was 12% of salary for the year (being in line with the average for all staff of the Company, and compared to 12.5% for the prior year)
and reduced by £1,000 (1%).> Pension contributions: increased to 15% of base salary. This change, coupled with the increase in base salaries, led to an overall increase in
pension contributions of £52,000 (55%).> Sharesave Scheme: one Director’s Sharesave scheme vested in the year producing a gain of £14,000 (2015: two Directors’ Sharesave Schemes
vested producing a gain of £31,000 in total)> Long term incentives:
> the 2012 award of shares granted under the LTIP vested as to 100% (representing a total gain of £1,959,000). As in the previous year, eachof the Executive Directors was granted an award equal to 100% of base salary subject to performance conditions. The value of these awardswas £985,000 – an increase of £30,000 (3%) ; and
> awards were made under the 2015 Long Term Bonus Performance Plan (“LTBPP”) in the year of £4.43 million (2015: no awards). The Remuneration Committee reviewed the performance targets for the year and concluded that the awards under the Plan have provisionallyvested at 90% in respect of the year ended 31 March 2016. There are a further two years performance on which the LTBPP is assessed beforeany awards vest.
In considering the relative importance of the spend on pay (see page 79):
> Total employee pay: increased by 15%, largely due to the acquisition of Big Yellow Limited Partnership in December 2014 (and amounted to £15.1 million)
> Profit distributed by way of dividend: increased by 31% (and amounted to £36.4 million)> Retained profit for the year: decreased by 3% (and amounted to £75.6 million)
More details of the remuneration of the Directors in the year ended 31 March 2016 are set out in the Annual Report on Remuneration section of theRemuneration Report.
AGMI hope that, at the Annual General meeting in July, you will support the advisory resolution on the remuneration paid to the Directors in the lastfinancial year set out in the Annual Remuneration Report section of this Remuneration Report.
Tim ClarkChairman of the Remuneration Committee
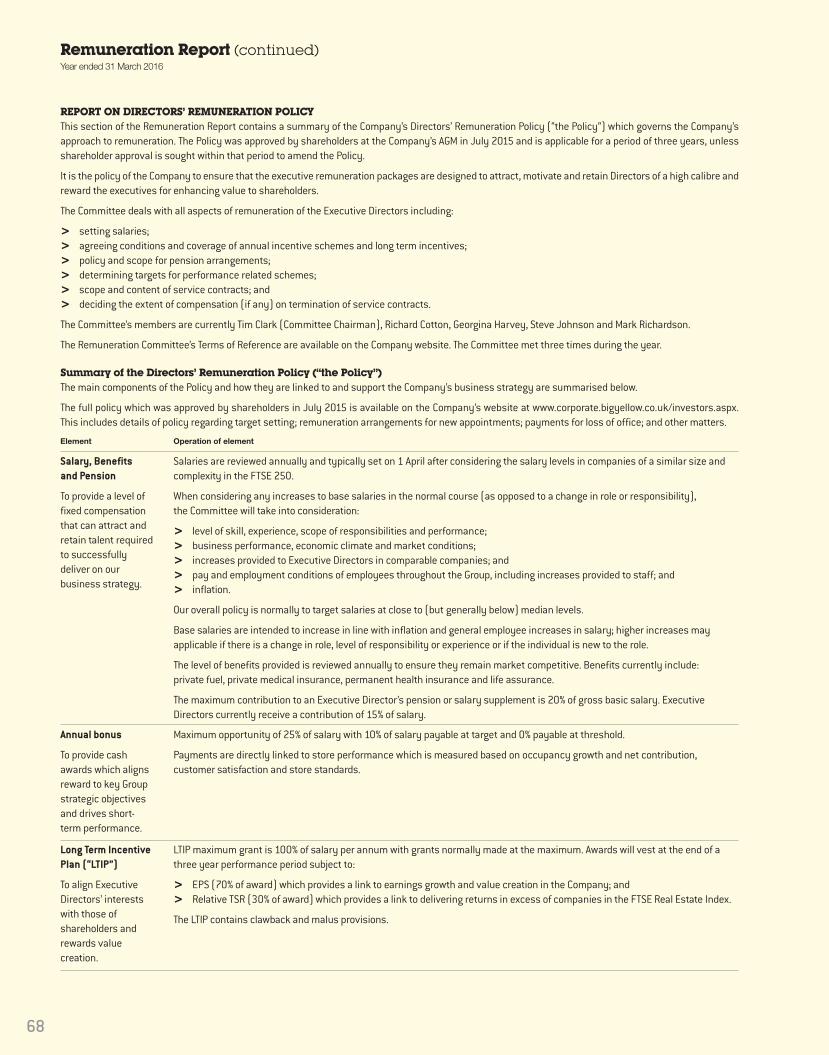
REPORT ON DIRECTORS’ REMUNERATION POLICYThis section of the Remuneration Report contains a summary of the Company’s Directors’ Remuneration Policy (“the Policy”) which governs the Company’sapproach to remuneration. The Policy was approved by shareholders at the Company’s AGM in July 2015 and is applicable for a period of three years, unlessshareholder approval is sought within that period to amend the Policy.
It is the policy of the Company to ensure that the executive remuneration packages are designed to attract, motivate and retain Directors of a high calibre andreward the executives for enhancing value to shareholders.
The Committee deals with all aspects of remuneration of the Executive Directors including:
> setting salaries;> agreeing conditions and coverage of annual incentive schemes and long term incentives;> policy and scope for pension arrangements;> determining targets for performance related schemes;> scope and content of service contracts; and> deciding the extent of compensation (if any) on termination of service contracts.
The Committee’s members are currently Tim Clark (Committee Chairman), Richard Cotton, Georgina Harvey, Steve Johnson and Mark Richardson.
The Remuneration Committee’s Terms of Reference are available on the Company website. The Committee met three times during the year.
Summary of the Directors’ Remuneration Policy (“the Policy”)The main components of the Policy and how they are linked to and support the Company’s business strategy are summarised below.
The full policy which was approved by shareholders in July 2015 is available on the Company’s website at www.corporate.bigyellow.co.uk/investors.aspx. This includes details of policy regarding target setting; remuneration arrangements for new appointments; payments for loss of office; and other matters.
Element Operation of element
Salary, Benefits and Pension
To provide a level offixed compensationthat can attract andretain talent requiredto successfullydeliver on ourbusiness strategy.
Salaries are reviewed annually and typically set on 1 April after considering the salary levels in companies of a similar size andcomplexity in the FTSE 250.
When considering any increases to base salaries in the normal course (as opposed to a change in role or responsibility), the Committee will take into consideration:
> level of skill, experience, scope of responsibilities and performance;> business performance, economic climate and market conditions;> increases provided to Executive Directors in comparable companies; and> pay and employment conditions of employees throughout the Group, including increases provided to staff; and > inflation.
Our overall policy is normally to target salaries at close to (but generally below) median levels.
Base salaries are intended to increase in line with inflation and general employee increases in salary; higher increases mayapplicable if there is a change in role, level of responsibility or experience or if the individual is new to the role.
The level of benefits provided is reviewed annually to ensure they remain market competitive. Benefits currently include:private fuel, private medical insurance, permanent health insurance and life assurance.
The maximum contribution to an Executive Director’s pension or salary supplement is 20% of gross basic salary. ExecutiveDirectors currently receive a contribution of 15% of salary.
Annual bonus
To provide cashawards which alignsreward to key Groupstrategic objectivesand drives short-term performance.
Maximum opportunity of 25% of salary with 10% of salary payable at target and 0% payable at threshold.
Payments are directly linked to store performance which is measured based on occupancy growth and net contribution,customer satisfaction and store standards.
Long Term IncentivePlan (“LTIP”)
To align ExecutiveDirectors’ interestswith those ofshareholders andrewards valuecreation.
LTIP maximum grant is 100% of salary per annum with grants normally made at the maximum. Awards will vest at the end of athree year performance period subject to:
> EPS (70% of award) which provides a link to earnings growth and value creation in the Company; and> Relative TSR (30% of award) which provides a link to delivering returns in excess of companies in the FTSE Real Estate Index.
The LTIP contains clawback and malus provisions.
Remuneration Report (continued)Year ended 31 March 2016
68

Summary of the Directors’ Remuneration Policy (“the Policy”) (continued)
The total maximum incentive value awarded across all four Executive Directors will not exceed 4 x 450% of base salary (over athree year performance period); however each individual will have the potential to be awarded a maximum of 675% of basesalary (so long as the total maximum is not exceeded).
Vesting depends on an annual assessment of performance (over three years but reviewed annually) against a series offinancial and non-financial targets aligned with the annual business plan.
The value accrued to participants may be subject to clawback if subsequent performance reflects adversely on achievement ofthe targets. The LTBPP also contains malus provisions.
A further holding period will apply to 50% of the award, such that 25% will be released one year after vesting, and the remaining25% will be released two years after vesting, so that the full release of vested entitlements takes place over five years.
Within the constraints of business confidentiality, performance measures for each year are disclosed in the correspondingAnnual Report on Remuneration – the information for this year can be found on page 74.
Long Term BonusPerformance Plan
To ensure that thetotal remunerationpackage is morecompetitive,supports theCompany’s strategyand its ability toreact to changingeconomic andbusinesscircumstances.
Operation of elementElement
Sharesave Scheme
To encourage shareownership by allemployees.
This HMRC approved scheme allows employees to align their interests with those of investors and also to share in the long-termsuccess of the Company. The annual allowance for investing in the Sharesave scheme is £6,000.
Shareholding policy
Ensures thatExecutive Directors’interests are alignedwith shareholders’over a longer timeperiod.
Requirement to build and maintain a holding of at least 200% of salary in shares of the Company, through retaining at least 50%of shares vesting in share plans if this guideline has not been met.
Non-ExecutiveDirector Fees
Provides a levelof fees to supportrecruitment andretention ofNon-ExecutiveDirectors with thenecessary experienceto advise and assistwith establishingand monitoring theGroup’s strategicobjectives.
Fee levels are normally reviewed annually in March and are set at broadly median levels for comparable roles at companies of asimilar size and complexity within the FTSE250.
Fees are intended to rise in line with inflation.
The fees may be paid in the form of shares.
69
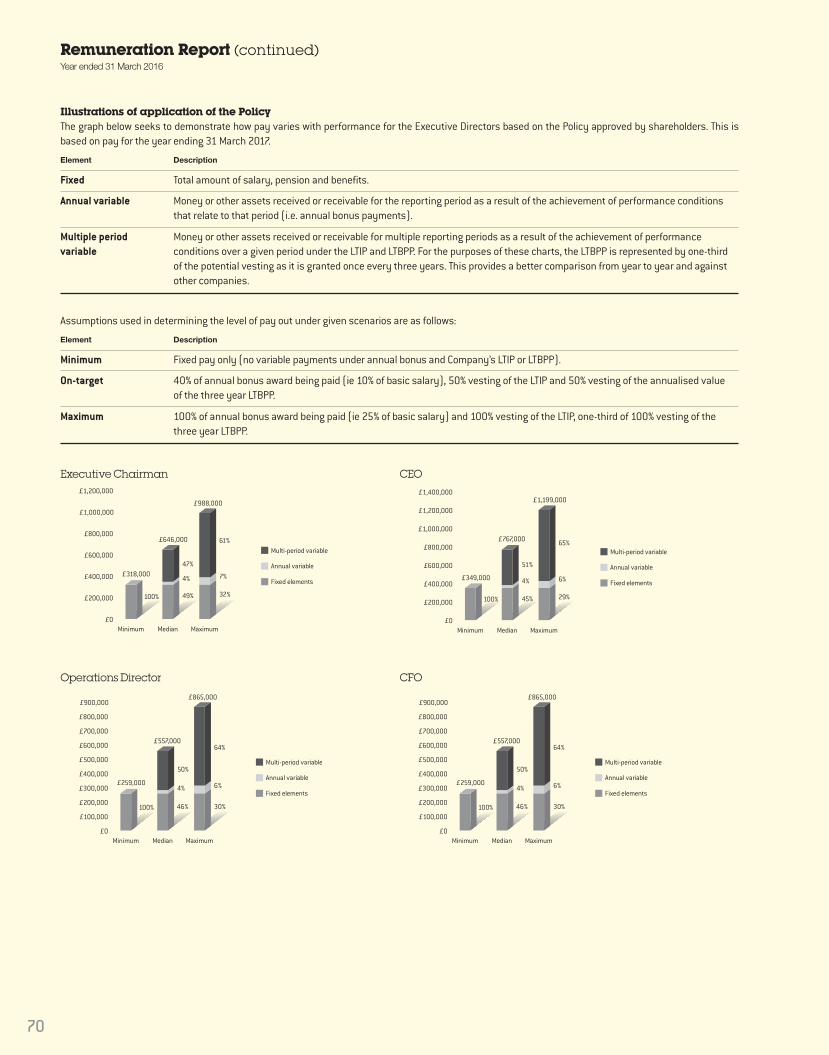
Illustrations of application of the Policy The graph below seeks to demonstrate how pay varies with performance for the Executive Directors based on the Policy approved by shareholders. This isbased on pay for the year ending 31 March 2017.
Assumptions used in determining the level of pay out under given scenarios are as follows:
Element Description
Fixed Total amount of salary, pension and benefits.
Annual variable Money or other assets received or receivable for the reporting period as a result of the achievement of performance conditionsthat relate to that period (i.e. annual bonus payments).
Multiple periodvariable
Money or other assets received or receivable for multiple reporting periods as a result of the achievement of performanceconditions over a given period under the LTIP and LTBPP. For the purposes of these charts, the LTBPP is represented by one-thirdof the potential vesting as it is granted once every three years. This provides a better comparison from year to year and againstother companies.
Element Description
Minimum Fixed pay only (no variable payments under annual bonus and Company’s LTIP or LTBPP).
On-target 40% of annual bonus award being paid (ie 10% of basic salary), 50% vesting of the LTIP and 50% vesting of the annualised valueof the three year LTBPP.
Maximum 100% of annual bonus award being paid (ie 25% of basic salary) and 100% vesting of the LTIP, one-third of 100% vesting of thethree year LTBPP.
Remuneration Report (continued)Year ended 31 March 2016
70
Minimum Median Maximum£0
£400,000
£600,000
£800,000
£1,000,000
£1,200,000
£200,000
Multi-period variable
Annual variable
Fixed elements
49% 32%
7%4%
47%
100%
£318,000
£646,000
£988,000
61%
Minimum Median Maximum£0
£400,000
£600,000
£800,000
£1,000,000
£1,200,000
£1,400,000
£200,000 45% 29%
6%4%
51%
100%
£349,000
£767,000
£1,199,000
65%Multi-period variable
Annual variable
Fixed elements
Minimum Median Maximum£0
£400,000
£500,000
£600,000
£700,000
£800,000
£900,000
£200,000
£300,000
£100,000
Multi-period variable
Annual variable
Fixed elements
46% 30%
6%4%
50%
100%
£259,000
£557,000
£865,000
64%
Minimum Median Maximum£0
£400,000
£500,000
£600,000
£700,000
£800,000
£900,000
£200,000
£300,000
£100,000
Multi-period variable
Annual variable
Fixed elements
46% 30%
6%4%
50%
100%
£259,000
£557,000
£865,000
64%
Executive Chairman CEO
Operations Director CFO

Consideration of shareholders’ viewsThe Group is committed to ongoing shareholder dialogue and takes an active interest in voting outcomes. Where there are substantial votes against resolutionsin relation to Directors’ remuneration, the reasons for that voting will be sought and any actions in response will be detailed here. There have been no significantissues raised by shareholders in respect of remuneration in the year.
The table below shows the advisory vote on the 2015 Remuneration Report and the binding vote on the Remuneration Policy at the AGM held on 21 July 2015.Votes for % Votes Against % Votes withheld
2015 Remuneration Report 120,266,913 98.00 2,459,349 2.00 2,463,1552015 Remuneration Policy 124,032,466 99.22 979,331 0.78 177,620
The views of our shareholders are very important to us and the Remuneration Committee considers shareholder feedback received in relation to the AGM eachyear at its first meeting following the AGM. This feedback, as well as any additional feedback received during any other meetings with shareholders throughoutthe year, is then considered as part of the Company’s annual review of remuneration policy.
The Remuneration Committee notes that shareholders do not speak with a single voice, but we engage with our largest shareholders to ensure we understandthe range of views which exist on remuneration issues. When any material changes are proposed to the Policy, the Remuneration Committee chairman willinform major shareholders in advance, and will offer a meeting to discuss these.
This policy report was approved by the Board of Directors on 23 May 2016 and signed on its behalf by
Tim ClarkRemuneration Committee Chairman
71
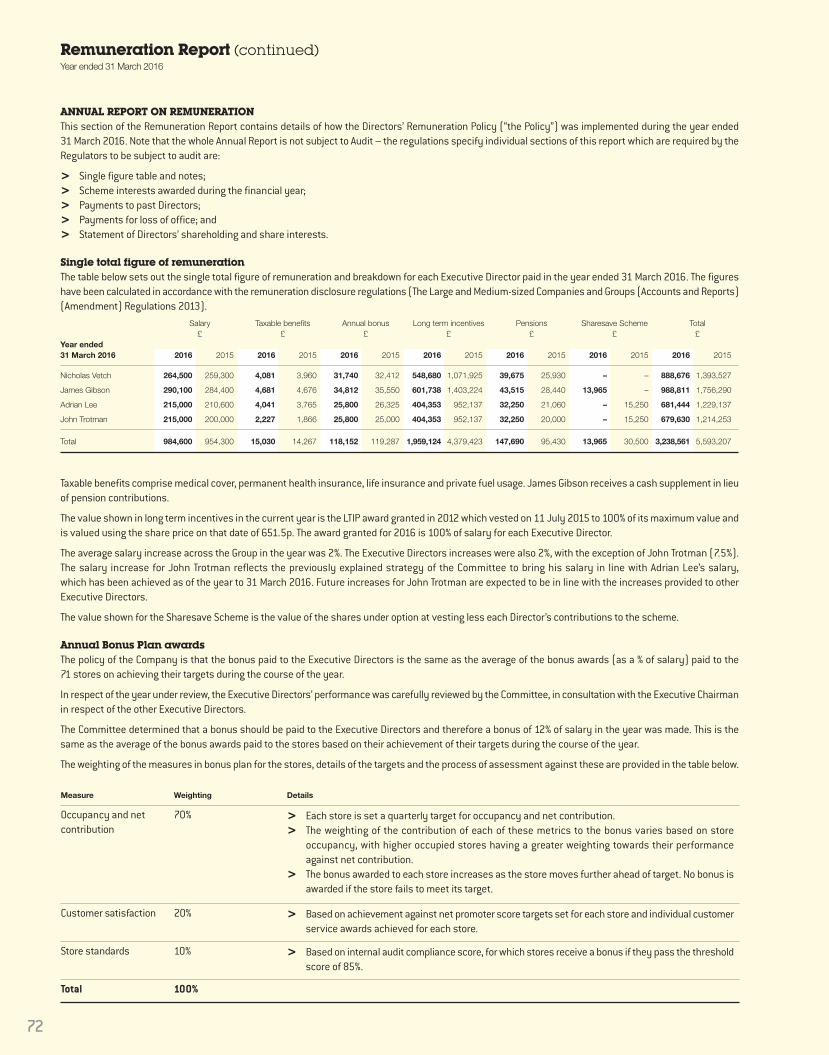
Remuneration Report (continued)Year ended 31 March 2016
72
ANNUAL REPORT ON REMUNERATIONThis section of the Remuneration Report contains details of how the Directors’ Remuneration Policy (“the Policy”) was implemented during the year ended 31 March 2016. Note that the whole Annual Report is not subject to Audit – the regulations specify individual sections of this report which are required by theRegulators to be subject to audit are:
> Single figure table and notes;> Scheme interests awarded during the financial year;> Payments to past Directors;> Payments for loss of office; and> Statement of Directors’ shareholding and share interests.
Single total figure of remunerationThe table below sets out the single total figure of remuneration and breakdown for each Executive Director paid in the year ended 31 March 2016. The figureshave been calculated in accordance with the remuneration disclosure regulations (The Large and Medium-sized Companies and Groups (Accounts and Reports)(Amendment) Regulations 2013). Salary Taxable benefits Annual bonus Long term incentives Pensions Sharesave Scheme Total £ £ £ £ £ £ £Year ended 31 March 2016 2016 2015 2016 2015 2016 2015 2016 2015 2016 2015 2016 2015 2016 2015
Nicholas Vetch 264,500 259,300 4,081 3,960 31,740 32,412 548,680 1,071,925 39,675 25,930 – – 888,676 1,393,527
James Gibson 290,100 284,400 4,681 4,676 34,812 35,550 601,738 1,403,224 43,515 28,440 13,965 – 988,811 1,756,290
Adrian Lee 215,000 210,600 4,041 3,765 25,800 26,325 404,353 952,137 32,250 21,060 – 15,250 681,444 1,229,137
John Trotman 215,000 200,000 2,227 1,866 25,800 25,000 404,353 952,137 32,250 20,000 – 15,250 679,630 1,214,253
Total 984,600 954,300 15,030 14,267 118,152 119,287 1,959,124 4,379,423 147,690 95,430 13,965 30,500 3,238,561 5,593,207
Taxable benefits comprise medical cover, permanent health insurance, life insurance and private fuel usage. James Gibson receives a cash supplement in lieuof pension contributions.
The value shown in long term incentives in the current year is the LTIP award granted in 2012 which vested on 11 July 2015 to 100% of its maximum value andis valued using the share price on that date of 651.5p. The award granted for 2016 is 100% of salary for each Executive Director.
The average salary increase across the Group in the year was 2%. The Executive Directors increases were also 2%, with the exception of John Trotman (7.5%).The salary increase for John Trotman reflects the previously explained strategy of the Committee to bring his salary in line with Adrian Lee’s salary,which has been achieved as of the year to 31 March 2016. Future increases for John Trotman are expected to be in line with the increases provided to otherExecutive Directors.
The value shown for the Sharesave Scheme is the value of the shares under option at vesting less each Director’s contributions to the scheme.
Annual Bonus Plan awardsThe policy of the Company is that the bonus paid to the Executive Directors is the same as the average of the bonus awards (as a % of salary) paid to the 71 stores on achieving their targets during the course of the year.
In respect of the year under review, the Executive Directors’ performance was carefully reviewed by the Committee, in consultation with the Executive Chairmanin respect of the other Executive Directors.
The Committee determined that a bonus should be paid to the Executive Directors and therefore a bonus of 12% of salary in the year was made. This is thesame as the average of the bonus awards paid to the stores based on their achievement of their targets during the course of the year.
The weighting of the measures in bonus plan for the stores, details of the targets and the process of assessment against these are provided in the table below.
Measure Weighting Details
Occupancy and netcontribution
70% > Each store is set a quarterly target for occupancy and net contribution. > The weighting of the contribution of each of these metrics to the bonus varies based on store
occupancy, with higher occupied stores having a greater weighting towards their performanceagainst net contribution.
> The bonus awarded to each store increases as the store moves further ahead of target. No bonus isawarded if the store fails to meet its target.
Customer satisfaction 20% > Based on achievement against net promoter score targets set for each store and individual customerservice awards achieved for each store.
Store standards 10% > Based on internal audit compliance score, for which stores receive a bonus if they pass the thresholdscore of 85%.
Total 100%

The targets for each of the 71 stores have not been disclosed in the table as they are commercially sensitive. The Company provides full retrospective disclosureof the performance measures, targets and performance against targets for the LTBPP which is assessed on an annual basis against targets set in relation tothe Group’s business plan and Group-wide KPIs. This can be found on page 74.
The performance in the year resulted in a bonus of 12% of salary which equated to the following payments for the Executive Directors:
> Nicholas Vetch – £31,740> James Gibson – £34,812> Adrian Lee – £25,800> John Trotman – £25,800
Long Term Incentive Plan (“LTIP”) awardsThe awards granted under the LTIP are subject to performance conditions to be met over a performance period of three years. There is no retesting ofperformance conditions and, if they are not satisfied, the awards will lapse.
The performance conditions applicable to the LTIP which vested in the year are set out below. Vesting is conditional on the achievement of an underpin EPS growthof an average of 3% above RPI per annum. This hurdle was met for the 2012 awards, with average growth in EPS of 16.3%, compared to RPI plus 3% of 6.1%.
The Committee assessed the extent to which the performance conditions have been satisfied for the 2012 award which vested in 2015, with the following results:
LTIP awards granted in year ended 31 March 2016 The table below sets out the details of the long term incentive awards granted in the year ended 31 March 2016 where vesting will be determined accordingto the achievement of performance conditions that will be tested in future reporting periods.
(1) The face value of the award is calculated using the average share price three days prior to the grant date.
The performance conditions applicable to the awards granted in the year ended 31 March 2016 are set out below:
Between threshold and maximum performance, vesting will take place on a straight-line basis.
Condition Weighting
Thresholdperformancerequired
Maximumperformancerequired
LTIP value for meetingthreshold and maximumperformance (% salary)
Performanceachieved Vesting %
Relative TSR 100% Median ofcomparator groupof real estatecompanies
Upper quartile ofthe comparatorgroup
25% – 100% 7 out of 34 incomparator group
100%
Total 100% 100%
Director Award typeAwards as a % ofsalary
Face valueof award(1)
Percentage of awardvesting at thresholdperformance
Maximumpercentage of facevalue that could vest
Performanceperiod end date
Performanceconditions
Nicholas Vetch
James Gibson
Adrian Lee
John Trotman
Annual cycle ofawards over nilcost options
100% of salary
£264,500
£290,100
£215,000
£215,000
25% 100% 21 July 2018Adjusted EPSgrowth andrelative TSR
Condition Weighting
Thresholdperformancerequired
Maximumperformancerequired
LTIP value for meetingthreshold and maximumperformance (% salary) Basis for measurement
Total 100%
Relative TSR 30% Median ofcomparator groupof real estatecompanies
Upper quartile ofthe comparatorgroup
25% to 100% Average of the Group’s closing mid-marketshare price over the three monthspreceding the start of the performanceperiod and preceding the end of theperformance period will be used.
Adjusted EPS 70% Adjusted EPSgrowth of RPI+3%per annum
Adjusted EPSgrowth of RPI+8%per annum
25% to 100% The adjusted EPS figure reported in theaudited results of the Group for the lastcomplete financial year ending before thestart of the performance period and the lastcomplete financial year ending before theend of the performance period will be used.
73

Long Term Bonus Performance PlanThe following awards were made during the year under the LTBPP:
The performance targets for the LTBPP are not disclosed for the year ahead, given the commercially sensitive nature of a number of the targets (which arederived from the Group’s business plan). Shortly after the end of each year, the Committee assesses the key targets and the extent to which managementhas been able to meet these targets for that year and reports on this assessment (excluding any that are still commercially sensitive). The targets are onlyadjusted during the year if material events occur that necessitate a change to the business plan. The report on the targets for the year ended 31 March 2016(other than those which remain commercially sensitive) is summarised in the table below:
Director Award type
Awards as a % of salary at the time of grant
Face value of award
Percentage of awardvesting at thresholdperformance
Maximumpercentage of facevalue that could vest
Performanceperiod end date
Performanceconditions
Nicholas V etch
James Gibson
Adrian Lee
John Trotman
Granted everythree years,award convertsto nil costoptions onvesting.
377%
496%
464%
464%
£996,900
£1,440,000
£996,900
£996,900
0% 100% 31 March 2018
Assessedannually ona basket ofmeasures
Remuneration Report (continued)Year ended 31 March 2016
74
Objective Committee Comment
Grow the Group’s annual free cash flow for the year to 31 March 2016 to£51.6 million from £42.4 million in the year to 31 March 2015.
The Group’s free cash flow for the year to 31 March 2016 was £55.5 million,an increase of 31% from the prior year.
Complete the drawdown of the M&G loan in June and repay the interimLloyds facility.
The M&G loan was drawn as planned on 29 June 2015 and the interimLloyds facility repaid on that date.
Additionally, in August 2015, the Group completed a further refinancing ofthe Group bank debt, extending its maturity to October 2020, with an optionfor a further year, whilst reducing the bank margin by 25bps. The Group alsoput in place an accordion of £80 million to give the flexibility to fund futureexpansion through bank debt.
Comply with all banking covenants and maintain a net worth in excess of£750 million.
All banking covenants were complied with during the year. Net worth hasgrown by £78.5 million to £829.4 million.
Grow the occupancy of the stores open at 31 March 2015 from 73.2% to78.2% by 30 September 2015, and following the seasonal occupancy loss inthe third quarter, recover to this level by 31 March.
The occupancy of the like for like stores at 31 March 2016 was 76.7%,representing growth of 3.5 percentage points from 31 March 2015. Theoccupancy at 30 September 2015 was 77.3%.
Grow the average net rent per square foot across the wholly owned storesfrom £25.23 per square foot by 2% to £25.73 by 31 March 2016.
The net rent per sq ft at 31 March 2016 was £25.90, an increase of 2.7%from 31 March 2015.
Meet budgeted revenue (£101.1 million) and profit before tax (£49.0 million) targets.
Revenue for the full year was £101.4 million, and adjusted PBT was £49.0 million, ahead of, and in line with budget respectively.
Maintain the Group’s online market share measured against the top 35 self storage operators by Connexity Hitwise, at 35% to 38%.
The Group’s average market share over the course of the financial year was37%. The nearest competitor had a market share of 17% for the year.
Review potential sites (in London and key target towns outside of London) for store acquisition with a view of acquiring at least one new site in the year.
The Group has acquired a site in Kings Cross, which was a key strategictarget location. In addition, the Group has acquired a site in Camberwell,which will complement existing stores in Kennington and New Cross.
Construct Cambridge on time and on budget, with the store due to open inJanuary 2016.
The store was constructed on budget, and opened as planned in January 2016.
Obtain a place in the Sunday Times Best 100 Companies to work for. Big Yellow earned a two star accreditation and ranked 80th in the SundayTimes Best 100 Companies to work for.
Sell the surplus land at Manchester during the year. The Group sold the surplus land at its Manchester site for £8 million duringthe year. Discussions are ongoing with the Planning Authority in respect ofthe Big Yellow store on the remaining land.
Reduce the carbon intensity for the year to 31 March 2016 (KgCO2/m2 ofoccupied space) by 5% from the year to 31 March 2015.
Carbon intensity was reduced by 16% for the year to 31 March 2016.

75
The other targets, covering areas such as real estate, staffing and certain financial targets, were met in all material respects.
Following careful consideration of the performance targets and actual performance of the Group and the Executive Directors, the Committee has concludedthat the award in respect of the financial year ended 31 March 2016 has provisionally vested as to 90% of its potential amount for the year.
Sharesave SchemeThe Group’s Sharesave Scheme is open to all UK employees (including Executive Directors) with a minimum of six months’ service and meets UK HMRCapproval requirements, thus giving all eligible employees the opportunity to acquire shares in the Company in a tax efficient manner. Three of the ExecutiveDirectors participated in the scheme during the financial year. The details of the Sharesave scheme options are shown on page 77.
Pension entitlementsThe Company pays pension contributions into the Executive Directors’ personal pension plans or makes a cash contribution in lieu of pension contributions.They do not participate in any defined benefit scheme. For the year ended 31 March 2016, the Company contribution was 15% of salary for the Executive Directors.
Payments to past DirectorsNo payments of money or any other assets were made to any former Director of the Company in the financial year ended 31 March 2016 (2015: no payments).
Payments on loss of office No payments were made to any Directors in respect of loss of office during the financial year ended 31 March 2016 (2015: no payments).
Non-Executive DirectorsThe table below sets out the single total figure of remuneration and breakdown for each Non-Executive Director paid in the year ended 31 March 2016.
Fees Taxable benefits Total £ £ £
2016 2015 2016 2015 2016 2015
Tim Clark 42,800 41,900 – – 42,800 41,900Richard Cotton 40,100 39,300 – – 40,100 39,300Georgina Harvey 37,600 36,800 – – 37,600 36,800Steve Johnson 37,600 36,800 – – 37,600 36,800Mark Richardson 40,100 39,300 – – 40,100 39,300
Total 198,200 194,100 – – 198,200 194,100
Non-Executive Director fees were increased by 2% for the year ended 31 March 2016.
Implementation of the PolicyThe main elements of Executive Director remuneration for the year ended 31 March 2016 and the forthcoming financial year are summarised below:
Element Implementation in 2015/16 Implementation in 2016/17
Base salary Salary levels for Executive Directors:
> Executive Chairman: £264,500> Chief Executive: £290,100> Operations Director: £215,000> Chief Financial Officer: £215,000
Salaries were increased by 2% from the 2014/15 salaries withthe exception of Chief Financial Officer who received a 7.5%increase to bring his salary in line with the Operations Director.Increases for the wider employee population were 2%.
Salary levels for Executive Directors:
> Executive Chairman: £269,800> Chief Executive: £296,000> Operations Director: £219,300> Chief Financial Officer: £219,300
Salaries were increased by 2% from the 2015/16 salaries.
Increases were made in accordance with the Policy.
Increases for the wider employee population were 2%.
Benefits and Pension Contribution of 15% of salary made into Executive Directorspersonal pension plan, or a cash supplement of equivalentvalue paid in lieu of pension contribution.
No change
Annual bonus Maximum opportunity of 25% of salary.
Assessed on stores’ performance against our Key PerformanceIndicators:
> Occupancy and net contribution together represented 70% of the bonus
> Customer satisfaction (20%)> Store standards (10%)
No change
The Committee is of the opinion that further disclosure oftargets for the bonus plan are commercially sensitive, and thatit would be detrimental to disclose them at this time of thefinancial year. Performance against the targets will bedisclosed at the end of the performance period.

Implementation of the Policy (continued)
Remuneration Report (continued)Year ended 31 March 2016
76
Element Implementation in 2015/16 Implementation in 2016/17
Long Term IncentivePlan
Maximum opportunity of 100% of salary, with grants of 100% ofsalary for each of the Executive Directors.
These awards were granted with the following performanceconditions:
> 70% adjusted EPS – adjusted EPS growth of RPI+3% for 25%of this element of the award to vest with full vestingoccurring for adjusted EPS growth of RPI+8% p.a.;
> 30% – relative TSR performance vs. FTSE Real Estate Indexwith 25% of this element of the award vesting for median TSRcomparative performance and full vesting at upper quartile.
No change
Long Term BonusPerformance Plan
The following awards as a % of salary were made to theExecutive Directors under this plan:
> Executive Chairman – 377%> Chief Executive – 496%> Operations Director – 464%> Chief Financial Officer – 464%
The assessment of targets for the 2015/16 year end can befound on page 74.
No awards will be made this year as awards are granted everythree years.
Non-Executive Directors
Executive 2015/16 fee 2016/17 fee % increase
Tim Clark £42,800 £43,700 2%Richard Cotton £40,100 £41,000 2%Georgina Harvey £37,600 £38,400 2%Steve Johnson £37,600 £38,400 2%Mark Richardson £40,100 £41,000 2%
Fees retained for external non-executive directorshipsThe Executive Directors’ contracts do not allow them to engage in any other business outside the Group except where prior written consent from the Board isreceived. The Company recognises that Executive Directors may be invited to become Non-Executive Directors of other companies and that this can helpbroaden the skills and experience of a Director. Executive Directors are normally permitted to accept external appointments with the approval of the Boardand may retain the fees for the appointment.
Nicholas Vetch is a Non-Executive Director of The Local Shopping REIT plc for which he receives a fee of £30,000 per annum. James Gibson is a Non-ExecutiveDirector of AnyJunk Limited and of Moby Self Storage in Brazil; he does not receive any fees for his services.

77
Statement of Directors’ shareholdingThe Executive Directors are required to build and maintain a holding of 200% of base salary. These requirements have been met by all Executive Directorsduring the year. Non-Executive Directors are not subject to a shareholding requirement. Details of the Directors’ interests in shares are set out below(all interests are beneficial interests).
No changes took place in the interests of the Directors in the shares of the Company between 31 March 2016 and the date of this report.
The table below shows, in relation to each Director, the total number of shares and share options in which they have an interest. The LTBPP awards shown inthe table below are calculated by reference to the total award value divided by the Company’s share price at 31 March 2016.
LTIP LTBPPShare Share awards awards
ownership ownership Beneficially subject to subject to Unexercised Optionsrequirement requirements owned performance performance Sharesave exercised in the
Director (% of salary) met shares conditions conditions options financial year
Nicholas Vetch 200% Yes (25,842%) 9,002,397 148,845 128,715 – 169,064James Gibson 200% Yes (7,118%) 2,479,700 163,251 185,926 1,480 217,882Adrian Lee 200% Yes (2,383%) 830,435 117,773 128,715 2,960 146,911John Trotman 200% Yes (415%) 144,658 115,710 128,715 3,639 146,911Richard Cotton N/a N/a 73,485 – – – –Mark Richardson N/a N/a 27,225 – – – –Tim Clark N/a N/a 18,652 – – – –Steve Johnson N/a N/a 10,000 – – – –Georgina Harvey N/a N/a 13,013 – – – –
Directors’ share optionsTo provide further context on the shareholding of Directors, options in respect of ordinary shares for Directors who served in the year are as below: No. of No. of shares shares under under Market option at Granted Exercised Lapsed option at price at Date from Date option 31 March during the during the during the 31 March Exercise date of which firstName granted Scheme 2015 year year year 2016 price exercise exercisable Expiry Date
Nicholas Vetch 11 July 2012 LTIP 84,218 – (84,218) – – nil p 704.5p 11 July 2015 10 July 2022
22 July 2013 LTIP 60,266 – – – 60,266 nil p – 22 July 2016 21 July 2023
29 July 2014 LTIP 50,467 – – – 50,467 nil p – 29 July 2017 28 July 2024
21 July 2015 LTIP – 38,112 – – 38,112 nil p – 21 July 2018 20 July 2025
James Gibson 11 July 2012 LTIP 92,362 – (92,362) – – nil p 696.5p 11 July 2015 10 July 2022
18 March 2013 SAYE 2,965 – (2,965) – – 303.5p 774.5p 31 March 2016 1 October 2016
22 July 2013 LTIP 66,098 – – – 66,098 nil p – 22 July 2016 21 July 2023
29 July 2014 LTIP 55,352 – – – 55,352 nil p – 29 July 2017 28 July 2024
21 July 2015 LTIP – 41,801 – – 41,801 nil p – 21 July 2018 20 July 2025
14 March 2016 SAYE – 1,480 – – 1,480 608.0p – 31 March 2019 1 October 2019
Adrian Lee 11 July 2012 LTIP 62,065 – (62,065) – – nil p 696.5p 11 July 2015 10 July 2022
22 July 2013 LTIP 45,804 – – – 45,804 nil p – 22 July 2016 21 July 2023
29 July 2014 LTIP 40,989 – – – 40,989 nil p – 29 July 2017 28 July 2024
21 July 2015 LTIP – 30,980 30.980 nil p – 21 July 2018 20 July 2025
14 March 2016 SAYE – 2,960 – – 2,960 608.0p – 31 March 2019 1 October 2019
John Trotman 11 July 2012 LTIP 62,065 – (62,065) – – nil p 696.5p 11 July 2015 10 July 2022
22 July 2013 LTIP 45,804 – – – 45,804 nil p – 22 July 2016 21 July 2023
29 July 2014 LTIP 38,926 – – 38,926 nil p – 29 July 2017 28 July 2024
16 March 2015 SAYE 3,639 – – – 3,639 494.6p – 31 March 2018 1 October 2018
21 July 2015 LTIP – 30,980 – – 30,980 nil p – 21 July 2018 20 July 2025

Performance and pay The graph below shows the Group’s performance, measured by TSR, compared with the performance of the FTSE All Share Real Estate Index and the FTSE AllShare Index since the Company’s flotation in 2000. The FTSE All Share Real Estate Index is used for the assessment of the Company’s LTIP.
CEO RemunerationThe table below sets out the details of remuneration of the CEO over the past seven financial years.
CEO single figure of Annual bonus pay out Long term incentive vesting ratestotal remuneration % against maximum against maximum opportunity
Year (£) of 25% of salary %
2016 988,811 48% (12% of salary) 100%2015 1,756,290 50% (12.5% of salary) 98%2014 536,262 40% (10% of salary) 53%2013 335,891 40% (10% of salary) 0%2012 1,400,570 40% (10% of salary) 89%2011 325,968 40% (10% of salary) 0%2010 875,593 40% (10% of salary) 100%
The single figure of remuneration for 2015 and 2012 are higher than in other years due to the vesting of the three year Long Term Bonus Performance Plan inthose years delivering a reward of £945,750 (97% vesting) and £900,000 (90% vesting) respectively for the three year period ended in that year.
Percentage increase in the CEO’s remunerationThe table below compares the percentage increase in the CEO’s remuneration (including salary, fees, benefits and annual bonus) with the remuneration of Big Yellow Group employees.
% increase in remuneration in2016 compared with 2015
CEO Employees
Salary and fees 2% 2%All taxable benefits 0% 1%Annual bonuses (2%) (2%)
Total 2% 2%
Statement of consideration of employment conditions elsewhere in the GroupThe Committee reviews the reward and retention of the whole employee population periodically throughout the year to ensure that it can attract and retaintop talent. Particular consideration is given to the general basic salary increase, remuneration arrangements and employment conditions. Furthermore, theAnnual Bonus Plan award for Executive Directors is directly linked to the bonuses award to all staff.
The Directors are invited to be present at this review of the proposals for salary increase for the employee population generally and on any other changes toremuneration policy within the Company. The information presented at this review is taken into consideration when setting the pay levels of the executivepopulation. Additionally, the Committee has guidelines for the grant of all LTIP awards across the Company and responsibility for approving the total annualbonus cost of the Company. The Company does not invite employees to comment on the remuneration of Directors.
Remuneration Report (continued)Year ended 31 March 2016
78
0
100
200
300
400
500
600
700
800
900
1,000
1,100
1,200
8 May2000
9 Dec2001
13 Jul2003
12 Feb2005
16 Sep2006
19 Apr2008
20 Nov2009
24 Jun2011
24 Jan2013
28 Aug2014
31 Mar2016
FTSE All Share Index
Big Yellow Group
FTSE 350 Real Estate Index
TSR Performance from flotation
Source: Thomson Reuters Datastream

79
Relative importance of spend on payThe graph below sets out the relative importance of spend on pay in the year ended 31 March 2016 and 31 March 2015 compared with other disbursementsfrom profit, being the distributions to shareholders and retained earnings (comprehensive gain for the year less dividends).
Advisers to the Remuneration CommitteeThe Committee consults with the Executive Chairman, Nicholas Vetch, about proposals on a range of matters relating to the remuneration of the ExecutiveDirectors including the levels of overall remuneration, salary and bonus and awards and distributions under the share incentive and bonus plans.
The Committee relies upon remuneration data provided by PwC. In addition, PwC has provided advice to the Committee on the preparation of this report aswell as on market practice and trends. PwC is a member of the Remuneration Consultants Group and, as such, voluntarily operates under the Code of Conductin relation to executive remuneration consulting in the UK.
The Committee is satisfied that advice received from PwC during the year was objective and independent.
Adviser Appointed by Services provided to the Committee in 2015/16Fees in relation toremuneration advice
PwC RemunerationCommittee in 2008
Advice on vesting of 2012 LTBPP.
Advice on participant documentation for 2015 LTBPP.
Support in the drafting of the Directors’ Remuneration Report.
£21,000
2015
2016
Total employee pay(including Directors)
Profit distributed by way of dividend
Retained earnings
0
20,000
30,000
40,000
50,000
60,000
70,000
80,000
90,000
10,000
+15%
+31%
(3%)

INTRODUCTIONThe Audit Committee is appointed by the Board from the Non-Executive Directors of the Group. The Audit Committee’s terms of reference include all mattersindicated by Disclosure and Transparency Rule 7.1 and the UK Corporate Governance Code. The terms of reference are considered annually by the AuditCommittee and are then referred to the Board for approval.
The Audit Committee is responsible for:
> monitoring the integrity of the financial statements of the Group and any formal announcements relating to the Group’s financial performance and reviewingsignificant financial reporting judgements contained therein;
> reviewing the Group’s internal financial controls and the Group’s internal control and risk management systems, including consideration of the need foran internal audit function;
> making recommendations to the Board for a resolution to be put to the shareholders for their approval in general meetings, on the appointment of theexternal auditor and the approval of the remuneration and terms of engagement of the external auditor;
> reviewing and monitoring the external auditor’s independence and objectivity and the effectiveness of the audit process, taking into consideration relevantUK professional and regulatory requirements; and
> developing and implementing a policy on the engagement of the external auditor to supply non-audit services, taking into account relevant guidanceregarding the provision of non-audit services by the external audit firm.
The Audit Committee is required to report its findings to the Board, identifying any matters on which it considers that action or improvement is needed, andmake recommendations on the steps to be taken.
This year, the Committee has continued to focus on the narrative reporting and corporate governance disclosures in the Annual Report. The Committee wasasked by the Board to review the statement by the Directors that the Annual report presents a fair, balance and understandable view of the Group’s performance,strategy and business model.
Mark RichardsonAudit Committee Chairman
Committee Members and Attendance
Member Position Number of meetings attended
Tim Clark Member Richard Cotton Member Georgina Harvey Member Steve Johnson Member Mark Richardson Chairman
attendedabsent
The Audit Committee structure requires the inclusion of one financially qualified member (as recognised by the Consultative Committee of AccountancyBodies). Currently Mark Richardson, as a Fellow of the Institute of Chartered Accountants of England and Wales, fulfils this requirement. All Audit Committeemembers are expected to be financially literate.
The Group provides an induction programme for new Audit Committee members and ongoing training to enable all of the Committee members to carry outtheir duties. The induction programme covers the role of the Audit Committee, its terms of reference and expected time commitment by members and anoverview of the Group’s business, including the main business and financial dynamics and risks. New Committee members also meet some of the Group’sstaff. Ongoing training includes attendance at formal conferences, internal company seminars and briefings by external advisers.
MeetingsThe Audit Committee is required to meet three times per year and has an agenda linked to events in the Group’s financial calendar. The agenda is predominantlycyclical and is therefore approved by the Audit Committee Chairman on behalf of his fellow members. Each Audit Committee member has the right to requirereports on matters of interest in addition to the cyclical items.
The Audit Committee invites the Chief Executive, Chief Financial Officer, Financial Controller, and senior representatives of the external auditor to attend all ofits meetings in full, although it reserves the right to request any of these individuals to withdraw. Other senior management are invited to present such reportsas are required for the Committee to discharge its duties.
Overview of the actions taken by the Audit Committee to discharge its dutiesSince the beginning of the financial year the Audit Committee has:
> reviewed published financial information including the year end results, Annual Report, half year results and the Interim Management Statements;> considered whether the Annual Report provides a fair, balanced and understandable view of the Group’s performance, strategy and business model;> assessed and concluded on the Group’s viability statement;> considered the output from the Group-wide process used to identify, evaluate and mitigate risks;> reviewed the effectiveness of the Group’s internal controls and disclosures made in the Annual Report and financial statements on this matter;
Audit Committee Report
80

Overview of the actions taken by the Audit Committee to discharge its duties (continued)> reviewed and agreed the scope of the audit work to be undertaken by the external auditor;> agreed the fees to be paid to the external auditor for their audit of the March 2016 financial statements and September half-yearly report; > considered and agreed the approach of performing Directors’ valuations of investment properties for the half-year report;> undertaken an assessment of the qualification, expertise and resources, and independence of the external auditor and the effectiveness of the audit process; > considered the audit partner and audit firm rotation;> undertaken an evaluation of the performance of the external auditor; > considered the need for an internal audit function;> reviewed the arrangements for “whistleblowing” by employees to ensure that there is a consistent policy in the Group to enable employees to voice
concerns particularly in respect of possible financial reporting improprieties. A whistleblowing policy is included in the employee handbook;> met the Group’s external valuers;> met the Group’s Store Compliance Manager;> reviewed the Audit Committee’s Report; and> reviewed its own effectiveness.
Financial reporting and significant financial judgementsThe Committee reviews all financial information published by the Group in year end and half-year financial statements, including the presentation and disclosureof the financial information. It also considers the appropriateness of the accounting policies adopted by the Group and the accounting judgements made bymanagement in the preparation of the financial information.
The Committee has considered whether the Annual Report for the year ended 31 March 2016 provides a fair, balance and understandable view of the Group’sperformance, strategy and business model and whether it provides the necessary information to enable shareholders and prospective shareholders to assessthe Group’s performance, strategy and business model. The Committee is satisfied that the Annual Report for the year ended 31 March 2016 provides a fair,balanced and understandable view and included the necessary information as set out above. The Committee has confirmed this to the Board, whose statementis included in the Statement of Directors’ Responsibilities on page 83.
The Committee focuses on matters it considers important in their impact on the reported results of the Group, and on matters where there is a high degree ofcomplexity and/or judgement.
The key area of judgement that the Committee focuses on at the reporting date is the valuation of the investment property portfolio. This is carried out byindependent external valuers, but by its nature it is subjective, with significant judgement applied to the valuation, particularly given the lack of transactionalevidence for prime self storage assets. Members of the Committee met the external valuers to discuss the valuations, review the key judgements and discussedwhether there were any disagreements with management. This year the Committee reviewed and challenged the valuers on the cap rates, rental growthassumptions and stabilised occupancy levels, to agree on the appropriateness of the assumptions adopted. The Committee also challenged the valuers, andsatisfied itself on, their independence, their quality control processes (including peer partner review) and qualifications to carry out the valuations. Managementalso have processes in place to review the external valuations. In addition, the external auditors use specialists to review the valuations and report theirfindings and conclusions to the Audit Committee.
The Committee has also considered a number of other judgements made by management in the preparation of the financial statements. It has concluded thatthere is not a significant level of judgements involved.
Management have reported to the Audit Committee that they are satisfied that they are not aware of any material misstatements in the financial statements.The auditors confirmed in their report to the Audit Committee that they had not found any material misstatements during their audit work.
Based on the above, the Committee concluded that the financial statements appropriately apply the key estimates and critical judgements, in respect of thedisclosures and the amounts reported. The Committee also concluded that the Annual Report and financial statements, taken as a whole, are fair, balancedand understandable and provide the information necessary for shareholders to assess the Company’s performance, business model and strategy.
External auditorThe Audit Committee is responsible for the development, implementation and monitoring of the Group’s policy on external audit. The policy assigns oversightresponsibility for monitoring the independence, objectivity and compliance with ethical and regulatory requirements to the Audit Committee, and day-to-dayresponsibility to the Chief Financial Officer. The policy states that the external auditor is jointly responsible to the Board and the Audit Committee and that theAudit Committee is the primary contact.
To fulfil its responsibility regarding the independence of the external auditor, the Audit Committee reviewed:
> the external auditor’s plan for the current year, noting the role of the senior statutory audit partner, who signs the audit report and who, in accordancewith professional rules, has not held office for more than five years, and any changes in the key audit staff;
> the arrangements for day-to-day management of the audit relationship;> a report from the external auditor describing their arrangements to identify, report and manage any conflicts of interest;> the overall extent of non-audit services provided by the external auditor, in addition to its case-by-case approval of the position of non-audit services by
the external auditor; and> the past service of the auditor who was first appointed in 2000.
81
Annual auditor assessmentThe Audit Committee has adopted a formal framework in its review of the effectiveness of the external audit process and audit quality which include thefollowing areas:
> the arrangements for ensuring the external auditor’s independence and objectivity;> the lead audit engagement partner and the audit team;> the external auditor’s fulfilment of the agreed audit plan and variations from the plan;> the quality of the formal audit report to shareholders; > the robustness and perceptiveness of the auditor in his handling of the key accounting and audit judgements; and> the content of the external auditor’s comments on control improvement recommendations.
Regard is paid to the nature of, and remuneration received, for other services provided by Deloitte LLP to the Group and, inter alia, confirmation is sought fromthem that the fee payable for the annual audit is adequate to enable them to perform their obligations in accordance with the scope of the audit. Where non-audit services are provided, the fees are based on the work undertaken and are not success related.
The Committee considers that the relationship with the auditor is working well, and that they are effective in their role, and the audit process is working wellwith open dialogue and early discussion of judgements. As a consequence of its satisfaction with the results of the activities outlined above, the Audit Committeehas recommended to the Board that the external auditor is re-appointed.
Non-audit workThe Group’s policy on external audit sets out the categories of non-audit services which the external auditor will and will not be allowed to provide to the Group,including those that are pre-approved by the Audit Committee and those which require specific approval before they are contracted for, subject to de minimislevels. They may not provide a service which places them in a position where they may be required to audit their own work. Specifically, they are precludedfrom providing services relating to bookkeeping, financial information system design and implementation, appraisal or evaluation services, actuarial services,any management functions, investment banking services, legal services unrelated to the audit or advocacy services.
In respect of the year ended 31 March 2016, the auditor’s remuneration comprised £186,000 for audit work and £113,000 for other work, principally relatingto VAT and corporation tax work. In addition, over a three year rolling period, the level of non-audit fees is below the audit fee.
Audit rotationThe auditor, Deloitte LLP, has been in tenure since 2000 and the current audit partner has been in place since the audit of the 2013 financial statements.
The Committee has reviewed the performance of the external auditor and the audit process and is satisfied that currently Deloitte LLP provides an appropriatelevel of service delivered by a team with an in-depth understanding of our business. That said, the Committee is supportive of the new provision in the UKCode in respect of auditor rotation. The Committee’s present intention therefore is that they will tender the external audit with a view to changing auditors atthe end of the five year term of the current audit partner in 2017. There are no contractual obligations that act to restrict the Audit Committee’s choice ofexternal auditor.
The Company is in compliance with the requirements of the Statutory Audit Services for Large Companies Market Investigation (Mandatory Use of CompetitiveTender Processes and Audit Committee Responsibilities) Order 2014 and the Code.
Risk management and internal controlThe Committee and the Board reviewed the internal control processes of the business and the Group’s risk register during the year. The risks and uncertaintiesfacing the Group, and its internal control processes are considered in the Strategic Report on page 34.
Internal auditThe Committee has considered the Board’s view that, given the relatively straightforward nature of the Group’s business and the control environment in place,no formal internal audit function is required. The Committee concurs with management’s view.
OverviewAs a result of its work during the year, the Audit Committee has concluded that it has acted in accordance with its terms of reference and has ensured theindependence and objectivity of the external auditor.
The Chairman of the Audit Committee will be available at the Annual General Meeting to answer any questions about the work of the Committee.
Approved by the Audit Committee and signed on its behalf by:
Mark RichardsonAudit Committee Chairman23 May 2016
Audit Committee Report (continued)
82
Directors’ responsibilitiesThe Directors are responsible for preparing the Annual Report and the financial statements in accordance with applicable laws and regulations.
Company law requires the Directors to prepare such financial statements for each financial year. Under that law the Directors are required to prepare the Groupfinancial statements in accordance with International Financial Reporting Standards (IFRSs) as adopted by the European Union and Article 4 of the IAS Regulationand have also chosen to prepare the parent Company financial statements under IFRSs as adopted by the European Union. Under Company law the Directorsmust not approve the accounts unless they are satisfied that they give a true and fair view of the state of affairs of the Company and of the profit or loss ofthe Company for that period. In preparing these financial statements, International Accounting Standard 1 requires that the Directors:
> properly select and apply accounting policies;> present information, including accounting policies, in a manner that provides relevant, reliable, comparable and understandable information; > provide additional disclosures when compliance with the specific requirements in IFRSs are insufficient to enable users to understand the impact of
particular transactions, other events and conditions on the entity’s financial position and financial performance; and> make an assessment of the Company’s ability to continue as a going concern.
The Directors are responsible for keeping proper accounting records that are sufficient to show and explain the Company’s transactions and disclose withreasonable accuracy at any time the financial position of the Company and enable them to ensure that the financial statements comply with the CompaniesAct 2006. They are also responsible for safeguarding the assets of the Company and hence for taking reasonable steps for the prevention and detection offraud and other irregularities.
The Directors are responsible for the maintenance and integrity of the corporate and financial information included on the Company’s website. Legislation inthe United Kingdom governing the preparation and dissemination of financial statements may differ from legislation in other jurisdictions.
Directors' responsibility statementWe confirm that to the best of our knowledge:
1. the financial statements, prepared in accordance with International Financial Reporting Standards give a true and fair view of the assets, liabilities, financialposition and profit or loss of the Company and the undertakings included in the consolidation taken as a whole;
2. the strategic report includes a fair review of the development and performance of the business and the position of the Company and the undertakingsincluded in the consolidation taken as a whole, together with a description of the principal risks and uncertainties that they face; and
3. the Annual Report and financial statements, taken as a whole, are fair, balanced and understandable and provide the information necessary for shareholdersto assess the Company’s performance, business model and strategy.
By order of the Board
James Gibson John TrotmanChief Executive Officer Chief Financial Officer23 May 2016 23 May 2016
83
Statement of Directors’ Responsibilities
Independent auditor’s report to the members of Big Yellow Group PLC
84
Opinion on financial statements of Big Yellow Group plc
In our opinion:
> the financial statements give a true and fair view of the state of the Group’s and of the parent Company’saffairs as at 31 March 2016 and of the Group’s profit for the year then ended;
> the Group financial statements have been properly prepared in accordance with International FinancialReporting Standards (IFRSs) as adopted by the European Union;
> the parent Company financial statements have been properly prepared in accordance with IFRSs asadopted by the European Union and as applied in accordance with the provisions of the Companies Act2006; and
> the financial statements have been prepared in accordance with the requirements of the Companies Act2006 and, as regards the Group financial statements, Article 4 of the IAS Regulation.
The financial statements comprise the Consolidated Income Statement, the Consolidated Statement ofComprehensive Income, the Consolidated and Company Balance Sheets, the Consolidated and CompanyStatements of Changes in Equity, the Consolidated and Company Cash Flow Statements and the related notes 1 to 34. The financial reporting framework that has been applied in their preparation is applicable law and IFRSs asadopted by the European Union and, as regards the parent company financial statements, as applied inaccordance with the provisions of the Companies Act 2006.
Going concern and the Directors’assessment of the principal risksthat would threaten the solvency orliquidity of the Group
As required by the Listing Rules we have reviewed the Directors’ statement regarding the appropriateness of thegoing concern basis of accounting contained within note 2 to the financial statements and the Directors’statement on the longer-term viability of the Group contained within the Strategic Report on page 37.
We have nothing material to add or draw attention to in relation to:
> the Directors' confirmation on page 34 that they have carried out a robust assessment of the principal risksfacing the Group, including those that would threaten its business model, future performance, solvencyor liquidity;
> the disclosures on pages 34 to 36 that describe those risks and explain how they are being managedor mitigated;
> the Directors’ statement in note 2 to the financial statements about whether they considered it appropriateto adopt the going concern basis of accounting in preparing them and their identification of any materialuncertainties to the Group’s ability to continue to do so over a period of at least twelve months from the dateof approval of the financial statements;
> the Directors’ explanation on page 37 as to how they have assessed the prospects of the Group, over whatperiod they have done so and why they consider that period to be appropriate, and their statement as towhether they have a reasonable expectation that the Group will be able to continue in operation and meet itsliabilities as they fall due over the period of their assessment, including any related disclosures drawingattention to any necessary qualifications or assumptions.
We agreed with the Directors’ adoption of the going concern basis of accounting and we did not identify any suchmaterial uncertainties. However, because not all future events or conditions can be predicted, this statement is nota guarantee as to the Group’s ability to continue as a going concern.
Independence We are required to comply with the Financial Reporting Council’s Ethical Standards for Auditors and we confirmthat we are independent of the Group and we have fulfilled our other ethical responsibilities in accordance withthose standards. We also confirm we have not provided any of the prohibited non-audit services referred to inthose standards.
Our assessment of risks of materialmisstatement
The assessed risk of material misstatement described below is the one that had the greatest effect on our auditstrategy, the allocation of resources in the audit and directing the efforts of the engagement team.
85
Investment property valuation
Risk description See also note 14 to the financial statements, and the Audit Committee’s Report on pages 80 to 82.
Refer to the accounting policies of the Group set out on page 96 and 97 for the Group’s investment propertyvaluation policy and the associated critical accounting estimate for determining fair value.
As at 31 March 2016, the Group held wholly-owned investment properties and investment properties underconstruction valued at £1,126.2 million (2015: £1,022.8 million) all located within the United Kingdom.
The Group also has minority investments in two associate entities (Armadillo Storage Holding Company Limitedand Armadillo Storage Company 2 Limited), together ‘the Associates’ for which equity accounting is applied. TheAssociates control a combined gross value of £57.7 million (2015: £53.3 million) in self storage assets, of which20% is recognised by the Group.
Investment properties are held at fair value on the Group Consolidated Balance Sheet. The net valuation gain in theyear relating to Group held wholly-owned investment properties was £58.0 million (2015: £64.5 million), which wasrecognised through the Consolidated Statement of Comprehensive Income.
The net valuation gain, included within the share of profit of associates, relating to the properties held by theAssociates was £3.5 million (2015: £11.5 million) on a gross basis and therefore £0.7 million (2015: £2.3million)on a Group share basis.
Fair values are calculated using actual and forecast inputs such as: occupancy, capitalisation rates, maximumlettable area, operating expenses and net rent per square foot by property as at 31 March 2016. In addition, externalvaluers apply professional judgement concerning market conditions and factors impacting individual properties.
We consider investment property valuation to be at significant risk of material misstatement as the valuationprocess is subjective and inherently judgemental in nature. The investment market for prime self storage, in particular, is subject to market uncertainty due to the low volume of transactions.
How the scope of our auditresponded to the risk
> We assessed the design and implementation of the key internal controls around the property valuation process;> We tested the integrity of the information provided to the external valuers by management by agreeing key
inputs such as actual occupancy and net rent per square foot to underlying records and source evidence;> We modelled nine years of valuations and key valuation inputs of the investment properties subject to audit,
to understand the historical trends of key inputs and compared these against the key forecast assumptionsincluded in the property valuation;
> We met with the external valuers covering both the Group and Associate portfolios and assessed theirindependence, the scope of the work they were requested to perform by management, quality controlprocedures in place internally and the valuation methodology applied;
> We challenged the external valuers on the key assumptions applied and focussed on properties we identifiedas having significant or unusual valuation movements (compared to market data or previous periods). Our challenge was informed by input from our internal valuation specialists, utilising their knowledge andexpertise in the market at a macro level and the relevant geographies to challenge the key judgmental inputs.We also researched comparable transactions and understood trends in analogous industries and utilised thisinformation in our audit challenge. We understood the rationale for outlying valuations or movements andobtained corroborative evidence. We also assessed the valuations for a sample of other properties; and
> We visited a sample of properties to assess the condition of the buildings and validate a sample of occupancydata inputs.

Independent auditor’s report to the members of Big Yellow Group PLC (continued)
86
Investment property valuation
Key observations Management have recognised a £58.0 million uplift in the valuation as at 31 March 2016. During the course of theaudit of the investment property valuation, we noted the following key observations:
> A portfolio wide reduction was applied to the capitalisation rate of each store in the valuation reflecting animprovement in investor appetite for self storage assets; and
> An increase in the average stabilised occupancy rate has been applied to the portfolio. This reflects theincreasing number of stores reaching occupancy levels above 80%.
We found the assumptions adopted by management in the valuation were reasonable and the methodologyapplied was appropriate in all material respects.
Last year our report included one risk which is not included in our report this year – fair value assessments in theacquisition of the Big Yellow Limited Partnership; this transaction completed during the prior year.
Our risk around investment property valuation was addressed in the context of our audit of the financialstatements as a whole, and in forming our opinion thereon, and we do not provide a separate opinion onthis matter.
Our application of materiality We define materiality as the magnitude of misstatement in the financial statements that makes it probable thatthe economic decisions of a reasonably knowledgeable person would be changed or influenced. We use materialityboth in planning the scope of our audit work and in evaluating the results of our work.
We determined materiality for the Group to be £7.9 million (2015: £6.9 million), based on professional judgment,the requirements of International Standards of Auditing and the financial measures most relevant to users of thefinancial statements. We have used 1.0% of net assets (2015: 1.0% of net assets) as the benchmark for determiningmateriality. We concluded that determining materiality based on net assets is consistent with industry peers, in particular real estate investment trusts, and because it reflects a measure of interest to investors.
In addition to net assets, we consider adjusted profit before tax to be a critical financial performance measure for the Group on the basis that it is a key metric to analysts and investors and has substantial prominence in the Annual Report. Adjusted profit before tax is £49.0 million (2015: £39.4 million), which is reconciled to profitbefore tax of £112.2 million (2015: £105.2 million) in accordance with IFRS in note 10 of the financial statements. We applied a lower threshold of £2.3 million (2015: £1.9 million) for testing all balances impacting adjusted profitbefore tax. This lower threshold was based on 5% (2015: 5%) of adjusted profit before tax.
We agreed with the Audit Committee that we would report to the Committee all audit differences in excess of£400,000 (2015: £138,000), as well as differences below that threshold that, in our view, warranted reporting onqualitative grounds. We have re-assessed the appropriateness of this threshold since the prior year.
We also report to the Audit Committee on disclosure matters that we identified when assessing the overallpresentation of the financial statements.
Net Assets:
£829.4m
Materiality:
£7.9m

87
Investment property valuation
An overview of the scope of our audit Our audit was scoped by obtaining an understanding of the Group and its control environment, including Group-widecontrols, and assessing the risks of material misstatement.
As in previous years, the audit team performed full scope statutory audits of all non-dormant entities within theGroup. We have performed an audit to statutory materiality for the purposes of supporting the Group audit opinionfor each non-dormant entity. As such, the scope of our audit covered 100% of both consolidated profit before taxand consolidated net assets. Statutory materiality adopted for subsidiaries companies ranged from between £0.1 million and £7.8 million.
During the previous year the Group acquired 20% of the equity of the Associates and continues to manage theseportfolios. The Group applies equity accounting for these interests and the equity interest in Armadillo Holdings 1Limited and Armadillo Holdings 2 Limited amounts to £4.2 million and £2.2 million respectively. We haveperformed audit procedures on all balances and transactions material to these entities for the purposes ofsupporting the Group audit opinion.
The Group audit team continued to follow a programme of planned site visits during March 2016. At each sitevisited we undertook an inventory count, performed design and implementation testing of key controls, verified asample of fixed assets and occupancy data, agreed cash balances to bank reconciliations and held discussionswith key store staff.
Opinion on other matters prescribedby the Companies Act 2006
In our opinion:
> the part of the Directors’ Remuneration Report to be audited has been properly prepared in accordance withthe Companies Act 2006; and
> the information given in the Strategic Report and the Directors’ Report for the financial year for which thefinancial statements are prepared is consistent with the financial statements.
Matters on which we are required toreport by exception
Adequacy of explanations receivedand accounting records
Under the Companies Act 2006 we are required to report to you if, in our opinion:
> we have not received all the information and explanations we require for our audit; or> adequate accounting records have not been kept by the parent Company, or returns adequate for our audit
have not been received from branches not visited by us; or> the parent Company financial statements are not in agreement with the accounting records and returns.
We have nothing to report in respect of these matters.
Directors’ remuneration Under the Companies Act 2006 we are also required to report if in our opinion certain disclosures of Directors’remuneration have not been made or the part of the Directors’ Remuneration Report to be audited is not inagreement with the accounting records and returns. We have nothing to report arising from these matters.
Corporate Governance Statement Under the Listing Rules we are also required to review part of the Corporate Governance Statement relating to theCompany’s compliance with certain provisions of the UK Corporate Governance Code. We have nothing to reportarising from our review.
Our duty to read other information inthe Annual Report
Under International Standards on Auditing (UK and Ireland), we are required to report to you if, in our opinion,information in the Annual Report is:
> materially inconsistent with the information in the audited financial statements; or> apparently materially incorrect based on, or materially inconsistent with, our knowledge of the Group acquired
in the course of performing our audit; or> otherwise misleading.
In particular, we are required to consider whether we have identified any inconsistencies between our knowledgeacquired during the audit and the Directors’ statement that they consider the Annual Report is fair, balanced andunderstandable and whether the Annual Report appropriately discloses those matters that we communicated tothe audit committee which we consider should have been disclosed. We confirm that we have not identified anysuch inconsistencies or misleading statements.
Independent auditor’s report to the members of Big Yellow Group PLC (continued)
88
Investment property valuation
Matters on which we are required toreport by exception (continued)
Respective responsibilities ofDirectors and auditor
As explained more fully in the Directors’ Responsibilities Statement, the Directors are responsible for thepreparation of the financial statements and for being satisfied that they give a true and fair view. Our responsibilityis to audit and express an opinion on the financial statements in accordance with applicable law and InternationalStandards on Auditing (UK and Ireland). We also comply with International Standard on Quality Control 1 (UK andIreland). Our audit methodology and tools aim to ensure that our quality control procedures are effective,understood and applied. Our quality controls and systems include our dedicated professional standards reviewteam and independent partner reviews.
This report is made solely to the Company’s members, as a body, in accordance with Chapter 3 of Part 16 of theCompanies Act 2006. Our audit work has been undertaken so that we might state to the Company’s membersthose matters we are required to state to them in an auditor’s report and for no other purpose. To the fullest extentpermitted by law, we do not accept or assume responsibility to anyone other than the Company and theCompany’s members as a body, for our audit work, for this report, or for the opinions we have formed.
Scope of the audit of the financialstatements
An audit involves obtaining evidence about the amounts and disclosures in the financial statements sufficient togive reasonable assurance that the financial statements are free from material misstatement, whether caused byfraud or error. This includes an assessment of: whether the accounting policies are appropriate to the Group’s andthe parent Company’s circumstances and have been consistently applied and adequately disclosed; thereasonableness of significant accounting estimates made by the Directors; and the overall presentation of thefinancial statements. In addition, we read all the financial and non-financial information in the Annual Report toidentify material inconsistencies with the audited financial statements and to identify any information that isapparently materially incorrect based on, or materially inconsistent with, the knowledge acquired by us in thecourse of performing the audit. If we become aware of any apparent material misstatements or inconsistencies weconsider the implications for our report.
Darren Longley FCA (Senior Statutory Auditor)for and on behalf of Deloitte LLPChartered Accountants and Statutory AuditorReading, United Kingdom23 May 2016

89
Consolidated Statement of Comprehensive IncomeYear ended 31 March 2016
2016 2015Note £000 £000
Revenue 3 101,382 84,276Cost of sales (32,632) (27,351)
Gross profit 68,750 56,925Administrative expenses (8,896) (8,505)
Operating profit before gains on property assets 59,854 48,420Gain on the revaluation of investment properties 13a,14 58,001 64,465Profit on disposal of surplus land 15 4,754 1,318
Operating profit 122,609 114,203Share of profit of associates 13d 1,104 3,516Investment income 7 403 495Finance costs – interest payable 8 (11,866) (10,704) – fair value movement of derivatives 8, 18 (4) (2,274)
Profit before taxation 112,246 105,236Taxation 9 (247) 351
Profit for the year (attributable to equity shareholders) 5 111,999 105,587
Total comprehensive income for the year (attributable to equity shareholders) 111,999 105,587
Basic earnings per share 12 71.9p 72.5p
Diluted earnings per share 12 71.6p 71.9p
EPRA earnings per share are shown in Note 12.
All items in the consolidated statement of comprehensive income relate to continuing operations.
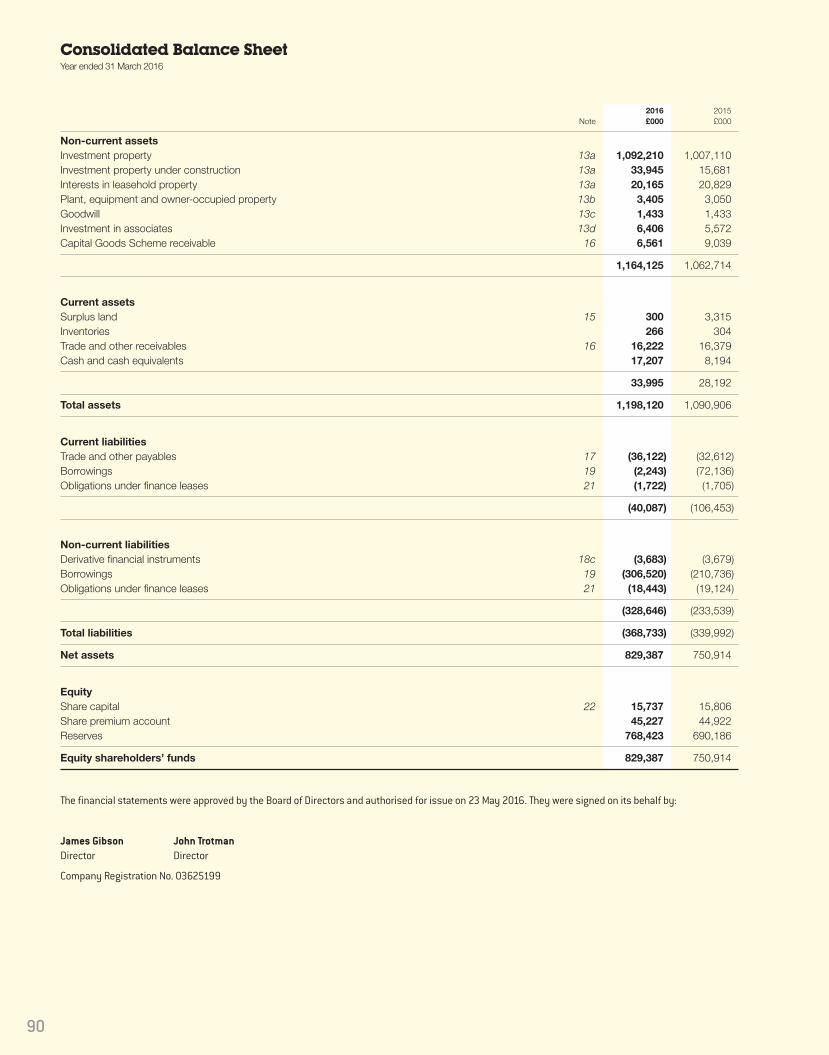
Consolidated Balance SheetYear ended 31 March 2016
90
2016 2015Note £000 £000
Non-current assetsInvestment property 13a 1,092,210 1,007,110Investment property under construction 13a 33,945 15,681Interests in leasehold property 13a 20,165 20,829Plant, equipment and owner-occupied property 13b 3,405 3,050Goodwill 13c 1,433 1,433Investment in associates 13d 6,406 5,572Capital Goods Scheme receivable 16 6,561 9,039
1,164,125 1,062,714
Current assetsSurplus land 15 300 3,315Inventories 266 304Trade and other receivables 16 16,222 16,379Cash and cash equivalents 17,207 8,194
33,995 28,192
Total assets 1,198,120 1,090,906
Current liabilitiesTrade and other payables 17 (36,122) (32,612)Borrowings 19 (2,243) (72,136)Obligations under finance leases 21 (1,722) (1,705)
(40,087) (106,453)
Non-current liabilitiesDerivative financial instruments 18c (3,683) (3,679)Borrowings 19 (306,520) (210,736)Obligations under finance leases 21 (18,443) (19,124)
(328,646) (233,539)
Total liabilities (368,733) (339,992)
Net assets 829,387 750,914
EquityShare capital 22 15,737 15,806Share premium account 45,227 44,922Reserves 768,423 690,186
Equity shareholders’ funds 829,387 750,914
The financial statements were approved by the Board of Directors and authorised for issue on 23 May 2016. They were signed on its behalf by:
James Gibson John TrotmanDirector Director
Company Registration No. 03625199

91
Consolidated Statement of Changes in EquityYear ended 31 March 2016
Share Other non- CapitalShare premium distributable redemption Retained Owncapital account reserve reserve earnings shares Total£000 £000 £000 £000 £000 £000 £000
At 1 April 2015 15,806 44,922 74,950 1,653 619,206 (5,623) 750,914Total comprehensive gain for the year – – – – 111,999 111,999Issue of share capital 73 305 – – – – 378Cancellation of treasury shares (142) – – 142 (3,727) 3,727 –Use of own shares to satisfy share options – – – – (877) 877Dividend – – – – (36,443) – (36,443)Credit to equity for equity-settled share based payments – – – – 2,539 – 2,539
At 31 March 2016 15,737 45,227 74,950 1,795 692,697 (1,019) 829,387
Year ended 31 March 2015
Share Other non- CapitalShare premium distributable redemption Retained Owncapital account reserve reserve earnings shares Total£000 £000 £000 £000 £000 £000 £000
At 1 April 2014 14,306 44,278 – 1,653 539,450 (5,623) 594,064Total comprehensive gain for the year – – – – 105,587 – 105,587Issue of share capital 1,500 644 74,950 – – 77,094Dividend – – – – (27,890) – (27,890)Credit to equity for equity-settled share based payments – – – – 2,059 – 2,059
At 31 March 2015 15,806 44,922 74,950 1,653 619,206 (5,623) 750,914
The other non-distributable reserve arose in the year ended 31 March 2015 following the placing of 14.35 million ordinary shares.

Consolidated Cash Flow StatementYear ended 31 March 2016
92
2016 2015Note £000 £000
Operating profit 122,609 114,203Gain on the revaluation of investment properties 13a, 14 (58,001) (64,465)Profit on disposal of surplus land 15 (4,754) (1,318)Depreciation 13b 663 566Depreciation of finance lease capital obligations 13a 967 918Employee share options 6 2,539 2,059Decrease/(increase) in inventories 38 (14)Decrease/(increase) in receivables 369 (1,172)Increase in payables 1,785 1,098
Cash generated from operations 66,215 51,875Interest paid (10,763) (9,692)Interest received 15 27Tax credit received – 187
Cash flows from operating activities 55,467 42,397
Investing activitiesSale of surplus land 7,835 2,815Purchase of non-current assets (44,509) (42,555)Additions to surplus land (66) (231)Receipts from Capital Goods Scheme 184 3,557Acquisition of Big Yellow Limited Partnership (net of cash acquired) – (37,406)Acquisition of Big Storage Limited – (15,114)Disposal of Big Storage Limited – 7,614Net investment in associates 13d – (3,709)Dividend received from associates 13d 270 89
Cash flows from investing activities (36,286) (84,940)
Financing activitiesIssue of share capital 378 77,094Payment of finance lease liabilities 13a (967) (918)Equity dividends paid 11 (36,443) (27,890)Payments to cancel interest rate derivatives – (1,408)Refinancing fees – (2,649)Drawing of M&G loan 70,000 –(Repayment)/borrowing of Lloyds short term loan (70,000) 70,000Repayment of Big Yellow Limited Partnership loan – (57,000)Repayment of Big Storage AIB loan – (9,659)Drawing of Big Storage Lloyds loan – 13,900Increase/(decrease) in borrowings 26,864 (14,034)
Cash flows from financing activities (10,168) 47,436
Net increase in cash and cash equivalents 9,013 4,893Opening cash and cash equivalents 8,194 3,301
Closing cash and cash equivalents 17,207 8,194
Reconciliation of Net Cash Flow to Movement in Net DebtYear ended 31 March 2016
2016 2015Note £000 £000
Net increase in cash and cash equivalents in the year 9,013 4,893Cash flow from increase in debt financing (26,864) (55,966)
Change in net debt resulting from cash flows (17,851) (51,073)
Movement in net debt in the year (17,851) (51,073)Net debt at the start of the year (277,140) (226,067)
Net debt at the end of the year 18 (294,991) (277,140)

93
1. GENERAL INFORMATIONBig Yellow Group PLC is a Company incorporated in the United Kingdom under the Companies Act 2006. The address of the registered office is 2 The Deans,Bridge Road, Bagshot, Surrey, GU19 5AT. The nature of the Group’s operations and its principal activities are set out in note 4 and in the Strategic Reporton pages 14 to 19.
2. SIGNIFICANT ACCOUNTING POLICIESBasis of preparation of financial statementsThe financial statements have been prepared in accordance with International Financial Reporting Standards (“IFRS”) as adopted for use in the EuropeanUnion in accordance with EU law (IAS regulation EC1606/2002) and those parts of the Companies Act 2006 applicable to companies reporting under IFRS,and therefore the Group financial statements comply with Article 4 of the EU IAS Regulation.
The financial statements are presented in Sterling, being the currency of the primary economic environment in which the Group operates. Unless otherwisestated, figures are rounded to the nearest thousand.
The accounting policies adopted are consistent with those of the previous financial year, except as described in the following sections.
The following new and revised Standards and Interpretations have been adopted in the current year, but have not had a material impact on the Group:
Annual Improvements to IFRSs: 2010-2012 Annual Improvements to IFRSs
Annual Improvements to IFRSs: 2011-2013 Annual Improvements to IFRSs
New and revised IFRSs in issue but not yet effectiveAt the date of authorisation of these financial statements, the Group has not applied the following new and revised IFRSs that have been issued but arenot yet effective and had not yet been adopted by the EU:
IFRS 9 Financial Instruments
IFRS 15 Revenue from Contracts with Customers
IFRS 16 Leases
Amendments to IFRS 11 Accounting for Acquisitions of Interests in Joint Operations
Amendments to IAS 1 Disclosure Initiative
Amendments to IAS 16 and IAS 38 Clarification of Acceptable Methods of Depreciation and Amortisation
Amendments to IAS 16 and IAS 41 Agriculture: Bearer Plants
Amendments to IAS 27 Equity Method in Separate Financial Statements
Amendments to IFRS 10 and IAS 28 Sale or Contribution of Assets between and Investor and its Associate or Joint Venture
Amendments to IFRS 10, IFRS 12 and IAS 28 Investment Entities: Applying the Consolidation Exemption
Annual Improvements to IFRSs: 2012-2014 Annual Improvements to IFRSs
There are no standards and interpretations in issue but not yet adopted which, in the opinion of the Directors, will have a material effect on the reportedincome or net assets of the Group or Company.
Basis of accountingThe financial statements have been prepared on the historical cost basis, except for the revaluation of certain investment properties and financialinstruments. Historical cost is generally based on the fair value of the consideration given in exchange for the assets. The principal accounting policiesadopted, which have been applied consistently to the results, other gains and losses, assets, liabilities and cash flows of entities included in theconsolidated financial statements in the current and preceding year, are set out below:
Going concernA review of the Group’s business activities, together with the factors likely to affect its future development, performance and position are set out on in theStrategic Report. The financial position of the Group, its cash flows, liquidity position and borrowing facilities are shown in the balance sheet, cash flowstatement and accompanying notes to the financial statements. Further information concerning the Group’s objectives, policies and processes for managingits capital; its financial risk management objectives; details of its financial instruments and hedging activities; and its exposures to credit risk and liquidityrisk can be found in the Strategic Report and in the notes to the financial statements.
After reviewing Group and Company cash balances, borrowing facilities, forecast valuation movements and projected cash flows, the Directors believethat the Group and Company have adequate resources to continue operations for the foreseeable future. In reaching this conclusion the Directors havehad regard to the Group’s operating plan and budget for the year ending 31 March 2017 and projections contained in the longer term business plan whichcovers the period to March 2020. The Directors have considered carefully the Group’s trading performance and cash flows as a result of the uncertainglobal economic environment and the other principal risks to the Group’s performance, and are satisfied with the Group’s positioning. For this reason,they continue to adopt the going concern basis in preparing the financial statements.
Notes to the financial statementsYear ended 31 March 2016

94
2. SIGNIFICANT ACCOUNTING POLICIES (continued)Basis of consolidationThe consolidated financial statements incorporate the financial statements of the Company and entities controlled by the Company made up to 31 March eachyear. Control is achieved where the Company has the power to direct the relevant activities of an investee entity so as to obtain benefits from its activities.
The Group consolidates the financial results and balance sheets of Big Yellow Group PLC and all of its subsidiaries at the year end using acquisitionaccounting principles. All intra-Group transactions, balances, income and expenses are eliminated on consolidation. Where necessary, adjustments aremade to the financial statements of subsidiaries to bring the accounting policies used into line with those used by the Group. The results of subsidiariesacquired or disposed of during the year are included in the consolidated statement of comprehensive income from the effective date of acquisition or upto the effective date of disposal, as appropriate.
The acquisition of subsidiaries is accounted for using the purchase method. The cost of the acquisition is measured at the aggregate of the fair values, atthe date of exchange, of assets given, liabilities incurred or assumed, and equity instruments issued by the Group in exchange for control of the acquiree.Any costs directly attributable to the business combination are recognised in the income statement. The acquiree’s identifiable assets, liabilities andcontingent liabilities that meet the conditions for recognition under IFRS 3 are recognised at their fair value at the acquisition date, except for non-currentassets (or disposal groups) that are classified as held for sale in accordance with IFRS 5 Non-Current Assets Held for Sale and Discontinued Operations,which are recognised and measured at the lower of their carrying amount and fair value less costs to sell.
Goodwill arising on acquisition is recognised as an asset and initially measured at cost, being the excess of the cost of the business combination overthe Group’s interest in the net fair value of the identifiable assets, liabilities and contingent liabilities recognised. If, after reassessment, the Group’s interestin the net fair value of the acquiree’s identifiable assets, liabilities and contingent liabilities exceeds the cost of the business combination, the excess isrecognised immediately in the statement of comprehensive income.
Investment in subsidiariesThese are recognised at cost less provision for any impairment.
Investment in associatesAn associate is an entity over which the Group is in a position to exercise significant influence, but not control or joint control, through participation in thefinancial and operating policy decisions of the investee. Significant influence is the power to participate in the financial and operating policy decisions ofthe investee but is not control or joint control over those policies.
The results and assets and liabilities of associates are incorporated in these financial statements using the equity method of accounting except whenclassified as held for sale. Investments in associates are carried in the balance sheet at cost as adjusted by post-acquisition changes in the Group’s shareof the net assets of the associate, less any impairment in the value of individual investments. Losses of an associate in excess of the Group’s interest inthat associate (which includes any long-term interests that, in substance, form part of the Group’s net investment in the associate) are recognised onlyto the extent that the Group has incurred legal or constructive obligations or made payments on behalf of the associate. Where necessary, adjustmentsare made to the financial statements of associates to bring the accounting policies used into line with those used by the Group.
Where a Group Company transacts with an associate of the Group, profits and losses are eliminated to the extent of the Group’s interest in the relevantassociate. Losses may provide evidence of an impairment of the asset transferred in which case appropriate provision is made for impairment.
GoodwillGoodwill arising on consolidation represents the excess of the cost of acquisition over the Group’s interest in the fair value of the identifiable assets andliabilities of a subsidiary at the date of acquisition.
Goodwill is recognised as an asset and reviewed for impairment at least annually. Any impairment is recognised immediately in the statement ofcomprehensive income and is not subsequently reversed. The goodwill in the balance sheet has an indefinite useful economic life.
Revenue recognitionRevenue represents amounts derived from the provision of services which fall within the Group’s ordinary activities after deduction of trade discountsand any applicable value added tax. Income is recognised over the period for which the storage room is occupied by the customer on a straight-line basis.The Group recognises non-storage income on a straight-line basis over the period in which it is earned.
Interest income is accrued on a time basis, by reference to the principal outstanding and the effective interest rate applicable, which is the rate thatexactly discounts estimated future cash receipts through the expected life of the financial asset to that asset’s net carrying amount.
Management fees earned are recognised on a straight-line basis over the period for which the services are provided. Fees earned from associates arerecognised in full in the income statement through revenue with the proportionate debit shown in the share of profit of associate.
Operating leases Rentals payable under operating leases are charged to the statement of comprehensive income on a straight-line basis over the term of the relevant lease.In the event that lease incentives are received to enter into operating leases, such incentives are recognised as a liability. The aggregate benefit ofincentives is recognised as a reduction of rental expense on a straight-line basis, except where another systematic basis is more representative of thetime pattern in which economic benefits from the leased asset are consumed.
Rental income from operating leases is recognised on a straight-line basis over the term of the relevant lease.
Notes to the Financial Statements (continued)Year ended 31 March 2016

95
2. SIGNIFICANT ACCOUNTING POLICIES (continued)BorrowingsInterest-bearing loans and overdrafts are recorded at the proceeds received, net of direct issue costs. Premiums payable on settlement or redemptionand direct issue costs are accounted for on an accruals basis in the statement of comprehensive income using the effective interest rate method andare added to the carrying value amount of the instrument to the extent that they are not settled in the period in which they arise.
Finance costsAll borrowing costs are recognised in the statement of comprehensive income in the period in which they are incurred, unless the costs are incurred aspart of the development of a qualifying asset, when they will be capitalised. Commencement of capitalisation is the date when the Group incurs expenditurefor the qualifying asset, incurs borrowing costs and undertakes activities that are necessary to prepare the assets for their intended use when it isprobable that they will result in future economic benefits to the entity and the costs can be measured reliably. In the case of suspension of activitiesduring extended periods, the Group suspends capitalisation. The Group ceases capitalisation of borrowing costs when substantially all of the activitiesnecessary to prepare the asset for use are complete.
Operating profitOperating profit is stated after gains and losses on surplus land, movements on the revaluation of investment properties and before the share of resultsof associates, investment income and finance costs.
TaxationThe tax expense represents the sum of the tax currently payable and deferred tax.
The tax currently payable is based on taxable profit for the year. Taxable profit differs from the net profit as reported in the statement of comprehensiveincome because it excludes items of income or expense that are taxable or deductible in other years and it further excludes items that are never taxableor deductible. The Group’s liability for current tax is calculated using tax rates that have been enacted or substantively enacted by the balance sheet date.
Deferred tax is the tax expected to be payable or recoverable on differences between the carrying amounts of assets and liabilities in the financialstatements and the corresponding tax bases used in the computation of taxable profit, and is accounted for using the balance sheet liability method.Deferred tax liabilities are generally recognised for all taxable temporary differences and deferred tax assets are recognised to the extent that it is probablethat taxable profits will be available against which deductible temporary differences can be utilised. Such assets and liabilities are not recognised if thetemporary differences arise from goodwill or from the initial recognition (other than in a business combination) of other assets and liabilities in a transactionthat affects neither the tax profit nor the accounting profit.
Deferred tax liabilities are recognised for taxable temporary differences arising on investments in subsidiaries and associates except where the Group isable to control the reversal of the temporary difference and it is probable that the temporary difference will not reverse in the foreseeable future.
The carrying amount of deferred tax assets is reviewed at each balance sheet date and reduced to the extent that it is no longer probable that sufficienttaxable profits will be available to allow all or part of the asset to be recovered.
Deferred tax is calculated at the tax rates substantively enacted at the balance sheet date that are expected to apply in the period when the liability issettled or the asset is realised. Deferred tax is charged or credited in the statement of comprehensive income, except when it relates to items charged orcredited directly to equity, in which case the deferred tax is also dealt with in equity.
Deferred tax assets and liabilities are offset when there is a legally enforceable right to set off current tax assets against current tax liabilities and whenthey relate to income taxes levied by the same taxation authority and the Group intends to settle its current tax assets and liabilities on a net basis.
Plant, equipment and owner occupied propertyAll property, plant and equipment, not classified as investment property, is carried at historic cost less depreciation and any recognised impairment loss.
Depreciation is charged so as to write off the cost or valuation of assets, other than land and investment properties, over their estimated useful lives,using the straight-line method, on the following bases:
Freehold property 50 years
Leasehold improvements Over period of the lease
Plant and machinery 10 years
Motor vehicles 4 years
Fixtures and fittings 5 years
Computer equipment 3 to 5 years
The gain or loss arising on the disposal or retirement of an asset is determined as the difference between the sales proceeds and the carrying amount ofthe asset and is recognised in income.
96
2. SIGNIFICANT ACCOUNTING POLICIES (continued)Investment propertyThe criteria used to distinguish investment property from owner-occupied property is to consider whether the property is held for rental income and forcapital appreciation. Where this is the case, the Group recognises these owned or leased properties as investment properties. Investment property isinitially recognised at cost and revalued at the balance sheet date to fair value as determined by professionally qualified external valuers. In accordancewith IAS 40, investment property held as a leasehold is stated gross of the recognised finance lease liability.
Gains or losses arising from the changes in fair value of investment property are included in the statement of comprehensive income of the period inwhich they arise. In accordance with IAS 40, as the Group uses the fair value model, no depreciation is provided in respect of investment propertiesincluding integral plant.
Leasehold properties that are leased under operating leases are classified as investment properties and included in the balance sheet at fair value. Theobligation to the lessor for the buildings element of the leasehold is included in the balance sheet at the present value of the minimum lease paymentsat inception, and is shown within note 21. Lease payments are apportioned between finance charges and a reduction of the outstanding lease obligationso as to achieve a constant rate of interest on the remaining balance of the liability.
Investment property under constructionInvestment property under construction is initially recognised at cost and revalued at the balance sheet date to fair value as determined by professionallyqualified external valuers.
Gains or losses arising from the changes in fair value of investment property under construction are included in the statement of comprehensive incomein the period in which they arise.
Surplus landSurplus land, which can include assets held for development and future sale, is recognised at the lower of cost and net realisable value. Any gains andlosses on surplus land are recognised through the statement of comprehensive income.
Impairment of assetsAt each balance sheet date, the Group reviews the carrying amounts of its assets to determine whether there is any indication that those assets havesuffered an impairment loss. If any such indication exists, the recoverable amount of the asset is estimated in order to determine the extent of theimpairment loss (if any). The recoverable amount is the higher of an asset’s net selling price and its value-in-use (i.e. the net present value of its futurecash flows discounted at the Group’s average pre-tax interest rate that reflects the borrowing costs and risk for the asset).
InventoriesInventories, representing the cost of packing materials, are stated at the lower of cost and net realisable value.
Financial instrumentsFinancial assets and financial liabilities are recognised on the Group’s balance sheet when the Group becomes a party to the contractual provisions ofthe instrument. Financial assets at FVTPL are stated at fair value, with any gains or losses arising on re-measurement recognised in profit or loss. The net gain or loss recognised in profit or loss incorporates any dividend or interest earned on the financial asset and is included in the ‘other gains andlosses’ line item in the income statement.
A – Derivative financial instruments and hedge accountingThe Group’s activities expose it primarily to the financial risks of interest rates. The Group uses interest rate swap contracts to hedge these exposures.The Group does not use derivative financial instruments for speculative purposes. The use of financial derivatives is governed by the Group’s policiesapproved by the Board of Directors. The policy in respect of interest rates is to maintain a balance between flexibility and the hedging of interest rate risk.
Derivatives are initially recognised at fair value and are subsequently reviewed at each balance sheet date. The fair value of interest rate derivatives at thereporting date is determined by discounting the future cash flows using the forward curves at the reporting date and the credit risk inherent in the contract.
Changes in the fair value of derivative financial instruments are recognised in the statement of comprehensive income as they arise. The Group has notadopted hedge accounting. Derivatives embedded in other financial instruments or other host contracts are treated as separate derivatives when theirrisks and characteristics are not closely related to those of host contracts and the host contracts are not carried at fair value with unrealised gains orlosses reported in the statement of comprehensive income.
B – Loans and receivablesTrade receivables, loans, and other receivables that have fixed or determinable payments that are not quoted in an active market are classified as loansand receivables. Loans and receivables are measured at amortised cost using the effective interest method, less any impairment. Interest income isrecognised by applying the effective interest rate, except for short-term receivables when the recognition of interest would be immaterial.
Notes to the Financial Statements (continued)Year ended 31 March 2016

97
2. SIGNIFICANT ACCOUNTING POLICIES (continued)C – Impairment of financial assetsFinancial assets are assessed for indicators of impairment at each balance sheet date. Financial assets are impaired where there is objective evidencethat, as a result of one or more events that occurred after the initial recognition of the financial asset, the estimated future cash flows of the investmenthave been impacted. The carrying amount of the financial asset is reduced by the impairment loss directly for all financial assets with the exception oftrade receivables, where the carrying amount is reduced through the use of an allowance account. When a trade receivable is considered uncollectible,it is written off against the allowance account. Subsequent recoveries of amounts previously written off are credited against the allowance account.Changes in the carrying amount of the allowance account are recognised in profit or loss.
D – Cash and cash equivalentsCash and cash equivalents comprises cash on hand and demand deposits, and other short term highly liquid investments that are readily convertible toa known amount of cash and are subject to an insignificant risk of changes in value. The carrying amounts of these assets approximates to the fair value.
E – Financial liabilities and equityFinancial liabilities and equity instruments are classified according to the substance of the contractual arrangements entered into.
F – Equity instrumentsEquity instruments issued by the Company are recorded at the proceeds received, net of direct issue costs.
G – Trade payablesTrade payables are not interest bearing and are stated at their nominal value.
Retirement benefit costsPension costs represent contributions payable to defined contribution schemes and are charged as an expense to the statement of comprehensive incomeas they fall due. The assets of the schemes are held separately from those of the Group.
Share-based paymentsThe Group issues equity-settled share-based payments to certain employees. These are measured at fair value at the date of grant. The fair valuedetermined at the grant date of the share-based payment is expensed on a straight-line basis over the vesting period, based on the Group’s estimate ofshares that will eventually vest.
Fair value is measured by use of the Black-Scholes model and excludes the effect of non-market based vesting conditions. The expected life used in themodel has been adjusted, based on management’s best estimate, for the effects of non-transferability, exercise restrictions, and behavioural considerations.At each balance sheet date, the Group revises its estimate of the number of equity instruments expected to vest as a result of the effect of non-marketbased vesting conditions. The impact of the revision of the original estimates, if any, is recovered in profit and loss such that the cumulative expensesreflects the revised estimate with a corresponding adjustment to equity reserves.
For cash-settled share-based payments, a liability is recognised for the goods or services acquired, measured initially at the fair value of the liability. At each balance sheet date until the liability is settled, and at the date of settlement, the fair value of the liability is re-measured, with any changes in fairvalue recognised in profit or loss for the year.
Critical accounting estimates and judgementsIn the application of the Group’s accounting policies, which are described above, the Directors are required to make judgements, estimates and assumptionsabout the carrying amounts of assets and liabilities that are not readily apparent from other sources. The estimates and associated assumptions arebased on historical experience and other factors that are considered to be relevant. Actual results may differ from these estimates.
The estimates and underlying assumptions are reviewed on an ongoing basis. Revisions to accounting estimates are recognised in the period in whichthe estimate is revised if the revision affects only that period, or in the period of the revision and future periods if the revision affects both current andfuture periods.
Estimate of fair value of Investment Properties and Investment Property Under Construction (critical accounting estimate)The Group’s self storage centres and stores under development are valued using a discounted cash flow methodology which is based on projections ofnet operating income. The Group employs expert external valuers, Cushman & Wakefield LLP, who report on the values of the Group’s stores on an annualbasis. The stores within the Armadillo Partnerships are valued by Jones Lang LaSalle. Principal assumptions underlying the estimation of the fair valueare those related to: stabilised occupancy levels; the absorption period to these stabilised levels; expected future growth in storage rents, ancillary incomeand operating costs; maintenance requirements; capitalisation rates and discount rates. A more detailed explanation of the background and methodologyadopted in the valuation of the Group’s investment properties is set out in note 14 to the accounts.
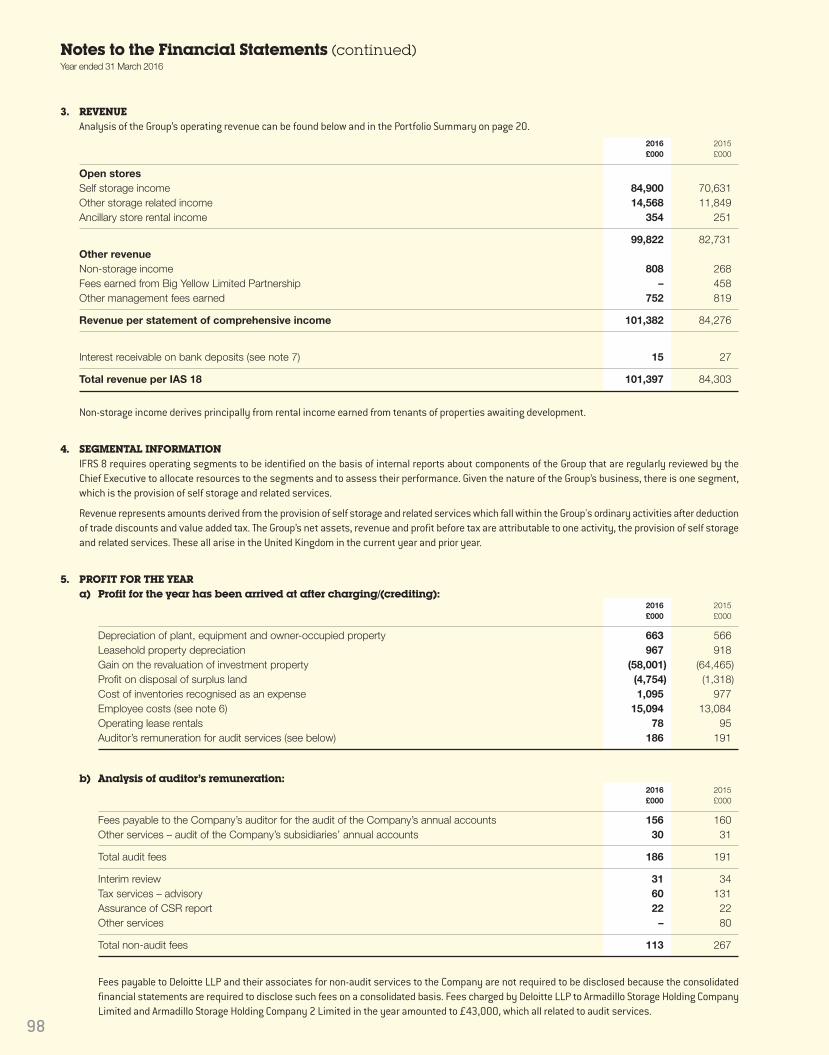
98
Notes to the Financial Statements (continued)Year ended 31 March 2016
3. REVENUEAnalysis of the Group’s operating revenue can be found below and in the Portfolio Summary on page 20.
2016 2015£000 £000
Open storesSelf storage income 84,900 70,631Other storage related income 14,568 11,849Ancillary store rental income 354 251
99,822 82,731Other revenueNon-storage income 808 268Fees earned from Big Yellow Limited Partnership – 458Other management fees earned 752 819
Revenue per statement of comprehensive income 101,382 84,276
Interest receivable on bank deposits (see note 7) 15 27
Total revenue per IAS 18 101,397 84,303
Non-storage income derives principally from rental income earned from tenants of properties awaiting development.
4. SEGMENTAL INFORMATIONIFRS 8 requires operating segments to be identified on the basis of internal reports about components of the Group that are regularly reviewed by theChief Executive to allocate resources to the segments and to assess their performance. Given the nature of the Group’s business, there is one segment,which is the provision of self storage and related services.
Revenue represents amounts derived from the provision of self storage and related services which fall within the Group's ordinary activities after deductionof trade discounts and value added tax. The Group’s net assets, revenue and profit before tax are attributable to one activity, the provision of self storageand related services. These all arise in the United Kingdom in the current year and prior year.
5. PROFIT FOR THE YEARa) Profit for the year has been arrived at after charging/(crediting):
2016 2015£000 £000
Depreciation of plant, equipment and owner-occupied property 663 566Leasehold property depreciation 967 918Gain on the revaluation of investment property (58,001) (64,465)Profit on disposal of surplus land (4,754) (1,318)Cost of inventories recognised as an expense 1,095 977Employee costs (see note 6) 15,094 13,084Operating lease rentals 78 95Auditor’s remuneration for audit services (see below) 186 191
b) Analysis of auditor’s remuneration:2016 2015£000 £000
Fees payable to the Company’s auditor for the audit of the Company’s annual accounts 156 160Other services – audit of the Company’s subsidiaries’ annual accounts 30 31
Total audit fees 186 191
Interim review 31 34Tax services – advisory 60 131Assurance of CSR report 22 22Other services – 80
Total non-audit fees 113 267
Fees payable to Deloitte LLP and their associates for non-audit services to the Company are not required to be disclosed because the consolidatedfinancial statements are required to disclose such fees on a consolidated basis. Fees charged by Deloitte LLP to Armadillo Storage Holding CompanyLimited and Armadillo Storage Holding Company 2 Limited in the year amounted to £43,000, which all related to audit services.

99
6. EMPLOYEE COSTSThe average monthly number of full-time equivalent employees (including Executive Directors) was:
2016 2015Number Number
Sales 271 256Administration 47 44
318 300
At 31 March 2016 the total number of Group employees was 358 (2015: 337).2016 2015£000 £000
Their aggregate remuneration comprised:Wages and salaries 10,443 8,982Social security costs 1,634 1,655Other pension costs 478 388Share-based payments 2,539 2,059
15,094 13,084
Details of Directors’ Remuneration is given on pages 66 to 79.
7. INVESTMENT INCOME2016 2015£000 £000
Bank interest receivable 15 27Unwinding of discount on Capital Goods Scheme receivable 388 468
Total investment income 403 495
8. FINANCE COSTS2016 2015£000 £000
Interest on bank borrowings 11,187 10,080Capitalised interest (247) (399)Interest on obligations under finance leases 926 1,023
Total interest payable 11,866 10,704
Change in fair value of interest rate derivatives 4 2,274
Total finance costs 11,870 12,978
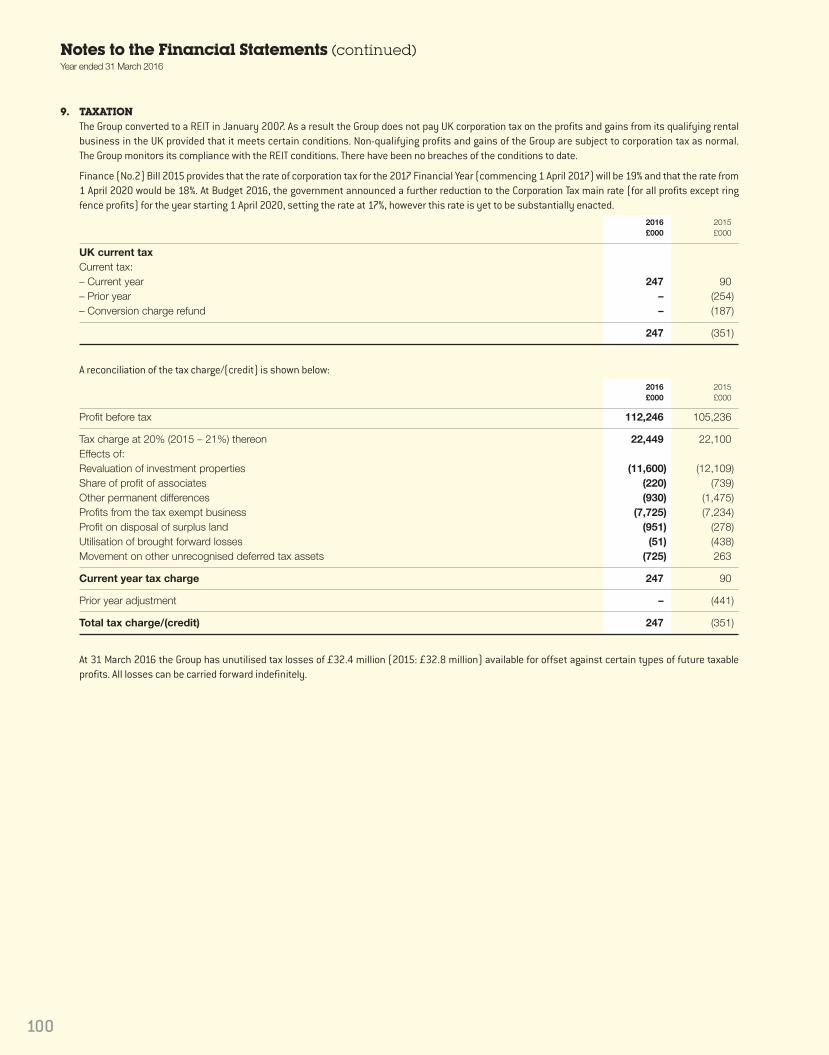
100
Notes to the Financial Statements (continued)Year ended 31 March 2016
9. TAXATIONThe Group converted to a REIT in January 2007. As a result the Group does not pay UK corporation tax on the profits and gains from its qualifying rentalbusiness in the UK provided that it meets certain conditions. Non-qualifying profits and gains of the Group are subject to corporation tax as normal. The Group monitors its compliance with the REIT conditions. There have been no breaches of the conditions to date.
Finance (No.2) Bill 2015 provides that the rate of corporation tax for the 2017 Financial Year (commencing 1 April 2017) will be 19% and that the rate from1 April 2020 would be 18%. At Budget 2016, the government announced a further reduction to the Corporation Tax main rate (for all profits except ringfence profits) for the year starting 1 April 2020, setting the rate at 17%, however this rate is yet to be substantially enacted.
2016 2015£000 £000
UK current taxCurrent tax: – Current year 247 90– Prior year – (254)– Conversion charge refund – (187)
247 (351)
A reconciliation of the tax charge/(credit) is shown below:2016 2015£000 £000
Profit before tax 112,246 105,236
Tax charge at 20% (2015 – 21%) thereon 22,449 22,100Effects of:Revaluation of investment properties (11,600) (12,109)Share of profit of associates (220) (739)Other permanent differences (930) (1,475)Profits from the tax exempt business (7,725) (7,234)Profit on disposal of surplus land (951) (278)Utilisation of brought forward losses (51) (438)Movement on other unrecognised deferred tax assets (725) 263
Current year tax charge 247 90
Prior year adjustment – (441)
Total tax charge/(credit) 247 (351)
At 31 March 2016 the Group has unutilised tax losses of £32.4 million (2015: £32.8 million) available for offset against certain types of future taxableprofits. All losses can be carried forward indefinitely.
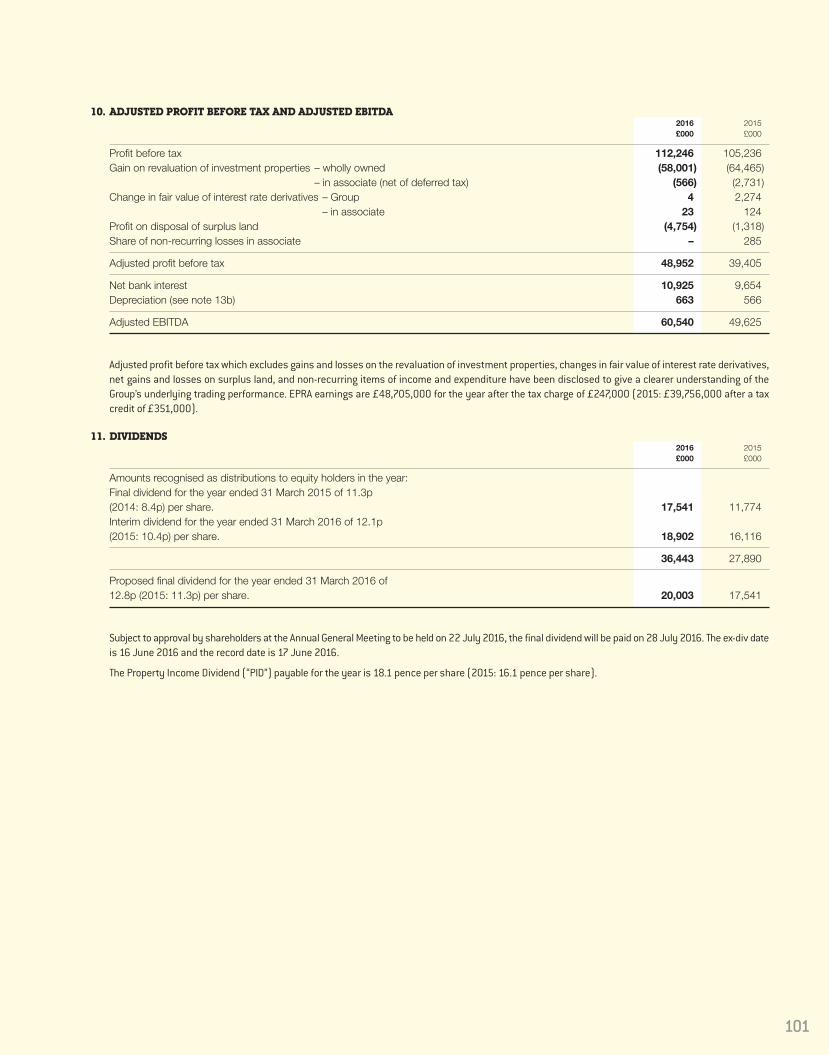
101
10. ADJUSTED PROFIT BEFORE TAX AND ADJUSTED EBITDA2016 2015£000 £000
Profit before tax 112,246 105,236Gain on revaluation of investment properties – wholly owned (58,001) (64,465) – in associate (net of deferred tax) (566) (2,731)Change in fair value of interest rate derivatives – Group 4 2,274 – in associate 23 124Profit on disposal of surplus land (4,754) (1,318)Share of non-recurring losses in associate – 285
Adjusted profit before tax 48,952 39,405
Net bank interest 10,925 9,654Depreciation (see note 13b) 663 566
Adjusted EBITDA 60,540 49,625
Adjusted profit before tax which excludes gains and losses on the revaluation of investment properties, changes in fair value of interest rate derivatives,net gains and losses on surplus land, and non-recurring items of income and expenditure have been disclosed to give a clearer understanding of theGroup’s underlying trading performance. EPRA earnings are £48,705,000 for the year after the tax charge of £247,000 (2015: £39,756,000 after a taxcredit of £351,000).
11. DIVIDENDS2016 2015£000 £000
Amounts recognised as distributions to equity holders in the year:Final dividend for the year ended 31 March 2015 of 11.3p(2014: 8.4p) per share. 17,541 11,774Interim dividend for the year ended 31 March 2016 of 12.1p(2015: 10.4p) per share. 18,902 16,116
36,443 27,890
Proposed final dividend for the year ended 31 March 2016 of 12.8p (2015: 11.3p) per share. 20,003 17,541
Subject to approval by shareholders at the Annual General Meeting to be held on 22 July 2016, the final dividend will be paid on 28 July 2016. The ex-div dateis 16 June 2016 and the record date is 17 June 2016.
The Property Income Dividend (“PID”) payable for the year is 18.1 pence per share (2015: 16.1 pence per share).
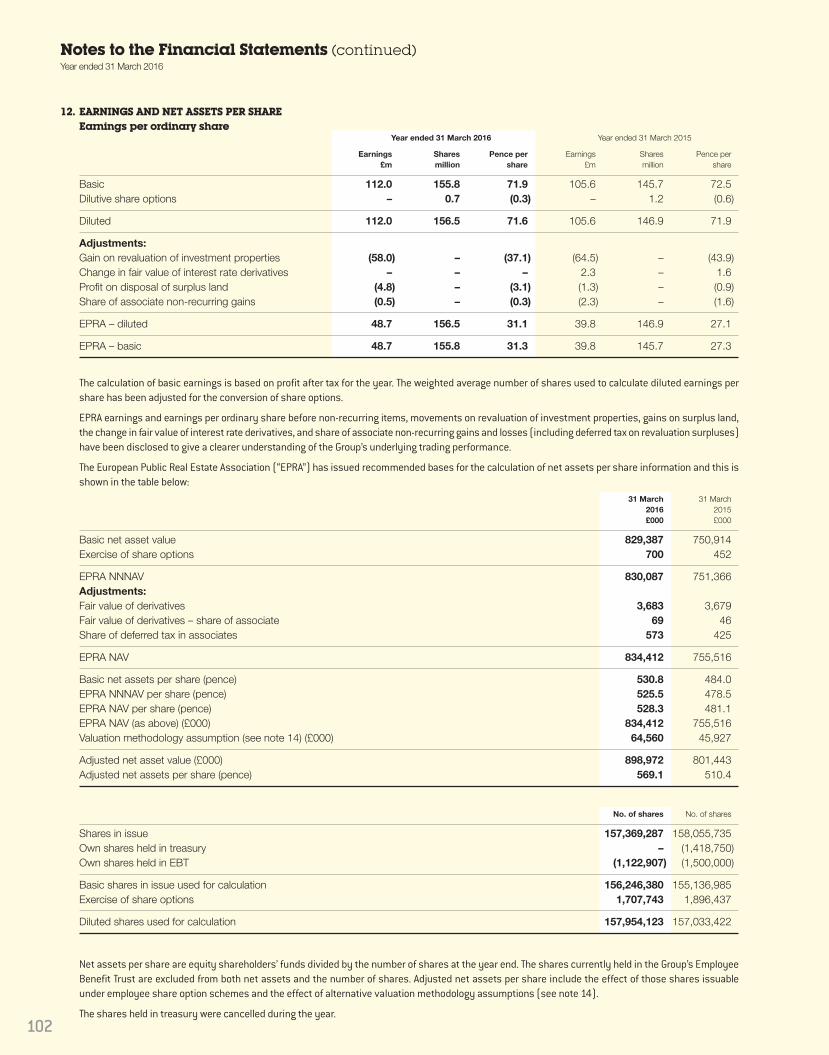
102
Notes to the Financial Statements (continued)Year ended 31 March 2016
12. EARNINGS AND NET ASSETS PER SHAREEarnings per ordinary share Year ended 31 March 2016 Year ended 31 March 2015
Earnings Shares Pence per Earnings Shares Pence per£m million share £m million share
Basic 112.0 155.8 71.9 105.6 145.7 72.5Dilutive share options – 0.7 (0.3) – 1.2 (0.6)
Diluted 112.0 156.5 71.6 105.6 146.9 71.9
Adjustments:Gain on revaluation of investment properties (58.0) – (37.1) (64.5) – (43.9)Change in fair value of interest rate derivatives – – – 2.3 – 1.6Profit on disposal of surplus land (4.8) – (3.1) (1.3) – (0.9)Share of associate non-recurring gains (0.5) – (0.3) (2.3) – (1.6)
EPRA – diluted 48.7 156.5 31.1 39.8 146.9 27.1
EPRA – basic 48.7 155.8 31.3 39.8 145.7 27.3
The calculation of basic earnings is based on profit after tax for the year. The weighted average number of shares used to calculate diluted earnings pershare has been adjusted for the conversion of share options.
EPRA earnings and earnings per ordinary share before non-recurring items, movements on revaluation of investment properties, gains on surplus land,the change in fair value of interest rate derivatives, and share of associate non-recurring gains and losses (including deferred tax on revaluation surpluses)have been disclosed to give a clearer understanding of the Group’s underlying trading performance.
The European Public Real Estate Association (“EPRA”) has issued recommended bases for the calculation of net assets per share information and this isshown in the table below:
31 March 31 March2016 2015£000 £000
Basic net asset value 829,387 750,914Exercise of share options 700 452
EPRA NNNAV 830,087 751,366Adjustments:Fair value of derivatives 3,683 3,679Fair value of derivatives – share of associate 69 46Share of deferred tax in associates 573 425
EPRA NAV 834,412 755,516
Basic net assets per share (pence) 530.8 484.0EPRA NNNAV per share (pence) 525.5 478.5EPRA NAV per share (pence) 528.3 481.1EPRA NAV (as above) (£000) 834,412 755,516Valuation methodology assumption (see note 14) (£000) 64,560 45,927
Adjusted net asset value (£000) 898,972 801,443Adjusted net assets per share (pence) 569.1 510.4
No. of shares No. of shares
Shares in issue 157,369,287 158,055,735Own shares held in treasury – (1,418,750)Own shares held in EBT (1,122,907) (1,500,000)
Basic shares in issue used for calculation 156,246,380 155,136,985Exercise of share options 1,707,743 1,896,437
Diluted shares used for calculation 157,954,123 157,033,422
Net assets per share are equity shareholders’ funds divided by the number of shares at the year end. The shares currently held in the Group’s EmployeeBenefit Trust are excluded from both net assets and the number of shares. Adjusted net assets per share include the effect of those shares issuableunder employee share option schemes and the effect of alternative valuation methodology assumptions (see note 14).
The shares held in treasury were cancelled during the year.
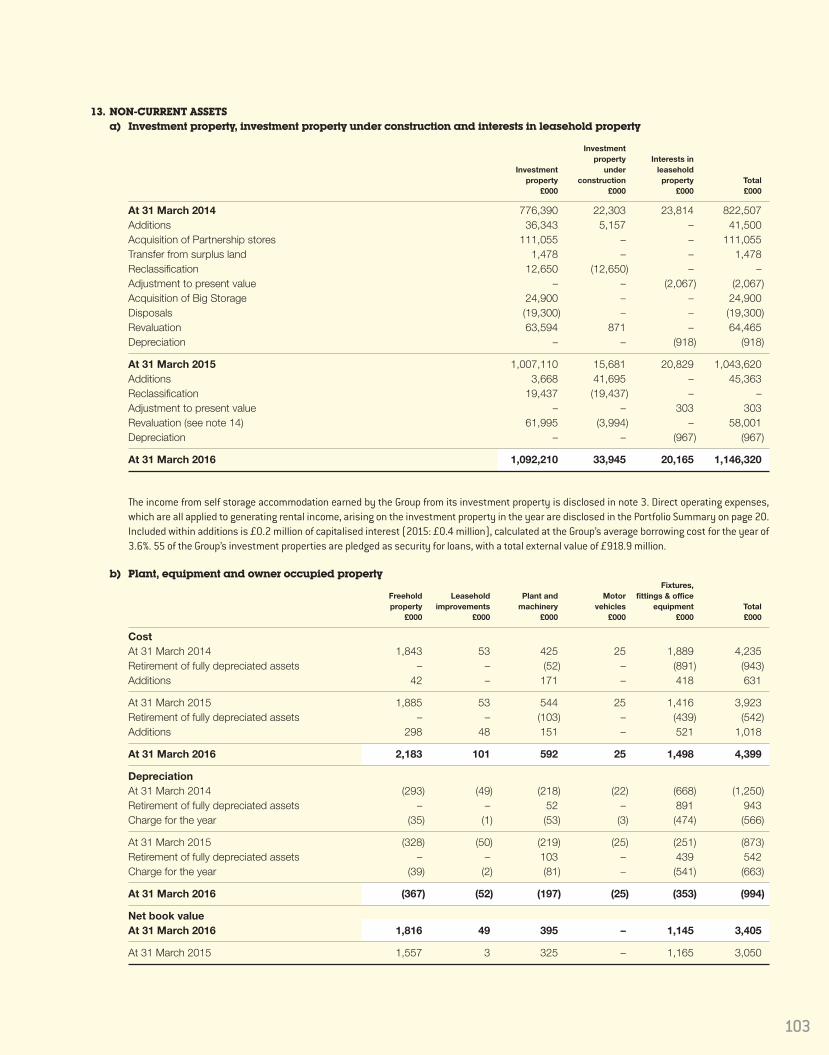
103
13. NON-CURRENT ASSETSa) Investment property, investment property under construction and interests in leasehold property
Investmentproperty Interests in
Investment under leaseholdproperty construction property Total£000 £000 £000 £000
At 31 March 2014 776,390 22,303 23,814 822,507Additions 36,343 5,157 – 41,500Acquisition of Partnership stores 111,055 – – 111,055Transfer from surplus land 1,478 – – 1,478Reclassification 12,650 (12,650) – –Adjustment to present value – – (2,067) (2,067)Acquisition of Big Storage 24,900 – – 24,900Disposals (19,300) – – (19,300)Revaluation 63,594 871 – 64,465Depreciation – – (918) (918)
At 31 March 2015 1,007,110 15,681 20,829 1,043,620Additions 3,668 41,695 – 45,363Reclassification 19,437 (19,437) – –Adjustment to present value – – 303 303Revaluation (see note 14) 61,995 (3,994) – 58,001Depreciation – – (967) (967)
At 31 March 2016 1,092,210 33,945 20,165 1,146,320
The income from self storage accommodation earned by the Group from its investment property is disclosed in note 3. Direct operating expenses,which are all applied to generating rental income, arising on the investment property in the year are disclosed in the Portfolio Summary on page 20.Included within additions is £0.2 million of capitalised interest (2015: £0.4 million), calculated at the Group’s average borrowing cost for the year of3.6%. 55 of the Group’s investment properties are pledged as security for loans, with a total external value of £918.9 million.
b) Plant, equipment and owner occupied propertyFixtures,
Freehold Leasehold Plant and Motor fittings & officeproperty improvements machinery vehicles equipment Total£000 £000 £000 £000 £000 £000
CostAt 31 March 2014 1,843 53 425 25 1,889 4,235Retirement of fully depreciated assets – – (52) – (891) (943)Additions 42 – 171 – 418 631
At 31 March 2015 1,885 53 544 25 1,416 3,923Retirement of fully depreciated assets – – (103) – (439) (542)Additions 298 48 151 – 521 1,018
At 31 March 2016 2,183 101 592 25 1,498 4,399
DepreciationAt 31 March 2014 (293) (49) (218) (22) (668) (1,250)Retirement of fully depreciated assets – – 52 – 891 943Charge for the year (35) (1) (53) (3) (474) (566)
At 31 March 2015 (328) (50) (219) (25) (251) (873)Retirement of fully depreciated assets – – 103 – 439 542Charge for the year (39) (2) (81) – (541) (663)
At 31 March 2016 (367) (52) (197) (25) (353) (994)
Net book valueAt 31 March 2016 1,816 49 395 – 1,145 3,405
At 31 March 2015 1,557 3 325 – 1,165 3,050

104
Notes to the Financial Statements (continued)Year ended 31 March 2016
13. NON-CURRENT ASSETS (continued)c) Goodwill
The goodwill relates to the purchase of Big Yellow Self Storage Company Limited in 1999. The asset is tested bi-annually for impairment. The carryingvalue remains unchanged from the prior year as there is considered to be no impairment in the value of the asset.
d) Investment in associates
Armadillo The Group has a 20% interest in Armadillo Storage Holding Company Limited (“Armadillo 1”) and a 20% interest in Armadillo Storage Holding Company2 Limited (“Armadillo 2”). Both interests are accounted for as associates, using the equity method of accounting. Armadillo 1 Armadillo 2
31 March 31 March 31 March 31 March2016 2015 2016 2015£000 £000 £000 £000
At the beginning of the year 3,638 – 1,934 –Subscription for partnership capital and advances – 3,648 – 1,789Part disposal of Partnership interest – (1,728) – –Share of results (see below) 718 1,807 386 145Dividends (183) (89) (87) –
4,173 3,638 2,233 1,934
The Group’s total subscription for partnership capital and advances in Armadillo Storage Holding Company Limited is £1,920,000 and £1,789,000 inArmadillo Storage Holding Company 2 Limited.
The investment properties owned by Armadillo 1 and Armadillo 2 have been valued at 31 March 2016 by Jones Lang LaSalle.
Big Yellow Limited Partnership At the start of the prior year the Group had a 33.3% interest in Big Yellow Limited Partnership. This interest was accounted for as an associate, usingequity accounting. On 1 December 2014, the Group acquired the remaining 66.7% of the Partnership interest that it did not previously own. From thisdate, the Partnership is accounted for as a wholly owned subsidiary of the Group. The results up to this date are shown in the note below:
31 March 31 March2016 2015£000 £000
At the beginning of the period – 17,861Share of results – 1,564Acquisition of remaining interest – (19,425)
At the end of the period – –
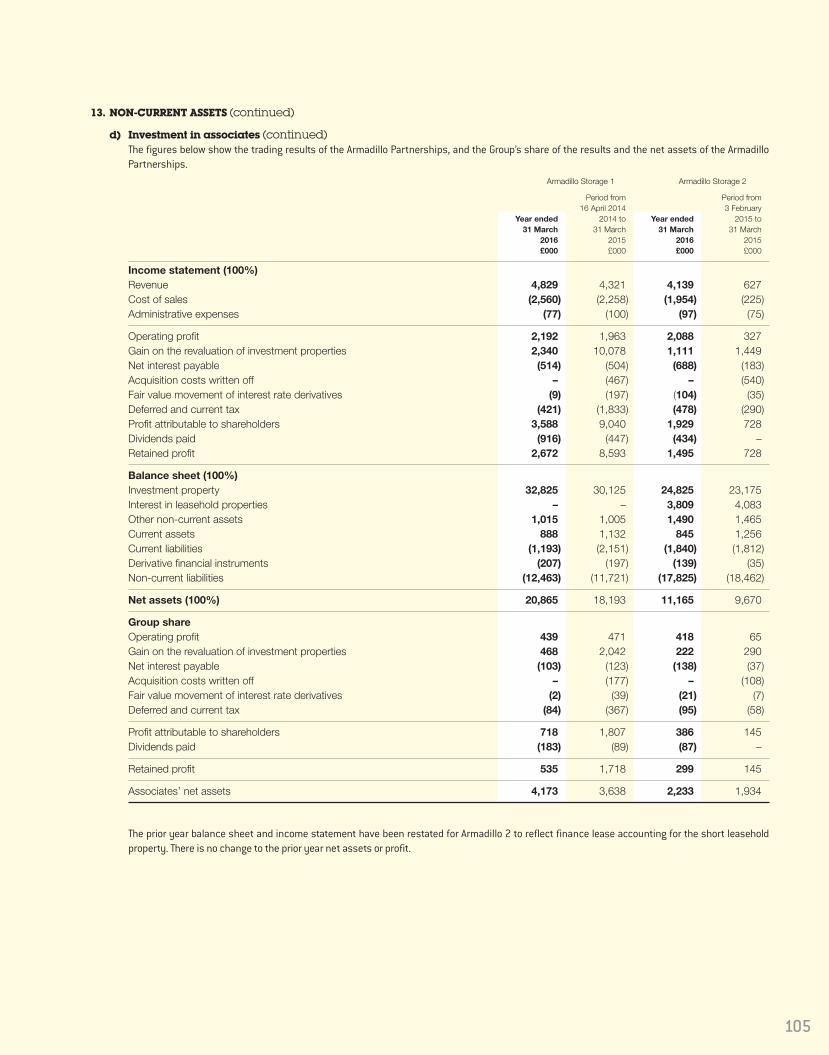
105
13. NON-CURRENT ASSETS (continued)
d) Investment in associates (continued)The figures below show the trading results of the Armadillo Partnerships, and the Group’s share of the results and the net assets of the ArmadilloPartnerships. Armadillo Storage 1 Armadillo Storage 2
Period from Period from16 April 2014 3 February
Year ended 2014 to Year ended 2015 to31 March 31 March 31 March 31 March
2016 2015 2016 2015£000 £000 £000 £000
Income statement (100%)Revenue 4,829 4,321 4,139 627Cost of sales (2,560) (2,258) (1,954) (225)Administrative expenses (77) (100) (97) (75)
Operating profit 2,192 1,963 2,088 327Gain on the revaluation of investment properties 2,340 10,078 1,111 1,449Net interest payable (514) (504) (688) (183)Acquisition costs written off – (467) – (540)Fair value movement of interest rate derivatives (9) (197) (104) (35)Deferred and current tax (421) (1,833) (478) (290)Profit attributable to shareholders 3,588 9,040 1,929 728Dividends paid (916) (447) (434) –Retained profit 2,672 8,593 1,495 728
Balance sheet (100%)Investment property 32,825 30,125 24,825 23,175Interest in leasehold properties – – 3,809 4,083Other non-current assets 1,015 1,005 1,490 1,465Current assets 888 1,132 845 1,256Current liabilities (1,193) (2,151) (1,840) (1,812)Derivative financial instruments (207) (197) (139) (35)Non-current liabilities (12,463) (11,721) (17,825) (18,462)
Net assets (100%) 20,865 18,193 11,165 9,670
Group shareOperating profit 439 471 418 65Gain on the revaluation of investment properties 468 2,042 222 290Net interest payable (103) (123) (138) (37)Acquisition costs written off – (177) – (108)Fair value movement of interest rate derivatives (2) (39) (21) (7)Deferred and current tax (84) (367) (95) (58)
Profit attributable to shareholders 718 1,807 386 145Dividends paid (183) (89) (87) –
Retained profit 535 1,718 299 145
Associates’ net assets 4,173 3,638 2,233 1,934
The prior year balance sheet and income statement have been restated for Armadillo 2 to reflect finance lease accounting for the short leaseholdproperty. There is no change to the prior year net assets or profit.
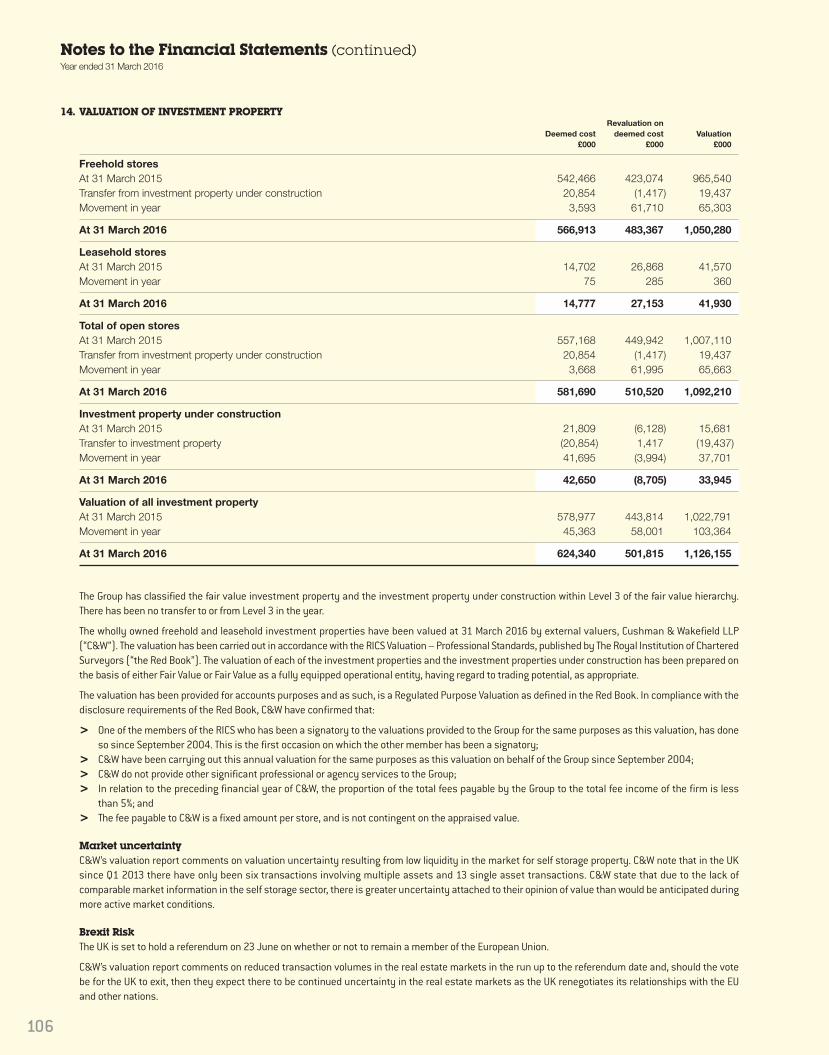
106
Notes to the Financial Statements (continued)Year ended 31 March 2016
14. VALUATION OF INVESTMENT PROPERTYRevaluation on
Deemed cost deemed cost Valuation£000 £000 £000
Freehold storesAt 31 March 2015 542,466 423,074 965,540Transfer from investment property under construction 20,854 (1,417) 19,437Movement in year 3,593 61,710 65,303
At 31 March 2016 566,913 483,367 1,050,280
Leasehold storesAt 31 March 2015 14,702 26,868 41,570Movement in year 75 285 360
At 31 March 2016 14,777 27,153 41,930
Total of open storesAt 31 March 2015 557,168 449,942 1,007,110Transfer from investment property under construction 20,854 (1,417) 19,437Movement in year 3,668 61,995 65,663
At 31 March 2016 581,690 510,520 1,092,210
Investment property under constructionAt 31 March 2015 21,809 (6,128) 15,681Transfer to investment property (20,854) 1,417 (19,437)Movement in year 41,695 (3,994) 37,701
At 31 March 2016 42,650 (8,705) 33,945
Valuation of all investment propertyAt 31 March 2015 578,977 443,814 1,022,791Movement in year 45,363 58,001 103,364
At 31 March 2016 624,340 501,815 1,126,155
The Group has classified the fair value investment property and the investment property under construction within Level 3 of the fair value hierarchy.There has been no transfer to or from Level 3 in the year.
The wholly owned freehold and leasehold investment properties have been valued at 31 March 2016 by external valuers, Cushman & Wakefield LLP(“C&W”). The valuation has been carried out in accordance with the RICS Valuation – Professional Standards, published by The Royal Institution of CharteredSurveyors (“the Red Book”). The valuation of each of the investment properties and the investment properties under construction has been prepared onthe basis of either Fair Value or Fair Value as a fully equipped operational entity, having regard to trading potential, as appropriate.
The valuation has been provided for accounts purposes and as such, is a Regulated Purpose Valuation as defined in the Red Book. In compliance with thedisclosure requirements of the Red Book, C&W have confirmed that:
> One of the members of the RICS who has been a signatory to the valuations provided to the Group for the same purposes as this valuation, has doneso since September 2004. This is the first occasion on which the other member has been a signatory;
> C&W have been carrying out this annual valuation for the same purposes as this valuation on behalf of the Group since September 2004; > C&W do not provide other significant professional or agency services to the Group;> In relation to the preceding financial year of C&W, the proportion of the total fees payable by the Group to the total fee income of the firm is less
than 5%; and> The fee payable to C&W is a fixed amount per store, and is not contingent on the appraised value.
Market uncertaintyC&W’s valuation report comments on valuation uncertainty resulting from low liquidity in the market for self storage property. C&W note that in the UKsince Q1 2013 there have only been six transactions involving multiple assets and 13 single asset transactions. C&W state that due to the lack ofcomparable market information in the self storage sector, there is greater uncertainty attached to their opinion of value than would be anticipated duringmore active market conditions.
Brexit RiskThe UK is set to hold a referendum on 23 June on whether or not to remain a member of the European Union.
C&W’s valuation report comments on reduced transaction volumes in the real estate markets in the run up to the referendum date and, should the votebe for the UK to exit, then they expect there to be continued uncertainty in the real estate markets as the UK renegotiates its relationships with the EUand other nations.

107
14. VALUATION OF INVESTMENT PROPERTY (continued)Portfolio PremiumC&W’s valuation report further confirms that the properties have been valued individually but that if the portfolio was to be sold as a single lot or inselected groups of properties, the total value could differ significantly. C&W state that in current market conditions they are of the view that there couldbe a material portfolio premium.
Valuation methodologyC&W have adopted different approaches for the valuation of the leasehold and freehold assets as follows:
Freehold and long leaseholdThe valuation is based on a discounted cash flow of the net operating income over a ten year period and notional sale of the asset at the end of the tenth year.
AssumptionsA. Net operating income is based on projected revenue received less projected operating costs together with a central administration charge of 6% of
the estimated annual revenue subject to a cap and a collar. The initial net operating income is calculated by estimating the net operating income inthe first 12 months following the valuation date.
B. The net operating income in future years is calculated assuming either straight-line absorption from day one actual occupancy or variable absorptionover years one to four of the cash flow period, to an estimated stabilised/mature occupancy level. In the valuation the assumed stabilised occupancylevel for the 71 trading stores (both freeholds and leaseholds) open at 31 March 2016 averages 81.9% (31 March 2015: 81.1%). The projected revenuesand costs have been adjusted for estimated cost inflation and revenue growth. The average time assumed for the 71 stores to trade at their maturitylevels is 20 months (31 March 2015: 24 months).
C. The capitalisation rates applied to existing and future net cash flow have been estimated by reference to underlying yields for industrial and retailwarehouse property, yields for other trading property types such as student housing and hotels, bank base rates, ten year money rates, inflation andthe available evidence of transactions in the sector. The valuation included in the accounts assumes rental growth in future periods. If an assumptionof no rental growth is applied to the external valuation, the net initial yield pre-administration expenses for the 71 stores is 6.5% (31 March 2015:6.4%) rising to a stabilised net yield pre-administration expenses of 7.2% (31 March 2015: 7.4%).
D. The future net cash flow projections (including revenue growth and cost inflation) have been discounted at a rate that reflects the risk associatedwith each asset. The weighted average annual discount rate adopted (for both freeholds and leaseholds) is 9.9% (31 March 2015: 10.4%).
E. Purchaser’s costs in the range of 6.1% to circa 6.8% (see below) have been assumed initially, reflecting the new progressive SLDT rates brought intoforce in March 2016 and sale plus purchaser’s costs totalling circa 7.1% to 7.8% are assumed on the notional sales in the tenth year in relation to thefreehold stores.
Short leaseholdThe same methodology has been used as for freeholds, except that no sale of the assets in the tenth year is assumed but the discounted cash flow is extendedto the expiry of the lease. The average unexpired term of the Group’s six short leasehold properties is 15.5 years (31 March 2015: 16.5 years unexpired).
Investment properties under constructionC&W have valued the stores in development adopting the same methodology as set out above but on the basis of the cash flow projection expected forthe store at opening and after allowing for the outstanding costs to take each scheme from its current state to completion and full fit-out. C&W haveallowed for holding costs and construction contingency, as appropriate. Three schemes do not yet have planning consent and C&W have reflected theplanning risk in their valuation.
Immature stores: value uncertaintyC&W have assessed the value of each property individually. However, two of the Group’s stores are relatively immature and have low initial cash flows.C&W have endeavoured to reflect the nature of the cash flow profile for these properties in their valuation, and the higher associated risks relating to theas yet unproven future cash flows, by adjustment to the capitalisation rates and discount rates adopted. However, immature low cash flow stores of thisnature are rarely, if ever, traded individually in the market, unless as part of a distressed sale or similar situation. Although, there is more evidence ofimmature low cash flow stores being traded as part of a group or portfolio transaction.
Please note C&W’s comments in relation to market uncertainty in the self storage sector due to the lack of comparable market transactions and information.The degree of uncertainty relating to the two immature stores is greater than in relation to the balance of the properties due to there being even lessmarket evidence that might be available for more mature properties and portfolios.
C&W state that in practice, if an actual sale of the properties were to be contemplated then any immature low cash flow stores would normally be presentedto the market for sale lotted or grouped with other more mature assets owned by the same entity, in order to alleviate the issue of negative or low shortterm cash flow. This approach would enhance the marketability of the group of assets and assist in achieving the best price available in the market bydiluting the cash flow risk.
C&W have not adjusted their opinion of Fair Value to reflect such a grouping of the immature assets with other properties in the portfolio and all storeshave been valued individually. However, they highlight the matter to alert the Group to the manner in which the properties might be grouped or lotted inorder to maximise their attractiveness to the market place.

108
Notes to the Financial Statements (continued)Year ended 31 March 2016
14. VALUATION OF INVESTMENT PROPERTY (continued)
Immature stores: value uncertainty (continued)C&W consider this approach to be a valuation assumption but not a Special Assumption, the latter being an assumption that assumes facts that differfrom the actual facts existing at the valuation date and which, if not adopted, could produce a material difference in value.
As noted above, C&W have not assumed that the entire portfolio of properties owned by the entity would be sold as a single lot and the value for the wholeportfolio in the context of a sale as a single lot may differ significantly from the aggregate of the individual values for each property in the portfolio,reflecting the lotting assumption described above.
Valuation assumption for purchaser’s costsThe Group’s investment property assets have been valued for the purposes of the financial statements after deducting notional purchaser’s cost of circa6.1% to 6.8% of gross value, as if they were sold directly as property assets. The valuation is an asset valuation which is entirely linked to the operatingperformance of the business. The assets would have to be sold with the benefit of operational contracts, employment contracts and customer contracts,which would be very difficult to achieve except in a corporate structure.
This approach follows the logic of the valuation methodology in that the valuation is based on a capitalisation of the net operating income after allowinga deduction for operational cost and an allowance for central administration costs. Sale in a corporate structure would result in a reduction in the assumedStamp Duty Land Tax but an increase in other transaction costs reflecting additional due diligence resulting in a reduced notional purchaser’s cost of2.75% of gross value. All the significant sized transactions that have been concluded in the UK in recent years were completed in a corporate structure.The Group therefore instructed C&W to carry out a Red Book valuation on the above basis, and this results in a higher property valuation at 31 March 2016of £1,190.4 million (£64.2 million higher than the value recorded in the financial statements). The total valuations in the two Armadillo Partnershipsperformed by Jones Lang LaSalle are £2.1 million higher than the value recorded in the financial statements, of which the Group’s share is £0.4 million.The sum of these is £64.6 million and translates to 40.8 pence per share. We have included this revised valuation in the adjusted diluted net assetcalculation (see note 14).
15. SURPLUS LAND
£000
At 31 March 2015 3,315Additions 66Release of impairment 2,300Disposal (5,381)
At 31 March 2016 300
A gain of £4,754,000 arose on the disposal of surplus land at one site during the year (including the release of a prior year impairment). During the prioryear a gain of £1,318,000 arose on the disposal of surplus land at one site.
16. TRADE AND OTHER RECEIVABLES31 March 31 March
2016 2015£000 £000
CurrentTrade receivables 3,050 3,062Capital Goods Scheme receivable 2,866 184Other receivables 241 371Prepayments and accrued income 10,065 12,762
16,222 16,379
Non-currentCapital Goods Scheme receivable 6,561 9,039
Trade receivables are net of a bad debt provision of £11,000 (2015: £19,000). The Directors consider that the carrying amount of trade and other receivablesapproximates their fair value.
The Financial Review contains commentary on the Capital Goods Scheme receivable.
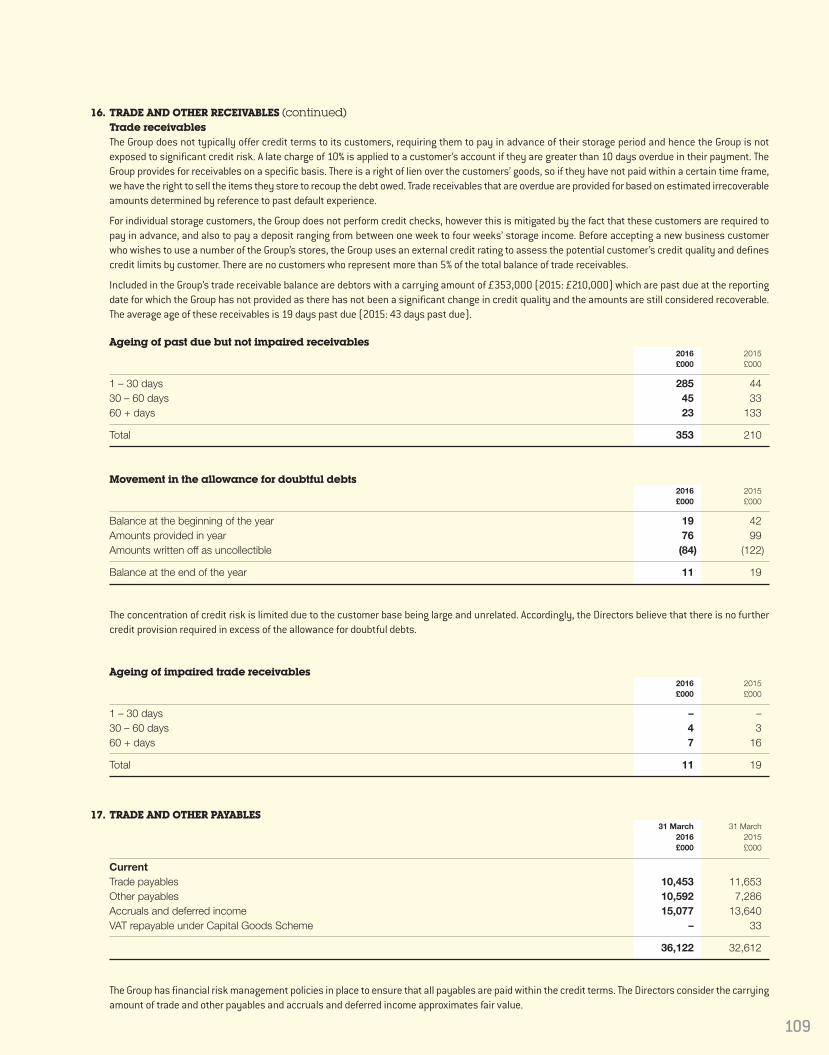
109
16. TRADE AND OTHER RECEIVABLES (continued)Trade receivablesThe Group does not typically offer credit terms to its customers, requiring them to pay in advance of their storage period and hence the Group is notexposed to significant credit risk. A late charge of 10% is applied to a customer’s account if they are greater than 10 days overdue in their payment. TheGroup provides for receivables on a specific basis. There is a right of lien over the customers’ goods, so if they have not paid within a certain time frame,we have the right to sell the items they store to recoup the debt owed. Trade receivables that are overdue are provided for based on estimated irrecoverableamounts determined by reference to past default experience.
For individual storage customers, the Group does not perform credit checks, however this is mitigated by the fact that these customers are required topay in advance, and also to pay a deposit ranging from between one week to four weeks’ storage income. Before accepting a new business customerwho wishes to use a number of the Group’s stores, the Group uses an external credit rating to assess the potential customer’s credit quality and definescredit limits by customer. There are no customers who represent more than 5% of the total balance of trade receivables.
Included in the Group’s trade receivable balance are debtors with a carrying amount of £353,000 (2015: £210,000) which are past due at the reportingdate for which the Group has not provided as there has not been a significant change in credit quality and the amounts are still considered recoverable.The average age of these receivables is 19 days past due (2015: 43 days past due).
Ageing of past due but not impaired receivables2016 2015£000 £000
1 – 30 days 285 4430 – 60 days 45 3360 + days 23 133
Total 353 210
Movement in the allowance for doubtful debts2016 2015£000 £000
Balance at the beginning of the year 19 42Amounts provided in year 76 99Amounts written off as uncollectible (84) (122)
Balance at the end of the year 11 19
The concentration of credit risk is limited due to the customer base being large and unrelated. Accordingly, the Directors believe that there is no furthercredit provision required in excess of the allowance for doubtful debts.
Ageing of impaired trade receivables2016 2015£000 £000
1 – 30 days – –30 – 60 days 4 360 + days 7 16
Total 11 19
17. TRADE AND OTHER PAYABLES31 March 31 March
2016 2015£000 £000
CurrentTrade payables 10,453 11,653Other payables 10,592 7,286Accruals and deferred income 15,077 13,640VAT repayable under Capital Goods Scheme – 33
36,122 32,612
The Group has financial risk management policies in place to ensure that all payables are paid within the credit terms. The Directors consider the carryingamount of trade and other payables and accruals and deferred income approximates fair value.

110
Notes to the Financial Statements (continued)Year ended 31 March 2016
18. FINANCIAL INSTRUMENTSThe Group manages its capital to ensure that entities in the Group will be able to continue as going concerns while maximising the return to stakeholdersthrough the optimisation of the debt and equity balance. The capital structure of the Group consists of debt, which includes the borrowings disclosed innote 19, cash and cash equivalents and equity attributable to equity holders of the parent, comprising issued capital, reserves and retained earnings.The Group’s debt facilities currently require 45% of total drawn debt to be fixed. The Group has complied with this during the year.
With the exception of derivative instruments which are classified as a financial liability at fair value through the profit and loss (“FVTPL”), financial liabilitiesare categorised under amortised cost. All financial assets are categorised as loans and receivables.
Exposure to credit, interest rate and currency risks arises in the normal course of the Group’s business. Derivative financial instruments are used tomanage exposure to fluctuations in interest rates, but are not employed for speculative purposes.
Significant accounting policiesDetails of the significant accounting policies and methods adopted, including the criteria for recognition, the basis of measurement and the basis onwhich income and expenses are recognised, in respect of each class of financial asset, financial liability and equity instrument are disclosed in note 2 tothe financial statements.
A. Balance sheet managementThe Group’s Board reviews the capital structure on an ongoing basis. As part of this review, the Board considers the cost of capital and the risksassociated with each class of capital. The Group seeks to have a conservative gearing ratio (the proportion of net debt to equity). The Board considersat each review the appropriateness of the current ratio in light of the above. The Board is currently satisfied with the Group’s gearing ratio.
The gearing ratio at the year end is as follows:2016 2015£000 £000
Debt (312,198) (285,334)Cash and cash equivalents 17,207 8,194
Net debt (294,991) (277,140)Balance sheet equity 829,387 750,914Net debt to equity ratio 35.6% 36.9%
Debt is defined as long-term and short-term borrowings, as detailed in note 19, excluding finance leases and debt issue costs. Equity includes allcapital and reserves of the Group attributable to equity holders of the Company. Net debt is defined as gross bank borrowings less cash and cashequivalents.
B. Debt managementThe Group currently borrows through a senior term loan, secured on 25 self storage assets and sites, a 15 year loan with Aviva Commercial FinanceLimited secured on a portfolio of 15 self storage assets, and a £70 million seven year loan from M&G Investments Limited, drawn in June 2015, andsecured on a portfolio of 15 self storage assets. Borrowings are arranged to ensure an appropriate maturity profile and to maintain short term liquidity.Funding is arranged in the Group through banks and financial institutions with whom the Group has a strong working relationship.
C. Interest rate risk managementThe Group is exposed to interest rate risk as entities in the Group borrow funds at both fixed and floating interest rates. The risk is managed by theGroup by maintaining an appropriate mix between fixed and floating rate borrowings, and by the use of interest rate swap contracts. Hedging activitiesare evaluated regularly to align with interest rate views and defined risk appetite; ensuring optimal hedging strategies are applied, by either positioningthe balance sheet or protecting interest expense through different interest rate cycles.
At 31 March 2016 the Group had two interest rate derivatives in place; £30 million fixed at 2.80% (excluding the margin on the underlying debtinstrument) until September 2016, and £35 million fixed at 2.635% (excluding the margin on the underlying debt instrument) until June 2022.
Under interest rate swap contracts, the Group agrees to exchange the difference between fixed and floating rate interest amounts calculated onagreed notional principal amounts. Such contracts enable the Group to mitigate the risk of changing interest rates on the fair value of issued fixedrate debt held and the cash flow exposures on the issued variable rate debt held. The fair value of interest rate swaps at the reporting date is determinedby discounting the future cash flows using the curves at the reporting date and the credit risk inherent in the contract, and is disclosed below. The average interest rate is based on the outstanding balances at the end of the financial year.
The £30 million interest rate swap settles on a monthly basis. The floating rate on the interest rate swap is one month LIBOR. The Group settles thedifference between the fixed and floating interest rate on a net basis.
The £35 million interest rate swap settles on a three-monthly basis. The floating rate on the interest rate swap is three month LIBOR. The Group settlesthe difference between the fixed and floating interest rate on a net basis.
The Group does not hedge account for its interest rate swaps and states them at fair value, with changes in fair value included in the statement ofcomprehensive income. The loss in the statement of comprehensive income for the year on the fair value of interest rate derivatives was £4,000 (2015: loss of £2,274,000).
The fair value of the above derivatives at 31 March 2016 was a liability of £3,683,000 (2015: liability of £3,679,000).
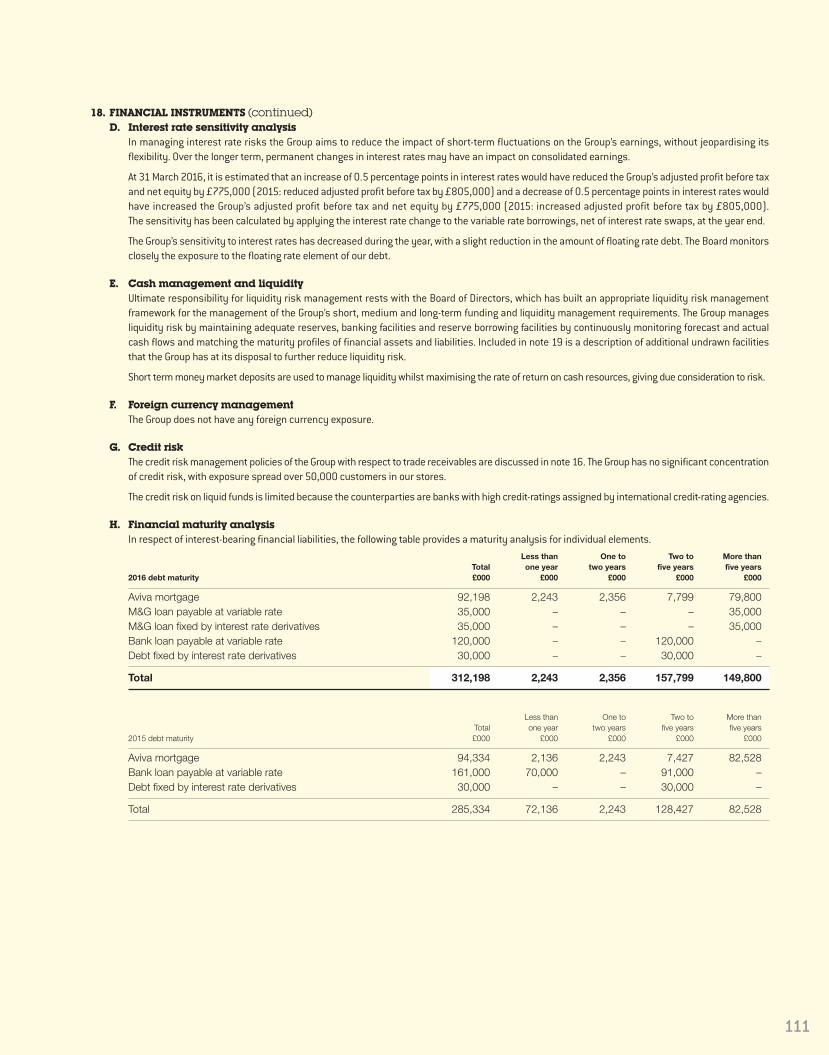
111
18. FINANCIAL INSTRUMENTS (continued)D. Interest rate sensitivity analysis
In managing interest rate risks the Group aims to reduce the impact of short-term fluctuations on the Group’s earnings, without jeopardising itsflexibility. Over the longer term, permanent changes in interest rates may have an impact on consolidated earnings.
At 31 March 2016, it is estimated that an increase of 0.5 percentage points in interest rates would have reduced the Group’s adjusted profit before taxand net equity by £775,000 (2015: reduced adjusted profit before tax by £805,000) and a decrease of 0.5 percentage points in interest rates wouldhave increased the Group’s adjusted profit before tax and net equity by £775,000 (2015: increased adjusted profit before tax by £805,000). The sensitivity has been calculated by applying the interest rate change to the variable rate borrowings, net of interest rate swaps, at the year end.
The Group’s sensitivity to interest rates has decreased during the year, with a slight reduction in the amount of floating rate debt. The Board monitorsclosely the exposure to the floating rate element of our debt.
E. Cash management and liquidity Ultimate responsibility for liquidity risk management rests with the Board of Directors, which has built an appropriate liquidity risk managementframework for the management of the Group’s short, medium and long-term funding and liquidity management requirements. The Group managesliquidity risk by maintaining adequate reserves, banking facilities and reserve borrowing facilities by continuously monitoring forecast and actualcash flows and matching the maturity profiles of financial assets and liabilities. Included in note 19 is a description of additional undrawn facilitiesthat the Group has at its disposal to further reduce liquidity risk.
Short term money market deposits are used to manage liquidity whilst maximising the rate of return on cash resources, giving due consideration to risk.
F. Foreign currency managementThe Group does not have any foreign currency exposure.
G. Credit riskThe credit risk management policies of the Group with respect to trade receivables are discussed in note 16. The Group has no significant concentrationof credit risk, with exposure spread over 50,000 customers in our stores.
The credit risk on liquid funds is limited because the counterparties are banks with high credit-ratings assigned by international credit-rating agencies.
H. Financial maturity analysisIn respect of interest-bearing financial liabilities, the following table provides a maturity analysis for individual elements.
Less than One to Two to More thanTotal one year two years five years five years
2016 debt maturity £000 £000 £000 £000 £000
Aviva mortgage 92,198 2,243 2,356 7,799 79,800M&G loan payable at variable rate 35,000 – – – 35,000M&G loan fixed by interest rate derivatives 35,000 – – – 35,000Bank loan payable at variable rate 120,000 – – 120,000 –Debt fixed by interest rate derivatives 30,000 – – 30,000 –
Total 312,198 2,243 2,356 157,799 149,800
Less than One to Two to More thanTotal one year two years five years five years
2015 debt maturity £000 £000 £000 £000 £000
Aviva mortgage 94,334 2,136 2,243 7,427 82,528Bank loan payable at variable rate 161,000 70,000 – 91,000 –Debt fixed by interest rate derivatives 30,000 – – 30,000 –
Total 285,334 72,136 2,243 128,427 82,528

112
Notes to the Financial Statements (continued)Year ended 31 March 2016
18. FINANCIAL INSTRUMENTS (continued)I. Fair values of financial instruments
The fair values of the Group’s cash and short term deposits and those of other financial assets equate to their book values. Details of the Group’sreceivables at amortised cost are set out in note 16. The amounts are presented net of provisions for doubtful receivables, and allowances forimpairment are made where appropriate. Trade and other payables, including bank borrowings, are carried at amortised cost. Finance lease liabilitiesare included at the fair value of their minimum lease payments. Derivatives are carried at fair value.
For those financial instruments held at valuation, the Group has categorised them into a three level fair value hierarchy based on the priority of theinputs to the valuation technique in accordance with IFRS 7. The hierarchy gives the highest priority to quoted prices in active markets for identicalassets or liabilities (Level 1) and the lowest priority to unobservable inputs (Level 3). If the inputs used to measure fair value fall within differentlevels of the hierarchy, the category level is based on the lowest priority level input that is significant to the fair value measurement of the instrumentin its entirety. The fair value of the Group’s outstanding interest rate derivative, as detailed in note 18C, has been estimated by calculating the presentvalue of future cash flows, using appropriate market discount rates, representing Level 2 fair value measurements as defined by IFRS 7. There are nofinancial instruments which have been categorised as Level 1 or Level 3.
J. Maturity analysis of financial liabilities
The contractual maturities based on market conditions and expected yield curves prevailing at the year end date are as follows:Trade
and other Interest rate Borrowings Financepayables swaps and interest leases Total
2016 £000 £000 £000 £000 £000
From five to twenty years – 506 176,296 22,894 199,696From two to five years – 1,684 188,517 5,255 195,456From one to two years – 675 12,982 1,752 15,409
Due after more than one year – 2,865 377,795 29,901 410,561Due within one year 21,045 1,055 12,982 1,752 36,834
Total 21,045 3,920 390,777 31,653 447,395
Tradeand other Interest rate Borrowings Financepayables swaps and interest leases Total
2015 £000 £000 £000 £000 £000
From five to twenty years – 885 114,628 24,529 140,042From two to five years – 1,213 158,166 5,207 164,586From one to two years – 916 12,655 1,735 15,306
Due after more than one year – 3,014 285,449 31,471 319,934Due within one year 18,939 1,175 82,267 1,735 104,116
Total 18,939 4,189 367,716 33,206 424,050

113
18. FINANCIAL INSTRUMENTS (continued)K. Reconciliation of maturity analyses
The maturity analysis in note 18J shows non-discounted cash flows for all financial liabilities including interest payments. The table below reconcilesthe borrowings column in note 19 with the borrowings and interest column in the maturity analysis presented in note 18J.
Unamortisedborrowing Borrowings
Borrowings Interest costs and interest2016 £000 £000 £000 £000
From five to twenty years 149,800 24,306 2,190 176,296From two to five years 157,799 29,473 1,245 188,517From one to two years 2,356 10,626 – 12,982
Due after more than one year 309,955 64,405 3,435 377,795Due within one year 2,243 10,739 – 12,982
Total 312,198 75,144 3,435 390,777
Unamortisedborrowing Borrowings
Borrowings Interest costs and interest2015 £000 £000 £000 £000
From five to twenty years 82,528 30,890 1,210 114,628From two to five years 128,427 28,487 1,252 158,166From one to two years 2,243 10,412 – 12,655
Due after more than one year 213,198 69,789 2,462 285,449Due within one year 72,136 10,131 – 82,267
Total 285,334 79,920 2,462 367,716
19. BORROWINGS31 March 31 March
2016 2015Secured borrowings at amortised cost £000 £000
Current liabilitiesAviva mortgage 2,243 2,136Bank borrowings – 70,000
2,243 72,136
Non-current liabilitiesBank borrowings 150,000 121,000Aviva mortgage 89,955 92,198M&G mortgage 70,000 –Unamortised loan arrangement costs (3,435) (2,462)
Total non-current borrowings 306,520 210,736
Total borrowings 308,763 282,872
The weighted average interest rate paid on the borrowings during the year was 3.6% (2015: 3.9%).
The Group has £20,000,000 in undrawn committed bank borrowing facilities at 31 March 2016, which expire between four and five years (2015: £49,000,000 expiring between four and five years).
The Group has a £100 million 15 year fixed rate loan with Aviva Commercial Finance Limited. The loan is secured over a portfolio of 15 freehold self storagecentres. The annual fixed interest rate on the loan is 4.9%. The loan amortises to £60 million over the course of the 15 years. The debt service is payablemonthly based on fixed annual amounts. The loan outstanding on the fifth anniversary will be £89.8 million; £76.7 million outstanding on the tenthanniversary, with £60 million remaining at expiry in April 2027.
The Group has a £170 million 5 year bank facility with Lloyds and HSBC expiring in August 2019. £85 million of the facility is term loan with £85 millionrevolving. The blended margin on the facility is 1.375%. The Group has an option to extend this loan for a further year. The Group also has an option toincrease the amount of the revolving loan facility by a further £80 million during the course of the loan’s term. £20 million of this option was taken upsubsequent to the year end, and hence at the date of signing the Group’s bank loan facility was £190 million.

114
Notes to the Financial Statements (continued)Year ended 31 March 2016
19. BORROWINGS (continued)In June 2015 the Group drew down a £70 million 7 year loan with M&G Investments Limited, simultaneously repaying a short term bank loan of the sameamount. The loan is secured over a portfolio of 15 freehold self storage centres. Half of the loan is variable and half is subject to an interest rate derivativefor the seven years.
The Group was in compliance with its banking covenants at 31 March 2016 and throughout the year.
Interest rate profile of financial liabilitiesWeighted
Weighted Period for averageFloating Fixed average which the period
Total rate rate interest rate is until£000 £000 £000 rate fixed maturity
At 31 March 2016Gross financial liabilities 312,198 155,000 157,198 3.5% 7.3 years 6.3 years
At 31 March 2015Gross financial liabilities 285,334 161,000 124,334 3.3% 8.0 years 5.0 years
All monetary liabilities, including short term receivables and payables are denominated in sterling. The weighted average interest rate includes the effectof the Group’s interest rate derivatives. The Directors have concluded that the carrying value of borrowings approximates to its fair value.
Narrative disclosures on the Group’s policy for financial instruments are included within the Strategic Report and in note 18.
20. DEFERRED TAXDeferred tax assets in respect of share based payments (£0.3 million), interest rate swaps (£0.7 million), corporation tax losses (£4.8 million), capitalallowances in excess of depreciation (£0.4 million) and capital losses (£1.1 million) in respect of the non-REIT taxable business have not been recogniseddue to uncertainty over the projected tax liabilities arising in the short term within the non-REIT taxable business.
21. OBLIGATIONS UNDER FINANCE LEASES Present value of Minimum lease payments minimum lease payments
2016 2015 2016 2015£000 £000 £000 £000
Amounts payable under finance leases:Within one year 1,752 1,735 1,722 1,705Within two to five years inclusive 7,007 6,942 6,136 6,077Greater than five years 22,894 24,529 12,307 13,047
31,653 33,206 20,165 20,829
Less: future finance charges (11,488) (12,377)
Present value of lease obligations 20,165 20,829
All lease obligations are denominated in sterling. Interest rates are fixed at the contract date. All leases are on a fixed repayment basis and no arrangementshave been entered into for contingent rental payments. The carrying amount of the Group’s lease obligations approximates their fair value.

115
22. SHARE CAPITAL Called up, Authorised allotted and fully paid
2016 2015 2016 2015£000 £000 £000 £000
Ordinary shares of 10 pence each 20,000 20,000 15,737 15,806
Movement in issued share capitalNumber of shares at 31 March 2014 143,061,147Exercise of share options – Share option schemes 641,877Share placing 14,352,711
Number of shares at 31 March 2015 158,055,735Cancellation of treasury shares (1,418,750)Exercise of share options – Share option schemes 732,302
Number of shares at 31 March 2016 157,369,287
The Company has one class of ordinary shares which carry no right to fixed income.
At 31 March 2016 options in issue to Directors and employees were as follows: Option Number of Number of price per ordinary ordinaryDate option ordinary Date first Date on which the shares sharesGranted share exercisable exercise period expires 2016 2015
3 August 2009 nil p** 3 August 2012 2 August 2019 2,075 2,07512 July 2010 nil p** 12 July 2013 11 July 2020 4,781 5,80719 July 2011 nil p** 19 July 2013 19 July 2021 7,112 14,58712 March 2012 240p* 1 April 2015 1 October 2015 – 92,34711 July 2012 nil p** 11 July 2015 10 July 2022 15,724 616,97712 March 2013 305.5p* 1 April 2016 1 October 2016 31,365 32,25419 July 2013 nil p** 19 July 2016 19 July 2023 511,821 511,82125 February 2014 442.6p* 1 April 2017 1 October 2017 23,655 24,71129 July 2014 nil p** 29 July 2017 29 July 2024 503,591 511,09116 March 2015 494.6p* 1 April 2018 1 October 2018 101,014 106,54121 July 2015 nil p** 21 July 2018 21 July 2025 399,117 –14 March 2016 608.0p* 1 April 2019 1 October 2019 49,296 –
1,649,551 1,918,211
* SAYE (see note 23) ** LTIP (see note 23)
OWN SHARESThe own shares reserve represents the cost of shares in Big Yellow Group PLC purchased in the market, and held by the Big Yellow Group PLC EmployeeBenefit Trust, along with shares issued directly to the Employee Benefit Trust. 1,122,907 shares are held in the Employee Benefit Trust (2015: 1,500,000),and following the cancellation of shares in September 2015, no shares are held in treasury (2015: 1,418,750).

116
Notes to the Financial Statements (continued)Year ended 31 March 2016
23. SHARE-BASED PAYMENTSThe Company has three equity share-based payment arrangements, namely an LTIP scheme (with approved and unapproved components), an EmployeeShare Save Scheme (“SAYE”) and a Long Term Bonus Performance Plan. The Group recognised a total expense in the year related to equity-settled share-based payment transactions of £2,539,000 (2015: £2,059,000).
Equity-settled share option plansSince 2004 the Group has operated an Employee Share Save Scheme (“SAYE”) which allows any employee who has more than six months service topurchase shares at a 20% discount to the average quoted market price of the Group shares at the date of grant. The associated savings contracts arethree years at which point the employee can exercise their option to purchase the shares or take the amount saved, including interest, in cash. The schemeis administered by Yorkshire Building Society.
On an annual basis since 2004 the Group awarded nil-paid options to senior management under the Group’s Long Term Incentive Plan (“LTIP”). The awardsare conditional on the achievement of challenging performance targets as described on page 73 of the Remuneration Report. The awards granted in 2004,2005 and 2006 vested in full. The awards granted in 2007 and 2009 lapsed, and the awards granted in 2008 and 2010 partially vested. The awardsgranted in 2011 and 2012 fully vested. The weighted average share price at the date of exercise for options exercised in the year was £7.04 (2015: £5.40).
2016 2015LTIP scheme No. of options No. of options
Outstanding at beginning of year 1,662,358 1,649,374Granted during the year 468,546 724,345Lapsed during the year (46,728) (93,955)Exercised during the year (639,955) (617,406)Outstanding at the end of the year 1,444,221 1,662,358
Exercisable at the end of the year 29,692 22,469
The weighted average fair value of options granted during the year was £976,000 (2015: £907,000).
2016 2015Weighted Weighted
2016 average 2015 averageNo. of exercise price No. of exercise price
Employee Share Save Scheme (“SAYE”) options (£) options (£)
Outstanding at beginning of year 255,853 3.74 188,199 2.84Granted during the year 49,296 6.08 106,541 4.95Forfeited during the year (7,472) 4.65 (14,416) 2.83Exercised during the year (92,347) 2.40 (24,471) 2.63
Outstanding at the end of the year 205,330 4.87 255,853 3.74
Exercisable at the end of the year – – – –
Options outstanding at 31 March 2016 had a weighted average contractual life of 2.2 years (2015: 2.0 years).
The inputs into the Black-Scholes model are as follows:LTIP SAYE
Expected volatility 24% 25%Expected life 3 years 3 yearsRisk-free rate 0.8% 0.8%Expected dividends 3.4% 3.4%
Expected volatility was determined by calculating the historical volatility of the Group’s share price over the year prior to grant.
Long Term Bonus Performance PlanThe Executive Directors receive awards under the Long Term Bonus Performance Plan. This is accounted for as an equity instrument. The plan was set upin July 2015. The vesting criteria and scheme mechanics are set out in the Directors’ Remuneration Report. At 31 March 2016 the weighted averagecontractual life was 2.3 years.

117
24. CAPITAL COMMITMENTSAt 31 March 2016 the Group had £0.4 million of amounts contracted but not provided in respect of the Group’s properties (2015: £4.4 million of capitalcommitments).
25. EVENTS AFTER THE BALANCE SHEET DATEIn April 2016, the Group acquired the Lock and Leave portfolio. Big Yellow acquired the stores in Nine Elms and Twickenham for £14.6 million. The storesin Canterbury and West Molesey were acquired by Armadillo 1 for £6.4 million.
26. RELATED PARTY TRANSACTIONSTransactions between the Company and its subsidiaries, which are related parties, have been eliminated on consolidation and are not disclosed in this note.
Transactions with Big Yellow Limited PartnershipAs described in note 13, the Group had a 33.3% interest in Big Yellow Limited Partnership, and entered into transactions with the Partnership during theprior year on normal commercial terms as shown in the table below. From 1 December 2014 the Partnership was wholly owned by the Group and thereforefrom this date activity with the Partnership is no longer shown in this note.
Transactions with Armadillo Storage Holding Company LimitedAs described in note 13, the Group has a 20% interest in Armadillo Storage Holding Company Limited, and entered into transactions with Armadillo 1 duringthe period on normal commercial terms as shown in the table below.
Transactions with Armadillo Storage Holding Company 2 LimitedAs described in note 13, the Group has a 20% interest in Armadillo Storage Holding Company 2 Limited, and entered into transactions with Armadillo 2during the period on normal commercial terms as shown in the table below.
31 March 31 March2016 2015£000 £000
Fees earned from Big Yellow Limited Partnership – 458Fees earned from Armadillo 1 414 560Fees earned from Armadillo 2 291 208Balance due from Armadillo 1 103 287Balance due from Armadillo 2 89 71
The remuneration of the Executive and Non-Executive Directors, who are the key management personnel of the Group, is set out below in aggregate.Further information on the remuneration of individual Directors is found in the audited part of the Directors’ Remuneration Report on pages 72 to 79.
31 March 31 March2016 2015£000 £000
Short term employee benefits 1,316 1,282Post-employment benefits 148 95Share based payments 1,973 4,410
3,437 5,787
AnyJunk LimitedJames Gibson is a Non-Executive Director and shareholder in AnyJunk Limited and Adrian Lee is a shareholder in AnyJunk Limited. During the yearAnyJunk Limited provided waste disposal services to the Group on normal commercial terms, amounting to £24,000 (2015: £24,000).
No other related party transactions took place during the years ended 31 March 2016 and 31 March 2015.
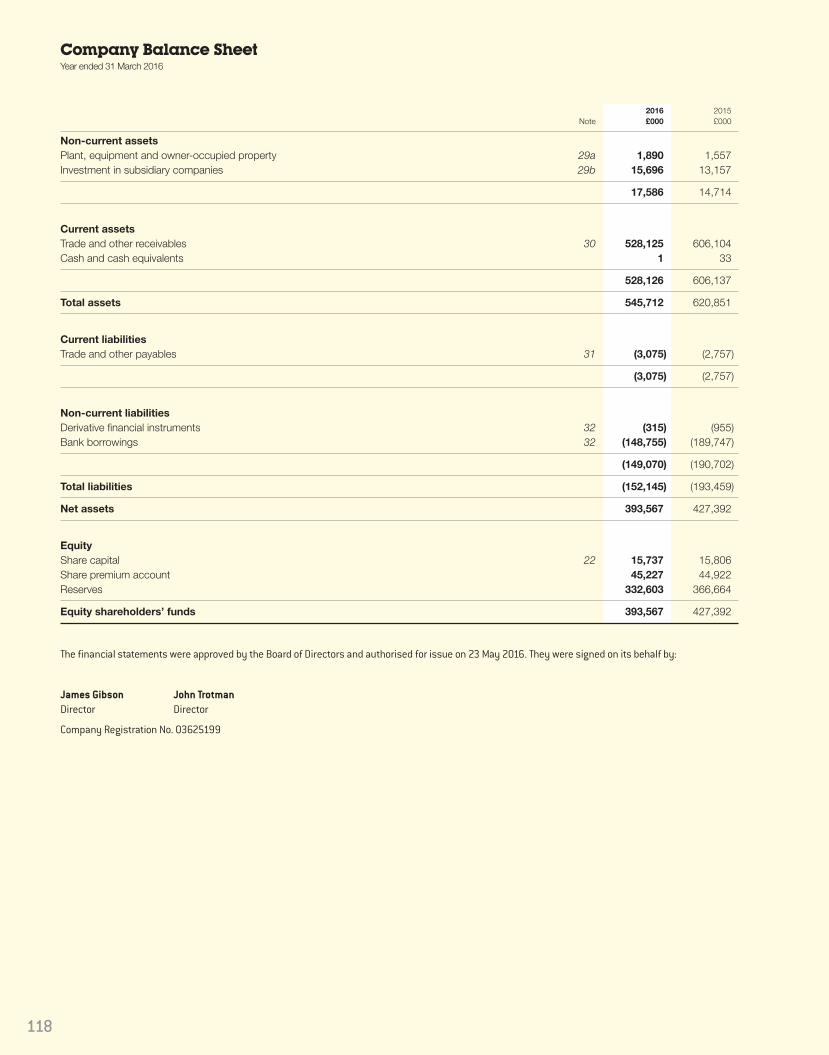
118
Company Balance SheetYear ended 31 March 2016
2016 2015Note £000 £000
Non-current assetsPlant, equipment and owner-occupied property 29a 1,890 1,557Investment in subsidiary companies 29b 15,696 13,157
17,586 14,714
Current assetsTrade and other receivables 30 528,125 606,104Cash and cash equivalents 1 33
528,126 606,137
Total assets 545,712 620,851
Current liabilitiesTrade and other payables 31 (3,075) (2,757)
(3,075) (2,757)
Non-current liabilitiesDerivative financial instruments 32 (315) (955)Bank borrowings 32 (148,755) (189,747)
(149,070) (190,702)
Total liabilities (152,145) (193,459)
Net assets 393,567 427,392
EquityShare capital 22 15,737 15,806Share premium account 45,227 44,922Reserves 332,603 366,664
Equity shareholders’ funds 393,567 427,392
The financial statements were approved by the Board of Directors and authorised for issue on 23 May 2016. They were signed on its behalf by:
James Gibson John TrotmanDirector Director
Company Registration No. 03625199
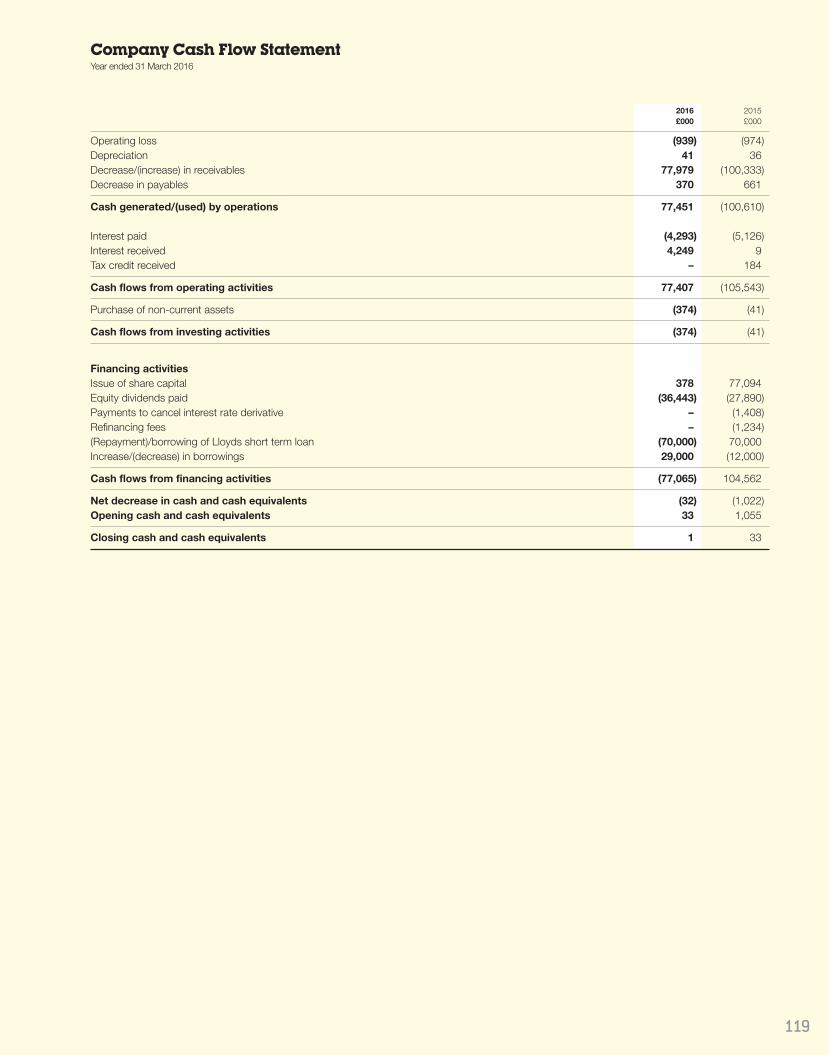
119
Company Cash Flow StatementYear ended 31 March 2016
2016 2015£000 £000
Operating loss (939) (974)Depreciation 41 36Decrease/(increase) in receivables 77,979 (100,333)Decrease in payables 370 661
Cash generated/(used) by operations 77,451 (100,610)
Interest paid (4,293) (5,126)Interest received 4,249 9Tax credit received – 184
Cash flows from operating activities 77,407 (105,543)
Purchase of non-current assets (374) (41)
Cash flows from investing activities (374) (41)
Financing activitiesIssue of share capital 378 77,094Equity dividends paid (36,443) (27,890)Payments to cancel interest rate derivative – (1,408)Refinancing fees – (1,234)(Repayment)/borrowing of Lloyds short term loan (70,000) 70,000Increase/(decrease) in borrowings 29,000 (12,000)
Cash flows from financing activities (77,065) 104,562
Net decrease in cash and cash equivalents (32) (1,022)Opening cash and cash equivalents 33 1,055
Closing cash and cash equivalents 1 33

120
Company Statement of Changes in EquityYear ended 31 March 2016
Share Other non- CapitalShare premium distributable redemption Retained Owncapital account reserve reserve earnings shares Total£000 £000 £000 £000 £000 £000 £000
At 1 April 2015 15,806 44,922 74,950 1,653 295,684 (5,623) 427,392Total comprehensive loss for the year – – – – (299) – (299)Dividend – – – – (36,443) – (36,443)Issue of share capital 73 305 – – – – 378Cancellation of treasury shares (142) – – 142 (3,727) 3,727 –Use of own shares to satisfy share options – – – – (877) 877 –Credit to equity for equity-settled share based payments – – – – 2,539 – 2,539
At 31 March 2016 15,737 45,227 74,950 1,795 256,877 (1,019) 393,567
The Company’s share capital is disclosed in note 22.
The own shares balance represents amounts held by the Employee Benefit Trust (see note 22).
Year ended 31 March 2015
Share Other non- CapitalShare premium distributable redemption Retained Owncapital account reserve reserve earnings shares Total£000 £000 £000 £000 £000 £000 £000
At 1 April 2014 14,306 44,278 – 1,653 323,806 (5,623) 378,420Total comprehensive loss for the year – – – – (2,291) – (2,291)Dividend – – – – (27,890) – (27,890)Issue of share capital 1,500 644 74,950 – – – 77,094Credit to equity for equity-settled share based payments – – – – 2,059 – 2,059
At 31 March 2015 15,806 44,922 74,950 1,653 295,684 (5,623) 427,392

121
Notes to the Financial StatementsYear ended 31 March 2016
27. PROFIT FOR THE YEARAs permitted by section 408 of the Companies Act 2006, the statement of comprehensive income of the Company is not presented as part of thesefinancial statements. The loss for the year attributable to equity shareholders dealt with in the financial statements of the Company was £0.3 million(2015: loss of £2.3 million).
28. BASIS OF ACCOUNTINGThe separate financial statements of the Company are presented as required by the Companies Act 2006. As permitted by that Act, the separate financialstatements have been prepared in accordance with International Financial Reporting Standards.
The financial statements have been prepared on the historic cost basis except that derivative financial instruments are stated at fair value.
The Company’s principal accounting policies are the same as those applied in the Group financial statements. See note 23 for details of share basedpayments affecting the Company.
Going concernSee note 2 for the review of going concern for the Group and the Company.
IFRIC 11, IFRS 2 Group and Treasury Share TransactionsThe Company makes equity settled share based payments to certain employees of certain subsidiary undertakings. Equity settled share based paymentsthat are made to the employees of the Company’s subsidiaries are treated as increases in equity over the vesting period of the award, with a correspondingincrease in the Company’s investments in subsidiaries, based on an estimate of the number of shares that will eventually vest. This is the only additionto investment in subsidiaries in the current year. The Company does not have any employees.
29. NON-CURRENT ASSETS
a) Plant, equipment and owner occupied propertyFixtures,fittings
Freehold Leasehold & officeproperty improvements equipment Total£000 £000 £000 £000
CostAt 31 March 2015 1,885 18 – 1,903Additions 298 46 30 374
At 31 March 2016 2,183 64 30 2,277
Accumulated depreciationAt 31 March 2015 (328) (18) – (346)Charge for the year (39) – (2) (41)
At 31 March 2016 (367) (18) (2) (387)
Net book valueAt 31 March 2016 1,816 46 28 1,890
At 31 March 2015 1,557 – – 1,557
b) Investments in subsidiary companiesInvestment insubsidiary
undertakings£000
CostAt 31 March 2015 13,157Additions 2,539
At 31 March 2016 15,696
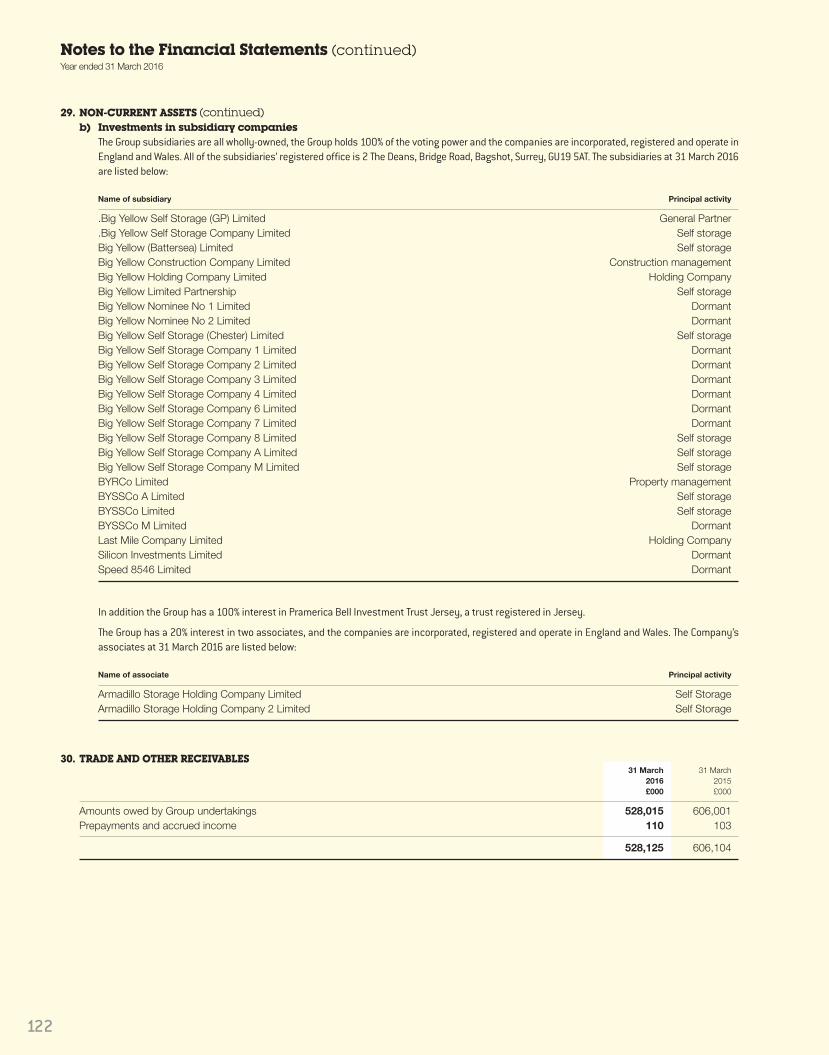
122
29. NON-CURRENT ASSETS (continued)b) Investments in subsidiary companies
The Group subsidiaries are all wholly-owned, the Group holds 100% of the voting power and the companies are incorporated, registered and operate inEngland and Wales. All of the subsidiaries’ registered office is 2 The Deans, Bridge Road, Bagshot, Surrey, GU19 5AT. The subsidiaries at 31 March 2016are listed below:
Name of subsidiary Principal activity
.Big Yellow Self Storage (GP) Limited General Partner
.Big Yellow Self Storage Company Limited Self storageBig Yellow (Battersea) Limited Self storageBig Yellow Construction Company Limited Construction managementBig Yellow Holding Company Limited Holding CompanyBig Yellow Limited Partnership Self storageBig Yellow Nominee No 1 Limited DormantBig Yellow Nominee No 2 Limited DormantBig Yellow Self Storage (Chester) Limited Self storageBig Yellow Self Storage Company 1 Limited DormantBig Yellow Self Storage Company 2 Limited DormantBig Yellow Self Storage Company 3 Limited DormantBig Yellow Self Storage Company 4 Limited DormantBig Yellow Self Storage Company 6 Limited DormantBig Yellow Self Storage Company 7 Limited DormantBig Yellow Self Storage Company 8 Limited Self storageBig Yellow Self Storage Company A Limited Self storageBig Yellow Self Storage Company M Limited Self storageBYRCo Limited Property managementBYSSCo A Limited Self storageBYSSCo Limited Self storageBYSSCo M Limited DormantLast Mile Company Limited Holding CompanySilicon Investments Limited DormantSpeed 8546 Limited Dormant
In addition the Group has a 100% interest in Pramerica Bell Investment Trust Jersey, a trust registered in Jersey.
The Group has a 20% interest in two associates, and the companies are incorporated, registered and operate in England and Wales. The Company’sassociates at 31 March 2016 are listed below:
Name of associate Principal activity
Armadillo Storage Holding Company Limited Self StorageArmadillo Storage Holding Company 2 Limited Self Storage
30. TRADE AND OTHER RECEIVABLES31 March 31 March
2016 2015£000 £000
Amounts owed by Group undertakings 528,015 606,001Prepayments and accrued income 110 103
528,125 606,104
Notes to the Financial Statements (continued)Year ended 31 March 2016
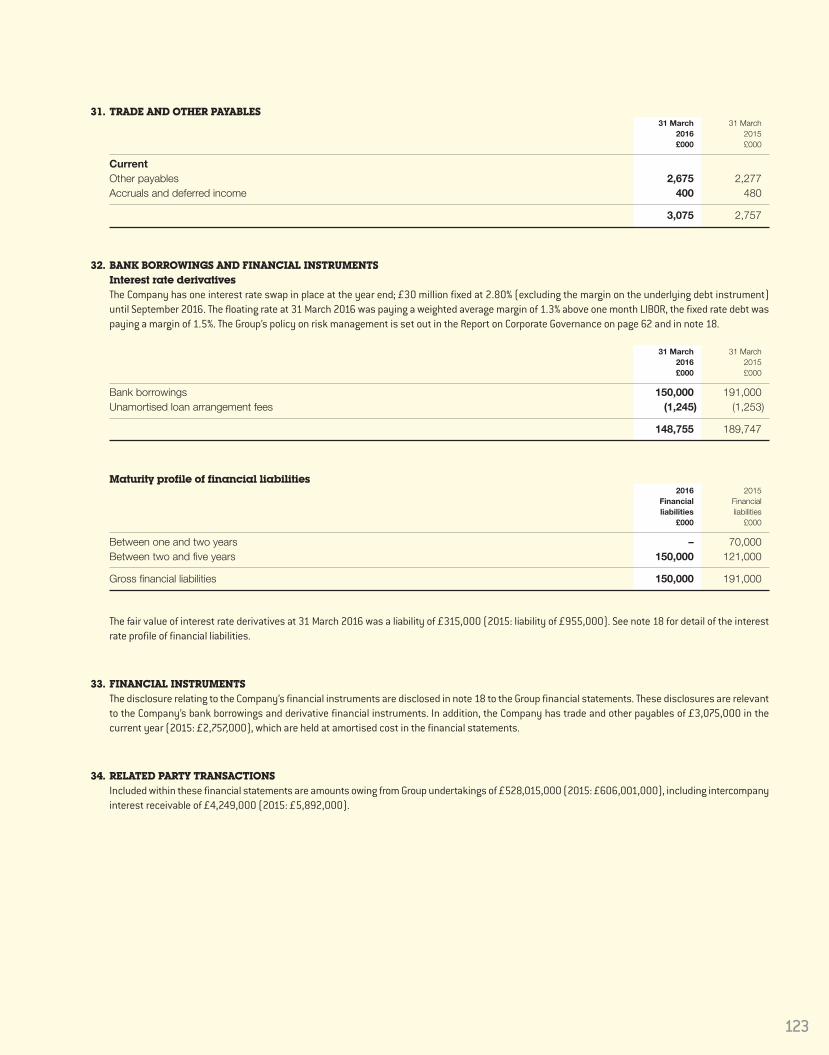
123
31. TRADE AND OTHER PAYABLES31 March 31 March
2016 2015£000 £000
CurrentOther payables 2,675 2,277Accruals and deferred income 400 480
3,075 2,757
32. BANK BORROWINGS AND FINANCIAL INSTRUMENTSInterest rate derivativesThe Company has one interest rate swap in place at the year end; £30 million fixed at 2.80% (excluding the margin on the underlying debt instrument)until September 2016. The floating rate at 31 March 2016 was paying a weighted average margin of 1.3% above one month LIBOR, the fixed rate debt waspaying a margin of 1.5%. The Group’s policy on risk management is set out in the Report on Corporate Governance on page 62 and in note 18.
31 March 31 March2016 2015£000 £000
Bank borrowings 150,000 191,000Unamortised loan arrangement fees (1,245) (1,253)
148,755 189,747
Maturity profile of financial liabilities2016 2015
Financial Financialliabilities liabilities
£000 £000
Between one and two years – 70,000Between two and five years 150,000 121,000
Gross financial liabilities 150,000 191,000
The fair value of interest rate derivatives at 31 March 2016 was a liability of £315,000 (2015: liability of £955,000). See note 18 for detail of the interestrate profile of financial liabilities.
33. FINANCIAL INSTRUMENTSThe disclosure relating to the Company’s financial instruments are disclosed in note 18 to the Group financial statements. These disclosures are relevantto the Company’s bank borrowings and derivative financial instruments. In addition, the Company has trade and other payables of £3,075,000 in thecurrent year (2015: £2,757,000), which are held at amortised cost in the financial statements.
34. RELATED PARTY TRANSACTIONSIncluded within these financial statements are amounts owing from Group undertakings of £528,015,000 (2015: £606,001,000), including intercompanyinterest receivable of £4,249,000 (2015: £5,892,000).
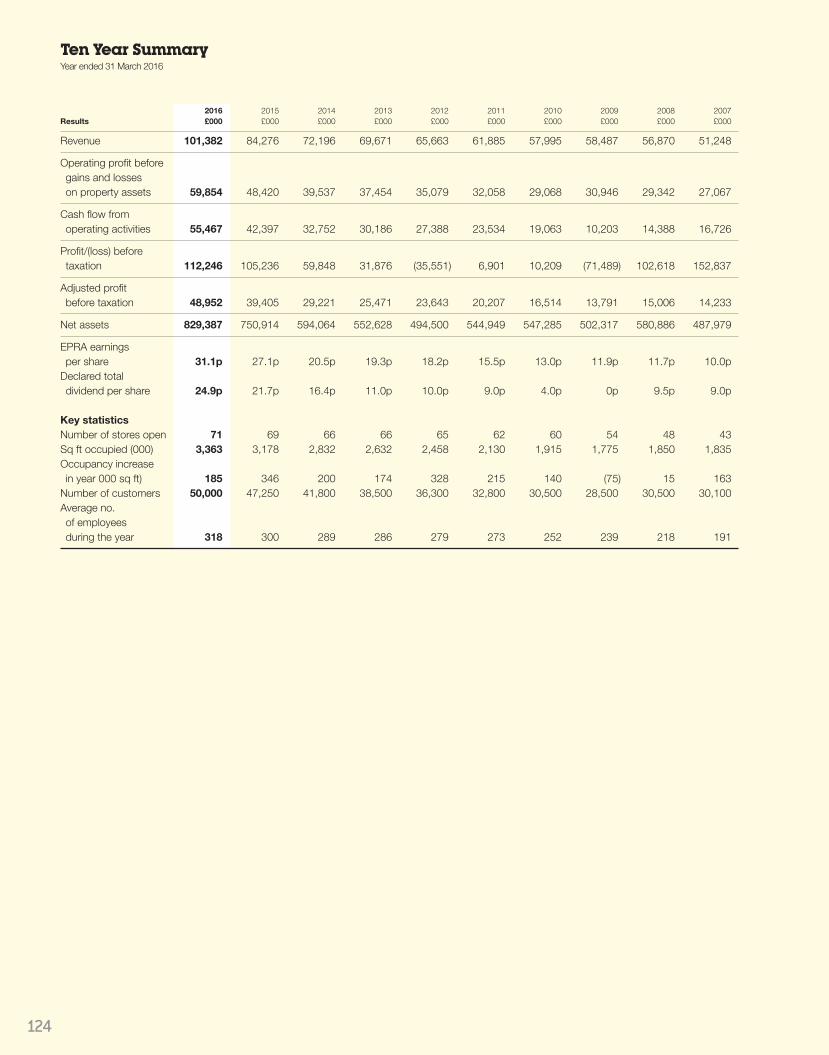
124
Ten Year SummaryYear ended 31 March 2016
2016 2015 2014 2013 2012 2011 2010 2009 2008 2007Results £000 £000 £000 £000 £000 £000 £000 £000 £000 £000
Revenue 101,382 84,276 72,196 69,671 65,663 61,885 57,995 58,487 56,870 51,248
Operating profit before gains and losses on property assets 59,854 48,420 39,537 37,454 35,079 32,058 29,068 30,946 29,342 27,067
Cash flow from operating activities 55,467 42,397 32,752 30,186 27,388 23,534 19,063 10,203 14,388 16,726
Profit/(loss) before taxation 112,246 105,236 59,848 31,876 (35,551) 6,901 10,209 (71,489) 102,618 152,837
Adjusted profit before taxation 48,952 39,405 29,221 25,471 23,643 20,207 16,514 13,791 15,006 14,233
Net assets 829,387 750,914 594,064 552,628 494,500 544,949 547,285 502,317 580,886 487,979
EPRA earnings per share 31.1p 27.1p 20.5p 19.3p 18.2p 15.5p 13.0p 11.9p 11.7p 10.0pDeclared total dividend per share 24.9p 21.7p 16.4p 11.0p 10.0p 9.0p 4.0p 0p 9.5p 9.0p
Key statisticsNumber of stores open 71 69 66 66 65 62 60 54 48 43Sq ft occupied (000) 3,363 3,178 2,832 2,632 2,458 2,130 1,915 1,775 1,850 1,835Occupancy increase in year 000 sq ft) 185 346 200 174 328 215 140 (75) 15 163Number of customers 50,000 47,250 41,800 38,500 36,300 32,800 30,500 28,500 30,500 30,100Average no. of employees during the year 318 300 289 286 279 273 252 239 218 191

The paper used in this report is produced with FSC® mixed sources pulp which is partially recyclable, biodegradable, pH Neutral, heavy metal absence and acid-free. It is manufactured within a mill which complies with the international environmental ISO 14001 standard.
Pureprint Ltd is FSC certified, PEFC certified and ISO 14001 certified showing that it is committed to all round excellence and improving environmental performance is an important part of this strategy. We aim to reduce at source the effect our operations have on the environment, and are committed to continual improvement, prevention of pollution and compliance with any legislation or industry standards.
Pureprint Ltd is a Carbon Neutral® Printing Company.
Designed and produced by MAGEEwww.magee.co.uk
Printed by Pureprint Ltd

Big Yellow Group PLC
2 The Deans, Bridge Road,Bagshot, Surrey GU19 5AT
Tel: 01276 470190Fax: 01276 470191e-mail: [email protected]
bigyellow.co.uk
You can accessmore information about us on our website
Big Yellow Group PLC
Annual Report & Accounts 2016
Get some space in your life.™
Big Yellow
Group
PLC A
nnual Report &
Accounts 2016Thinking about
our CustomersIt’s the reason we exist
Thinking aboutour CustomersIt’s the reason we exist
At Big Yellow we believe storage
should be the easy bit
Welcome
to th
e U
K’s
bra
nd
lea
der
inself storage