hsbc trade research · • company turnover limit : usd 5 mn or more, except indonesia ... it is a...
TRANSCRIPT

HSBC Trade Research
Global report
February 2018

Table of contents
2
Introduction 03
Theme 1: Overall outlook and evolution ‘winds of change’, growth strategies and challenges 06
Chapter 1: Future Outlook 07
Chapter 2: The Growth/Status Of Trade In Services 15
Chapter 3: The Need For Trade Finance/Access To Trade Finance 29
Chapter 4: The Growth And Impact Of Protectionism/Regulation 41
Chapter 5: The Growth And Impact Of Data Security/A More Level Playing Field Or Dangerous Territory 81
Updated

Introduction
3

4
Sample & methodology notes
• Total global sample : 6033
• Survey method : Online self administered interview – 21 markets
: Computer assisted telephone interview – 3 markets
: Pen & paper personal interview – 1 market
: Offline computer assisted personal interview – 1 market
• Company turnover limit : USD 5 mn or more,
except Indonesia (USD 1.75 mn or more), Bangladesh and
Ireland (USD 2.5 mn or more), Vietnam (USD 3.5 mn or more),
and Argentina (USD 3.5 mn or more)
• Corporates limit : USD 50 mn or more,
except Indonesia (USD 16.5 mn or more), Bangladesh (USD 25
mn or more), Argentina and Vietnam (USD 40 mn or more),
Egypt and Saudi Arabia (USD 45 mn or more)
• Results in this report have been weighted to be representative of the universe of annual
turnover taking into account the contribution of services & goods businesses according to
WTO data for 2016.
Introduction to the trade survey: content, sample and methodology
Who is surveyed?
Key decision makers or those having
significant input into the decision making
process in eligible companies.
A total of 26 markets were surveyed.
Countries surveyed
• Europe: France, Germany, Ireland,
Netherlands, Poland, UK, Czech Republic
• Asia Pacific: Australia, Bangladesh, China,
Hong Kong, India, Indonesia, Malaysia,
Singapore, South Korea, Thailand, Vietnam
• MENA: Egypt, Saudi Arabia, UAE
• North America: USA, Canada, Mexico
• South America: Argentina
Fieldwork for the survey happened in
December 2017 – January 2018.
What is the trade survey?
It is a global survey sponsored by HSBC.
The study gauges sentiment and
expectations of the businesses in the
near to mid term future, and covers the
following areas:
1. General trade outlook
2. Trade in services
3. Supply chain
4. Trade policies
5. Trade finance
6. Benefits of trade

Industry Sector
5
Introduction to the trade survey: global sample structure
Results in this report have been weighted to be representative of the universe of annual turnover
taking into account the contribution of services & goods businesses according to WTO data for 2016.
Global sample structure (%)
Size
International67
Domestic33
Domestic/International Trade
BB
57
Corporates43
Regions
APAC46
EU (including UK)27
North America,
12
MENA, 12
South America, 3
Services43
Manufacturing/Mining/Oil,
24
Wholesale/Retail Trading
14
Construction, 14
Agriculture/Fishing/Forestry, 5
Emergin
g61
Developed39
DevelopmentTrade Bloc
N=
APAC 2757
EU (including UK) 1626
North America 750
MENA 700
South America 200
N=
RCEP 2206
EU (including UK) 1626
CPTPP 1150
ASEAN 956
NAFTA 750
N=
Services 2574
Manufacturing/Mining/Oil 1473
Wholesale/Retail Trading 866
Construction 823
Agriculture/Fishing/Forestry 297
N=
Emerging 3657
Developed 2376
N=
International 4019
Domestic 2014
N=
BB 3428
Corporates 2605
Country sample structure refers to the percentage of
respondents in each group mentioned.
Global sample structure (N=#)
RCEP: Australia, China, India, Indonesia, Malaysia, Singapore, South Korea, Thailand, Vietnam
37
27
1916
12

Theme 1Overall outlook and evolution ‘winds of change’, growth strategies
and challenges
6

Future Outlook
Chapter 1
7

Trade outlook for 2018 and beyond is highly positive with APAC and Europe as the strongest growth
regions and with most trade today being conducted within their home region, a pattern projected to
continue
8
The overall outlook for international trade is highly positive with more than three quarters of businesses who are trading internationally projecting growth. This is stronger
amongst corporates, manufacturing businesses, those in emerging markets and those in the RCEP trading bloc. The latter two are likely to have more room for growth.
Within APAC, four countries – Bangladesh, India, Thailand and Vietnam – are projecting growth in excess of ninety percent.
There are three consistent and almost equal drivers of this projected growth. A favourable economic environment, creating the right conditions; greater use of technology,
which acts as an enabler, and customer demand. Greater use of technology is relatively more important for corporates, international businesses and those in emerging
markets. Looking at the three markets with the highest growth projections, Bangladesh and Vietnam see the favourable economic environment as being most important
while for India, it is technology.
Current trade flows show that, in all regions, trade within the ‘home’ region dominates. For Europe and APAC, it accounts for three quarters of current trading partners; in
Central and South America, it accounts for two-thirds and in NAM and MENA it is around half. Outside Europe, and with the exception of Central and South America where
it is North America, Europe is the next most significant trading partner.
APAC is projected to be the strongest area for growth across the world in the next three to five years and Europe to be the second most important. The projected growth in
trade with both regions is expected to be in excess of forty percent and this compares to just over twenty five percent for NAM.
RCEP: Australia, China, India, Indonesia, Malaysia, Singapore, South Korea, Thailand, Vietnam

Trade outlook
9
77%Expect an increase in trade volume (Q14)
Countries with the
most positive
outlook – top 3
Regions
Argentina/South America 84%
Asia Pacific 82%
North America 77%
MENA 75%
Europe 71%
Trade Blocs
RCEP 84%
ASEAN 80%
CPTPP 77%
NAFTA 77%
EU (including UK) 71%
EU (excluding UK) 71%
Countries with the
least positive
outlook – top 3
Base: GLOBAL; Businesses with international trade N=4019
• Region: Argentina/South America n=105, Asia Pacific n=1887, North America n=459,
• MENA n=453, Europe n=880
• Trade Bloc: RCEP n=1477, ASEAN n=630, CPTPP P n=750, NAFTA n=459, EU
(including UK) n=1115, EU (excluding UK) n=880
Thailand 92%
India 94%
Czech Republic 66% France 66%
South Korea 66%
Emerging/Developed countries
Emerging 82%
Developed 73%
Size of company
Business Banking 72%
Corporates 81%
Bangladesh 96%
• Development: Emerging n=2438, Developed n=1581
• Size: Business Banking n=3428, Corporates n=2605
• Industry Sector: Services n=1631, Non-services
n=2388 (Wholesale/ Retail Trading n=580, Construction
n=501, Manufacturing n=1119, Agriculture n=188)
Significantly higher than Global average
Significantly lower than Global average
Industry Sectors
Services 74%
Non-Services 79%
Wholesale / Retail Trading 77%
Construction 76%
Manufacturing / Mining / Oil 81%
Agriculture / Fishing / Forestry 74%
Over three quarters of businesses are projecting increases in their trade volume; Corporates are more
bullish than BBs and businesses in the Indian sub-continent and Thailand are the most optimistic
RCEP: Australia, China, India, Indonesia, Malaysia,
Singapore, South Korea, Thailand, Vietnam

Bangladesh India Thailand Vietnam China Malaysia Mexico Argentina Turkey Poland USA UAE Egypt Indonesia Australia Germany Canada UK Netherlands Ireland Singapore Hong KongSaudi
Arabia
South
KoreaFrance
Czech
Republic
The smallest differences between overall trade and services growth projections are seen in APAC in
Singapore, Bangladesh, Thailand and India and the biggest in European countries
Trade outlook
10
96 9492 90 89 88 87
8481
78 77 77 76 74 73 73 72 72 71 71 70 69 67 66 66 66
91
8184
7874 74
69 68
6156 57
62 62 6159
51
5753 53
43
67
5458
5451
33
Expect an increase in trade volume (%)
Expect an increase in the volume of trade in services (%)
77%Expect an increase in trade volume (%) (Q14)
Base: GLOBAL; Businesses with international trade N=4019
Q14: How would you expect the business performance of your company to change in the
next 12 months?
Significantly higher than Global average
Significantly lower than Global average
61%Expect an increase in the volume of trade in services (%) (Q23)
Q23: Thinking specifically about services, how do you expect the volume of your
import/export of services to change in the next 12 months?

Top driver of growth Second driver of growth Third driver of growth
GLOBAL
Asia PacificFavourable economic
environment31%
Increasing demand for your
product30% Greater use of technology 23%
EuropeIncreasing demand for your
product35%
Favourable economic
environment35% Availability of skilled labour 24%
North AmericaIncreasing demand for your
product36%
Favourable economic
environment28% Greater use of technology 22%
Argentina/ South AmericaFavourable economic
environment34%
Favourable political
environment30%
Increasing demand for your
product25%
MENAFavourable economic
environment28%
Increasing demand for your
product26% Affordability of labour 24%
11
Trade outlook - Drivers of growth of trade (by region)
Increasing demand for your
product
33%
Favourable economic
environment
31%Greater use of technology
22%
Drivers of growth of trade (Q13)
Base: GLOBAL, N=3459
• Region: Asia Pacific n=1672, Europe n=916, North America n=416, Argentina/ South
America n=104, MENA n=351Significantly higher than Global average
Significantly lower than Global average
Q13: Please tick the 3 most important factors for your business that will drive growth in imports/exports in the next 12
months. Rank 1 to 3, with 1 being the most important driver of growth.
Increasing demand engendered by favourable economic and political environments are the leading
drivers of growth but greater use of technology and appropriate labour are important further enablers

Top driver of growth Second driver of growth Third driver of growth
GLOBAL
Top 10 markets indicating … Ireland 54% Czech Republic 53% Singapore 29%
South Korea 45% Bangladesh 51% India 28%
Vietnam 40% Vietnam 42% Mexico 28%
Poland 39% Malaysia 40% Turkey 28%
Bangladesh 39% Ireland 39% UAE 27%
USA 38% Hong Kong 37% UK 26%
Germany 37% Germany 37% South Korea 25%
Canada 36% Turkey 37% Poland 25%
Czech Republic 36% France 36% Hong Kong 25%
Malaysia 34% Argentina 34% Thailand 24%
12
Drivers of growth of trade – By country
Trade outlook - Drivers of growth of trade
Significantly higher than Global average
Significantly lower than Global average
Base: GLOBAL, N=3459
Drivers of growth of trade (Q13)
Q13: Please tick the 3 most important factors for your business that will drive growth in imports/exports in the next 12
months. Rank 1 to 3, with 1 being the most important driver of growth.
Increasing demand for your
product
33%
Favourable economic
environment
31%Greater use of technology
22%

Top Driver Second Driver Third Driver
GLOBAL
Emerging/Developed countries
EmergingFavourable economic
environment30%
Increasing demand for your
product30% Greater use of technology 24%
DevelopedIncreasing demand for your
product36%
Favourable economic
environment32%
Favourable political
environment21%
Size of company
Business BankingIncreasing demand for your
product32%
Favourable economic
environment31%
Decreasing costs of
shipping, logistics & storage23%
CorporatesIncreasing demand for your
product33%
Favourable economic
environment31% Greater use of technology 23%
Domestic/International operator
DomesticIncreasing demand for your
product31%
Favourable economic
environment30% Availability of skilled labour 23%
InternationalIncreasing demand for your
product34%
Favourable economic
environment31% Greater use of technology 22%
13
Base: GLOBAL n=3459
• Development: Emerging n=2103, Developed n=1356,
• Size: Business Banking n=2010, Corporates n=1449,
• Domestic n=1071, International n=2388
Drivers of growth of trade (Q13)
Trade outlook - Drivers of growth of trade (by market development, size and international trading or not)
Significantly higher than Global average
Significantly lower than Global average
Q13: Please tick the 3 most important factors for your business that will drive growth in imports/exports in the next 12 months. Rank 1 to 3, with 1 being the most important driver of growth.
There are only small differences across business type or location although corporates, international and
emerging market businesses are making greater use of technology to drive growth
Increasing demand for your
product
33%
Favourable economic
environment
31%Greater use of technology
22%

14
Global Europe Asia Pacific North AmericaMiddle east & North
Africa
Argentina / South
America
Current
partners
Growth
Markets
Current
partners
Growth
Markets
Current
partners
Growth
Markets
Current
partners
Growth
Markets
Current
partners
Growth
Markets
Current
partners
Growth
Markets
Europe 54 % 41 % 74 % 54 % 44 % 36 % 48 % 31 % 45 % 44 % 39 % 20 %
Asia Pacific 51 % 44 % 30 % 26 % 74 % 68 % 43 % 33 % 39 % 33 % 24 % 15 %
North
America40 % 26 % 29 % 19 % 44 % 29 % 52 % 33 % 18 % 14 % 49 % 28 %
Middle East
& North
Africa15 % 12 % 14 % 12 % 12 % 10 % 10 % 7 % 55 % 47 % 9 % 5 %
Central &
South
America13 % 13 % 10 % 10 % 10 % 11 % 23 % 21 % 4 % 6 % 65 % 60 %
Rest of
Africa1 % 2 % 1 % 1 % 0 % 0 % 3 % 3 % 4 % 4 % 0 % 1 %
Don’t know 1 % 15 % 2 % 19 % 0 % 7 % 3 % 24 % 2 % 13 % 2 % 20 %
More than half, and almost three quarters in Europe and APAC, of businesses’ trade is currently within
their own region. Strongest future growth focus is projected to follow the same pattern in all regions
Trade outlook - Trade flows
Trading partners & growth markets (Q11 & Q12)
Base: GLOBAL (Question on current trading partners); Businesses with international trade N=4019
• Region: Asia Pacific n=1887, Europe n=1115, North America n=459, Argentina/ South America n=105, MENA n=453
• GLOBAL (Question on growth markets); N=6033,
• Region: Asia Pacific n=2757, Europe n=1626, North America n=750, Argentina/ South America n=200, MENA n=700
Q11: Which are the top 3 countries with which you currently conduct most of your business with?
Q12: Which are the top 3 countries with which your business will look to expand in the next 3 – 5 years?
Significantly higher than Global average
Significantly lower than Global average

The Growth/Status Of Trade In Services
Chapter 2
15

Trade in services outlook for 2018 is positive but slightly weaker, especially in developed markets, than
overall trade; expansion into new markets is the primary growth strategy for all.
16
The outlook for trade in services is positive but behind that for overall trade. Just over sixty percent are projected growth compared to over three quarters for international
trade overall. Businesses in the ASEAN and RCEP trading blocs are projecting the highest growth, in excess of seventy percent and Bangladesh, Thailand and India are
projecting growth of over eighty percent. The difference in the projected growth for services between the emerging and developed markets (69% and 53%) is almost
double than it is for trade overall (82% compared to 73%).
The growth drivers for trade in services are very similar to those for trade overall but greater use of technology is relatively more important for services. This is most
evident in Singapore, where approaching half of businesses say that it is the most important factor. Demand is a stronger driver in APAC and a favourable economic
environment is important for more than half of businesses in Vietnam and Argentina. A favourable economic environment is relatively more important for emerging rather
than developed markets (33% compared to 26%) and the reverse is true for technology (28% compared to 32%). In a similar way, the economic environment is relatively
more important for international rather than domestic businesses (31% compared to 27%) and conversely demand is relatively more important for domestic businesses
(36% compared to 29%). Overall all three lead drivers are of equal importance.
There is broad consensus on the top three barriers. Two, negative changes in the economic or the political environment, are outside the control of businesses and the
third, higher labour costs is likely to be driven by external factors too. In Europe and North America, negative changes in the political environment are the potential barrier
while in APAC and MENA, changes in the economic environment are the concern. High labour costs are the highest concern in North America and for domestic businesses
but are not identified in the top three potential barriers in Europe or by international businesses. For both corporates and international businesses, uncertainties about
global trade policies are their primary or secondary concern.
There is complete consensus that expanding into new markets is the primary growth strategy. This is particularly seen in Bangladesh, where it is identified by almost three
quarters of businesses, and in Vietnam, Mexico, Saudi Arabia, Argentina and Turkey, where it is identified by around half of businesses. Diversification and greater use of
e-commerce are the next and equally important growth strategies; e-commerce is relatively more important in APAC and particularly in Singapore, where it is the primary
strategy, mentioned by almost two-fifths of businesses. It is relatively higher on the agenda for corporates, international businesses and those based in emerging markets.
Diversification is considered most important in Bangladesh where it is mentioned by two-thirds of businesses and is relatively more important for BBs and domestic
businesses and those in developed markets.RCEP: Australia, China, India, Indonesia, Malaysia, Singapore, South Korea, Thailand, Vietnam

Trade in services outlook
17
61%Expect an increase in the volume of trade in services (Q23)
Regions
Asia Pacific 69 %
Argentina/ South America 68 %
MENA 61 %
North America 59 %
Europe 51 %
Trade Blocs
ASEAN 73 %
RCEP 71 %
CPTPP 66 %
NAFTA 59 %
EU (with UK) 51 %
EU (without UK) 51 %
Countries with the
least positive
outlook – top 3
Countries with the
most positive
outlook – top 3
Thailand 84%
Bangladesh 91%
India 81%
Czech Republic 33%
Germany 51%
Ireland 43%
France 51%
Emerging/Developed countries
Emerging 69%
Developed 53%
Size of company
Business Banking 56%
Corporates 66%
Domestic/International operator
Domestic 55%
International 63%
Base: GLOBAL; Businesses with sales turnover from services N=5196
• Region: Asia Pacific n=2417 , Argentina/ South America n=159, MENA n=634, North
America n=613, Europe n=1373
• Trade Bloc: ASEAN n=811, RCEP n=1942, CTPP n=1003, NAFTA n=613, EU (with
UK) n=1373, EU (without UK) n=1070
GLOBAL
• Development: Emerging n=3216, Developed n=1980
• Size: Business Banking n=2883, Corporates n=2313
• Domestic=1659, International n=3537
Significantly higher than Global average
Significantly lower than Global average
The outlook for trade in services is notably higher in the APAC region.
RCEP: Australia, China, India, Indonesia, Malaysia, Singapore, South Korea, Thailand, Vietnam

18
61%Expect an increase in the volume of trade in services (%) (Q23)
Trade in services outlook
Bangladesh Thailand India Vietnam Malaysia China Mexico Argentina Singapore Egypt UAE Turkey Indonesia AustraliaSaudi
ArabiaUSA Canada Poland Hong Kong
South
KoreaNetherlands UK Germany France Ireland
Czech
Republic
91
8481
7874 74
69 68 6762 62 61 61
59 58 57 57 5654 54 53 53 51 51
43
33
Base: GLOBAL; Businesses with sales turnover from services N=5196
Q23: Thinking specifically about services, how do you expect the volume of your
import/export of services to change in the next 12 months? Significantly higher than Global average
Significantly lower than Global average
The range of growth projections for trade in services is almost twice that for trade overall; European
markets expect a lower than average increase in services trade

Bangladesh India Thailand Vietnam China Malaysia Mexico Argentina Turkey Poland USA UAE Egypt Indonesia Australia Germany Canada UK Netherlands Ireland Singapore Hong KongSaudi
Arabia
South
KoreaFrance
Czech
Republic
The smallest differences between overall trade and services growth projections are seen in APAC in
Singapore, Bangladesh, Thailand and India and the biggest in European countries
Trade outlook
19
96 9492 90 89 88 87
8481
78 77 77 76 74 73 73 72 72 71 71 70 69 67 66 66 66
91
8184
7874 74
69 68
6156 57
62 62 6159
51
5753 53
43
67
5458
5451
33
Expect an increase in trade volume (%)
Expect an increase in the volume of trade in services (%)
77%Expect an increase in trade volume (%) (Q14)
Base: GLOBAL; Businesses with international trade N=4019
Q14: How would you expect the business performance of your company to change in the
next 12 months?
Significantly higher than Global average
Significantly lower than Global average
61%Expect an increase in the volume of trade in services (%) (Q23)
Q23: Thinking specifically about services, how do you expect the volume of your
import/export of services to change in the next 12 months?

South America APAC North America MENA Europe (with UK) RCEP ASEAN CPTPP NAFTA EU (with UK) EU (without UK) Emerging Developed Corporates BB
Regions Trade Blocs Emerging / Developed Countries Size of Company
The smallest differences between overall trade and services growth projections are seen in APAC and the
biggest in Europe (followed by North America); or NAFTA; or developed markets
Trade outlook
20
84 8277
7571
8480
77 77
71 71
82
73
81
72
68 69
59 61
51
71 73
66
59
51 51
69
53
66
56
Expect an increase in trade volume (%)
Expect an increase in the volume of trade in services (%)
77%Expect an increase in trade volume (%) (Q14)
Base: GLOBAL; Businesses with international trade N=4019; Base: GLOBAL; Businesses with sales turnover from services N=5196
Q14: How would you expect the business performance of your company to change in the
next 12 months?
Significantly higher than Global average
Significantly lower than Global average
61%Expect an increase in the volume of trade in services (%) (Q23)
Q23: Thinking specifically about services, how do you expect the volume of your
import/export of services to change in the next 12 months?RCEP: Australia, China, India, Indonesia, Malaysia, Singapore, South Korea, Thailand, Vietnam

Top Driver Second Driver Third Driver
GLOBAL
Asia PacificFavourable economic
environment33%
Increasing demand for
services30% E-commerce growth 29%
EuropeIncreasing demand for
services33% Greater use of technology 31%
Favourable economic
environment28%
North America Greater use of technology 35%Increasing demand for
services33% E-commerce growth 27%
Argentina/ South AmericaFavourable economic
environment51%
Increasing demand for
services40%
Favourable political
environment38%
MENAIncreasing demand for
services29%
Favourable economic
environment29% Greater use of technology 26%
21
Increasing demand for services
31%
Favourable economic
environment
30%Greater use of technology
30%
Drivers of growth of trade in services (Q24)
Trade in services outlook - Drivers of growth of trade (by region)
Base: GLOBAL, Businesses expecting growth in services trade outlook N=3520
• Region: Asia Pacific n=1837, Europe n=758, North America n=401, Argentina/ South
America n=115, MENA n=409 Significantly higher than Global average
Significantly lower than Global averageQ24: Please tick the 3 most important factors for your business that will drive growth in imports/exports of services in the
next 12 months. Rank 1 to 3, with 1 being the most important driver of growth.
Technology and e-commerce are key drivers of growth of trade in services in NAM.

Top Driver Second Driver Third Driver
GLOBAL
Top 10 markets indicating … Vietnam 44% Vietnam 60% Singapore 42%
Poland 41% Argentina 51% Mexico 38%
Bangladesh 41% Bangladesh 43% Netherlands 36%
South Korea 40% Netherlands 39% USA 35%
Argentina 40% Egypt 37% Argentina 34%
Mexico 35% Hong Kong 36% South Korea 34%
Hong Kong 35% Saudi Arabia 36% UAE 34%
UK 35% China 35% India 33%
Netherlands 35% Singapore 34% UK 33%
Egypt 34% Ireland 34% Ireland 32%
22
Increased demand and a favourable economic environment are both much more significant drivers for
businesses in Vietnam and Bangladesh, two of the top five countries projecting services growth
Trade in services outlook - Drivers of growth of trade
Significantly higher than Global average
Significantly lower than Global average
Base: GLOBAL, Businesses expecting growth in services trade outlook N=3520
Q24: Please tick the 3 most important factors for your business that will drive growth in imports/exports of services in the
next 12 months. Rank 1 to 3, with 1 being the most important driver of growth.
Drivers of growth of trade in services (Q24)
Note : Czech Republic excluded here since it has sample lower than 30.
Increasing demand for services
31%
Favourable economic
environment
30%Greater use of technology
30%

Top Driver Second Driver Third Driver
GLOBAL
Emerging/Developed countries
EmergingFavourable economic
environment33%
Increasing demand for
services30% Greater use of technology 28%
DevelopedIncreasing demand for
services33% Greater use of technology 32%
Favourable economic
environment26%
Size of company
Business BankingIncreasing demand for
services33%
Favourable economic
environment31% Greater use of technology 30%
Corporate Greater use of technology 30%Increasing demand for
services30%
Favourable economic
environment29%
Domestic/International operator
DomesticIncreasing demand for
services36% Greater use of technology 28%
Favourable economic
environment27%
InternationalFavourable economic
environment31% Greater use of technology 31%
Increasing demand for
services29%
23
Drivers of growth of trade in services (Q24)
Base: GLOBAL, Businesses expecting growth in services trade outlook N=3520
• Development: Emerging n=2376, Developed n=1144
• Size: Business Banking n=1905, Corporates n=1615
• Domestic=1091, International n=2429
Trade in services outlook - Drivers of growth of trade (by market development, size and international trading or not)
Significantly higher than Global average
Significantly lower than Global averageQ24: Please tick the 3 most important factors for your business that will drive growth in imports/exports of services in the next 12 months. Rank 1 to 3, with 1 being the most important driver of growth.
The top three drivers are universal; a favourable economic environment is the lead driver for international
and emerging market businesses, greater use of technology has increased in importance for all
Increasing demand for services
31%
Favourable economic
environment
30%Greater use of technology
30%

Top Barriers Second Barriers Third Barriers
GLOBAL
Asia PacificNegative changes in the
economic environment41% Higher labour costs 31%
Unfavourable exchange
rate29%
EuropeNegative changes in the
political environment32%
Stronger competition/ price
erosion29%
Reduction in consumer
demand29%
North America Higher labour costs 34%Global trade policy
uncertainties31%
Negative changes in the
political environment31%
Argentina/ South America #Reduction in consumer
demand43%
Stricter regulations on cross
border data movement31%
Negative changes in the
political environment29%
MENANegative changes in the
economic environment35%
Stronger competition/ price
erosion33% Higher labour costs 31%
24
Negative changes in the
economic environment
30%Higher labour costs
27%
Negative changes in the
political environment
26%
Barriers of growth of trade in services (Q25)
Base: GLOBAL, Businesses expecting decline in services trade outlook N=351
• Region: Asia Pacific n=117, Europe n=115, North America n=35, Argentina/ South
America n=14, MENA n=70 24Significantly higher than Global average
Significantly lower than Global averageQ25: Please tick the 3 main barriers for your services business in the next 12 months? Rank 1 to 3, with 1 being the main
barrier to your services business.
# Caution extremely low sample: Base < 30
And data are not shown
Trade in services outlook - Barriers of growth of trade in services (by region)
Negative changes in the political/economic environment will act as brake on growth but high labour costs
could undermine growth if there is strong competition and consequent price erosion

Top Barriers Second Barriers Third Barriers
GLOBAL
Emerging/Developed countries
EmergingNegative changes in the
economic environment36% Higher labour costs 31%
Unfavourable exchange
rates30%
DevelopedNegative changes in the
political environment31%
Lack/shortage of skilled
labour27%
Global trade policy
uncertainties26%
Size of company
Business BankingNegative changes in the
economic environment35%
Reduction in consumer
demand26%
Negative changes in the
political environment25%
CorporateGlobal trade policy
uncertainties31%
Lack/shortage of skilled
labour31% Higher labour costs 30%
Domestic/International operator
Domestic Higher labour costs 33%Negative changes in the
political environment29%
Negative changes in the
economic environment29%
InternationalNegative changes in the
economic environment30%
Global trade policy
uncertainties29%
Negative changes in the
political environment25%
25
Barriers of growth of trade in services (Q25)
Base: GLOBAL, Businesses expecting decline in services trade outlook N=351
• Development: Emerging n=202, Developed n=149
• Size: Business Banking n=226, Corporates n=125
• Domestic=89, International n=262 25
Trade in services outlook - Barriers of growth of trade in services (by market development, size and international trading or
not)
Significantly higher than Global average
Significantly lower than Global averageQ25: Please tick the 3 main barriers for your services business in the next 12 months? Rank 1 to 3, with 1 being the main barrier to your services business.
For corporates, international and mature market businesses, global trade policy uncertainties can
undermine growth. High labour costs are a bigger threat for domestic and emerging market businesses
Negative changes in the
economic environment
30%Higher labour costs
27%
Negative changes in the
political environment
26%

Top Approach Second Approach Third Approach
GLOBAL
Asia Pacific Entering new markets 30%Increasing use of e-
commerce27% Entering new service areas 25%
Europe Entering new markets 29% Entering new service areas 23%Increasing use of e-
commerce20%
North America Entering new markets 35% Better use of data capability 25%Increasing use of e-
commerce25%
Argentina/ South America Entering new markets 47% Entering new service areas 30%Providing value added
services to your products29%
MENA Entering new markets 40% Entering new service areas 23%
Upscaling digital/
technological capability of
your employees
21%
26
Entering new markets
32%Increasing use of e-commerce
24%Entering new service areas
24%
Approach to growth of services businesses (Q26)
Base: GLOBAL, Businesses expecting growth in services trade outlook N=3520
• Region: Asia Pacific n=1837, Europe n=758, North America n=401, Argentina/ South
America n=115, MENA n=409Significantly higher than Global average
Significantly lower than Global averageQ26: Which of the following ways do you plan to grow your service business? Please select up to 3.
Trade in services outlook - Approach to growth of services businesses (by region)
Expansion into new markets is the primary growth strategy followed by diversification into new services
areas. Increasing use of e-commerce is an important enabler.

Top Approach Second Approach Third Approach
GLOBAL
Top 10 markets indicating … Bangladesh 73% Singapore 39% Bangladesh 65%
Vietnam 57% Malaysia 33% Vietnam 32%
Mexico 48% Egypt 30% Argentina 30%
Saudi Arabia 47% China 30% Saudi Arabia 29%
Argentina 47% India 28% Germany 29%
Turkey 45% Ireland 27% Egypt 27%
Malaysia 41% USA 26% Poland 27%
Hong Kong 39% Mexico 24% UK 27%
Singapore 36% UK 24% China 25%
Egypt 36% Germany 24% India 25%
27
Expansion into new markets is the dominant strategy for growing service businesses, increasing use of
e-commerce is just ahead in Singapore and diversification an important secondary driver in Bangladesh
Trade in services outlook - Approach to growth of services businesses
Significantly higher than Global average
Significantly lower than Global average
Base: GLOBAL, Businesses expecting growth in services trade outlook N=3520
Approach to growth of services businesses (Q26)
Q26: Which of the following ways do you plan to grow your service business? Please select up to 3.
Note : Czech Republic excluded here since it has sample lower than 30.
Entering new markets
32%Increasing use of e-commerce
24%Entering new service areas
24%

Top Approach Second Approach Third Approach
GLOBAL
Emerging/Developed countries
Emerging Entering new markets 33%Increasing use of e-
commerce26% Entering new service areas 25%
Developed Entering new markets 31% Entering new service areas 23%Increasing use of e-
commerce22%
Size of company
Business Banking Entering new markets 33% Entering new service areas 25%Increasing use of e-
commerce23%
Corporate Entering new markets 31%Increasing use of e-
commerce26%
Providing value added
services to your products23%
Domestic/International operator
Domestic Entering new markets 29% Entering new service areas 27% Better use of data capability 24%
International Entering new markets 33%Increasing use of e-
commerce25% Entering new service areas 23%
28
Approach to growth of services businesses (Q26)
Base: GLOBAL, Businesses expecting growth in services trade outlook N=3520
• Development: Emerging n=2376, Developed n=1144
• Size: Business Banking n=1905, Corporates n=1615
• Domestic=1091, International n=2429 Significantly higher than Global average
Significantly lower than Global averageQ26: Which of the following ways do you plan to grow your service business? Please select up to 3.
Trade in services outlook - Approach to growth of services businesses (by market development, size and international trading or not)
Looking across the different businesses, the same top three growth strategies predominate. Gaining
entry to new markets is vital for the achievement of the projected growth in services
Entering new markets
32%Increasing use of e-commerce
24%Entering new service areas
24%

The Need For Trade Finance/Access To Trade Finance
Chapter 3
29

Trade finance – an increased need for trade finance is strongest in emerging market and increased
accessibility is expected although there are concerns about cost and exchange rate volatility
30
The expected growth in the need for trade finance is strongest in APAC and MENA, in line with their higher projected growth in international trade. The need for trade
finance in Europe is much lower in relation to their expected increases in trade volume. In APAC and MENA, need for trade finance is ten percent below their projected
growth in international trade (APAC 74% compared to 82%) whereas in Europe and NAM, it is twenty percent below (NAM 55% compared to 77%) suggesting perhaps
that in developed markets, there are other ways to finance expansion. This is a similar picture for corporates where two-thirds are projecting an increase in the need for
trade finance compared to eighty percent projecting an increase in their trade volume (66% compared to 81%)
The expected ability to access trade finance follows the same pattern as the increased need for trade finance with over ninety percent of those with an increased need for
trade finance saying that they expect to have increased access to it. Only in two countries, Saudi Arabia and Argentina are more than one in ten businesses projecting a
decline in their ability to access trade finance (17% and 10% respectively)
Businesses identified four main barriers to meeting their trade finance needs, three of which – high transaction costs, exchange rate volatility and unfavourable changes in
the political environment – are almost universal but are weighted differently and regulatory barriers, which is more specific to developed markets and some sectors.
- Transaction costs are a bigger concern for businesses in emerging markets; services and retail and smaller businesses (BBs).
- Exchange rate volatility is a bigger concern for businesses in APAC; for international businesses, corporates and those in manufacturing
- Political environment concerns are strongest in NAM and LATAM and Germany and for services businesses in developed markets
- Regulatory barrier concerns are highest in NAM and Europe and are the top concern for agricultural businesses and a significant concern for manufacturing and service
businesses
Business size is the top concern for domestic businesses and the secondary concern for smaller businesses (BBs)
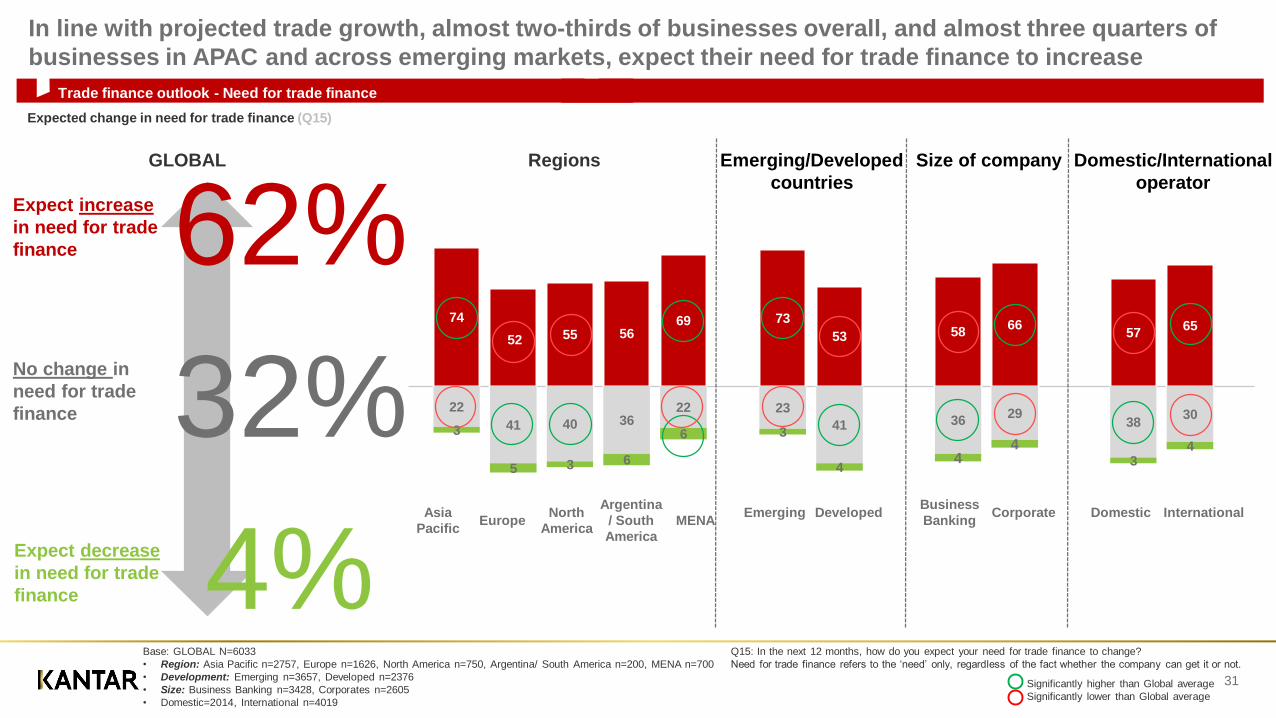
Trade finance outlook - Need for trade finance
31
Expected change in need for trade finance (Q15)
Expect increase
in need for trade
finance
Expect decrease
in need for trade
finance
62%
4%
74
52 55 5669
22
41 40 3622
3
5 3 6
6
Asia
PacificEurope
North
America
Argentina
/ South
America
MENA
No change in
need for trade
finance
Regions
73
53
23
413
4
5866
3629
44
5765
3830
34
Emerging/Developed
countries
Size of company Domestic/International
operator
32%Emerging Developed
Business
BankingCorporate Domestic International
Base: GLOBAL N=6033
• Region: Asia Pacific n=2757, Europe n=1626, North America n=750, Argentina/ South America n=200, MENA n=700
• Development: Emerging n=3657, Developed n=2376
• Size: Business Banking n=3428, Corporates n=2605
• Domestic=2014, International n=4019
GLOBAL
Significantly higher than Global average
Significantly lower than Global average
Q15: In the next 12 months, how do you expect your need for trade finance to change?
Need for trade finance refers to the ‘need’ only, regardless of the fact whether the company can get it or not.
In line with projected trade growth, almost two-thirds of businesses overall, and almost three quarters of
businesses in APAC and across emerging markets, expect their need for trade finance to increase

62
92 88 88 86 85 80 7869 68 66 65 65 63 62 61 61 58 56 56 56 54 53 52 52
4032
34
8 12 11 11 1219 17
25 28 3323
31 33 33 32 35 37 38 35 38 44 39 44 4558 63
4
1 3 32 5
6 41 12 4
54 7 4 5 5 9 6 2 8 3 2
25
Trade finance outlook - Need for trade finance
32
World
Bangladesh Vietnam India Thailand Malaysia China Turkey Egypt Mexico PolandSaudi
ArabiaUAE Indonesia Australia Singapore
South
Korea
Hong
KongUK France Argentina Canada Netherlands USA Germany
Czech
RepublicIreland
Expect
increase
No
change
Expect
decrease
Significantly higher than Global average
Significantly lower than Global average
Q15: In the next 12 months, how do you expect your need for trade finance to change?
Need for trade finance refers to the ‘need’ only, regardless of the fact whether the
company can get it or not.
Base: GLOBAL N=6033
Expected change in need for trade finance (Q15)
The expected increased need for trade finance reflects the projected increase in trade. Specifically,
markets in the APAC region demonstrate an increased need for trade finance.

33
Expect increase
in accessibility
to trade finance
Expect decrease
in accessibility
to trade finance 4%
70
4852
63 64
26
45 4227 23
3
53
10 10
No change in
accessibility to
trade finance
Regions
70
49
25
444
4
5463
3932
43
54 61
4033
34
Emerging/Developed
countries
Size of company Domestic/International
operator
Emerging DevelopedBusiness
BankingCorporate Domestic International
Trade finance outlook – Accessibility to trade finance
Expected change in accessibility to trade finance (Q16)
Asia
PacificEurope
North
America
Argentina
/ South
America
MENA
59%
35%
GLOBAL
Significantly higher than Global average
Significantly lower than Global average
Base: GLOBAL N=6033
• Region: Asia Pacific n=2757, Europe n=1626, North America n=750, Argentina/ South America n=200, MENA n=700
• Development: Emerging n=3657, Developed n=2376
• Size: Business Banking n=3428, Corporates n=2605
• Domestic=2014, International n=4019
Q16: In the next 12 months, how do you expect your ability to access trade finance to change?
‘Ability to access trade finance’ refers to the capacity/capability to obtain trade finance, such as import loans or
supply chain finance from banks.
A very similar proportion expect their ability to access trade finance to increase although almost half in
Europe and NAM expect it to stay the same, and one in ten in LATAM and MENA expect it to decrease

Trade finance outlook - Accessibility to trade finance
34
59
93 88 86 8678 77
70 69 63 63 62 61 58 56 56 56 56 55 54 53 50 49 48 46
24 22
37
6 10 14 13 16 22 25 24 2720
29 33 39 38 37 41 38 40 40 45 46 49 48 49
76 764
12 1 6
15
7 1017
96
35 7 3 6 5
6 2 43
4 6
3
World
Bangladesh Thailand Vietnam India Malaysia China Mexico Turkey ArgentinaSaudi
ArabiaUAE Egypt
Hong
KongPoland France Australia Singapore UK
South
KoreaCanada Germany USA Indonesia Netherlands
Czech
RepublicIreland
Expect
increase
Expect
decrease
Significantly higher than Global average
Significantly lower than Global average
Base: GLOBAL N=6033
Q16: In the next 12 months, how do you expect your ability to access trade finance to
change?
‘Ability to access trade finance’ refers to the capacity/capability to obtain trade finance, such
as import loans or supply chain finance from banks.
Expected change in accessibility to trade finance (Q16)
Accessibility to trade finance – By country
No
change

Bangladesh India Thailand Vietnam China Malaysia Mexico Argentina Turkey Poland USA UAE Egypt Indonesia Australia Germany Canada UK Netherlands Ireland Singapore Hong KongSaudi
Arabia
South
KoreaFrance
Czech
Republic
Trade outlook, Trade finance outlook – need & ability to access
35
96 9492 90 89 88 87
8481
78 77 77 76 74 73 73 72 72 71 71 70 69 67 66 66 66
9288
86
8880 85
68
56
78
66
52
6569
63 62
52 5456
53
32
6158
6561
56
40
93
86
88
86
77 78
7063
69
56
49
62 61
48
56
5053
55
46
22
56 5863
54 56
24
Expect an increase in trade volume (%)
Expected increased need for trade finance (%)
Expected change in accessibility to trade finance (%)
77%Expect an increase in trade volume (%) (Q14)
Base: GLOBAL N=6033; Businesses with international trade N=4019
Q14: How would you expect the business performance of your company to change in the next 12 months?
Q15: In the next 12 months, how do you expect your need for trade finance to change?
Need for trade finance refers to the ‘need’ only, regardless of the fact whether the company can get it or not.
Significantly higher than Global average
Significantly lower than Global average
Q16: In the next 12 months, how do you expect your ability to access trade finance to change? ‘Ability to access trade
finance’ refers to the capacity/capability to obtain trade finance, such as import loans or supply chain finance from banks.
Expected increased need for trade
finance (Q15)
62%Expected change in accessibility
to trade finance (Q16)
59%
The consistent relationship observed at a regional level between the need for trade finance and the accessibility of trade
finance is largely repeated at a country level with exceptions in Poland and Indonesia

South
AmericaAPAC
North
AmericaMENA
Europe (with
UK)RCEP ASEAN CPTPP NAFTA EU (with UK)
EU (without
UK)Emerging Developed Corporates BB Services Non-services
Manufacturin
g / Mining /
Oil
Wholesale /
Retail
Trading
Construction
Agriculture /
Fishing /
Forestry
Regions Trade BlocsEmerging / Developed
CountriesSize of Company Industry
Trade outlook, Trade finance outlook – need & ability to access
36
84 8277
7571
8480
77 77
71 71
82
73
81
72 7479
8177 76 74
56
74
55
69
53
76 74
66
55 53 52
73
53
66
5860
64 64 6366
56
6370
52
64
49
7269
63
5249 48
70
49
63
54 56
61 59 6065
59
Expect an increase in trade volume (%)
Expected increased need for trade finance (%)
Expected change in accessibility to trade finance (%)
77%Expect an increase in trade volume (%) (Q14)
Base: GLOBAL N=6033; Businesses with international trade N=4019
Q14: How would you expect the business performance of your company to change in the next 12 months?
Q15: In the next 12 months, how do you expect your need for trade finance to change?
Need for trade finance refers to the ‘need’ only, regardless of the fact whether the company can get it or not.
Significantly higher than Global average
Significantly lower than Global average
Q16: In the next 12 months, how do you expect your ability to access trade finance to change? ‘Ability to access trade
finance’ refers to the capacity/capability to obtain trade finance, such as import loans or supply chain finance from banks.
Expected increased need for trade
finance (Q15)
62%Expected change in accessibility
to trade finance (Q16)
59%
The consistent relationship observed at a regional level between the need for trade finance and the accessibility of trade
finance is largely repeated across subgroups with exceptions in South America and Agriculture / Fishing / Forestry
RCEP: Australia, China, India, Indonesia, Malaysia, Singapore, South Korea, Thailand, Vietnam

Top Challenge Second Challenge Third Challenge
GLOBAL
Asia Pacific High transaction cost 37% Exchange rate volatility 35% Size of my business 27%
Europe Political environment 33% Exchange rate volatility 33% Regulatory barriers 32%
North America Political environment 37% High transaction cost 35% Regulatory barriers 32%
Argentina/ South America Political environment 40% Exchange rate volatility 36% High transaction cost 34%
MENA High transaction cost 39% Exchange rate volatility 32% Political environment 30%
37
High transaction cost
34%Exchange rate volatility
33%Political environment
32%
Top 3 challenges in meeting trade finance needs (Q17)
Significantly higher than Global average
Significantly lower than Global average
Base: GLOBAL N=6033
• Region: Asia Pacific n=2757, Europe n=1626, North America n=750, Argentina/ South America n=200, MENA n=700
Q17: Please select the top 3 challenges in meeting your trade finance needs? Rank 1 to 3,
with 1 being the key challenge.
Trade finance outlook - Challenges in meeting trade finance needs (by region)
The political environment is seen as the biggest challenge to meeting trade finance needs in Europe and
the Americas, high transaction costs and exchange rate volatility are concerns for all but NAM

Top Challenge Second Challenge Third Challenge
GLOBAL
Top 10 markets indicating … Bangladesh 56% Czech Republic 61% Mexico 45%
Hong Kong 52% Ireland 48% Argentina 40%
Vietnam 52% Singapore 47% Germany 38%
Saudi Arabia 45% Egypt 44% Hong Kong 37%
Singapore 41% Vietnam 44% Turkey 37%
Mexico 41% South Korea 42% USA 36%
Malaysia 40% Turkey 41% Malaysia 35%
UAE 39% Malaysia 40% UK 34%
China 37% Canada 39% Thailand 33%
Turkey 36% UK 37% Canada 32%
38
There is greater divergence at a country level in the challenges, with cost related concerns
dominating but countries with recent/impending political change identifying this as a challenge Trade finance outlook - Challenges in meeting trade finance needs
Significantly higher than Global average
Significantly lower than Global average
Base: GLOBAL N=6033
Top 3 challenges in meeting trade finance needs (Q17)
Q17: Please select the top 3 challenges in meeting your trade finance needs? Rank 1 to 3,
with 1 being the key challenge.
High transaction cost
34%Exchange rate volatility
33%Political environment
32%

Top Challenge Second Challenge Third Challenge
GLOBAL
Services High transaction cost 35% Political environment 34% Regulatory barriers 31%
Non-services Exchange rate volatility 35% High transaction cost 34% Political environment 30%
Wholesale / Retail Trading High transaction cost 37% Exchange rate volatility 35% Political environment 31%
Construction Exchange rate volatility 33% High transaction cost 20% Political environment 29%
Manufacturing / Mining / Oil Exchange rate volatility 38% High transaction cost 36% Regulatory barriers 31%
Agriculture / Fishing / Forestry Regulatory barriers 38% Political environment 28% Exchange rate volatility 27%
39
Looking by sector, the relative hierarchy of challenges is similar with cost related factors dominating, the
biggest exception is agriculture where regulatory barriers are identified as the biggest challenge
Base: GLOBAL N=6033
• Industry Sector: Services n=2574, Non-services n=3459 (Wholesale/ Retail Trading
n=866, Construction n=823, Manufacturing n=1473, Agriculture n=297)Significantly higher than Global average
Significantly lower than Global average
Trade finance outlook - Challenges in meeting trade finance needs (by industry sector)
Top 3 challenges in meeting trade finance needs (Q17)
Q17: Please select the top 3 challenges in meeting your trade finance needs? Rank 1 to 3,
with 1 being the key challenge.
High transaction cost
34%Exchange rate volatility
33%Political environment
32%

Top Challenge Second Challenge Third Challenge
GLOBAL
Emerging/Developed countries
Emerging High transaction cost 38% Exchange rate volatility 35% Political environment 29%
Developed Political environment 34% Exchange rate volatility 32% Regulatory barriers 32%
Size of company
Business Banking High transaction cost 34% Size of my business 32% Political environment 31%
Corporate Exchange rate volatility 36% High transaction cost 34% Political environment 32%
Domestic/International operator
Domestic Size of my business 35% High transaction cost 34% Political environment 32%
International Exchange rate volatility 37% High transaction cost 34% Political environment 32%
40
Top 3 challenges in meeting trade finance needs (Q17)
Base: GLOBAL N=6033
• Development: Emerging n=3657, Developed n=2376
• Size: Business Banking n=3428, Corporates n=2605
• Domestic=2014, International n=4019Significantly higher than Global average
Significantly lower than Global average
Trade finance outlook - Challenges in meeting trade finance needs (by market development, size and international trading or not)
Q17: Please select the top 3 challenges in meeting your trade finance needs? Rank 1 to 3,
with 1 being the key challenge.
The same concerns are dominant across different business types but business size is identified as a
significant challenge for BB customers and those trading domestically
High transaction cost
34%Exchange rate volatility
33%Political environment
32%

The Growth And Impact Of Protectionism/Regulation
41
Chapter 4

The commercial impacts of the perceived growth in protectionism are both diverse and significant -
driving up cost, increasing the need for JVs and local subsidiaries and potentially reducing opportunities
42
Almost two-thirds of businesses think that governments are becoming more protective of their domestic businesses although this is less obvious in Europe and developed markets. It is most strongly felt by
a vast majority (86%) of businesses in India. Corporates and international businesses are more likely to feel this than smaller, domestic businesses reflecting their relatively higher levels of exposure and
experience.
The commercial impacts of greater protectionism are both diverse and significant. The most fundamental are the increased cost of doing international business, mentioned as the primary impact by two-fifths
of businesses overall and reduced opportunities for international business, mentioned by a quarter of businesses. Additionally, around a quarter identified further impacts in the need for greater
collaboration through JVs or setting up local subsidiaries (28% and 25% respectively); skills and labour shortages and the challenge in accessing trade finance. Although current and projected trade flows
don’t yet show changing trade routes/patterns, this was identified as a further impact. Overall, greater protectionism is recognised as potentially disruptive and commercially challenging.
Looking at individual government/economic policies, the majority seem likely to have a positive rather than a negative impact overall. Business outside the particular territories are most likely to think that the
particular policy initiative will have no impact on their business although this may change over time. Overall only two of the five ‘policies’ – the Middle East political environment and BREXIT – veered towards
having a negative rather than a positive impact.
The two ‘policies’ which were seen to have the most positive impact were both based in APAC, China’s ‘Belt and Road’ and ASEAN 2025. The positive impact of China’s ‘Belt and Road’ initiative will be
most strongly felt in APAC and by corporates, international businesses and non services businesses, for others the impact is neutral rather than negative with the exception of South Korea and Vietnam
where more than a third of businesses think that the impact will be negative. The picture is similar for ASEAN 2025 although both positive and negative impacts are both a little lower.
The impact of the Middle East political environment is polarising within MENA where around two-fifths of businesses see either a positive (36%) or a negative (40%) impact. Outside of MENA and across the
different types of business, around half of businesses think that there will be no impact. There are five countries where between a third and half of businesses fear a negative impact – Turkey(48%); Saudi
Arabia (41%); Egypt (40%); South Korea (38%) and Hong Kong (34%).
BREXIT is the one policy that is seen to have the most negative impact in its home region, Europe, where approaching twice as many businesses think that the impact will be negative rather than positive
(38% compared to 22%). The two countries most immediately impacted, UK and Ireland, fear a negative outcome and almost twice as many businesses in Germany, Netherlands and Poland are negative
rather than positive.
Looking at specific trade agreements and where they are relevant, there is a clear view that they will be helpful to businesses in their ‘home’ regions’ and that, where they are not relevant, there will be no
impact.

Protectionist policies & their impact on businesses
43
61%Governments are becoming more protective of their domestic
businesses (%) (Q27)
Regions
MENA 70%
Asia Pacific 68%
Argentina/ South America 63%
North America 61%
Europe 50%
Emerging/Developed countries
Emerging 68%
Developed 54%
Size of company
Business Banking 55%
Corporates 66%
Domestic/International operator
Domestic 54%
International 64%
Country with the highest
proportion indicating
governments are becoming
more protective of their
domestic businesses
Countries with the lowest
proportion indicating
governments are becoming
more protective of their
domestic businesses
India 86%
Significantly higher than Global average
Significantly lower than Global average
Base: GLOBAL N=6033
• Region: MENA n=700, Asia Pacific n=2757, Argentina/South America n=200, North America n=750, Europe n=1626
• Development: Emerging n=3657, Developed n=2376
• Size: Business Banking n=3428, Corporates n=2605
• Domestic=2014, International n=4019
• Industry Sectors: Services n=2574, Non-services n=3459, Wholesale/ Retail Trading n=866, Construction n=823, Manufacturing / Mining / Oil n=1473, Agriculture / Fishing / Forestry n=297
Q27: Do you think countries/governments are becoming more protective of their domestic
businesses in the key markets you operate in?
Industry Sectors
Services 58%
Non-Services 63%
Wholesale / Retail Trading 59%
Construction 65%
Manufacturing / Mining / Oil 65%
Agriculture / Fishing / Forestry 56%
Almost two-thirds of businesses think governments are becoming more protective on behalf of their
domestic businesses, this is strongest in India, MENA and APAC.
Poland 47%
Germany 47%
Bangladesh 76%
UAE 77%

Protectionist policies & their impact on businesses
44
61%Governments are becoming more protective of their domestic businesses (%) (27)
India UAE Bangladesh Thailand Malaysia China SingaporeSaudi
ArabiaVietnam Canada Argentina Turkey Mexico Hong Kong USA Egypt Australia UK Indonesia
South
KoreaNetherlands Ireland France Germany Poland
Czech
Republic
86
77 76 75 73 7169 68 67
64 63 63 63 61 60 59 57 57 5552 52 52
49 47 47
33
Significantly higher than Global average
Significantly lower than Global average
Q27: Do you think countries/governments are becoming more protective of their domestic
businesses in the key markets you operate in?
Base: GLOBAL N=6033
European countries are least likely to feel that their governments are growing more protective of their
domestic businesses

Protectionist policies & their impact on businesses
45
Regions
MENA 70%
Asia Pacific 68%
South America 63%
North America 61%
Europe 48%
Base: GLOBAL, Businesses who felt governments are becoming more protective of their domestic businesses N=3730• Region: Asia Pacific n=1861, Europe n=822, North America n=457, Argentina/ South America n=128, MENA=462, • Development: Emerging=2461, Developed n=1269, • Size: Business Banking n=2003, Corporates n=1727, • Domestic= 1143, International n=2587• Industry Sector: Service n=1580, Non-service n=2150
GLOBALAsia
PacificEurope
North
America
Argentina/
South
America
MENA Emerging DevelopedBusiness
BankingCorporates Domestic International Services
Non-
services
Cost of doing international business has increased
40 45 33 38 41 37 44 35 37 42 30 44 37 41
Skill/labour shortage 28 28 29 29 22 21 26 30 28 28 28 28 26 26
More joint ventures/ collaborations
28 33 23 25 19 24 31 24 23 31 24 29 26 24
Challenges in accessing trade finance
27 33 19 25 16 27 33 21 25 29 26 28 28 28
Changing trade routes/ patterns
26 33 19 23 19 16 30 21 23 28 24 27 24 30
Reduced opportunities for international business
26 27 23 26 26 25 27 24 24 27 22 27 23 28
Company needing to setup local subsidiaries
25 27 23 25 11 23 27 23 23 27 21 27 26 28
Impact of protectionist policies on my business (%) (Q28)
Increasing the cost of international business is the predominant impact of greater protectionism but
consequent skills shortages, the need for more JVs and reduced opportunities are further consequences
indicates types of impacts being mostly felt – top 2 / 3 mentions are marked
Q28: Are any of these impacts felt by your company as a result of these protective
policies?

Impact of government / economic policies in the next 2 years
46
China's "Belt And Road Initiative"
ASEAN 2025 Initiative
European Union Political/regulatory Environment
United States Political/regulatory Environment
Latin American Political/regulatory Environment
Middle East Political Environment
BREXIT
Impact of government / economic policies on my business in the next 2 years(%) (Q29)
15
8
21
27
16
27
25
45
54
44
39
58
49
51
40
37
35
34
25
24
24
Positive impact
No impact
Negative impact
Base: GLOBAL N=6033
Q29: How do you think each of the following will impact your business in the next 2 years?
Please select a response for each.
Globally, China’s ‘Belt and Road’ initiative and ASEAN 2025 are the policies with the highest positive
potential impact conversely the USA and ME political environments are the most likely to be negative

Impact of government / economic policies in the next 2 years
47
GLOBAL
Asia Pacific
Europe
North America
Argentina/ South America
MENA
Emerging
Developed
Business Banking
Corporates
Domestic
International
Services
Non-services
Impact of government / economic policies on my business in the next 2 years(%) (Q29)
15
14
14
18
12
17
15
15
15
15
14
16
14
16
45
27
60
54
62
48
30
58
51
39
53
41
51
41
40
59
26
28
26
35
54
27
33
46
33
43
35
43
Positive impact
No impact
Negative impact
Base: GLOBAL n=6033, • Region: MENA n=700, Asia Pacific n=2757, Argentina/South America n=200, North
America n=750, Europe n=1626• Development: Emerging n=3657, Developed n= 2376• Size: Business Banking n=3428, Corporates n=2605• Domestic=2014, International n=4019, • Industry Sector: Services n=2574, Non-services n=3459
47
Q29: How do you think each of the following will impact your business in the next 2 years?
Please select a response for each.
Significantly higher than Global average
Significantly lower than Global average
The positive impact of China’s ‘Belt and Road’ initiative will be most strongly felt in APAC and by
corporates, international businesses and non services businesses, for others the impact is neutral
China's "Belt And Road Initiative"

Impact of government / economic policies on my business
48
45
1526 25 31 32
39 3342 46 41 41
62 56 54 58 55 54 5364 62
35
66
45
67
8977
40
7765 61
59 5750
45
45 4036 36
3229 29 29 29 28 26
26 26
25
23
22
19
11
9
158 9
14 10 12 11
2213 13
23 24
7
15 17 14 16 18 21
10 12
40
12
33
13
1
15
Global
China Thailand Malaysia SingaporeHong
KongAustralia India Egypt
Saudi
ArabiaTurkey Mexico Indonesia UAE Poland Germany UK USA France
Netherland
sArgentina
South
KoreaCanada Vietnam
Banglades
hIreland
Czech
Republic
Positive impact
No impact
Negative impact
Impact of government / economic policies on my business (%) (Q29)
Base: GLOBAL N=6033
Q29: How do you think each of the following will impact your business in the next 2 years?
Please select a response for each. Significantly higher than Global average
Significantly lower than Global average
China’s “Belt and Road Initiative”
Behind the overall perceived positive impact within Asia, it is thought that ‘Belt and Road’ will have a
somewhat more negative impact in South Korea and Vietnam

Impact of government / economic policies in the next 2 years
49
Impact of government / economic policies on my business in the next 2 years(%) (Q29)
Positive impact
No impact
Negative impact
GLOBAL
Asia Pacific
Europe
North America
Argentina/ South America
MENA
Emerging
Developed
Business Banking
Corporates
Domestic
International
Services
Non-services
8
6
9
10
11
9
7
9
8
8
7
9
8
8
54
38
66
66
72
54
40
66
61
48
64
49
59
51
37
56
25
24
17
37
52
25
31
43
28
42
33
41
49
Base: GLOBAL n=6033, • Region: MENA n=700, Asia Pacific n=2757, Argentina/South America n=200, North
America n=750, Europe n=1626• Development: Emerging n=3657, Developed n= 2376• Size: Business Banking n=3428, Corporates n=2605• Domestic=2014, International n=4019, • Industry Sector: Services n=2574, Non-services n=3459
Q29: How do you think each of the following will impact your business in the next 2 years?
Please select a response for each.
Significantly higher than Global average
Significantly lower than Global average
The picture is similar for ASEAN 2025, although both the positive and the negative impacts are lower and
the majority are neutral particularly in developed markets and for domestic businesses
ASEAN 2025 Initiative

Impact of government / economic policies on my business
50
54
19 26 2029 35
29
52 49 49 4956
49 54 57 55 60 63 59 59 65 67 70 72 72
94 92
37
7574
7167 61
60
4644 41 40
39
3534 34 32
30 2828 26
25 23 22 21 17
6 6
8 6 8 3 412
2 7 10 116
1612 10 13 10 9
13 1510 10 8 7
11
2
Global
Malaysia Vietnam Thailand India China Singapore Indonesia AustraliaSouth
Korea
Saudi
ArabiaUAE Mexico Egypt
Hong
KongTurkey UK Germany Poland France
Banglades
hUSA
Netherland
sCanada Argentina Ireland
Czech
Republic
Positive impact
No impact
Negative impact
Impact of government / economic policies on my business (%) (Q29)
Base: GLOBAL N=6033
Q29: How do you think each of the following will impact your business in the next 2 years?
Please select a response for each. Significantly higher than Global average
Significantly lower than Global average
ASEAN 2025 Initiative
The perceived positive impact of ASEAN 2025 reduces beyond Asia with the majority of countries feeling
that it will have no impact, this may be a reflection of low informed awareness

Impact of government / economic policies in the next 2 years
51
Impact of government / economic policies on my business in the next 2 years(%) (Q29)
Positive impact
No impact
Negative impact
GLOBAL
Asia Pacific
Europe
North America
Argentina/ South America
MENA
Emerging
Developed
Business Banking
Corporates
Domestic
International
Services
Non-services
21
18
25
19
28
21
18
22
21
20
17
22
21
20
44
43
41
50
43
41
43
45
48
40
51
40
47
42
35
39
34
31
29
37
39
33
31
40
31
37
32
38
51
Base: GLOBAL n=6033, • Region: MENA n=700, Asia Pacific n=2757, Argentina/South America n=200, North
America n=750, Europe n=1626• Development: Emerging n=3657, Developed n= 2376• Size: Business Banking n=3428, Corporates n=2605• Domestic=2014, International n=4019, • Industry Sector: Services n=2574, Non-services n=3459
Q29: How do you think each of the following will impact your business in the next 2 years?
Please select a response for each.
Significantly higher than Global average
Significantly lower than Global average
The impact of the EU political/regulatory environment is marginally positive in Europe, more positive in
NAM and MENA and more positive for corporates than business banking customers
EU policy environment

Impact of government / economic policies on my business
52
4433 33 40 44 41
3347
24
41 42 37 43 4636
48
66
3932
4352 51 48 47
70
43
70
35 57 4846
46 4545
43
42
41 4039
36 36
33
32
31
3030
2929 28 28 27
24
21
13
21
9
1914
11 14
22
10
34
18 1724
20 18
31
20
3
3138
2819 21 24 26
6
36
17
Global
India Poland China EgyptSaudi
ArabiaMalaysia Australia
Czech
RepublicMexico Thailand France
Netherland
sUAE UK Canada Vietnam Ireland Turkey Argentina USA Singapore Germany
Hong
KongIndonesia
South
Korea
Banglades
h
Positive impact
No impact
Negative impact
Impact of government / economic policies on my business (%) (Q29)
Base: GLOBAL N=6033
Q29: How do you think each of the following will impact your business in the next 2 years?
Please select a response for each. Significantly higher than Global average
Significantly lower than Global average
EU policy environment
Views on the impact of the EU policy environment veer towards being positive in most countries, Turkey
appear most concerned, and within the EU, Ireland and the UK are the most polarised

Impact of government / economic policies in the next 2 years
53
Impact of government / economic policies on my business in the next 2 years(%) (Q29)
Positive impact
No impact
Negative impact
GLOBAL
Asia Pacific
Europe
North America
Argentina/ South America
MENA
Emerging
Developed
Business Banking
Corporates
Domestic
International
Services
Non-services
27
27
25
27
40
32
29
25
26
28
22
29
25
28
39
36
50
29
35
39
35
42
45
33
47
35
44
36
34
37
25
44
25
29
36
33
29
39
30
37
31
37
53
Base: GLOBAL n=6033, • Region: MENA n=700, Asia Pacific n=2757, Argentina/South America n=200, North
America n=750, Europe n=1626• Development: Emerging n=3657, Developed n= 2376• Size: Business Banking n=3428, Corporates n=2605• Domestic=2014, International n=4019, • Industry Sector: Services n=2574, Non-services n=3459
Q29: How do you think each of the following will impact your business in the next 2 years?
Please select a response for each.
Significantly higher than Global average
Significantly lower than Global average
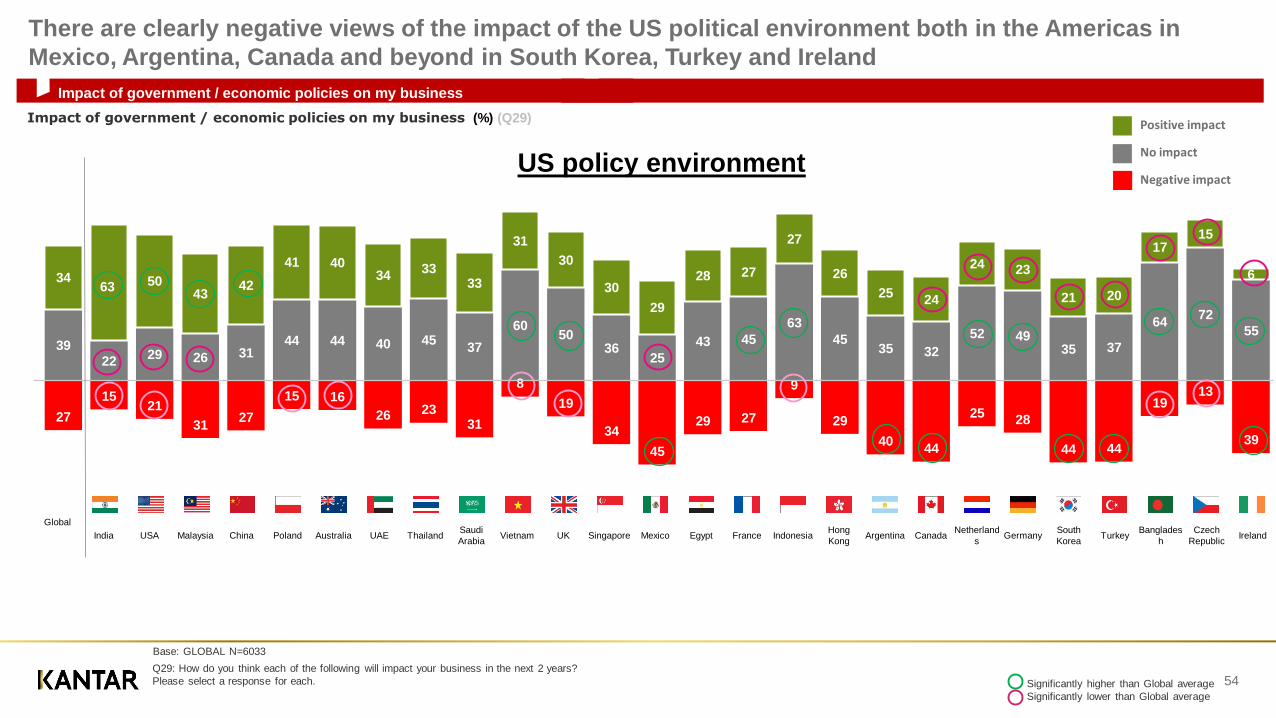
The US political/regulatory environment is most positive in NAM, its homeland, followed by APAC, but is
seen as likely to have a negative impact on businesses in LATAM (Argentina)
US policy environment
39
2229 26 31
44 44 40 4537
6050
3625
43 45
63
4535 32
52 4935 37
6472
55
3463 50
4342
41 4034
3333
31
30
30
29
28 27
27
26
2524
24 23
21 20
1715
6
27
1521
3127
15 16
26 2331
8
19
34
45
29 27
9
29
4044
2528
44 44
1913
39
Impact of government / economic policies on my business
54
Global
India USA Malaysia China Poland Australia UAE ThailandSaudi
ArabiaVietnam UK Singapore Mexico Egypt France Indonesia
Hong
KongArgentina Canada
Netherland
sGermany
South
KoreaTurkey
Banglades
h
Czech
RepublicIreland
Positive impact
No impact
Negative impact
Impact of government / economic policies on my business (%) (Q29)
Base: GLOBAL N=6033
Q29: How do you think each of the following will impact your business in the next 2 years?
Please select a response for each. Significantly higher than Global average
Significantly lower than Global average
US policy environment
There are clearly negative views of the impact of the US political environment both in the Americas in
Mexico, Argentina, Canada and beyond in South Korea, Turkey and Ireland

Impact of government / economic policies in the next 2 years
55
Impact of government / economic policies on my business in the next 2 years(%) (Q29)
Positive impact
No impact
Negative impact
GLOBAL
Asia Pacific
Europe
North America
Argentina/ South America
MENA
Emerging
Developed
Business Banking
Corporates
Domestic
International
Services
Non-services
16
16
16
18
22
14
17
16
17
16
14
18
16
17
58
54
63
57
32
67
54
62
63
54
64
56
63
55
25
30
20
25
46
19
30
21
20
30
22
27
21
28
55
Base: GLOBAL n=6033, • Region: MENA n=700, Asia Pacific n=2757, Argentina/South America n=200, North
America n=750, Europe n=1626• Development: Emerging n=3657, Developed n= 2376• Size: Business Banking n=3428, Corporates n=2605• Domestic=2014, International n=4019, • Industry Sector: Services n=2574, Non-services n=3459
Q29: How do you think each of the following will impact your business in the next 2 years?
Please select a response for each.
Significantly higher than Global average
Significantly lower than Global average
With the exception of Argentina where a positive impact is foreseen, more than half of businesses think that there
will be no impact of the LATAM regulatory environment and less than one in five think it will be negative
LATAM policy environment

Impact of government / economic policies on my business
56
58
4032 27
46 4757 53 56 62 64 61 61 58
6760 62 63 66
8067
81 76
57
8496
84
2550
4645
40 37
3430 27
27 2623 22 22
2121 20 19 17
17
16
1312
12
54
1
1610
2228
14 168
17 1712 10
16 17 20
1119 17 19 17
3
18
613
32
1115
Global
India Argentina Mexico China Malaysia Australia Thailand Poland UKSaudi
ArabiaFrance USA Turkey Egypt Germany Canada
Netherland
sSingapore Vietnam
Hong
KongIndonesia UAE
South
Korea
Banglades
h
Czech
RepublicIreland
Positive impact
No impact
Negative impact
Impact of government / economic policies on my business (%) (Q29)
Base: GLOBAL N=6033
Q29: How do you think each of the following will impact your business in the next 2 years?
Please select a response for each. Significantly higher than Global average
Significantly lower than Global average
LATAM policy environment
Businesses in India, Argentina and Mexico are the most positive and only South Korea, Ireland,
Bangladesh and Hong Kong have a slight leaning towards LATAM policies having a negative impact

Impact of government / economic policies in the next 2 years
57
Impact of government / economic policies on my business in the next 2 years(%) (Q29)
Positive impact
No impact
Negative impact
GLOBAL
Asia Pacific
Europe
North America
Argentina/ South America
MENA
Emerging
Developed
Business Banking
Corporates
Domestic
International
Services
Non-services
27
26
26
27
27
40
28
26
26
28
21
30
25
28
49
46
53
53
59
24
44
53
53
44
59
44
53
46
24
28
21
20
14
36
29
21
21
28
20
26
21
26
57
Base: GLOBAL n=6033, • Region: MENA n=700, Asia Pacific n=2757, Argentina/South America n=200, North
America n=750, Europe n=1626• Development: Emerging n=3657, Developed n= 2376• Size: Business Banking n=3428, Corporates n=2605• Domestic=2014, International n=4019, • Industry Sector: Services n=2574, Non-services n=3459
Q29: How do you think each of the following will impact your business in the next 2 years?
Please select a response for each.
Significantly higher than Global average
Significantly lower than Global average
The impact of the ME political/regulatory environment veers towards the negative, although almost half
are neutral, and opinions within MENA are polarised
MENA policy environment

Impact of government / economic policies on my business
58
4933
1725
3548 47
27
5143 46
5245
27
51
69 70
51 52 56 5851 48
5973 78
69
24 53
4241
39
39 38
33
3029 27
2625
25
21
21 20
20 1918 18
1515
14
13 9
6
27
14
4134
26
14 15
40
20
28 2722
29
48
28
10 10
29 29 26 23
3438
27
14 13
25
Global
IndiaSaudi
ArabiaUAE Malaysia Thailand Australia Egypt UK China Singapore Mexico France Turkey Poland Vietnam Indonesia Germany USA
Netherland
sCanada
Hong
Kong
South
KoreaArgentina
Banglades
h
Czech
RepublicIreland
Positive impact
No impact
Negative impact
Impact of government / economic policies on my business (%) (Q29)
Base: GLOBAL N=6033
Q29: How do you think each of the following will impact your business in the next 2 years?
Please select a response for each. Significantly higher than Global average
Significantly lower than Global average
MENA policy environment
Around two in five businesses in some of the geographically closest countries - Turkey, Saudi Arabia,
Egypt and South Korea think that the impact will be negative. Only India tends towards a positive impact

Impact of government / economic policies in the next 2 years
59
Impact of government / economic policies on my business in the next 2 years(%) (Q29)
Positive impact
No impact
Negative impact
GLOBAL
Asia Pacific
Europe
North America
Argentina/ South America
MENA
Emerging
Developed
Business Banking
Corporates
Domestic
International
Services
Non-services
25
19
38
18
26
23
21
29
25
25
20
27
27
24
51
53
41
61
58
53
54
49
54
48
58
48
51
51
24
27
22
21
16
24
26
22
21
27
22
25
22
25
59
Base: GLOBAL n=6033, • Region: MENA n=700, Asia Pacific n=2757, Argentina/South America n=200, North
America n=750, Europe n=1626• Development: Emerging n=3657, Developed n= 2376• Size: Business Banking n=3428, Corporates n=2605• Domestic=2014, International n=4019, • Industry Sector: Services n=2574, Non-services n=3459
Q29: How do you think each of the following will impact your business in the next 2 years?
Please select a response for each.
Significantly higher than Global average
Significantly lower than Global average
The perceived impact of Brexit tends to be negative in Europe but quite evenly balanced in other regions
and across different types of business and those with different outlooks
BREXIT

Impact of government / economic policies on my business
60
5137 43
28
56 52 5342 43
72
50 54
36
6253
64
4452
6246
61 58 59
8066
15
69
2449
44
33
3129 29
27 27
23
2222
22
21
21
20
2020
19
18
16 16 16
14
13
10
25
14 13
38
1319 19
30 30
5
2824
42
17
26
16
3629
19
35
23 26 25
6
21
75
31
Global
India Australia UK Thailand UAE China Malaysia France IndonesiaHong
KongTurkey Poland USA Mexico Canada Netherlands
Saudi
ArabiaEgypt Germany
South
KoreaArgentina Singapore Vietnam Bangladesh Ireland
Czech
Republic
Positive impact
No impact
Negative impact
Impact of government / economic policies on my business (%) (Q29)
Base: GLOBAL N=6033
Q29: How do you think each of the following will impact your business in the next 2 years?
Please select a response for each. Significantly higher than Global average
Significantly lower than Global average
BREXIT
The two countries most immediately impacted by Brexit, UK and Ireland, fear a negative outcome and almost twice as
many businesses in Germany, Netherlands and Poland are negative rather than positive; India and Australia are the
only two seeing opportunities

The key APAC initiatives, ‘Belt and Road’ and ASEAN 2025 are seen to have the greatest benefit in their
‘home region’, the picture is more mixed for other initiatives
Impact of government / economic policies in the next 2 years
61
Impact of government / economic policies on my business in the next 2 years(%) (Q29)
Base: GLOBAL N=6033
Q29: How do you think each of the following will impact your business in the next 2 years?
Please select a response for each.
China's "Belt And Road Initiative"
Top 3 markets with most positive impact
China 77 %
Thailand 65 %
Malaysia 61 %
Top 3 markets with most negative impact
South Korea -40 %
Vietnam -33 %
Mexico -24 %
ASEAN 2025 Initiative
Top 3 markets with most positive impact
Malaysia 75 %
Vietnam 74 %
Thailand 71 %
Top 3 markets with most negative impact
Mexico -16 %
France -15 %
Poland -13 %
BREXIT
Top 3 markets with most positive impact
India 49 %
Australia 44 %
UK 33 %
Top 3 markets with most negative impact
Ireland -75 %
Poland -42 %
UK -38 %
European Union Political/regulatory
Environment
Top 3 markets with most positive impact
India 57 %
Poland 48 %
China 46 %
Top 3 markets with most negative impact
Turkey -38 %
South Korea -36 %
Czech Republic -34 %
United States Political/regulatory
Environment
Top 3 markets with most positive impact
India 63 %
USA 50 %
Malaysia 43 %
Top 3 markets with most negative impact
Mexico -45 %
South Korea -44 %
Turkey -44 %
Latin American Political/regulatory
Environment
Top 3 markets with most positive impact
India 50 %
Argentina 46 %
Mexico 45 %
Top 3 markets with most negative impact
South Korea -32 %
Mexico -28 %
Argentina -22 %
Middle East Political Environment
Top 3 markets with most positive impact
India 53 %
Saudi Arabia 42 %
UAE 41 %
Top 3 markets with most negative impact
Turkey -48 %
Saudi Arabia -41 %
Egypt -40 %

Impact of trade agreements in the next 2 years
62
Relevance of trade agreements (%) (Q30) Impact on my business in the next 2 years (%) (Q31)
Base:
Q30: GLOBAL N=6033
Q31: EEA n=5205, ASEAN n=5224, NAFTA n=5153, SAFTA n=5129, CETA-EU-
CANADA n=5096, EU-Japan n=5190, TPP/CPTPP n=5027, PA n=5067
EEA 45%
ASEAN 43%
NAFTA 42%
SAFTA 38%
CETA-EU-CANADA 37%
EU-Japan 37%
TPP/CPTPP 36%
PA 35%
Will help my business
No impact
Will not help my business
7
6
8
6
7
8
9
6
48
51
51
56
57
56
55
57
45
44
41
38
37
36
36
37
Q30: Thinking of various trade agreements, which of these trade agreements have been
relevant to your business?
Q31: Thinking forward to the next 2 years, how will these trade agreements impact your
business?
Looking at specific trade agreements and the regions where they are most relevant, there is a clear sense
that they will be helpful to those businesses and largely have no impact where they are not relevant

Trade agreements
63
GLOBAL
Asia Pacific
Europe
North America
Argentina/ South America
MENA
Emerging
Developed
Business Banking
Corporates
Domestic
International
Services
Non-Services
Impact on my business in the next 2 years (%) (Q31)
7
6
9
7
5
6
6
8
7
8
6
8
7
7
48
46
43
57
67
45
46
49
54
42
60
42
53
45
45
48
48
36
28
49
48
43
39
50
34
50
40
48
Base:
Q30: GLOBAL N=6033
Q31: Businesses who think the policy is relevant to their business - EEA n=5205
• Region: Asia Pacific n=2355, Europe n=1451, North America n=672, Argentina/ South
America n=172, MENA n=555
Relevance of trade agreements (%) (Q30)
45
46
52
36
20
44
45
46
39
52
35
51
39
47
Base: Q31:
• Development: Emerging n=3074, Developed n=2131
• Size: Business Banking n=2887, Corporates n=2318
• Domestic n=1729, International n=3476
• Industry Sector: Services n=2231, Non-Services n=1696
Will help my business
No impact
Will not help my business
Significantly higher than Global average
Significantly lower than Global average
Looking at EEA, it is both more relevant to and will have a more positive impact on corporates, European,
international and non-services businesses. There is very low perceived negative impact from it
EEA

Impact of trade agreements in the next 2 years
64
48
28 31 35 36 37 42 42 43 48 44 47 48 4942
52 53 55 56 56 57 61 63 65 67 61 67
45
70 61 61 58 56 49 49 4848
4848 46 46
45
43 41 41 40 38 3535 34 31 28
27 20
7 28 5 7 6 8 9 9
49 5 5 5
135 6 4 3 7 8 4 4 5 5
12 12
Global
IndiaCzech
RepublicPoland Ireland China Turkey
Saudi
ArabiaGermany UAE France Thailand Malaysia Egypt UK Mexico
Netherlan
dsAustralia Indonesia
Hong
KongUSA Singapore Vietnam Canada Argentina
South
Korea
Banglades
h
Base: Businesses who think the policy is relevant to their business - EEA n=5205
Positive impact
No impact
Negative impact
Impact on my business in the next 2 years (%) (Q31)
64
Q31: Thinking forward to the next 2 years, how will these trade agreements impact your
business?
Significantly higher than Global average
Significantly lower than Global average
On a country level, more businesses are expecting a positive impact both within the EU, notably Poland
and Ireland, and outside it in two of the most bullish countries, India and China
EEA

Trade agreements
65
GLOBAL
Asia Pacific
Europe
North America
Argentina/ South America
MENA
Emerging
Developed
Business Banking
Corporates
Domestic
International
Services
Non-Services
Impact on my business in the next 2 years (%) (Q31)
6
5
6
6
5
6
5
6
6
5
4
6
5
6
51
35
64
60
56
48
38
61
56
45
63
44
57
46
44
60
30
34
39
46
57
32
37
50
33
49
38
48
Relevance of trade agreements (%) (Q30)
43
58
31
36
31
40
54
34
35
51
31
49
36
48
Will help my business
No impact
Will not help my business
Base:
Q30: GLOBAL n=6033
Q31: Businesses who think the policy is relevant to their business - ASEAN n=5224
• Region: Asia Pacific n=2444, Europe n=1407, North America n=659, Argentina/ South
America n=167, MENA n=547
Base: Q31:
• Development: Emerging n=3148, Developed n=2076
• Size: Business Banking n=2911, Corporates n=2313
• Domestic n=1740, International n=3484
• Industry Sector: Services n=2211, Non-Services n=3003
Significantly higher than Global average
Significantly lower than Global average
ASEAN is significantly more relevant to businesses in APAC, emerging markets, corporates, international
and non service businesses, where the impact is more likely to be positive.
ASEAN

Impact of trade agreements in the next 2 years
66
51
21 20 25 23 2737 40 39 39 41
50 49 53 55 52 56 5749
63 63 60 61 60 6481
90
44
77 7373 70 68
59 55 54 54 4945 43 43 43 42 39 38
35
35 3534 32 31 29
1610
6 3 7 37 6 4 5 7 7 9
5 8 4 3 5 5 5
16
3 37 6 9 7
2
Global
India Malaysia Vietnam Singapore Thailand China IndonesiaSaudi
Arabia
South
KoreaAustralia Poland UAE
Hong
KongTurkey Egypt Argentina Mexico
Banglades
h
Netherlan
dsCanada USA UK France Germany Ireland
Czech
Republic
Base: Businesses who think the policy is relevant to their business - ASEAN n=5224
Positive impact
No impact
Negative impact
Impact on my business in the next 2 years (%) (Q31)
Q31: Thinking forward to the next 2 years, how will these trade agreements impact your
business?
Significantly higher than Global average
Significantly lower than Global average
Businesses expecting a positive impact are most prevalent in Asia but in all countries where businesses
foresee an impact it is likely to be positive, most typically for between a third to half of businesses
ASEAN

Trade agreements
67
GLOBAL
Asia Pacific
Europe
North America
Argentina/ South America
MENA
Emerging
Developed
Business Banking
Corporates
Domestic
International
Services
Non-Services
Impact on my business in the next 2 years (%) (Q31)
8
6
8
11
11
8
7
9
8
8
6
9
7
9
51
46
64
39
58
62
47
54
59
43
62
45
58
46
41
47
28
50
31
30
46
37
33
48
31
46
35
45
Relevance of trade agreements (%) (Q30)
42
42
32
59
28
29
42
42
34
51
31
48
34
48
Will help my business
No impact
Will not help my business
Base:
Q30: GLOBAL n=6033
Q31: Businesses who think the policy is relevant to their business - NAFTA n=5153
• Region: Asia Pacific n=2303, Europe n=1427, North America n=703, Argentina/ South
America n=166, MENA n=554
Base: Q31:
• Development: Emerging n=3029, Developed n=2124
• Size: Business Banking n=2851, Corporates n=2302
• Domestic n=1719, International n=3434
• Industry Sector: Services n=2192, Non-Services n=2961
Significantly higher than Global average
Significantly lower than Global average
NAFTA is far more relevant to businesses in NAM, APAC, corporates, international and non service
businesses, where the impact is likely to be positive. Almost two thirds of businesses in Europe and
MENA are neutral
NAFTA

With the exception of India, China, Mexico, Canada and USA, half to three quarters of businesses think
the impact will be neutral however there are significant concerns in Mexico, Malaysia and South Korea
Impact of trade agreements in the next 2 years
68
51
2736 30 34
4251 54 54
4757 56 55 56
65 58 65 64 64 65 65 69 73 74 7770 75
41
6858
5352
4941 39 39
39
37 37 36 3231
3130 27 27 27 25
2424 22 19
1816
8 5 5
16 139 8 6 7
146 7 9 12
511
5 8 9 9 117 3 3 4
12 9
Global
India China Mexico Canada USA Australia Thailand Poland MalaysiaHong
KongUK
Saudi
Arabia
South
KoreaSingapore Argentina UAE Egypt France Germany Turkey
Netherlan
ds
Banglades
hVietnam Ireland
Czech
RepublicIndonesia
Base: Base: Businesses who think the policy is relevant to their business - NAFTA n=5153
Positive impact
No impact
Negative impact
Impact on my business in the next 2 years (%) (Q31)
Q31: Thinking forward to the next 2 years, how will these trade agreements impact your
business?
Significantly higher than Global average
Significantly lower than Global average
NAFTA

Trade agreements
69
GLOBAL
Asia Pacific
Europe
North America
Argentina/ South America
MENA
Emerging
Developed
Business Banking
Corporates
Domestic
International
Services
Non-Services
Impact on my business in the next 2 years (%) (Q31)
6
5
6
8
7
6
5
7
6
6
5
7
6
6
56
43
67
64
71
56
45
65
62
51
69
50
62
53
38
52
27
28
22
38
50
28
31
43
26
43
32
41
Relevance of trade agreements (%) (Q30)
38
51
27
34
20
30
47
30
30
45
26
44
31
42
Will help my business
No impact
Will not help my business
Base:
Q30: GLOBAL n=6033
Q31: Businesses who think the policy is relevant to their business - SAFTA n=5129
• Region: Asia Pacific n=2376, Europe n=1396, North America n=665, Argentina/ South
America n=165, MENA n=527
Base: Q31:
• Development: Emerging n=3052, Developed n=2077
• Size: Business Banking n=2848, Corporates n=2281
• Domestic n=1700, International n=3429
• Industry Sector: Services n=2170, Non-Services n=2959
Significantly higher than Global average
Significantly lower than Global average
SAFTA is more relevant in APAC and for corporates, international and non service businesses, where the
impact is more likely to be positive. Two thirds of businesses in Europe and the Americas are neutral
SAFTA

56
23 2332 35 41
50 50 53 54 54 56 55 60 60 60 63 64 70 66 67 67 62 68 71
90 91
38
74 6762 59
5545 43 43 41 41 38
37 36 33 33 30 2727
27 27 2726
23 22
10 9
6 39 6 6 4 5 7 4 5 5 6 4 7 7 7 9
38 7 6
11 9 7
Businesses in India and Thailand are the most positive about the impact of SAFTA followed by Singapore,
Malaysia and China. Beyond these, at least half of businesses think there will be no impact
Impact of trade agreements in the next 2 years
70
Global
India Thailand Singapore Malaysia China Australia Indonesia UAE Vietnam MexicoHong
Kong
Saudi
ArabiaPoland Turkey UK France USA
Netherlan
dsGermany Egypt Canada
Banglades
h
South
KoreaArgentina
Czech
RepublicIreland
Base: Base: Businesses who think the policy is relevant to their business - SAFTA n=5129
Positive impact
No impact
Negative impact
Impact on my business in the next 2 years (%) (Q31)
Q31: Thinking forward to the next 2 years, how will these trade agreements impact your
business?
Significantly higher than Global average
Significantly lower than Global average
SAFTA

Trade agreements
71
GLOBAL
Asia Pacific
Europe
North America
Argentina/ South America
MENA
Emerging
Developed
Business Banking
Corporates
Domestic
International
Services
Non-Services
Impact on my business in the next 2 years (%) (Q31)
7
6
6
7
7
7
6
7
6
7
6
7
6
7
57
53
61
56
74
63
54
59
63
51
66
52
62
54
37
41
32
37
20
30
40
34
31
42
28
41
32
40
Relevance of trade agreements (%) (Q30)
37
39
32
44
13
27
38
37
30
45
28
42
32
41
Will help my business
No impact
Will not help my business
Base:
Q30: GLOBAL n=6033
Q31: Businesses who think the policy is relevant to their business - CETA-EU-CANADA n=5096
• Region: Asia Pacific n=2298, Europe n=1427, North America n=666, Argentina/ South
America n=158, MENA n=547
Base: Q31:
• Development: Emerging n=2994, Developed n=2102
• Size: Business Banking n=2820, Corporates n=2276
• Domestic n=1695, International n=3401
• Industry Sector: Services n=2187, Non-Services n=2909
Significantly higher than Global average
Significantly lower than Global average
CETA-EU-CANADA is most relevant in NAM and for corporates, international and non service businesses,
where the impact is likely to be positive. Around two thirds of domestic, services and BBs are neutral
CETA

CETA is viewed as likely to have a positive impact on businesses in India, China and Mexico
Impact of trade agreements in the next 2 years
72
57
3347 46 47 49 55 54 52 57 56 57 58 57 60 64 64 64 65 66 73 67 69 74 68
83 88
37
62
49 48 45 4340 39 37
36 35 34 34 33 33 32 32 30 29 2826
23 2120
17
17 12
7 5 4 5 8 95 7
117 9 8 7 9 7 4 4 6 6 6
11 10 714
Global
India China Mexico Malaysia Canada Thailand Australia Poland UK FranceHong
KongUSA
Saudi
ArabiaGermany Indonesia
Netherlan
dsTurkey Egypt UAE Vietnam
South
KoreaSingapore Argentina
Banglades
h
Czech
RepublicIreland
Base: Base: Businesses who think the policy is relevant to their business - CETA-EU-CANADA n=5096
Positive impact
No impact
Negative impact
Impact on my business in the next 2 years (%) (Q31)
Q31: Thinking forward to the next 2 years, how will these trade agreements impact your
business?
Significantly higher than Global average
Significantly lower than Global average
CETA
Wordings updated

Trade agreements
73
GLOBAL
Asia Pacific
Europe
North America
Argentina/ South America
MENA
Emerging
Developed
Business Banking
Corporates
Domestic
International
Services
Non-Services
Impact on my business in the next 2 years (%) (Q31)
8
9
7
6
3
6
9
6
6
9
6
8
7
8
56
47
64
60
80
54
48
62
62
50
67
51
61
53
36
44
30
34
16
40
43
32
32
41
28
41
33
39
Relevance of trade agreements (%) (Q30)
37
45
30
35
19
33
42
32
30
43
27
42
32
40
Will help my business
No impact
Will not help my business
Base:
Q30: GLOBAL n=6033
Q31: Businesses who think the policy is relevant to their business - EU-Japan n=5190
• Region: Asia Pacific n=2357, Europe n=1131, North America n=670, Argentina/ South
America n=170, MENA n=551
Base: Q31:
• Development: Emerging n=3071, Developed n=2119
• Size: Business Banking n=2867, Corporates n=2323
• Domestic n=1732, International n=3458
• Industry Sector: Services n=2200, Non-Services n=2990
Significantly higher than Global average
Significantly lower than Global average
EU – Japan agreements are only relevant to just over a third of businesses, including those in Europe; the impact is
more positive for corporates and international; and for businesses in APAC rather than Europe
EU- Japan

Impact of trade agreements in the next 2 years
74
56
36 3346 44 47 49 44
52 53 59 56 57 56 57 55 60 5851
62 67 64 6380 85
72
93
36
6156
51 50 48 4744
44 4138 38 37 37 36 34
34 3433
3130
29 28
1615
12
7
83
124 6 5 4
125 6 4 7 6 7 7 10 7 8
16
7 7 83
16
Global
India Malaysia Indonesia ThailandSaudi
ArabiaVietnam China Australia Mexico UAE
Hong
KongPoland Egypt UK Turkey USA Singapore
South
KoreaGermany Canada France Netherlands Argentina Ireland Bangladesh
Czech
Republic
Base: Base: Businesses who think the policy is relevant to their business - EU-Japan n=5190
Positive impact
No impact
Negative impact
Impact on my business in the next 2 years (%) (Q31)
Q31: Thinking forward to the next 2 years, how will these trade agreements impact your
business?
Significantly higher than Global average
Significantly lower than Global average
EU-Japan agreements are seen positively by more than half of businesses in India, Malaysia, Indonesia and Thailand. In South Korea, Bangladesh, Malaysia and China more than one in ten predict a negative impact on their business
EU- Japan

Trade agreements
75
GLOBAL
Asia Pacific
Europe
North America
Argentina/ South America
MENA
Emerging
Developed
Business Banking
Corporates
Domestic
International
Services
Non-Services
Impact on my business in the next 2 years (%) (Q31)
9
8
8
11
4
8
8
9
9
9
7
10
9
8
55
43
65
57
79
60
46
61
62
48
67
48
60
51
36
48
27
32
17
33
45
29
29
43
26
42
31
40
Relevance of trade agreements (%) (Q30)
36
46
26
38
17
25
42
31
28
44
26
41
30
40
Will help my business
No impact
Will not help my business
Base:
Q30: GLOBAL n=6033
Q31: Businesses who think the policy is relevant to their business - TPP/CPTPP n=5027
• Region: Asia Pacific n=2283, Europe n=1380, North America n=663, Argentina/ South
America n=168, MENA n=553
Base: Q31:
• Development: Emerging n=2983, Developed n=2044
• Size: Business Banking n=2793, Corporates n=2234
• Domestic n=1678, International n=3349
• Industry Sector: Services n=2162, Non-Services n=2865
Significantly higher than Global average
Significantly lower than Global average
TPP/CPTPP is relevant for just over a third of countries and more relevant in APAC and for corporates,
international and non service businesses, where greater numbers think that the impact will be positive.
TPP/CPTPP

Impact of trade agreements in the next 2 years
76
55
35 2937 35 41 40
52 55 55 52 53 59 62 62 62 63 5764 62 63 63 69
79 7891 93
36
6363
58 58 50 49
44 39 3939 37
33 31 31 30 3030
29 29 28 2725
1710
9 7
92
8 5 6 9 115 6 6
10 10 8 7 7 8 713
6 9 9 105 4
12
Global
Vietnam Malaysia India Thailand Singapore China AustraliaHong
KongCanada
Saudi
Arabia
South
KoreaMexico UAE Turkey Poland UK USA
Netherlan
dsFrance Egypt Germany Indonesia Argentina
Banglades
hIreland
Czech
Republic
Base: Base: Businesses who think the policy is relevant to their business - TPP/CPTPP n=5027
Positive impact
No impact
Negative impact
Impact on my business in the next 2 years (%) (Q31)
Q31: Thinking forward to the next 2 years, how will these trade agreements impact your
business?
Significantly higher than Global average
Significantly lower than Global average
TPP/CPTPP is projected to have a positive impact for more than half of businesses in Vietnam, Malaysia,
India, Thailand and Singapore but to be neutral for more than half of businesses in all other countries
TPP/CPTPP

TPP / CPTPP relevance & impact among member markets
77
5548
35 2941
52 55 59
3646 63
6350
44 39 33
9 72
8 95 6 8
Global CPTPP Vietnam Malaysia Singapore Australia Canada Mexico
Base: Base:
Q30: GLOBAL n=6033; TPP/CPTPP members n= 1150
Q31: Businesses who think the policy is relevant to their business –
TPP/CPTPP GLOBAL n=5027; TPP/CPTPP members n= 997
Positive impact
No impact
Negative impact
Impact on my business in the next 2 years (%) (Q31)
Q31: Thinking forward to the next 2 years, how will these trade agreements impact your
business?
Significantly higher than Global average
Significantly lower than Global average
TPP/CPTPP
Relevance of trade agreements (%) (Q30) 36 45 50 60 50 43 40 35
CPTPP members feel the policy to be particularly relevant and think it is positive to their businesses.
Especially Vietnam, Malaysia & Singapore
New

Trade agreements
78
GLOBAL
Asia Pacific
Europe
North America
Argentina/ South America
MENA
Emerging
Developed
Business Banking
Corporates
Domestic
International
Services
Non-Services
Impact on my business in the next 2 years (%) (Q31)
6
5
6
7
5
6
6
6
6
6
4
7
6
6
57
46
67
61
68
61
48
65
64
51
69
51
62
54
37
49
27
32
27
32
46
29
31
42
27
42
32
40
Relevance of trade agreements (%) (Q30)
35
45
25
35
22
25
42
29
27
42
23
41
29
39
Will help my business
No impact
Will not help my business
Base:
Q30: GLOBAL n=6033
Q31: Businesses who think the policy is relevant to their business - ASEAN n=5067
• Region: Asia Pacific n=2289, Europe n=1410, North America n=681, Argentina/ South
America n=170, MENA n=517
Base: Q31:
• Development: Emerging n=2972, Developed n=2095
• Size: Business Banking n=2809, Corporates n=2258
• Domestic n=1704, International n=3363
• Industry Sector: Services n=2146, Non-Services n=2921
Significantly higher than Global average
Significantly lower than Global average
PA trade agreements are more relevant in APAC but for under half of businesses. More corporates,
international and non service businesses think that the impact will be positive.
PA

Impact of trade agreements in the next 2 years
79
57
31 35 3443 46 48 47 51
59 60 60 58 58 64 62 62 67 61 68 66 66 69 6876
90 96
37
6260 58
53 51 5045 43
37 36 3534 34
33 30 3029
2727 27 26 26 25 11
10 4
6 6 5 8 5 2 18 7 4 3 5
9 84
8 84
125 7 8 5 7
12
Global
Malaysia India Thailand China Australia Vietnam Singapore Mexico UAEHong
KongUK
Saudi
Arabia
South
KoreaCanada USA France Indonesia Poland Argentina Netherlands Turkey Germany Egypt Bangladesh
Czech
RepublicIreland
Base: Base: Businesses who think the policy is relevant to their business - ASEAN n=5067
Positive impact
No impact
Negative impact
Impact on my business in the next 2 years (%) (Q31)
Q31: Thinking forward to the next 2 years, how will these trade agreements impact your
business?
Significantly higher than Global average
Significantly lower than Global average
PA trade agreements will have a positive impact for more than half of businesses in Malaysia, India,
Thailand, Australia and Vietnam
PA

Typically trade agreements are viewed as likely to have a positive impact on businesses
Impact of trade agreements in the next 2 years
80
Impact on my business in the next 2 years (%) (Q31)
Base:
Q30: GLOBAL N=6033
Q31: EEA n=5205, ASEAN n=5224, NAFTA n=5153, SAFTA n=5129, CETA-EU-
CANADA n=5096, EU-Japan n=5190, TPP/CPTPP n=5027, PA n=5067
Q30: Thinking of various trade agreements, which of these trade agreements have been
relevant to your business?
Q31: Thinking forward to the next 2 years, how will these trade agreements impact your
business?
EEA
Top 3 markets will help most
India 70 %
Czech Republic 61 %
Poland 61 %
Top 3 markets will hinder most
UK -13 %
South Korea -12 %
Bangladesh -12 %
ASEAN
Top 3 markets will help most
India 77 %
Malaysia 73 %
Vietnam 73 %
Top 3 markets will hinder most
Bangladesh -16 %
Australia -9 %
France -9 %
NAFTA
Top 3 markets will help most
India 68 %
China 58 %
Mexico 53 %
Top 3 markets will hinder most
Mexico -16 %
Malaysia -14 %
Canada -13 %
SAFTA
Top 3 markets will help most
India 74 %
Thailand 67 %
Singapore 62 %
Top 3 markets will hinder most
Bangladesh -11 %
Thailand -9 %
South Korea -9 %
CETA
Top 3 markets will help most
India 62 %
China 49 %
Mexico 48 %
Top 3 markets will hinder most
Bangladesh -14 %
Poland -11 %
South Korea -11 %
EU-Japan
Top 3 markets will help most
India 61 %
Malaysia 56 %
Indonesia 51 %
Top 3 markets will hinder most
South Korea -16 %
Bangladesh -16 %
Malaysia -12 %
TPP /CPTPP
Top 3 markets will help most
Vietnam 63 %
Malaysia 63 %
India 58 %
Top 3 markets will hinder most
USA -13 %
Bangladesh -12 %
China -11 %
PA
Top 3 markets will help most
Malaysia 62 %
India 60 %
Thailand 58 %
Top 3 markets will hinder most
Bangladesh -12 %
Poland -12 %
Saudi Arabia -9 %

The Growth And Impact Of Data Security/A More Level Playing Field Or
Dangerous Territory
Chapter 5
81

Cyber security is a significant universal concern. Yet businesses see greater data access as creating a
more level playing field
82
Cyber security is top concern and increasingly so for almost four-fifths of businesses globally; specifically for businesses in Ireland, China and Thailand (more than nine in
ten). Businesses, particularly those from APAC, are primarily concerned about cyber security issues but at the same time looking forward to the positive impact of easier
data access in the creation of a more level playing field in international trade. Such sentiments are not as strong in Europe, and cyber security is not causing as many
worries in MENA.
Those with a positive trade outlook are significantly more likely (81%) to think that better data access will create a more level playing field than creating unfair competition
(61%). This same pattern is true for businesses in emerging markets (82% compared to 61%) and for manufacturing businesses (81% compared to 59%). Corporates are
particularly positive about a more level playing field in international business as facilitated by easier access to data (81%) although they also have more concerns about
cyber security than BB businesses (83% compared to 76%).
Six in ten companies globally fear that big data will create unfair competition, this increases to seven in ten businesses in Mexico, Australia, Malaysia and India and more
than eight in ten (84%) in Thailand.
Two-thirds of businesses across all countries fear that data regulatory requirements will create barriers to cross border service delivery, this is a significantly greater
concern in Thailand (85%); Malaysia (80%); Australia (76%) and Hong Kong and the UK (73%).

59 6158 58
42
59
66 6866 67
56
60
79
88
72
7975
62
77
85
70
76 75 74
GLOBAL Asia Pacific Europe North America Argentina/South America
MENA
Cyber security is a universal concern and, on balance, access to data creates a more level playing field
although future regulation and uneven big data capabilities could become barriers
Role of digital
83
(% Agree) (Q35)
• Businesses, particularly those from APAC, are
primarily concerned about cyber security issues
but at the same time looking forward to the
positive impact creating fairer competition in
international businesses. Such sentiments are
not as strong in Europe, and cyber security is not
causing as many converns in MENA.
• Corporates are particularly positive about a more
level playing field in international business as
facilitated by easier access to data (81%).
Role of Digital & dataBig data capabilities of companies will create barriers to
open competition
Data regulatory requirements will create barriers to
cross border service delivery
Cyber security is an increasing concern for my business
Easier access to data is creating a more level playing
field in international business
Base: GLOBAL N=6033
• Region: Asia Pacific n=2757, Europe n=1626, North America n=750, Argentina/
South America n=200, MENA n=700Significantly higher than Global average
Significantly lower than Global averageQ35: Thinking about the use of digital and data, please indicate whether you agree or
disagree with each of the statements here.

59 6158 59 59
5760 61
55
6366 66 66 66 67
6468 68
6467
7984
75 76
83
7880
83
727777
82
73 73
81
7578
81
7074
GLOBAL Emerging Developed BB Corporates Domestic Operator InternationalOperator
Positive Stable Negative
Universally, cyber security is the biggest concern. Businesses in emerging markets and those with a
growth outlook are the most positive about easier access to data creating a more level playing field
Role of digital
84
(% Agree) (Q35)
Big data capabilities of companies will create barriers to
open competition
Data regulatory requirements will create barriers to
cross border service delivery
Cyber security is an increasing concern for my business
Easier access to data is creating a more level playing
field in international business
Base: GLOBAL N=6033
• Size: BB n=3428, Corporates n=2605
• Development: Emerging n=3657, Developed n=2376
• Domestic Operator n=2014, International operator n=4019
• Trade Outlook: Positive outlook n=3717, stable n=702, negative n=162
Significantly higher than Global average
Significantly lower than Global average
Q35: Thinking about the use of digital and data, please indicate whether you agree or
disagree with each of the statements here.
Emerging/Developed
countries
Size of company Domestic/International
operatorTrade outlook

59 58 5962
5956
66 6663
6769
66
79 7981
78
82
69
7775
78 7781
73
GLOBAL Services Wholesale / RetailTrading
Construction Manufacturing Agriculture /Fishing / Forestry
Directionally, there are no real differences in the views of those in different sectors although those in
manufacturing are most positive about data access creating a more level playing field
Role of digital
85
(% Agree) (Q35)
Big data capabilities of companies will create barriers to
open competition
Data regulatory requirements will create barriers to
cross border service delivery
Cyber security is an increasing concern for my business
Easier access to data is creating a more level playing
field in international business
Base: GLOBAL N=6033
• Industry Sector: Services n=2574, Wholesale / Retail n=866, Construction n=823,
Manufacturing n=1333, Agriculture / Fishing / Forestry n=297Significantly higher than Global average
Significantly lower than Global averageQ35: Thinking about the use of digital and data, please indicate whether you agree or
disagree with each of the statements here.
Industry Sectors

86
Businesses in China and Singapore are most positive about data creating a more level playing field but businesses in
Thailand, Australia, India and Malaysia, which are among the most positive and also the most wary
Role of digital
Significantly higher than Global average
Significantly lower than Global average
(% Agree) (Q35)
Big data capabilities of
companies will create
barriers to open competition
Data regulatory
requirements will create
barriers to cross border
service delivery
Cyber security is an
increasing concern for my
business
Easier access to data is
creating a more level playing
field in international
business
GLOBAL
Thailand 84% Thailand 85% Ireland 96% China 92%
Mexico 70% Malaysia 80% China 95% Thailand 88%
Australia 70% Australia 76% Thailand 93% Singapore 87%
Malaysia 70% Hong Kong 73% Singapore 88% Australia 86%
India 70% UK 73% Hong Kong 86% India 84%
UK 68% Ireland 70% India 86% Malaysia 84%
Singapore 68% Vietnam 69% South Korea 84% Ireland 84%
Saudi Arabia 65% India 69% Malaysia 83% Vietnam 81%
Ireland 62% South Korea 69% UK 83% Saudi Arabia 80%
Poland 61% Mexico 69% USA 82% Bangladesh 79%
59% 66% 77%
Base: GLOBAL N=6033
79%
Q35: Thinking about the use of digital and data, please indicate whether you agree or
disagree with each of the statements here.

AppendixIntroduction to trade survey and sample composition
87

88
(%) World Australia Bangladesh China Hong Kong India Indonesia Malaysia Singapore South Korea Thailand Vietnam
Sample Size 6033 200 201 350 350 350 206 200 150 350 200 200
Role in Company
Sole decision maker 46 63 12 79 39 69 30 58 53 27 59 22
One of the key decision makers 34 21 68 18 42 25 50 29 31 47 28 53
Some influence 19 17 19 3 18 6 20 14 17 26 14 25
Job Title
C-suite 49 63 48 74 41 72 37 58 53 41 56 20
Finance & Accounting 23 20 48 16 28 13 51 20 22 23 16 62
Supply Chain and Procurement 8 5 2 6 10 8 1 6 10 9 12 10
Sales & Marketing 8 3 2 4 12 2 11 3 3 11 10 8
Annual Turnover
BB 57 51 74 26 60 52 84 56 53 55 60 92
Corporates 43 49 26 74 40 48 16 44 47 45 40 8
Company Size/No. of employee
1 - 9 3 3 21 0 2 2 1 2 0 3 2 0
10 - 49 12 15 29 7 10 6 5 11 7 15 7 28
50 - 249 25 28 20 13 27 17 30 26 29 32 19 49
250 - 499 21 22 8 35 24 26 26 28 27 16 36 14
500+ 39 33 21 44 37 49 38 35 37 33 37 11
Industry
Services 43 35 35 33 48 39 30 55 47 42 39 32
Non-services 57 66 65 67 52 61 70 46 53 58 62 68
Wholesale/retail 14 15 15 13 19 13 18 6 20 11 19 15
Construction 14 17 17 13 11 13 18 11 17 13 19 16
Manufacturing 24 28 27 31 22 30 16 25 15 33 18 26
Agriculture 5 7 5 9 0 5 18 5 1 1 7 11
Domestic/International
Domestic 33 40 40 32 17 20 38 34 15 40 39 41
International 67 60 60 68 83 80 62 66 85 60 62 60
Sample composition – APAC

89
(%) World Australia Bangladesh China Hong Kong India Indonesia Malaysia Singapore South Korea Thailand Vietnam
Sample Size 6033 200 201 350 350 350 206 200 150 350 200 200
Annual Turnover
BB 57 51 74 26 60 52 84 56 53 55 60 92
Corporates 43 49 26 74 40 48 16 44 47 45 40 8
USD 5 – 10 million 13 18 7 16 16 25 11 20 21
Over USD 10 million to 20 million 11 12 6 21 13 11 17 14 18
Over USD 20 million to 30 million 8 12 3 13 10 7 11 10 14
Over USD 30 million to 50 million 9 10 9 10 12 14 13 11 8
Over USD 50 million to 100 million 10 19 17 14 13 10 9 13 14
Over USD 100 million to 200 million 9 11 23 10 9 15 15 9 14
Over USD 200 million to 250 million 6 10 21 7 10 11 7 4 6
Over USD 250 million to 500 million 5 5 10 4 8 3 6 5 3
Over USD 500 million 8 6 4 5 8 6 11 13 4
USD 2.5 – 5 million 40
Over USD 5 million to 10 million 21
Over USD 10 million to 20 million 7
Over USD 20 million to 25 million 5
Over USD 25 million to 50 million 9
Over USD 50 million to 100 million 7
Over USD 100 million to 250 million 4
Over USD 250 million to 500 million 2
Over USD 500 million 3
USD 1.75 – 2.5 million 25
Over USD 2.5 million to 5 million 38
Over USD 5 million to 10 million 14
Over USD 10 million to 16.5 million 7
Over USD 16.5 million to 25 million 15
Over USD 25 million to 50 million 1
USD 3 – 5 million 58
Over USD 5 million to 10 million 20
Over USD 10 million to 20 million 12
Over USD 20 million to 40 million 3
Over USD 40 million to 100 million 4
Over USD 100 million to 200 million 1
Over USD 200 million to 250 million 2
Over USD 250 million to 500 million 1
Over USD 500 million 2
Sample composition (BB vs. C) – APAC
BB
Corporate
New

90
(%) World France Germany Ireland Netherlands Poland UK Czech Republic
Sample Size 6033 350 350 121 200 200 350 55
Role in Company
Sole decision maker 46 62 47 1 35 42 62 5
One of the key decision makers 34 22 31 60 32 38 25 58
Some influence 19 16 21 39 34 20 13 36
Job Title
C-suite 49 42 41 43 47 39 66 35
Finance & Accounting 23 23 16 44 18 21 15 20
Supply Chain and Procurement 8 9 12 6 8 12 8 16
Sales & Marketing 8 6 11 4 7 11 4 9
Annual Turnover
BB 57 51 46 60 60 60 55 67
Corporates 43 49 54 40 40 40 45 33
Company Size/No. of employee
1 - 9 3 2 1 6 1 2 1 2
10 - 49 12 7 7 23 13 11 9 11
50 - 249 25 20 24 45 24 28 27 53
250 - 499 21 20 20 11 25 22 20 22
500+ 39 50 48 16 38 38 43 13
Industry
Services 43 45 42 50 48 45 41 35
Non-services 57 55 58 50 52 56 59 65
Wholesale/retail 14 16 13 16 19 11 13 18
Construction 14 15 10 9 14 14 11 11
Manufacturing 24 20 32 22 15 29 31 22
Agriculture 5 5 3 3 5 3 3 15
Domestic/International
Domestic 33 30 34 19 37 32 33 20
International 67 70 66 81 63 68 67 80
Sample composition – Europe

91
(%) World France Germany Ireland Netherlands Poland UK Czech Republic
Sample Size 6033 350 350 121 200 200 350 55
Annual Turnover
BB 57 51 46 60 60 60 55 67
Corporates 43 49 54 40 40 40 45 33
USD 5 – 10 million 13 18 13 21 19 16 9
Over USD 10 million to 20 million 11 12 11 14 16 14 24
Over USD 20 million to 30 million 8 12 9 13 11 12 16
Over USD 30 million to 50 million 9 9 13 13 15 13 18
Over USD 50 million to 100 million 10 10 10 9 19 11 13
Over USD 100 million to 200 million 9 9 10 10 10 11 9Over USD 200 million to 250 million 6 8 6 5 4 7 2
Over USD 250 million to 500 million 5 7 9 3 1 8 7Over USD 500 million 8 15 18 14 7 9 2
USD 2.5 – 5 million 7
Over USD 5 million to 10 million 11
Over USD 10 million to 20 million 17
Over USD 20 million to 50 million 26
Over USD 50 million to 100 million 12
Over USD 100 million to 200 million 9
Over USD 200 million to 250 million 3
Over USD 250 million to 500 million 7
Over USD 500 million 7
Sample composition (BB vs. C) – Europe
BB
Corporate
New

92
(%) World Canada Mexico USA Argentina Egypt Saudi Arabia Turkey UAE
Sample Size 6033 200 200 350 200 200 150 200 150
Role in Company
Sole decision maker 46 59 62 50 33 24 39 38 43
One of the key decision makers 34 24 26 27 42 40 31 37 39
Some influence 19 18 13 23 26 37 30 26 18
Job Title
C-suite 49 58 53 64 24 49 34 35 34
Finance & Accounting 23 11 12 11 19 24 26 22 21
Supply Chain and Procurement 8 10 7 9 10 4 6 10 10
Sales & Marketing 8 4 9 11 13 14 19 10 21
Annual Turnover
BB 57 51 66 40 66 65 70 60 62
Corporates 43 50 35 60 34 35 30 41 38
Company Size/No. of employee
1 - 9 3 1 1 1 7 9 1 6 3
10 - 49 12 10 9 9 18 18 7 15 14
50 - 249 25 25 21 21 21 21 25 30 26
250 - 499 21 19 24 16 18 11 22 13 17
500+ 39 47 46 54 35 41 43 37 41
Industry
Services 43 54 47 38 48 45 48 52 56
Non-services 57 47 54 62 52 55 52 49 44
Wholesale/retail 14 13 15 13 15 19 13 8 15
Construction 14 6 15 13 13 16 18 19 12
Manufacturing 24 24 19 30 21 18 19 15 16
Agriculture 5 4 5 6 4 4 2 7 1
Domestic/International
Domestic 33 31 44 41 48 40 29 43 25
International 67 69 57 59 53 60 71 57 75
Sample composition – Americas / MENA

93
(%) World Canada Mexico USA Argentina Egypt Saudi Arabia Turkey UAE
Sample Size 6033 200 200 350 200 200 150 200 150Annual Turnover
BB 57 51 66 40 66 65 70 60 62
Corporates 43 50 35 60 34 35 30 41 38
USD 5 – 10 million 13 14 26 13 25 23
Over USD 10 million to 20 million 11 16 15 11 14 13
Over USD 20 million to 30 million 8 7 12 7 12 19
Over USD 30 million to 50 million 9 14 14 9 9 7
Over USD 50 million to 100 million 10 11 9 12 9 10
Over USD 100 million to 200 million 9 15 11 10 8 10
Over USD 200 million to 250 million 6 6 6 7 6 5
Over USD 250 million to 500 million 5 6 8 9 7 3
Over USD 500 million 8 13 2 23 12 10
USD 3.5 – 5 million 22
Over USD 5 million to 10 million 22
Over USD 10 million to 20 million 13
Over USD 20 million to 40 million 10
Over USD 40 million to 100 million 8
Over USD 100 million to 200 million 7
Over USD 200 million to 250 million 4
Over USD 250 million to 500 million 3
Over USD 500 million 13
USD 5 – 10 million 40 34
Over USD 10 million to 20 million 15 13
Over USD 20 million to 30 million 6 11
Over USD 30 million to 45 million 6 13
Over USD 45 million to 100 million 14 10
Over USD 100 million to 200 million 6 5
Over USD 200 million to 250 million 2 5
Over USD 250 million to 500 million 2 3
Over USD 500 million 12 8
Sample composition (BB vs. C) – Europe
BB
Corporate
New

AppendixOther supporting charts
94

Trade agreements
95
42%Relevance of trade agreements (%) (Q30)
Mexico India Canada USA China Poland Australia Thailand UK MalaysiaSouth
KoreaUAE Germany Hong Kong France
Saudi
ArabiaArgentina Egypt Netherlands Singapore Turkey
Czech
RepublicIreland Indonesia Vietnam Bangladesh
6864
58 5853
47
41 40 39 3835 34 33
30 29 29 28 27 2523 23 22 20 20
17 16
Significantly higher than Global average
Significantly lower than Global average
Base: GLOBAL N=6033
Q30: Thinking of various trade agreements, which of these trade agreements have been
relevant to your business?
Relevance of trade agreements - NAFTA

Trade agreements
96
38%Relevance of trade agreements (%) (Q30)
India Malaysia Thailand Singapore China AustraliaHong
KongVietnam USA Indonesia UK Mexico UAE
Saudi
ArabiaPoland
Bangla-
deshGermany France Turkey Canada
South
Korea
Nether-
landsArgentina Egypt
Czech
RepublicIreland
71
6360
57 56
47
40 3835 35 35 34 33 32 31 30 28 27 26 25 24 23
2018
117
Relevance of trade agreements - SAFTA
Significantly higher than Global average
Significantly lower than Global average
Base: GLOBAL N=6033
Q30: Thinking of various trade agreements, which of these trade agreements have been
relevant to your business?

Trade agreements
97
43%Relevance of trade agreements (%) (Q30)
Singapore Malaysia Thailand Vietnam India China IndonesiaSouth
KoreaAustralia
Saudi
ArabiaPoland USA UAE Egypt
Hong
Kong
Bangla-
deshTurkey UK Germany Mexico Argentina
Nether-
landsFrance Canada
Czech
RepublicIreland
76 74 73 7268
57
51 49 48 48 46
39 38 38 38 37 37 3633 32 31 31
28 27
11 10
Significantly higher than Global average
Significantly lower than Global average
Base: GLOBAL N=6033
Q30: Thinking of various trade agreements, which of these trade agreements have been
relevant to your business?
Relevance of trade agreements - ASEAN

Trade agreements
98
45%Relevance of trade agreements (%) (Q30)
Czech
RepublicIndia Ireland China UK Poland Germany Malaysia France Australia
Saudi
ArabiaTurkey UAE Thailand
Nether-
landsUSA Egypt
Hong
KongMexico Canada Indonesia Singapore Vietnam
South
KoreaArgentina
Bangla-
desh
72
63 6158 56
53 5247 47 47 46 45 44 44 43
3735 35 34 33 32
30 30 28
2016
Significantly higher than Global average
Significantly lower than Global average
Base: GLOBAL N=6033
Q30: Thinking of various trade agreements, which of these trade agreements have been
relevant to your business?
Relevance of trade agreements - EEA

Trade agreements
99
35%Relevance of trade agreements (%) (Q30)
Thailand India Australia Malaysia Singapore China Mexico Vietnam USA UK PolandHong
Kong
Saudi
ArabiaCanada
South
KoreaIndonesia
Nether-
landsUAE Germany France Argentina Egypt Turkey
Bangla-
desh
Czech
RepublicIreland
5552 51 50 50 49 48 47
34 34 33 3331 29 29
27 27 2624 23 22
18 18
9 85
Significantly higher than Global average
Significantly lower than Global average
Base: GLOBAL N=6033
Q30: Thinking of various trade agreements, which of these trade agreements have been
relevant to your business?
Relevance of trade agreements - PA

Trade agreements
100
36%Relevance of trade agreements (%) (Q30)
Malaysia Thailand India Singapore Vietnam China Australia Canada USA PolandSouth
KoreaMexico
Saudi
Arabia
Hong
KongUK
Nether-
landsIndonesia Germany France UAE Turkey Egypt Argentina
Czech
Republic
Bangla-
deshIreland
60
5451 50 50 50
4340 38 37 36 35 34 33 33
27 27 26 2522 21 20
17
8 7 6
Significantly higher than Global average
Significantly lower than Global average
Base: GLOBAL N=6033
Q30: Thinking of various trade agreements, which of these trade agreements have been
relevant to your business?
Relevance of trade agreements - TPP /
CPTPP

Trade agreements
101
37%Relevance of trade agreements (%) (Q30)
India China Canada Poland Thailand USA Mexico Australia Malaysia UK GermanySaudi
Arabia
Nether-
lands
Hong
KongFrance Singapore Turkey
South
KoreaUAE Egypt Indonesia Vietnam Argentina
Czech
RepublicIreland
Bangla-
desh
55
48 4846 44 43 42 41
39 3734 33 33 31 30
2725 25 25
22 22 20
13 13 12
7
Significantly higher than Global average
Significantly lower than Global average
Base: GLOBAL N=6033
Q30: Thinking of various trade agreements, which of these trade agreements have been
relevant to your business?
Relevance of trade agreements - CETA-EU

Trade agreements
102
37%Relevance of trade agreements (%) (Q30)
59 58
47 46 45 4442 41 39 38 37 36 36 35 35 34 33 32 32
27 27 26
19
13 12
6
India Malaysia China Australia Thailand Indonesia Singapore VietnamSaudi
Arabia
South
KoreaPoland USA UK Turkey Mexico
Hong
KongGermany Egypt
Nether-
landsFrance UAE Canada Argentina Ireland
Bangla-
desh
Czech
Republic
Significantly higher than Global average
Significantly lower than Global average
Base: GLOBAL N=6033
Q30: Thinking of various trade agreements, which of these trade agreements have been
relevant to your business?
Relevance of trade agreements - EU-Japan

Thank You
103