hrv analysis - information services and...
TRANSCRIPT

BME 333 Biomedical Signals and Systems - J.Schesser
92
HRV Analysis
Lesson 12a

BME 333 Biomedical Signals and Systems - J.Schesser
93
BackgroundHeart Rate Variability
• Ability of the heart to handle the ever-present stresses and relaxations placed on the body
• Stresses: Physical, Psychological • Relaxations: Recovery from these stresses
• One may conclude the greater the variability, the better the heart can keep up with changes and, therefore, healthier the person
BME 333 Biomedical Signals and Systems - J.Schesser
94
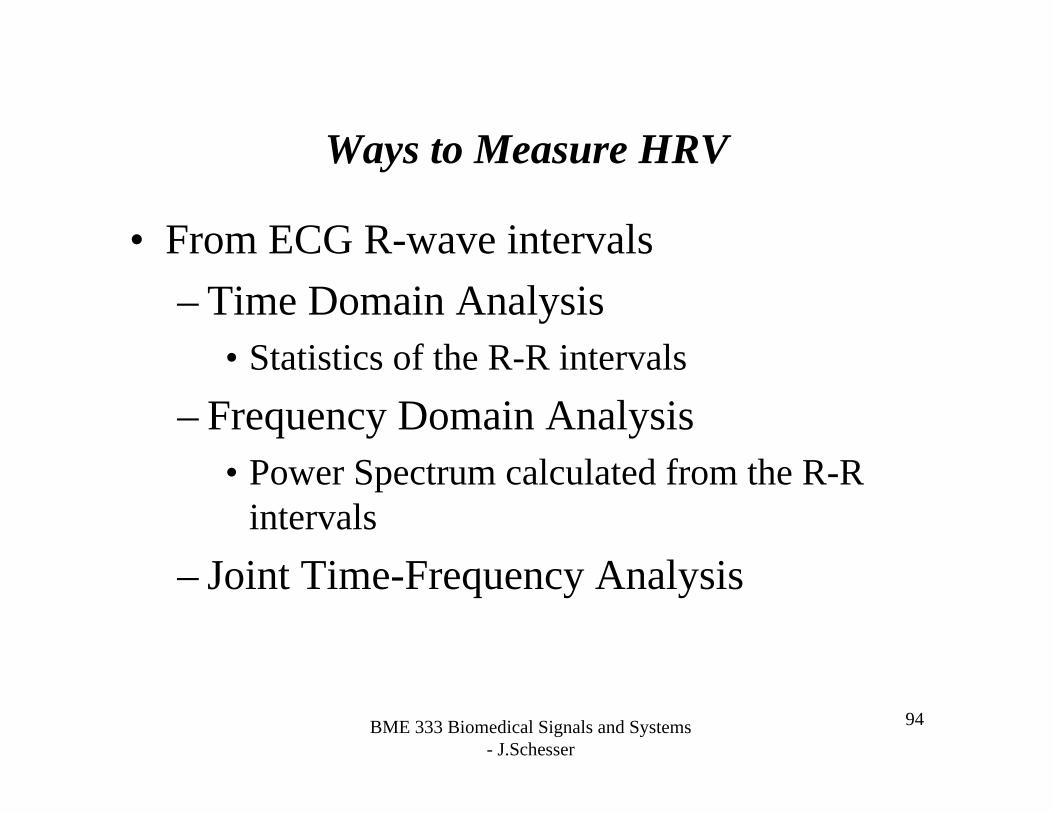
Ways to Measure HRV
• From ECG R-wave intervals– Time Domain Analysis
• Statistics of the R-R intervals– Frequency Domain Analysis
• Power Spectrum calculated from the R-R intervals
– Joint Time-Frequency Analysis
BME 333 Biomedical Signals and Systems - J.Schesser
95
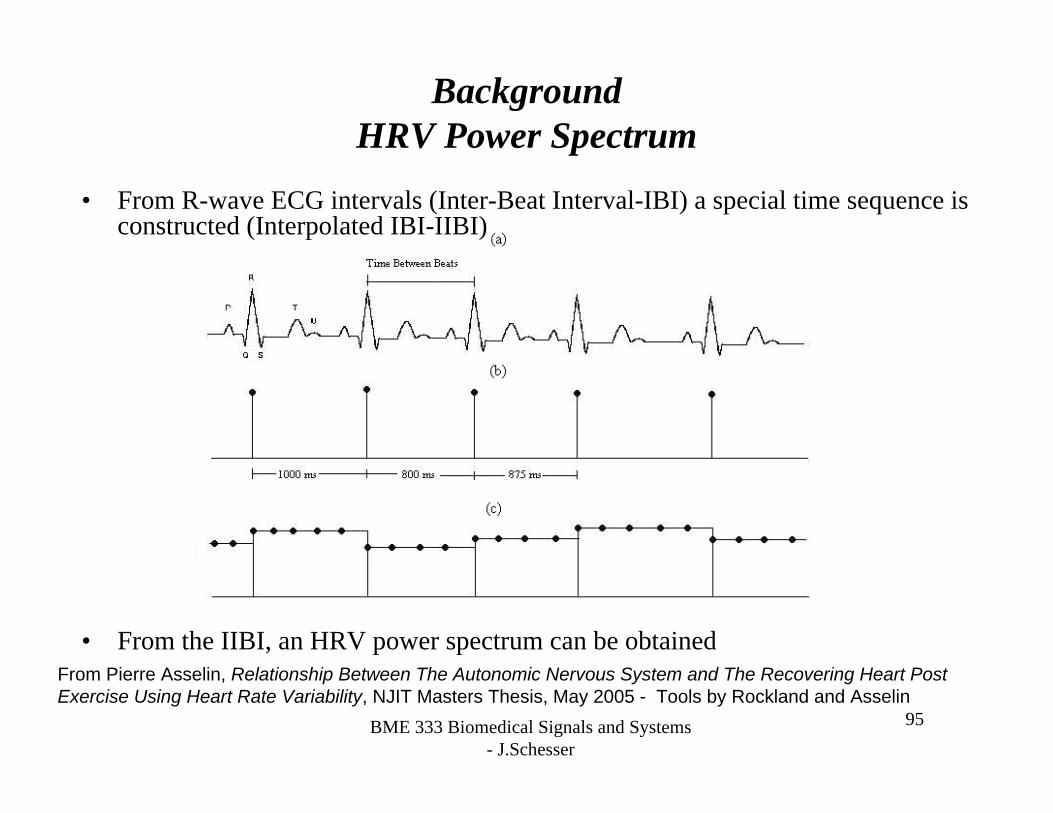
• From R-wave ECG intervals (Inter-Beat Interval-IBI) a special time sequence is constructed (Interpolated IBI-IIBI)
• From the IIBI, an HRV power spectrum can be obtainedFrom Pierre Asselin, Relationship Between The Autonomic Nervous System and The Recovering Heart Post Exercise Using Heart Rate Variability, NJIT Masters Thesis, May 2005 - Tools by Rockland and Asselin
BackgroundHRV Power Spectrum

BME 333 Biomedical Signals and Systems - J.Schesser
96
BackgroundHRV Measurements
• From the IIBI, the HRV power spectrum is generated.
Borrowed from Power Spectrum Analysis of Heart Rate Fluctuation: A Quantitative Probe of Beat-To-Beat Cardiovascular Control, S. Akselrod, et.al. Science Vol. 213, 1981

BME 333 Biomedical Signals and Systems - J.Schesser
97
BackgroundHRV Power Spectrum
• From the HRV Spectrum, there are two bands of interest:– The high frequency (HF)
band (typically defined between 0.15 Hz and 0.7 Hz)
– The low frequency (LF) band (typically defined between 0.04 Hz and 0.15 Hz)
Figure borrowed from Power Spectrum Analysis of Heart Rate Fluctuation: A Quantitative Probe of Beat-To-Beat Cardiovascular Control, S. Akselrod, et.al. Science Vol. 213, 1981
HFLF

BME 333 Biomedical Signals and Systems - J.Schesser
98
BackgroundAutonomic Nervous System and HRV
• Sympathetic Branch – increases the heart rate as a result of stress
• Parasympathetic Branch – decreases the heart rate to recover from a stressful state
• It has been shown that:– The HF HRV frequency band is dependent on the
Parasympathetic branch– The LF HRV frequency band is dependent on both the
Parasympathetic and Sympathetic branches– Ratio of LF/HF measure of ANS balance

BME 333 Biomedical Signals and Systems - J.Schesser
99
The sympathetic nervous system and parasympathetic nervous system
(From E. N. Marieb, Human Anatomy and Physiology, 3rd ed. New York: The Benjamin/Cummings Publishing Company, Inc., 1995.)
The Vagus Nerve CN X
BME 333 Biomedical Signals and Systems - J.Schesser
100
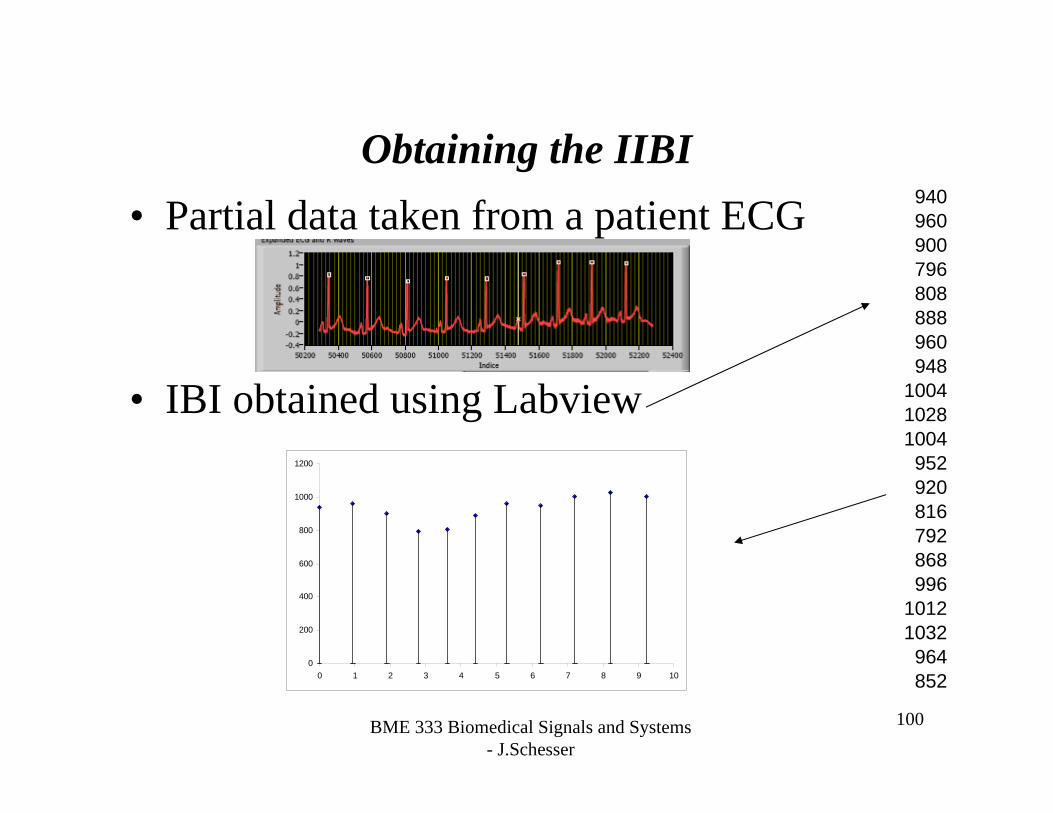
Obtaining the IIBI• Partial data taken from a patient ECG
• IBI obtained using Labview
940960900796808888960948
100410281004952920816792868996
10121032964852
0
200
400
600
800
1000
1200
0 1 2 3 4 5 6 7 8 9 10
BME 333 Biomedical Signals and Systems - J.Schesser
101
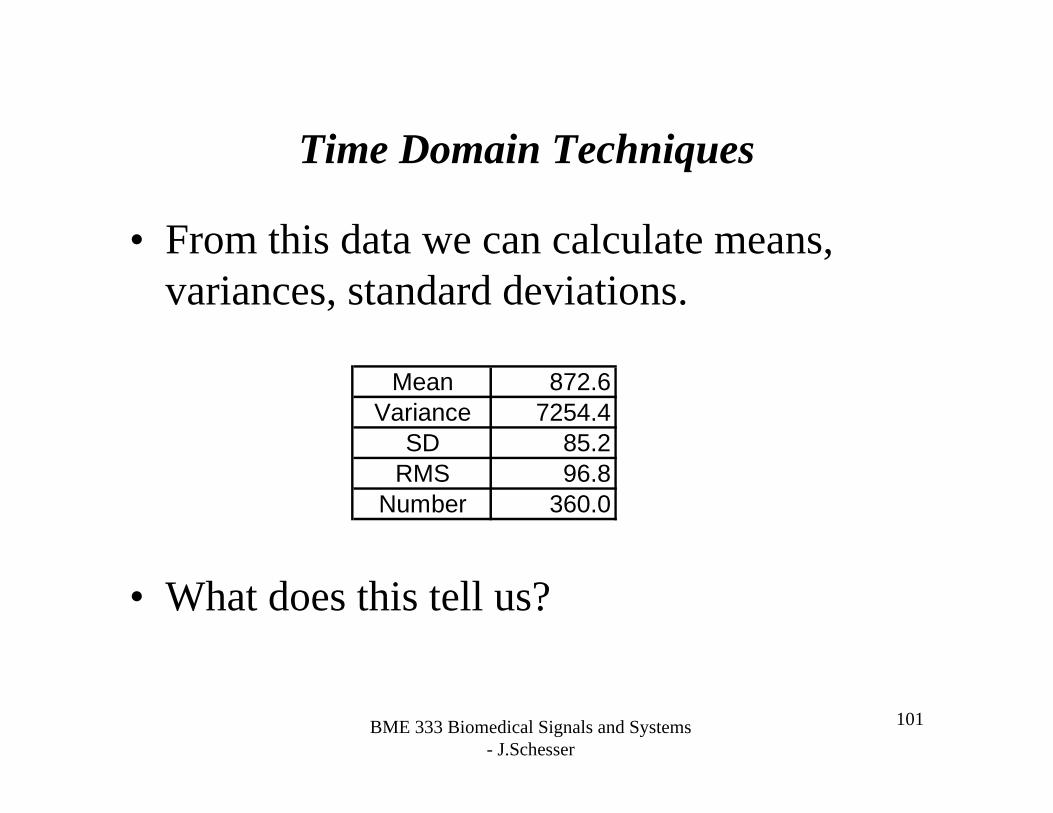
Time Domain Techniques
• From this data we can calculate means, variances, standard deviations.
• What does this tell us?
Mean 872.6Variance 7254.4
SD 85.2RMS 96.8
Number 360.0

BME 333 Biomedical Signals and Systems - J.Schesser
102
Other Statistics
• Hypothesis Testing - If the data can be grouped into different classes, are the classes truly different– Chi-Squared Tests – based on ratios of the population– ANOVA – based on variation of the data among
groups.
2min1minPeak
150
140
130
120
110
100
90
80
Time
Mea
n H
R
A: > 85%B: < 85%
Group
Mean HR vs Time by Group (Direct Method)
2min1minPeak
160
150
140
130
120
110
100
90
80
70
Time
Mea
n H
R
> 85% "Normal"> 85% "Abnormal"
< 85% "Normal"> 85% "Abnormal"
Group/Subgroup
Mean HR vs Time by Health Level (Direct Method)

BME 333 Biomedical Signals and Systems - J.Schesser
103
BackgroundFrequency Domain Techniques
• Using the Fourier Transform to obtain the HRV Spectrum
• IIBI obtained from IBI: sample rate 4s/s
( ) ( )∫∞
∞−
−⋅= dtetxfX ftjπ2
0
200
400
600
800
1000
1200
0 1 2 3 4 5 6 7 8 9 10

BME 333 Biomedical Signals and Systems - J.Schesser
104
FFT• Fast Fourier Transform of the IIBI sequence • Note patient was supposed to be breathing at 12
breaths/min = 0.2 Hz
• This tells us more but is that enough?
0
5000
10000
15000
20000
25000
30000
35000
40000
0 0.1 0.2 0.3 0.4 0.5

BME 333 Biomedical Signals and Systems - J.Schesser
105
LabviewPane 1. ECG
Pane 2. R-wave Detection
Pane 3. IBI signal
Pane 4. Expanded ECG
Pane 5. HRV Spectrum

BME 333 Biomedical Signals and Systems - J.Schesser
106
BackgroundFrequency Domain Techniques
• Integration is over time no information about frequency changes over time
• If we want to observe HRV as stresses and relaxations occur and how the ANS operates, we need a better method than the FT
• Use Joint Time-Frequency Analysis - JTFA

BME 333 Biomedical Signals and Systems - J.Schesser
107
BackgroundJTFA Techniques
• Windowing and the FT (STFT)
– This method yields which frequencies are present over the span of time defined by the window
– However, too short a window may miss lower frequencies while too long a window may miss any frequency changes in time
– Hence we have a time and frequency resolution problem
( ) ( ) ( )[ ] dtettxfSTFT ftj πτ
τ
τγτ 2, −Δ+
Δ−
∗∫ ⋅−=

BME 333 Biomedical Signals and Systems - J.Schesser
108
BackgroundJTFA Techniques
• Wavelets
– Wavelets tries to overcome the such problems techniques
– The signal is multiplied by a “window/transformation”function where the window can be both
• Widened and narrowed (scale parameter: s) • Time shifted (time shift parameter: τ)
– For example, for a given τ, several calculations of WT can be made for various values of s
– As a result a 3D plot is obtained
dts
ttxssWT ∫∞
∞−
∗−⎟⎠⎞
⎜⎝⎛ −
=τψτ )(),( 2
1

BME 333 Biomedical Signals and Systems - J.Schesser
109
BackgroundJTFA Techniques
• Wavelets – Since it can be shown that frequency and the
scale parameter are inversely related, then we can build a 3D plot of frequency changes in time
– However, we still have resolution problem due to the Heisenberg Uncertainty Principle – a tradeoff between time and frequency resolution

BME 333 Biomedical Signals and Systems - J.Schesser
110
Heisenberg Uncertainty Principle
• Figure (a) for Wavelets, (b) for STFT
Time
Freq
uenc
y
Time
(a) (b)
Freq
uenc
y

BME 333 Biomedical Signals and Systems - J.Schesser
111
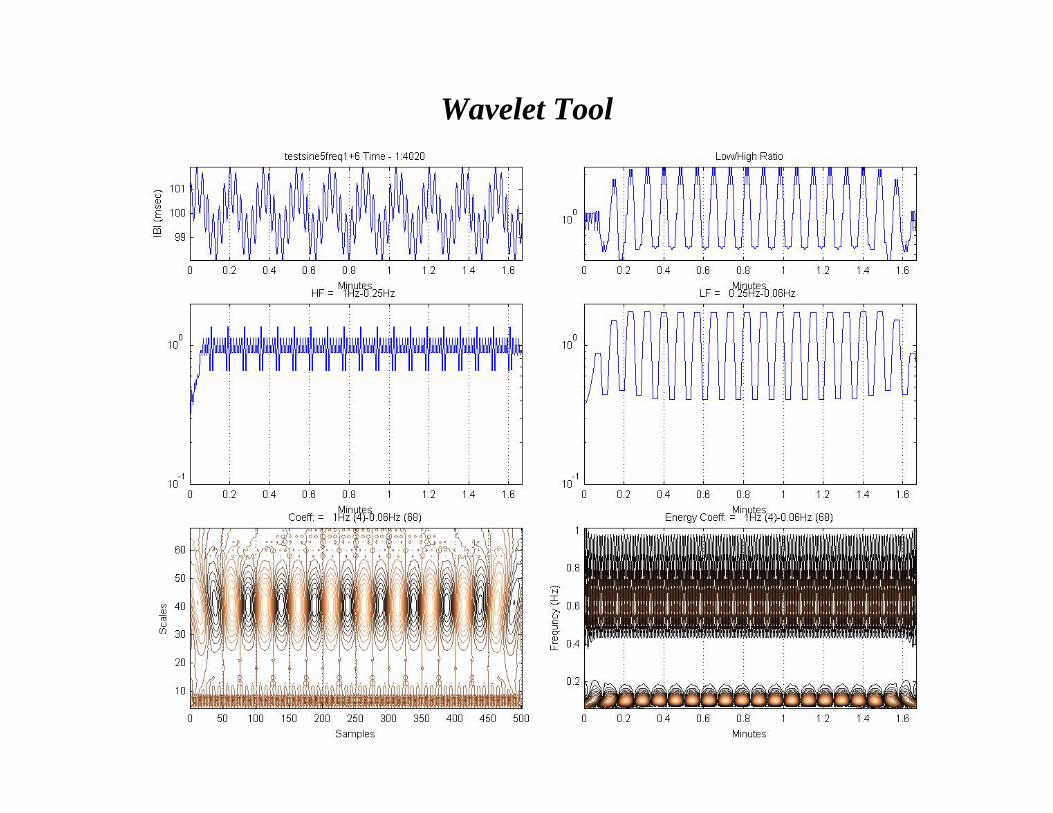
BackgroundA Classic Test
• How do we distinguish between sequential series of frequencies vs concurrent series of frequencies

BME 333 Biomedical Signals and Systems - J.Schesser
112
Wavelet Tool
BME 333 Biomedical Signals and Systems - J.Schesser
113
Wavelet Tool

BME 333 Biomedical Signals and Systems - J.Schesser
114
An Experiment
• Monitor the HRV of subjects undergoing an exercise regime.
• The three phases of concern were– a resting phase prior to the exercise, – the exercise phase,– a recovery phase.
• HRV Spectrum and the average energy in the HF and LF bands during each of the three phases were calculated. – The IBI of various subjects was obtained using a
Polar® S810i watch.

BME 333 Biomedical Signals and Systems - J.Schesser
115
Typical Results

BME 333 Biomedical Signals and Systems - J.Schesser
116
Our Expectations• Our expectations were simple.
1. ANS takes on a nominal value 2. During the exercise phase, when the heart rate
increases, – Sympathetic Enhancement
3. Finally, during the recovery phase, when the heart rate decreases, – Parasympathetic Enhancement

BME 333 Biomedical Signals and Systems - J.Schesser
117
Class 1: Indicate a shift toward relative vagalenhancement1
a) LF decreases and HF is unchanged or increased. This indicates a reduction in sympathetic activity. If HF is increased, then vagal activity is increased.
b) LF is unchanged and HF increases, indicating a reduction in sympathetic activity and an increase in vagal activity.
c) Both LF and HF increase, but their ratio (LF/HF) is unchanged or reduced, indicating increased vagalactivity (HF increasing more would reduce the ratio) and unchanged or reduced sympathetic activity.
d) Both LF and HF decrease and their ratio decreases, indicating decreased vagal and sympathetic activity, with a shift in balance towards relative vagal enhancement.

BME 333 Biomedical Signals and Systems - J.Schesser
118
Class 2: Indicate a shift in balance toward relative sympathetic enhancement1
a) HF decreases and LF increases or is unchanged, indicating a reduction in vagal activity and increase in sympathetic activity.
b) LF increases and HF unchanged, indicating increased sympathetic activity and unchanged vagal activity
c) Both LF and HF decrease and their ratio is unchanged, indicating reduction of vagal activity without considerable change of sympathetic activity.
d) Both LF and HF increase and their ratio increases, indicating increased vagal and sympathetic activities, with a shift in balance toward relative sympathetic enhancement.

BME 333 Biomedical Signals and Systems - J.Schesser
119
Expectations
1. During the resting phase, HF and LF would individually take on a nominal value.
2. During the exercise phase, when the heart rate increases,
– parasympathetic activity would diminish, and perhaps the sympathetic activity would increase.
– Therefore, it was expected that HF would diminish while the ratio of LF/HF would increase.
3. Finally, during the recovery phase, when the heart rate decreases,
– parasympathetic activity should increase and/or sympathetic activity would diminish.
– This would mean that HF would increase and LF/HF ratio would decrease.

BME 333 Biomedical Signals and Systems - J.Schesser
120
Problems• Note there are some glaring inconsistencies during the exercise and recovery
phases. • At the start of the exercise phase both HF and LF drop but the LF/HF ratio
initially decreases and then rises but never to a value greater than its resting phase value.

BME 333 Biomedical Signals and Systems - J.Schesser
121
Problems• Finally, during the recovery phase (> 13 min)
LF rises first while HF lags behind.
HF catches to LF up here
BME 333 Biomedical Signals and Systems - J.Schesser
122
What could be wrong?
• Wavelets are not suitable for HRV analysis. • Bad Data• The MATLAB® tool developed for this study
had a defect.• A new HRV-ANS dynamic was being
observed.
BME 333 Biomedical Signals and Systems - J.Schesser
123
As A Result• Rigorously, test the tool
– Tested other Subjects– Calibration Testing
1. Single sine waves at HF and LF frequencies2. Multi-sine waves in the HF and LF bands
• Sequential: multiple signals at different frequencies but occurring at different times
• Simultaneous: multiple signals at different frequencies but occurring at the same time
3. Repeat of tests 1 and 2 using square waves– Stylized IBI signals: simple IBI waveform amplitude modulated with
a single sine wave or square wave.• Result:
– Same sort of dynamics with other subjects– Some bugs found but none which explained these problems

BME 333 Biomedical Signals and Systems - J.Schesser
124
As A Result• Subject the same data to other JTFA tools.
– To assess the applicability of Wavelet Analysis, the following JTFA tools were used:
• Short Term Fourier Transforms (STFT)• Gabor, Choi-Williams and Smoothed Pseudo-Wigner Ville distributions.• A frequency based (rather than scale based) Wavelet Tool* obtained as a
result of our literature search.• Result:
– We learned about how the Matlab tools worked and how care must be taken to use them
• At first we saw the STFT testing was producing consist results with our understanding of HRV-ANS physiology.
– Although each obviously produced a different Spectrum using the above mentioned tools, the calculation of the LF and HF bands showed the same inconsistent dynamic behavior in the exercise and recovery phases.
*Tool From E.Toledo, O. Gurevitz, H. Hod, M. Eldar and S. Akselrod, “Wavelet analysis of instantaneous heart rate: a study in autonomic control during thrombolysis” in Am J Physiol Regul Intefr Comp Physiol, vol. 284; p. R1079-R1091, 2003.- Testing by Rockland, Asselin, & Donnely

BME 333 Biomedical Signals and Systems - J.Schesser
125
As A Result
• Literature search was performed• Two areas of interest were uncovered.
1. Other investigators1 have applied wavelet analysis with satisfactory results.
2. Other investigators 2,3,4 have documented the inconsistencies seen by the authors.
• Result:– One possibility to explain these inconsistencies may
be due saturation of the HRV. As reported in these papers, saturation of the ANS can occur during higher levers of exercise intensity or at elevated temperature.
BME 333 Biomedical Signals and Systems - J.Schesser
126
HRV Saturation1,5
• Shutdown: A decrease in both LF and HF may occur as a result of HR reduction which is usually associated with a parasympathetic withdrawal– In our case, this withdrawal may be as a result of the
exercise phase.• Turn on: A increase in both LF and HF associated
with a strong parasympathetic activation– In our case, this activation may be as a result of the
recovery phase

BME 333 Biomedical Signals and Systems - J.Schesser
127
Conclusions
• Make sure your results are consistent and can be explained
• If not develop an methodological approach to determine the root cause of any inconsistencies.
BME 333 Biomedical Signals and Systems - J.Schesser
128
Where does one go from here?
• Completely understand and characterize the HR Saturation phenomenon– Is saturation a function of the intensity of exercise?– What is the relationship of the delay to this process?
• The desire to understand the recovery process– Others has stated that good cardiovascular health may
be related to how well the heart recovers from stress.– Abnormal recovery has been defined6 as a reduction of
12 beats/min or less– Our desire is to improve this metric by characterizing
recovery using joint time-frequency analysis.

BME 333 Biomedical Signals and Systems - J.Schesser
129
Bibliography1E.Toledo, O. Gurevitz, H. Hod, M. Eldar and S. Akselrod, “Wavelet analysis of
instantaneous heart rate: a study in autonomic control during thrombolysis” in Am J Physiol Regul Intefr Comp Physiol, vol. 284; p. R1079-R1091, 2003.
2E.Toledo, O. Gurevitz, H. Hod, M. Eldar and S. Akselrod, “Thrombolysis in the Eyes of the Continous Wavelet Transform”, in Computers in Cardiology, vol.29, p. 657-660, 2002
3A. P. Pichon, C. DeBisschop, M. Roulaud, A. Denjean, and Y. Papelier, “Spectral Analysis of Heart Rate Variability during Exercise I Trained Subjects” in Medical & Science In Sports & Exercise®, p. 1702-1708, 2004
4I. K. M. Brenner, S. Thomas, and R. J. Shepard, “Autonomic Regulation of the Circulation During Exercise and Heat Exposure Inferences from Heart Rate Variability”, vol. 2, p. 85-99, Aug. 28 1998.
5E.Toledo, O. Gurevitz, H. Hod, M. Eldar and S. Akselrod, “Wavelet analysis of instantaneous heart rate: a study in autonomic control during thrombolysis” in Am J Physiol Regul Intefr Comp Physiol, vol. 284; p. R1079-R1091, 2003.
6C. Cole, E.H. Blackstone, F. J. Pashkow, C.E. Snader, and M.S. Lauer, “Heart-Rate Recovery Immediately After Exercise As A Predictor of Mortality”, New England Journal of Medicine, vol. 341; 18, p. 1351-1357. 1999.
BME 333 Biomedical Signals and Systems - J.Schesser
130
Short Term Fourier Transform
• Using the sequential sine wave signal you created in the homework, design a Matlabprogram which will perform a Short Term Fourier Transform. Divide the full time sequence into 4 equally spaced time windows and calculate and plot the time signal and spectrum for each window to show how the spectrum changes as a function of time.
BME 333 Biomedical Signals and Systems - J.Schesser
131
Spectrum of an Actual ECG
• Using the three files labeled Paced, Exercise, and Recovery, use Matlab and its “fft” function to calculate and plot the time signal and the Spectrum.

BME 333 Biomedical Signals and Systems - J.Schesser
132
Homework• Using Matlab
1. Obtain the IBI from web page and calculate time domain measures
2. Generate the IIBI (assume fs = 4s/s)3. Calculate the Fourier Transform of the IIBI4. Plot the HRV spectrum5. Divide the time domain into 6 windows
1. Calculate the Spectrum within each window2. Calculate the HF and LF averages for each window3. Plot HF and LF over the 6 windows to determine how the
autonomic nervous system is functioning