hrsd annual budget for
TRANSCRIPT


HRSD Annual Budget For Fiscal Year 2022
(July 1, 2021 – June 30, 2022)
Table of Contents
I. Introduction Page
General Manager's Introduction 1
Principal Officials 4
Key Facts 5
HRSD Service Area 6
Organization Chart 7
History of HRSD 8
Rate Schedules 9
Reader’s Guide to the Annual Budget 10
Glossary of Financial Terms 13
II. Financial Forecast 15
III. Operating Budget 17
Operating Budget Summary 18
Operating Budget Charts 20
Department Budgets
General Management 22
Communications 23
Finance 24
Information Technology 25
Talent Management 26
Operations 27
Engineering 29
Water Quality 30
General Expenses, Debt Service and Transfers 31
IV. Capital Budget 33
FY-2022 to FY-2031 Cash Flow Projections 36


General Manager’s Introduction
The voters of Virginia took the bold step in 1940 to address pollution in the Hampton Roads by approving a referendum creating the Hampton Roads Sanitation District (HRSD). That public approval capped a 15-year grassroots campaign that began when the shell-fishing beds in the Hampton Roads were closed by the Virginia Department of Health. At the time, over 30 million gallons of untreated sewage was being dumped into the waters of the Hampton Roads each day. It would take the United States Congress another 32 years to tackle the issue of water pollution on a national scale, finally passing the Clean Water Act in 1972. Over the past 81 years, HRSD has developed into one of the premier wastewater treatment organizations in the nation. With 17 treatment facilities capable of treating 249 million gallons of wastewater each day, HRSD has eliminated the discharge of untreated sewage into the waters of Hampton Roads from the homes and businesses within our region. However, there is more work to be done to further improve water quality as well as preserve our 81-year investment in wastewater infrastructure. The Governor-appointed, eight-member HRSD Commission approved this Fiscal Year 2022 budget at its regular meeting on March 25, 2021. The Commission and the HRSD staff worked diligently to balance our focus on stewardship of our ratepayers’ hard earned dollars with our mission of stewardship of the waters of the Hampton Roads. The cost of wastewater treatment continues to rise here, as it does across the nation. However, wastewater treatment is still a bargain in Hampton Roads, with the typical household paying about $1.25 per day for this essential service, protecting public health and our treasured local waterways.
Federal Mandates Drive HRSD Spending
The regional sewer system, although never designed to handle storm water, fills with rainwater runoff, ground water and tidal water during larger storms. At times, the regional system fills beyond capacity and overflows onto local streets. While these occasional overflows have minimal impact on water quality, the U.S. Environmental Protection Agency has made minimizing these types of events a national priority, and HRSD is under a Federal mandate to further reduce the number and volume of overflows from the regional sewer system. In response to this mandate, HRSD is working throughout the region, in partnership with the local governments we serve, to minimize the impact of storm events on the regional sewer system and the waterways we value so greatly. The Federally mandated requirement to reduce the amount of nutrients that HRSD’s treatment plants discharge into the Chesapeake Bay has also required a significant investment in infrastructure and process improvements. The investments by HRSD along with all of Virginia’s wastewater treatment plants in the Bay watershed have resulted in Virginia meeting the 2025 goal for nutrient reductions from wastewater treatment plants a full seven years ahead of the 2025 target date (Chesapeake Bay Foundation’s 2017 Virginia Midpoint Assessment). Unfortunately, that is not enough, and the Commonwealth has focused efforts on removing more nutrients from the HRSD wastewater facilities to meet statewide commitments required in the upper portions of the Bay, particularly in the Potomac River watershed, and to offset delays in meeting nutrient reduction goals largely in unregulated sectors such as agriculture. As a result, the General Assembly passed legislation creating the Enhanced Nutrient Removal Certainty Program during the 2021 Special Session. This legislative mandate commits HRSD to invest nearly $2 billion in nutrient removal and related treatment upgrades, with a major portion by 2025 and additional amounts by 2032. These projects, many of which HRSD planned to accomplish, are now tied to a compliance schedule, eliminating any flexibility HRSD had with implementation (e.g., the option to defer or cancel a project for various reasons), potentially increasing the overall costs to meet the compressed compliance schedule. As a result of this combination of state-controlled factors, HRSD ratepayers will be carrying a disproportionately high percentage of the cost for the entire Commonwealth to accomplish its nutrient reduction goals by the 2025 target date under US EPA oversight.
1

Pursuing Innovative Solutions to Reduce Costs and Protect Water Quality
HRSD continues to lead international research efforts to reduce the cost of removing nutrients from wastewater. HRSD’s research work is leveraged through partnerships with leading universities and other innovative wastewater utilities throughout the world. Putting the knowledge gained into practice has already yielded a significant return on our investment by reducing operational costs for nutrient removal as well as minimizing the capital investment required to construct new systems. A recent estimate of the value of this research found that implementation of these practices has kept energy and chemical costs from rising nearly $40 million over the past 10 years. Throughout HRSD’s history, changing regulations have required development and implementation of innovative solutions to meet new standards to protect and restore the quality of the waters of Hampton Roads. Treatment processes have progressed from primary, to secondary, to our current advanced nutrient removal processes. Each regulatory change has required significant investment in new treatment processes. Under current regulations, the treated water HRSD discharges to area waterways is nearly clean enough to drink and substantially cleaner than the waterways themselves. With the addition of a few more treatment processes, HRSD can produce water that exceeds drinking water standards, likely to be the ultimate regulatory mandate at some point in the future. With the various water-related challenges facing Hampton Roads and the Commonwealth, it appears there could be significant benefit from HRSD investing in additional treatment processes to treat water to meet drinking water standards as soon as possible, even before that becomes a regulatory requirement. The challenges of restoring the Chesapeake Bay, the depletion of our groundwater reserves, the impact of sea level rise and the threat of salt-water contamination of coastal groundwater may all be addressed with HRSD’s Sustainable Water Initiative for Tomorrow (SWIFT). HRSD’s SWIFT program will treat water to meet drinking water standards and use it to recharge the groundwater aquifer, providing a sustainable source of groundwater, slowing the rate of land subsidence due to over withdrawal of the groundwater, blocking salt water intrusion with a pressurized fresh water barrier and practically eliminating HRSD nutrient discharges to the York, James and Elizabeth Rivers. The benefits of SWIFT are significant and are needed immediately.
Financing a Sustainable Water Future
HRSD is pursuing SWIFT with a goal of obtaining required approvals to construct full-scale facilities beginning in 2022. The SWIFT Research Center began operations in May 2018 and has already recharged the aquifer with over 400 million gallons of SWIFT Water, wastewater treated to meet drinking water standards. HRSD is committed to full scale implementation of this initiative only if it can be accomplished within the financial framework laid out in the Financial Forecast as presented in this budget. In a rare bipartisan move, Congress passed H.R. 7279 in December 2018 and signed by the President in January 2019, amending the Federal Water Pollution Control Act “to provide for an integrated planning process, to promote green infrastructure, and for other purposes.” This new law codifies the integrated planning process HRSD has already been using to prioritize our investments in clean water mandates. Integrated planning provides the ability to defer many of the proposed capital improvements related to reducing system overflows until after SWIFT is complete. HRSD remains committed to eliminating system overflows; however, the impact of those transient events on local water quality is minimal and the benefits nearly unperceivable. In contrast, the positive impact SWIFT will have on local waterways, eastern Virginia and the entire Chesapeake Bay is significant, will be immediately evident and critical to sustaining the vitality and prosperity of Hampton Roads and all of eastern Virginia for generations to come. Reducing overflows from the regional sewer system and reducing the amount of nutrients discharged by our treatment plants are both driven by regulations with which HRSD must comply. These regulatory mandates consume over 80 percent of the $3.0 billion 10-year Capital Improvement Plan. It is within that
2

portion of our capital improvement plan that we will reprioritize mandated projects to allow construction of SWIFT, to achieve significantly more environmental benefits without influencing our Financial Forecast. HRSD finances its capital projects by issuing bonds and using cash on hand. Over the past 10 years, the annual investment in capital projects (debt payments and cash funded) has grown from less than 38 percent of HRSD’s total revenue to more than 50 percent with the Fiscal Year 2022 budget. HRSD is investing in the regional wastewater infrastructure to ensure we leave a fully functional system to the next generation. While HRSD continues to focus on making the right investments in Hampton Roads, across the nation the need for investment in all infrastructure continues to grow. The American Society of Civil Engineers’ 2021 Infrastructure Report Card graded the current state of wastewater infrastructure at a D+. The US Water Alliance’s Report, The Economic Benefits of Investing in Water Infrastructure, estimates the unmet water investment at over $81 billion per year. The report highlights the lack of adequate federal investment in wastewater infrastructure, showing the drop in federal investment from 63 percent in 1977 to less than 4 percent in 2017. State, regional and local governments have had to fill tht funding gap, passing on significant rate increases as utilities must price service to recover full costs.
The Community’s Role
Our ratepayers can help control their costs by helping us control ours. Ensuring storm water runoff from downspouts, area drains and sump pumps is not directed to the sanitary sewer system, and ensuring privately owned service piping is well maintained and leak free will reduce the amount of water in the sewer system. This ultimately lowers our costs to pump and treat the region’s wastewater. Collecting fats, oils and grease in a container for disposal in the trash, as opposed to pouring them down the drain, reduces wastewater system maintenance and operating costs. Proper disposal of unused medications (and other substances) prevents them from reaching our treatment plants, which are not designed for removal of such substances. Our ratepayers can make a difference by not flushing unused medications down the sink or the toilet. Every flush counts. As we reflect on 81 years of protecting public health and the waters of Hampton Roads, we remember the mandate so boldly declared by those environmentally concerned Virginians in 1940. It was their foresight that allows us to enjoy the waters of Hampton Roads today. It will take our continued innovation, investment and foresight to ensure future generations will inherit clean waterways and be able to keep them clean. Sincerely,
Ted Henifin, P.E. General Manager
3

Principal Officials
May 25, 2021
COMMISSIONERS
Frederick N. Elofson, CPA, Chair
Maurice P. Lynch, PhD, Vice-Chair
Michael E. Glenn Vishnu K. Lakdawala, PhD Willie Levenston, Jr.
Stephen C. Rodriguez Elizabeth A. Taraski, PhD Molly J. Ward
COMMISSION SECRETARY
Jennifer L. Cascio
SENIOR STAFF
Edward G. Henifin, PE General Manager
Jay A. Bernas, PE Director of Finance
and Treasurer
Charles B. Bott, PhD, PE Director of Water Technology
And Research
Donald C. Corrado Director of Information
Technology
Steven G. de Mik, CPA Director of Operations
Paula A. Hogg Director of Talent Management
Bruce W. Husselbee, PE Director of Engineering
James J. Pletl, PhD
Director of Water Quality Leila Rice, APR
Director of Communications
COUNSEL
Sands Anderson, PC General Counsel
AquaLaw, PLC Special Counsel
Norton Rose Fulbright US, LLP Bond Counsel
4

Key Facts
Service Area and Operations
Date Established November 5, 1940
Communities Served 20 communities encompassing 4,998 square miles
HRSD is a political subdivision of the Commonwealth of Virginia, created for the specific purpose of water pollution abatement in Hampton Roads by providing a system of interceptor mains and wastewater treatment plants.
Population Served About 1.7 million, nearly one-fifth of Virginia’s population, reside in HRSD’s service area.
Operation and Facilities
No. of Positions (FY-2022) 872
Miles of Interceptor Systems 541 Miles
Wastewater Treated 141 million gallons per day average
Wastewater Capacity 249 million gallons per day average
Financial Information
Bond Ratings
Ratings Agency
Senior Debt Subordinate Long-term
Subordinate Short-term
Standard & Poor’s AA+ AA+ A-1+ Fitch Ratings AA+ AA F1+
Moody’s Investors Service Aa1 Aa1 n/a Operating Budget (FY-2022) $357,495,000
5

HRSD Service Area
10/2020
6

Commission
General Manager
Director of Communications
Community Education and
Outreach Specialist
Public Information Specialist
Director of Engineering
Asset Management
Design and Construction-NS
Design and Construction-SS
Design and Construction-
SWIFT
Planning and Analysis
Director of Finance
Accounting
BusinessIntelligence
Complianceand Risk
Customer CareCenter
Procurement
Director of Information Technology
Cybersecurity
Enterprise Data Services
InformationTechnology
Operations and Support
Director of Operations
Energy Management
Electrical and Instrumentation
Interceptor Operations-NS and Small Communities-
Middle Peninsula and Surry
Interceptor Operations-SS
Support Systems
Treatment PlantsAB-CE-VIP and
Small Communities-Eastern Shore
Treatment Plants AT-BH-NTP
Treatment PlantsJR-WB-YR
Director of Water Technology and
Research
Process Engineering and Research
WaterTechnology &
Research
Director of Talent
Management
HumanResources
Organizational Development and
Training
Safety
Director of Water Quality
Central Environmental
Laboratory
Pretreatment and Pollution Prevention
TechnicalServices
CommissionSecretary
HRSD Organization ChartJuly 1, 2021
7

History of HRSD HRSD can trace its beginnings to 1925 when the Virginia Department of Health condemned a large oyster producing area in Hampton Roads. The closure resulted in the Virginia General Assembly creating in 1927 a "Commission to Investigate and Survey the Seafood Industry of Virginia." Other studies recommended a public body to construct and operate a sewage system in the area. HRSD was named after Hampton Roads, a ship anchorage used for five centuries located near the convergence of the James, Elizabeth and Nansemond Rivers, before they flow into the Chesapeake Bay in southeastern Virginia. In 1934, the Virginia General Assembly created the Hampton Roads Sanitation Disposal Commission with instructions to plan the elimination of pollution in Hampton Roads. Recommendations were made to the General Assembly, which resulted in the Sanitary Districts Law of 1938, along with "an Act to provide for and create the Hampton Roads Sanitation District." This Act required the qualified voters within HRSD to decide in a general election on November 8, 1938, if they favored creation of such a District. This referendum failed to gain a majority by about 500 votes out of nearly 20,000 votes cast. This led to a revision of the Act and another referendum was held on November 5, 1940, which resulted in a majority vote for the creation of the Hampton Roads Sanitation District. The Enabling Act provides for HRSD to operate as a political subdivision of the Commonwealth of Virginia for the specific purpose of water pollution abatement in Hampton Roads by providing a system of interceptor mains and wastewater treatment plants. Its affairs are controlled by a Commission of eight members appointed by the Governor for four-year terms. Administration is under the direction of a General Manager, supported by department directors and their staffs. HRSD began operations on July 1, 1946, using facilities acquired from the United States Government. The Warwick County Trunk Sewer, HRSD's first construction project, began on June 26, 1946, and was funded by HRSD's $6.5 million Primary Pledge Sewer Revenue Bonds, dated March 1, 1946. The first treatment plant, the Army Base Plant, began operation on October 14, 1947. Since that time, the facilities of HRSD have grown to provide sanitary sewer service to all major population centers in southeastern Virginia. The population served has increased from nearly 288,000 in 1940 to about 1.7 million in 2020. Throughout its rich history HRSD has earned many of its industry’s most prestigious awards. This tradition continued as the National Association of Clean Water Agencies (NACWA) presented Peak Performance Awards for outstanding compliance with National Pollutant Discharge Elimination System (NPDES) permits to the following HRSD treatment plants during the year ended June 30, 2020: Atlantic— Platinum Award (5 consecutive years of compliance), Boat Harbor—Platinum (18 consecutive years), James River—Platinum (6 consecutive years), Nansemond—Platinum (18 consecutive years), Virginia Initiative Plant—Platinum (24 consecutive years), Williamsburg—Platinum (25 consecutive years) and York River— Platinum (12 consecutive years). Additional awards and honors received during the year ended June 30, 2020 include NACWA National Environmental Achievement Awards in the categories of Public Information and Education, and Workforce Development. HRSD also received the 2019 Oracle Construction and Engineering Excellence Award for Systems Integration in Public Infrastructure. The Virginia Initiative Plant was awarded the Virginia 2020 Pinnacle Award from the American Council of Engineering Companies for the plant’s Nutrient Reduction Improvements Project. HRSD was also awarded a Design-Build Institute of America National Award in the “Water/Wastewater” Category and an Honeorable Mention in the “Best in Process” Category for the SWIFT Research Center. The SWIFT Program and SWIFT Research Center also earned the 2019 Engineering Achievement Award from the Engineers Club of Hampton Roads.
8

ServiceFlow (monthly basis)
Per CCF * $ 6.39 $ 5.86 Minimum charge (per day) 0.30 0.30
Surcharge, per milligrams/liter per CCFIn Excess of In Excess of
Biochemical Oxygen Demand (BOD) 297 mg/L $ 0.000176 282 mg/L $ 0.000129 Total Suspended Solids (TSS) 282 mg/L 0.000584 261 mg/L 0.000630 Total Phosphorus (TP) 7 mg/L 0.010050 6 mg/L 0.009871 Total Kjeldahl Nitrogen (TKN) 57 mg/L 0.002660 47 mg/L 0.003378
Surcharge, per 100 pounds BOD 297 mg/L $ 2.83 282 mg/L $ 2.07 TSS 282 mg/L 9.34 261 mg/L 10.08 TP 7 mg/L 160.99 6 mg/L 158.12 TKN 57 mg/L 42.61 47 mg/L 54.11
Septic, per gallon $ 0.1717 $ 0.1717 Fats, Oils, and Grease (FOG), per gallon $ 0.2737 $ n/a Town Wholesale Treatment, per 1000 gallons $ 3.55 $ n/a Residential flat rate (per day) $ 1.74 $ 1.62
Meter Size FY-2022 FY-2021 5/8 Inch $ 2,055 $ 1,905 3/4 Inch 4,210 4,210
1 Inch 7,410 7,410 1 ½ Inch 16,645 16,645
2 Inch 31,465 30,505 3 Inch 80,405 73,810 4 Inch 156,530 138,445 6 Inch 400,625 336,960 8 Inch 780,840 634,710
10 Inch 1,310,665 1,038,525 12 Inch 2,001,460 1,554,120 14 Inch 2,863,155 2,186,505 16 Inch 3,904,635 2,940,135
Flow (monthly basis) per 1,000 gallons FY-2022 FY-2021 Accomack $ 14.28 $ n/a King William 14.54 13.82 Mathews 14.28 13.43 Middlesex/Urbanna 14.28 13.43 Surry 14.28 13.43 West Point 14.28 13.62
Residential flat rate (per day) Accomack $ 1.90 $ n/a King William 1.94 1.84 Mathews 1.90 1.79 Middlesex/Urbanna 1.90 1.79 Surry 1.90 1.79 West Point 1.90 1.82
Minimum charge - metered accounts (per day) $ 0.30 $ 0.30
FY-2022 FY-2021Damaged meter/antenna (plus cost of meter/antenna) $ 250 $ n/a Damaged lock 100 100 Service restoration 100 100 Meter reading (customer-owned meter) 75 75 Inaccessible meter 50 50 Access card replacement 25 25 Returned payments 25 25 Delinquency service trip 15 15 Account documentation 10 10 Deduction meter 2 2
SMALL COMMUNITIES RATE SCHEDULE
FEES
VOLUME BASED FACILITY RATE SCHEDULE
Rate Schedules WASTEWATER TREATMENT RATE SCHEDULE
* CCF = 100 Cubic Feet (approximately 748 gallons)
FY-2022 FY-2021
9

Reader’s Guide to the Annual Budget
PURPOSE The Annual Budget is an instrument that sets HRSD’s budgetary policy and authorization to raise revenues and spend funds each fiscal year. The development of the Annual Budget is guided by HRSD’s mission and vision statements:
• HRSD’s mission is to protect public health and the waters of Hampton Roads by treating wastewater effectively.
• HRSD’s vision is future generations will inherit clean waterways and be able to keep them clean.
ANNUAL BUDGET OVERVIEW HRSD’s Annual Budget contains the following sections:
Financial Forecast This section provides a high level, 20-year forecast of projected wastewater treatment rate increases, operating revenues and expenses, capital improvements and related funding sources, amounts contributed to and fiscal year-end balances of cash and investment reserves, and selected financial ratios that help to measure the financial health of HRSD. The forecast is an inflationary based model where trends from past fiscal years and proposed operating budgets are used to forecast future operating needs. Transfers to reserves and to the Capital budget are forecast to be in amounts that are not less than parameters established within HRSD’s Financial Policy. Debt service is based on different sources of future funding: Virginia Clean Water Revolving Fund, Water Infrustructure Finance and Innovation Act (WIFIA), interim financing and revenue bonds. Interest rates are based on known rates or historical averages. Operating Budget The Operating Budget represents the authorization by the HRSD Commission to spend funds directly related to operating and maintaining HRSD’s programs and assets during the fiscal year. This section includes each department’s annual operating budgets. Those expenses that are not attributable to a specific department are assigned to “General Expenses.” Transfers represent authorization to transfer revenues raised from operations to either the Capital Budget or to various reserves established in HRSD’s Financial Policy. The Operating Budget Summary provides the budget by department and major object code classification. Department Budgets and General Expenses, Debt Service and Transfers detail budget expenditures by major object code classification. The number of full-time positions authorized for the fiscal year is provided by department.
10

Capital Budget The Capital Budget represents a plan of specific, major capital improvements over a period of ten fiscal years. The Capital Budget is not an approval or appropriation of funds for individual projects. There is no authorization or funding for individual projects until the Commission acts on the specific project. The Commission formally authorizes spending for individual projects throughout a fiscal year and generally upon project initiation. The Summary Schedule details the funding sources for capital improvements as well as planned expenditures. A formal, detailed, Capital Improvement Program with more specific project information is available at https://www.hrsd.com/cip
HRSD’s budget authorizations, capital improvement plans, user rate setting practices and other significant financial practices are guided by HRSD’s Financial Policy and Revenue Policy. The Financial Policy and Revenue Policy are available at http://www.hrsd.com/finance HRSD’s Rate Schedule is available at http://www.hrsd.com/finance BUDGETARY PROCESS HRSD prepares its Annual Budget under the provisions of its enabling legislation and its Trust Agreement, dated March 1, 2008. In accordance with those provisions, the following process is used to adopt the Annual Budget:
The process begins in late December with the issuance of the Annual Budget Instructions by the General Manager. Each department completes its Operating Budget by March 1 for the General Manager’s review. The HRSD Commission appoints a Finance Committee which typically consists of two Commissioners. The committee meets in early April to review the budgets. The Commission reviews these budgets during its April meeting. The final Annual Budget, which incorporates the Operating and Capital Budgets, is presented at the May Commission meeting for adoption. The Commission simultaneously adopts the budget and any resulting wastewater rate schedule changes. All rate adjustments must be publically advertised four consecutive weeks before they can take effect. The HRSD Commission approves any budget amendments during the fiscal year.
BUDGETARY ACCOUNTING AND CONTROL HRSD operates in accordance with annual operating and capital budgets prepared on a basis of accounting that is different from generally accepted accounting principles.
11

The Operating Budget is adopted by department, with budgetary controls exercised
administratively by management at the department level. The General Manager is authorized to transfer funds among departments without further approval by the Commission. Appropriations lapse at the end of the fiscal year. Valid, outstanding encumbrances (those for which performance under a contract is expected in the next year) are re-appropriated without further approval by the Commission and become part of the subsequent year’s budget.
The Capital Budget represents a ten-year plan. Funds for the Capital Budget are adopted throughout a fiscal year on a project basis. Transfers among projects require approval by the Commission. Appropriations for these budgets continue until the purpose of the appropriation has been fulfilled.
12

Glossary of Financial Terms
Adjusted Days Cash on Hand: Days Cash on Hand that excludes accrued debt service, the Risk Reserve, the Renewal and Replacement Reserve, and cash budgeted for the CIP in the next fiscal year. Appropriation: An authorization granted by the Commission to incur obligations for specific purposes. Appropriations are usually limited to amount, purpose and time. Basis of Accounting: HRSD’s financial statements report the financial position and results of operations of HRSD in accordance with generally accepted accounting principles in the United States of America (GAAP). Bond Ratings: A grade given to bonds that represents a measure of their credit quality. Private independent rating services such as Standard & Poor's, Moody's and Fitch provide these evaluations of a bond issuer's financial strength, or its the ability to pay a bond's principal and interest in a timely fashion. Capital Improvement Program (CIP): Ten-year plan for major non-recurring facility, infrastructure, or acquisition expenditures that expand or improve HRSD and/or locality assets. Projects included in the CIP include physical descriptions, implementation schedules, year of expenditure cost and funding source estimates, and an indication of HRSD Commission priorities and community benefits Centum Cubic Feet (CCF): Typical unit in which industrial-consumption of natural gas or water is measured; each CCF being 100 cubic-feet. CIP Percent Cash Funded: Percent of each year’s capital improvement plan funded with cash through transfers from operations. HRSD’s Financial Policy requires that at least 15 percent of each year’s planned capital improvements be funded with cash. This ratio indicates the amount of capital improvements that are not leveraged. Days Cash on Hand: Measured by current and non-current unrestricted cash and investments, plus any restricted cash and investments, if available for general system purposes, divided by Operating Expenses, divided by 365. Debt Service: Amount of money necessary to pay principal and interest on bonds outstanding. Debt Service as a Percent of Revenues: Total revenues divided by total debt service. This ratio measures the debt service burden compared to total revenues. Risk Management Reserve: HRSD maintains a self-insurance program for some of its risk exposures. HRSD’S Financial Policy requires HRSD to maintain a Risk Management Reserve as of the end of the fiscal year of not less than 25 percent of projected annual self-insured claims costs for known, retained risks. Senior Debt Service Coverage: Current-year revenues available for debt service divided by current-year senior lien debt service. This ratio indicates the financial margin to meet current
13

senior lien debt service with current revenues available. HRSD’s Financial Policy requires that Senior Debt Service Coverage will not be less than 1.5 times senior lien debt service. When calculating compliance with this coverage requirement, HRSD may make reasonable adjustments to the net revenues as presented on a basis consistent with generally accepted accounting principles. HRSD’s Senior Trust Agreement requires Senior Debt Service Coverage, which is determined by dividing the Income Available for Debt Service by the Maximum Annual Debt Service, will not be less than 1.2 times. Total Debt Service (Adjusted): Calculated in accordance with HRSD’s Subordinate Trust Agreement, the ratio determined by dividing the Net Revenues by annual debt service. In such calculation, funds spent on Locality Assets may be excluded from the calculation of Net Revenues under the circumstances described within the definitions of Net Revenues and Operating Expenses. Annual debt service will be based on actual principal and interest payments during the year (i.e., not accrual based). Total Debt Service Coverage Ratio (GAAP): Calculated in accordance with HRSD’s Senior Trust Agreement, the ratio determined by dividing the Net Revenues by annual debt service. In such calculation, funds spent on Locality Assets are considered an expense. Annual debt service will be based on actual principal and interest payments during the year (i.e., not accrual based). Trust Agreement: The formal agreement between bond holders, acting through a trustee, and HRSD. Unrestricted Cash: Unrestricted cash and investments at fiscal year-end that are not earmarked for another purpose.
14


Financial Forecast (in thousands) 2022 2023 2024 2025 2026 2027 2028 2029 2030 2031 2032 2033 2034 2035 2036 2037 2038 2039 2040 2041Operating Budget Forecast
Projected Annual Water Consumption Decline -1.0% -1.0% -1.0% -1.0% -1.0% -1.0% -1.0% -1.0% -1.0% -1.0% -1.0% -1.0% -1.0% -1.0% -1.0% -1.0% -1.0% -1.0% 0.0%Projected Wastewater Rate Increase 9.0% 9.0% 9.0% 7.0% 7.0% 7.0% 4.5% 4.5% 4.5% 4.5% 4.5% 4.5% 4.5% 4.5% 4.5% 4.5% 4.5% 4.5% 4.5% 4.5%
Projected Wastewater Rate , $/ccf $6.39 $6.97 $7.60 $8.13 $8.70 $9.31 $9.73 $10.17 $10.63 $11.11 $11.61 $12.13 $12.68 $13.25 $13.85 $14.47 $15.12 $15.80 $16.51 $17.257.6% 7.6% 5.7% 5.7% 5.7% 3.4% 3.4% 3.4% 3.4% 3.4% 3.3% 3.4% 3.4% 3.4% 3.3% 3.4% 3.4% 3.4% 4.4%Revenues
Operating Revenues 345,560$ 371,917$ 400,246$ 422,964$ 447,173$ 472,821$ 488,681$ 505,139$ 522,175$ 539,765$ 557,886$ 576,518$ 596,096$ 616,133$ 637,057$ 658,391$ 680,555$ 703,518$ 727,248$ 759,145$ Non-operating Revenues 11,935 13,596 14,614 15,727 17,298 17,427 19,417 19,750 21,046 22,559 22,942 23,336 23,740 24,156 25,138 25,986 26,527 26,981 27,500 28,175
Total Revenues 357,495 385,513 414,860 438,691 464,471 490,249 508,097 524,889 543,221 562,324 580,828 599,854 619,836 640,288 662,195 684,377 707,082 730,499 754,748 787,320 YOY Op Rev 7.6% 7.6% 5.7% 5.7% 5.7% 3.4% 3.4% 3.4% 3.4% 3.4% 3.3% 3.4% 3.4% 3.4% 3.3% 3.4% 3.4% 3.4% 4.4%
Operating ExpensesPersonal Services 62,776 64,910 67,117 69,399 71,759 74,199 76,722 79,330 82,027 84,816 87,361 89,982 92,681 95,461 98,325 101,275 104,313 107,443 110,666 113,986 Fringe Benefits 25,157 25,547 26,639 27,779 28,971 30,216 31,516 32,876 34,296 35,781 37,289 38,864 40,510 42,231 44,029 45,908 47,873 49,928 52,076 54,322 Materials And Supplies 20,106 20,858 21,638 22,448 23,287 24,158 25,062 25,999 26,971 27,980 28,819 29,684 30,574 31,492 32,436 33,410 34,412 35,444 36,508 37,603 Transportation 863 878 893 908 923 939 955 971 988 1,004 1,034 1,065 1,097 1,130 1,164 1,199 1,235 1,272 1,310 1,350 Transportation Fuels 636 647 658 669 680 692 704 716 728 740 762 785 809 833 858 884 910 937 966 995 Utilities 12,289 12,655 13,033 13,421 13,821 14,233 14,657 15,094 15,544 16,007 16,487 16,982 17,491 18,016 18,556 19,113 19,686 20,277 20,885 21,512 Chemical Purchases 8,652 8,911 9,177 9,451 9,734 10,025 10,325 10,634 10,952 11,279 11,617 11,966 12,325 12,695 13,075 13,468 13,872 14,288 14,716 15,158 Contractual Services 38,055 39,958 41,956 44,054 46,257 48,569 50,998 53,548 56,225 59,036 60,807 62,632 64,511 66,446 68,439 70,493 72,607 74,786 77,029 79,340 Consulting Services 2,243 2,355 2,472 2,596 2,726 2,862 3,005 3,156 3,313 3,479 3,583 3,691 3,802 3,916 4,033 4,154 4,279 4,407 4,539 4,675 Miscellaneous Expenses 6,716 6,905 7,100 7,301 7,508 7,720 7,939 8,165 8,397 8,636 8,895 9,162 9,437 9,720 10,011 10,312 10,621 10,940 11,268 11,606 Bond Issuance Cost 500 - 1,685 - - - - - - - - - - - - - 1,355 - - 1,556 Capital Assets 470 484 499 514 529 545 561 578 595 613 632 651 670 690 711 732 754 777 800 824 Other Costs (SWIFT O&M, Plant Consolidation) - - - - 11,679 8,146 8,632 9,138 35,063 66,495 69,315 72,247 75,297 78,469 96,576 110,915 115,512 120,292 125,264 130,435 Total Operating Appropriations from Budget 178,463 184,108 192,866 198,540 217,874 222,305 231,076 240,202 275,099 315,867 326,602 337,710 349,204 361,098 388,215 411,862 427,430 440,791 456,027 473,361
YOY Op Exp 3.2% 4.8% 2.9% 9.7% 2.0% 3.9% 3.9% 14.5% 14.8% 3.4% 3.4% 3.4% 3.4% 7.5% 6.1% 3.8% 3.1% 3.5% 3.8%
Existing Debt Service 61,690 66,099 70,080 70,892 70,746 70,654 67,109 67,069 66,781 67,196 62,216 60,251 58,130 57,587 78,301 78,302 78,281 84,080 83,491 74,562 Projected Debt Service (Clean Water, WIFIA, LOC) 2,618 11,018 34,895 37,846 38,377 38,689 37,855 37,849 37,859 37,858 37,846 39,629 41,008 41,161 38,760 39,785 58,405 52,762 56,523 77,659 Total Debt Service 64,308 77,117 104,975 108,738 109,123 109,342 104,964 104,918 104,640 105,054 100,062 99,880 99,138 98,748 117,061 118,087 136,686 136,842 140,014 152,221
Transfer to Risk Management Reserve 260 131 135 139 143 147 152 156 161 166 171 176 181 187 192 198 204 210 216 223 Transfer to General Reserve (Unrestricted Cash) - - 2,671 5,674 19,334 4,431 8,771 9,126 34,896 40,768 10,735 11,108 11,494 11,894 27,117 23,647 15,568 13,361 15,237 17,334 Transfer to Capital Improvement Plan (PAYGO) 114,464 124,157 114,213 125,600 117,997 154,024 163,135 170,486 128,425 100,469 143,259 150,981 159,819 168,362 129,609 130,583 127,195 139,296 143,253 144,181 Total Approriations for Debt Service and Transfers 179,032 201,405 221,994 240,150 246,597 267,944 277,022 284,687 268,123 246,457 254,226 262,144 270,632 279,190 273,980 272,515 279,652 289,708 298,721 313,959
Total Appropriations 357,495$ 385,513$ 414,860$ 438,691$ 464,471$ 490,249$ 508,097$ 524,889$ 543,221$ 562,324$ 580,828$ 599,854$ 619,836$ 640,288$ 662,195$ 684,377$ 707,082$ 730,499$ 754,748$ 787,320$
Capital Improvement Budget ForecastBeginning Capital Reserves 7,530$ -$ -$ -$ -$ -$ 2,856$ 38,240$ 92,962$ 78,183$ 2,933$ -$ -$ -$ -$ -$ -$ -$ -$ -$ Sources of Funds Debt funded (Revenue Bonds and Interim Financing) - - 285,791 - - - - - - - - - - - - - 229,204 - - 263,270 Va Clean Water Revolving Loan Fund 100,000 100,000 100,000 100,000 - - - - - - - - - - - - - - - -
WIFIA 40,659 86,314 169,495 149,751 75,575 75,135 99,706 82,092 49,953 21,781 10,891 15,664 36,349 89,766 45,386 - - - - - Water Quality Improvement Fund (WQIF) Grants - 2,500 15,000 17,500 27,500 25,000 25,000 7,500 5,000 2,500 - - - - - - - - - -
HRSD - Cash 114,464 124,157 114,213 125,600 117,997 154,024 163,135 170,486 128,425 100,469 143,259 150,981 159,819 168,362 129,609 130,583 127,195 139,296 143,253 144,181 Reimbursements - 2,055 7,818 9,278 7,409 8,087 7,543 4,644 1,843 - - - - - - - - - - -
Line of Credit (Negative = Paid Off) 27,347 94,974 (157,317) 17,872 6,518 (24,390) - - - - 42,917 33,356 3,832 (58,128) 25,005 89,417 (136,399) 90,704 96,747 (187,451) Total Capital Resources 290,000 410,000 535,000 420,000 235,000 237,856 298,240 302,962 278,183 202,933 200,000 200,000 200,000 200,000 200,000 220,000 220,000 230,000 240,000 220,000 Uses of Funds - Capital Expenditures 290,000 410,000 535,000 420,000 235,000 235,000 260,000 210,000 200,000 200,000 200,000 200,000 200,000 200,000 200,000 220,000 220,000 230,000 240,000 220,000 Ending Capital Resources -$ -$ -$ -$ -$ 2,856$ 38,240$ 92,962$ 78,183$ 2,933$ -$ -$ -$ -$ -$ -$ -$ -$ -$ -$
Reserves Balance ForecastTotal Unrestricted Cash 316,554$ 318,848$ 311,710$ 328,909$ 340,784$ 381,388$ 402,278$ 454,297$ 502,015$ 500,214$ 478,660$ 494,732$ 515,246$ 535,870$ 524,427$ 549,245$ 561,629$ 587,301$ 606,711$ 625,196$ PAYGO (includes beginning balance, if available) 121,994 124,157 114,213 125,600 117,997 154,024 165,991 208,726 200,000 178,652 146,192 150,981 159,819 168,362 129,609 130,583 127,195 139,296 143,253 144,181 Risk Reserve 4,365 4,496 4,631 4,770 4,913 5,060 5,212 5,368 5,529 5,695 5,866 6,042 6,223 6,410 6,602 6,800 7,004 7,214 7,431 7,654 Adjusted Unrestricted Cash 190,196$ 190,196$ 192,866$ 198,540$ 217,874$ 222,305$ 231,076$ 240,202$ 296,486$ 315,867$ 326,602$ 337,710$ 349,204$ 361,098$ 388,215$ 411,862$ 427,430$ 440,791$ 456,027$ 473,361$ Daily Cost to Operate 489$ 504$ 528$ 544$ 597$ 609$ 633$ 658$ 754$ 865$ 895$ 925$ 957$ 989$ 1,064$ 1,128$ 1,171$ 1,208$ 1,249$ 1,297$ Adjusted Days Cash on Hand (excludes PAYGO and Risk) 389 days 377 days 365 days 365 days 365 days 365 days 365 days 365 days 393 days 365 days 365 days 365 days 365 days 365 days 365 days 365 days 365 days 365 days 365 days 365 days
Financial Ratios ForecastTotal Debt Service Coverage (GAAP) 2.23 2.28 1.83 1.80 1.90 2.08 2.36 2.56 2.47 2.29 2.37 2.55 2.61 2.66 2.14 2.11 1.88 1.90 1.90 2.02Total Debt Service Coverage (Adjusted) 2.33 2.44 1.96 1.87 2.02 2.14 2.56 2.67 2.50 2.29 2.48 2.56 2.67 2.77 2.29 2.26 2.00 2.07 2.09 2.02
CIP % Cash Funded (current year contributions) 42% 30% 21% 30% 50% 66% 64% 99% 100% 89% 73% 75% 80% 84% 65% 59% 58% 61% 60% 66%Debt Service as a % of Total Revenues 18% 20% 25% 25% 23% 22% 21% 20% 19% 19% 17% 17% 16% 15% 18% 17% 19% 19% 19% 19%
Fitch 2020 Medians, HRSD = 10-yr forecast average
2.23
2.28
1.83
1.80
1.90
2.08
2.36
2.56
2.47
2.29
2.37
2.55
2.61
2.66
2.14
2.11
1.88
1.90
1.90
2.02
2.33
2.44
1.96
1.87
2.02
2.14
2.56
2.67
2.50
2.29
2.48
2.56
2.67
2.77
2.29
2.26
2.00
2.07
2.09
2.02
0.00
0.50
1.00
1.50
2.00
2.50
3.00
2022 2023 2024 2025 2026 2027 2028 2029 2030 2031 2032 2033 2034 2035 2036 2037 2038 2039 2040 2041
Tota
l Deb
t Ser
vice
Cov
erag
e Ra
tio
Total Debt Service Coverage Ratio (GAAP)
Total Debt Service Coverage (GAAP) Total Debt Service Coverage (Adjusted)Target Financial Policy
3.1 2.6 2.2 2.2 -
0.5
1.0
1.5
2.0
2.5
3.0
3.5
AAA AA Large HRSD
Total Debt Service Coverage
14% 18% 24% 21%0%
5%
10%
15%
20%
25%
30%
AAA AA Large HRSD
Total Debt Service as % of Gross Revenues
20% 38% 46% 41%0%5%
10%15%20%25%30%35%40%45%50%
AAA AA Large HRSD
CIP Debt Financed
617 555 408 3710
100
200
300
400
500
600
700
AAA AA Large HRSD
Days Cash on Hand
15

This page was intentionally left blank
16


Adopted Increase/ PercentFY-2022 FY-2021 (Decrease) Change
Operating RevenuesWastewater Treatment Charges 344,370,000$ 320,035,000$ 24,335,000$ 8%Miscellaneous 1,190,000 1,140,000 50,000 4%
Total Operating Revenue 345,560,000 321,175,000 24,385,000 8%
Non-Operating RevenuesWastewater Facility Charges 7,320,000 6,160,000 1,160,000 19%Investment Earnings 1,210,000 1,510,000 (300,000) (20%)Build America Bond Subsidy 2,095,000 2,292,000 (197,000) (9%)Other 1,310,000 1,260,000 50,000 4%
Total Non-Operating Revenues 11,935,000 11,222,000 713,000 6%
Total Revenues 357,495,000$ 332,397,000$ 25,098,000$ 8%
Operating AppropriationsGeneral Management 465,516$ 466,020$ (504)$ (0%)Communications 456,003 472,519 (16,516) (3%)Finance 15,303,085 15,061,142 241,943 2%Information Technology 16,711,258 16,719,711 (8,453) (0%)Talent Management 2,532,647 2,574,769 (42,122) (2%)Operations 111,349,610 110,546,153 803,457 1%Engineering 7,108,883 6,521,954 586,929 9%Water Quality 15,896,141 15,676,912 219,229 1%General Expenses 8,639,727 7,736,886 902,841 12%
Total Operating Appropriations 178,462,870 175,776,066 2,686,804 2%
Appropriations for Debt Service and TransfersDebt Service 64,308,209 61,407,822 2,900,387 5%Transfer to Capital Improvement Program (CIP) 114,463,921 94,953,112 19,510,809 21%Transfer to Risk Management Reserve 260,000 260,000 - 0%
Total Appropriations for Debt Service and Transfers 179,032,130 156,620,934 22,411,196 14%
Total Appropriations 357,495,000$ 332,397,000$ 25,098,000$ 8%
Operating Budget
17

General Information Talent Water General Management Communications Finance Technology Management Operations Engineering Quality Expenses
Personal Services 342,585$ 295,334$ 6,290,168$ 5,054,686$ 1,620,907$ 35,998,001$ 4,439,309$ 8,459,559$ 275,506$ Fringe Benefits 83,431 94,169$ 2,526,643 1,652,512 606,870 15,394,579 1,576,016 3,424,426 (201,900) Materials & Supplies 10,000 45,000$ 104,205 1,099,750 56,500 5,752,726 38,547 1,623,700 26,000 Transportation 7,000 8,500$ 8,100 12,700 27,600 1,385,430 23,270 26,206 - Utilities - -$ 323,000 1,176,000 - 10,347,561 - 2,700 440,000 Chemical Purchases - -$ - - - 8,651,935 - - - Contractual Services 9,000 -$ 5,778,819 6,292,500 22,000 22,260,313 912,241 1,700,500 7,500,221 Major Repairs - -$ - 1,125,000 - 10,148,820 - 76,000 - Capital Assets - -$ - - - 470,000 - - - Miscellaneous Expense 13,500 13,000$ 272,150 298,110 198,770 940,245 119,500 583,050 599,900
Operating Approporiations 465,516$ 456,003$ 15,303,085$ 16,711,258$ 2,532,647$ 111,349,610$ 7,108,883$ 15,896,141$ 8,639,727$
Full-time Positions:
Current 2 3 102 49 17 534 45 118
Changes - - - 2 - (1) - 1
Budgeted 2 3 102 51 17 533 45 119
Operating Budget Summary
18

Percent FY-2021 Increase/ PercentFY-2022 of Budget Budget Decrease Inc/(Dec)
Personal Services 62,776,055$ 17.6% 60,952,503$ 1,823,552$ 3%Fringe Benefits 25,156,746 7.0% 24,930,765 225,981 1%Materials & Supplies 8,756,428 2.4% 9,067,856 (311,428) (3%)Transportation 1,498,806 0.4% 1,578,011 (79,205) (5%)Utilities 12,289,261 3.4% 12,954,307 (665,046) (5%)Chemical Purchases 8,651,935 2.4% 10,288,858 (1,636,923) (16%)Contractual Services 44,475,594 12.4% 41,786,166 2,689,428 6%Major Repairs 11,349,820 3.2% 10,075,960 1,273,860 13%Capital Assets 470,000 0.1% 600,000 (130,000) (22%)Miscellaneous Expense 3,038,225 0.8% 3,541,640 (503,415) (14%)
Operating Approporiations 178,462,870$ 49.9% 175,776,066$ 2,686,804$ 2%
Debt Service Costs 64,308,209$ 18.0% 61,407,822$ 2,900,387$ 5%Transfer to Capital Improvement Program (CIP) 114,463,921 32.0% 94,953,112 19,510,809 21%Transfer to Risk Management 260,000 0.1% 260,000 -$ 0%
Appropriations for Debt Service and Transfers 179,032,130$ 50.1% 156,620,934$ 22,411,196$ 14%
357,495,000$ 100.0% 332,397,000$ 25,098,000$ 8%
Full-time Positions:
Current 870
Changes 2
Budgeted 872
Operating Budget Summary
19

Operating Budget Charts
Wastewater Treatment Charges$344,370,000
Miscellaneous$1,190,000
Wastewater Facility Charges
$7,320,000
Investment Earnings$1,210,000
Build America Bond Subsidy$2,095,000
Other$1,310,000
Revenues and Transfers In$357,495,000
20

Operating Budget Charts
General Management$465,516
Communications$456,003
Talent Management$2,532,647
Finance$15,303,085
Information Services$16,711,258
Operations$111,349,610
Engineering$7,108,883 Water Quality
$15,896,141 General Expenses
$8,639,727
Debt Service, $64,308,209
Transfer to CIP$114,463,921
Transfer to Risk Reserve$260,000
Expenses and Transfers Out$357,495,000
21

FY-2022 FY-2021 Increase/ Percentage Budget Budget (Decrease) Change
Personal Services 342,585$ 335,927$ 6,658$ 2%Fringe Benefits 83,431 83,593 (162) (0%)Material & Supplies 10,000 10,000 - 0%Transportation 7,000 7,000 - 0%Contractual Services 9,000 9,000 - 0%Miscellaneous 13,500 20,500 (7,000) (34%)Total 465,516$ 466,020$ (504)$ (0%)
GradeAdopted FY-2021 Adjustments
Final FY-2021 Adjustments FY-2022
General Manager 1 1 1Commission Secretary 6 1 1 1Total 2 0 2 0 2
Positions
General Management DepartmentThe General Manager supervises the department directors and the Commission Secretary. The Commission Secretary provides administrativesupport to the General Manager as well as the HRSD Commission.
Expenditure Budget
22

FY-2022 FY-2021 Increase/ Percentage Budget Budget (Decrease) Change
Personal Services 295,334$ 304,517$ (9,183)$ (3%)Fringe Benefits 94,169 96,002 (1,833) (2%)Material & Supplies 45,000 45,000 - 0%Transportation 8,500 9,000 (500) (6%)Contractual Services - 2,000 (2,000) (100%)Miscellaneous 13,000 16,000 (3,000) (19%)Total 456,003$ 472,519$ (16,516)$ (3%)
GradeAdopted FY-2021 Adjustments
Final FY-2021 Adjustments FY-2022
Director of Communications 12 1 1 1Public Information Specialist 6 1 1 1Community Education and Outreach Specialist 6 1 1 1Total 3 0 3 0 3
Communications DepartmentThe Communications Department supports HRSD’s mission and vision through public outreach, community engagement, educationalprogramming and environmental and locality partnerships. The department manages communications strategy, internal and externalcommunications, media relations and branding through numerous channels and resources - including publications, traditional media, socialmedia and web, graphic design, speaking engagements, tours, and special events.
Expenditure Budget
Positions
23

FY-2022 FY-2021 Increase/ PercentageBudget Budget (Decrease) Change
Personal Services 6,290,168$ 6,160,559$ 129,609$ 2%Fringe Benefits 2,526,643 2,651,686 (125,043) (5%)Material & Supplies 104,205 72,213 31,992 44%Transportation 8,100 7,850 250 3%Utilities 323,000 279,000 44,000 16%Contractual Services 5,778,819 5,633,530 145,289 3%Miscellaneous 272,150 256,304 15,846 6%Total 15,303,085$ 15,061,142$ 241,943$ 2%
GradeAdopted FY-2021 Adjustments
Final FY-2021 Adjustments FY-2022
Director of Finance 12 1 1 1Chief of Accounting & Finance 11 1 1 1Chief of Compliance & Risk 11 0 1 1 1Chief of Customer Care Center 11 1 1 1Chief of Procurement 11 1 1 1Accounting Manager 9 3 3 3Capital Program Manager 9 1 1 1Customer Technology Manager 9 2 2 2Customer Care Manager 9 2 2 2Business Analyst 8 3 3 3Financial Analyst 8 2 2 2Procurement Analyst 8 2 2 2Capital Program Analyst 7 1 1 1Customer Care Supervisor 7 4 4 4Delinquency Management Analyst 7 1 1 1Accounts Payable Supervisor 6 1 1 1Accounts Receivable Specialist 6 2 2 2Payroll Specialist 6 1 1 1ProCard & Contract Administrator 6 1 1 1Procurement Specialist 6 4 1 5 5Accounting Coordinator 4 1 1 1Accounts Receivable Technician 4 3 3 3Customer Care Administrative Coordinator 4 1 1 1Customer Care Coordinator 4 4 4 4Procurement Coordinator 4 1 1 1Account Investigator 3 11 11 11Accounts Payable Associate 3 3 3 3Customer Care Account Representative 3 40 (2) 38 38Procurement Administrative Assistant 3 2 2 2Mail Processing Clerk 2 2 2 2Total 102 0 102 0 102
Positions
Finance DepartmentThe Finance Department is responsible for HRSD's general financial and business functions, including financial reporting, investment portfolio,debt and risk management and customer billing. The Accounting Division handles fiscal affairs such as preparing statements, budgets,management reports and payroll. The Business Intelligence Division is the functional lead for the Enterprise Resource Process system andprepares the annual Capital Improvement Program update as part of the budget process. The Compliance and Risk Division ensures all financialrelated regulations, covenants and requirements are met and manages all of HRSD’s property and casualty insurance programs. The CustomerCare Center Division handles billing, payments, collections, maintenance of customer accounts and liaison with HRSD's customers. TheProcurement Division is responsible for purchasing, renting, leasing or otherwise acquiring goods, professional and non-professional services, andcertain construction services, managing supplier relationships and disposing of surplus property.
Expenditure Budget
24

FY-2022 FY-2021 Increase/ Percentage Budget Budget (Decrease) Change
Personal Services 5,054,686$ 4,828,740$ 225,946$ 5%Fringe Benefits 1,652,512 1,621,071 31,441 2%Material & Supplies 1,099,750 994,250 105,500 11%Transportation 12,700 23,700 (11,000) (46%)Utilities 1,176,000 1,340,000 (164,000) (12%)Contractual Services 6,292,500 6,333,050 (40,550) (1%)Major Repairs 1,125,000 1,250,000 (125,000) (10%)Miscellaneous 298,110 328,900 (30,790) (9%)Total 16,711,258$ 16,719,711$ (8,453)$ (0%)
GradeAdopted FY-2021 Adjustments
Final FY-2021 Adjustments FY-2022
Director of Information Technology 12 1 1 1Chief Information Security Officer 11 1 1 1Chief of Enterprise Data Services 11 1 1 1Chief of IT Operations and Support 11 1 (1) 0 0Database Administrator 9 3 3 3Enterprise Architect 9 3 3 3IT Systems Security Manager 9 1 1 1Oracle Developer 9 2 2 2Programming Development Manager 9 1 1 1Senior Systems Engineer 9 7 7 7Systems Analysis Manager 9 1 1 1Senior Programmer Analyst 8 8 8 8Senior Systems Analyst 8 3 3 2 5SharePoint Web Developer 8 1 1 1Linux Systems Administrator 8 2 2 2IT HelpDesk Supervisor 7 1 1 1Desktop Support Analyst 6 6 6 6Systems Analyst 6 1 1 1Web Portal Programmer 6 1 1 1Telecommunications Coordinator 5 0 1 1 1IT Administrative Coordinator 4 1 1 1Telecommunications Support Coordinator 4 1 (1) 0 0Computer Operator 3 3 3 3Total 50 (1) 49 2 51
Positions
Information Technology DepartmentThe Information Technology (IT) Department is responsible for HRSD's computer systems, communication systems, network infrastructure,cellular communications, cyber security, and data management functions. Staff also provides guidance and assistance in the identification andimplementation of new technologies, enhancing both organizational efficiency and efficacy. The Cybersecurity Division is responsible for ensuringthe safety, integrity, and availability of all HRSD information systems and business data. The Enterprise Data Services Division is responsible forapplication integration and support, data management, and systems analysis and support. The Information Technology Operations Divisionsupports departments in achieving their goals and objectives, providing the requisite hardware, software, storage, and network connectivity, tomeet business and operational requirements.
Expenditure Budget
25

FY-2022 FY-2021 Increase/ Percentage Budget Budget (Decrease) Change
Personal Services 1,620,907$ 1,577,738$ 43,169$ 3%Fringe Benefits 606,870 631,674 (24,804) (4%)Material & Supplies 56,500 58,500 (2,000) (3%)Transportation 27,600 28,500 (900) (3%)Contractual Services 22,000 41,000 (19,000) (46%)Miscellaneous 198,770 237,357 (38,587) (16%)Total 2,532,647$ 2,574,769$ (42,122)$ (2%)
GradeAdopted FY-2021 Adjustments
Final FY-2021 Adjustments FY-2022
Director of Talent Management 12 1 1 1ODT Manager 10 1 1 1Human Resources Manager 9 1 1 1Safety Manager 9 1 1 1Human Resources Business Analyst 8 1 1 1Human Resources Business Partner 8 3 3 3Industrial Hygienist 8 2 2 2Training Superintendent 8 1 1 1ODT Resource Specialist 6 1 1 1Safety Technician 5 2 2 2Human Resources Coordinator 4 2 2 2ODT Coordinator 4 1 1 1Total 17 0 17 0 17
Positions
Talent Management DepartmentThe Talent Management Department attracts new talent, develops talent and retains existing talent. The Human Resources Division maintainsemployee records, handles employee recruiting and orientation, and administers employee benefits and workers compensation. TheOrganizational Development and Training (ODT) Division oversees training and the apprenticeship program. The Safety Division monitors risk,conducts safety training and works to ensure employee safety.
Expenditure Budget
26
FY-2022 FY-2021 Increase/ Percentage Budget Budget (Decrease) Change
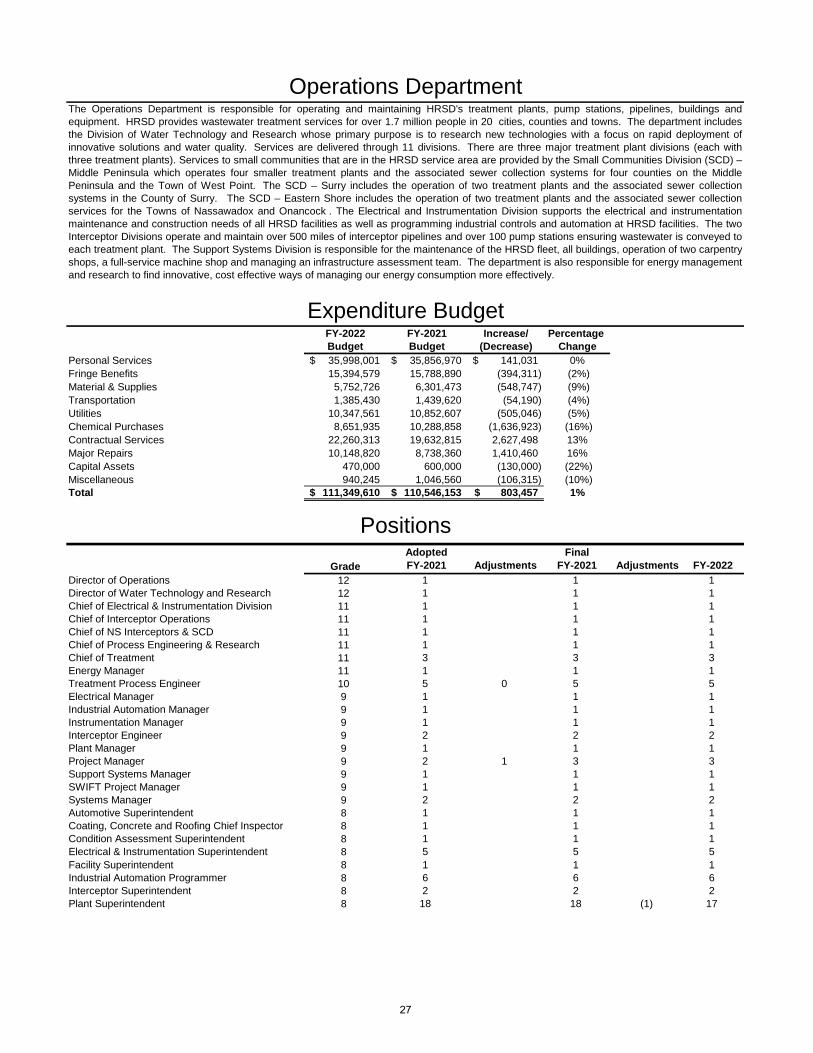
Personal Services 35,998,001$ 35,856,970$ 141,031$ 0%Fringe Benefits 15,394,579 15,788,890 (394,311) (2%)Material & Supplies 5,752,726 6,301,473 (548,747) (9%)Transportation 1,385,430 1,439,620 (54,190) (4%)Utilities 10,347,561 10,852,607 (505,046) (5%)Chemical Purchases 8,651,935 10,288,858 (1,636,923) (16%)Contractual Services 22,260,313 19,632,815 2,627,498 13%Major Repairs 10,148,820 8,738,360 1,410,460 16%Capital Assets 470,000 600,000 (130,000) (22%)Miscellaneous 940,245 1,046,560 (106,315) (10%)Total 111,349,610$ 110,546,153$ 803,457$ 1%
GradeAdopted FY-2021 Adjustments
Final FY-2021 Adjustments FY-2022
Director of Operations 12 1 1 1Director of Water Technology and Research 12 1 1 1Chief of Electrical & Instrumentation Division 11 1 1 1Chief of Interceptor Operations 11 1 1 1Chief of NS Interceptors & SCD 11 1 1 1Chief of Process Engineering & Research 11 1 1 1Chief of Treatment 11 3 3 3Energy Manager 11 1 1 1Treatment Process Engineer 10 5 0 5 5Electrical Manager 9 1 1 1Industrial Automation Manager 9 1 1 1Instrumentation Manager 9 1 1 1Interceptor Engineer 9 2 2 2Plant Manager 9 1 1 1Project Manager 9 2 1 3 3Support Systems Manager 9 1 1 1SWIFT Project Manager 9 1 1 1Systems Manager 9 2 2 2Automotive Superintendent 8 1 1 1Coating, Concrete and Roofing Chief Inspector 8 1 1 1Condition Assessment Superintendent 8 1 1 1Electrical & Instrumentation Superintendent 8 5 5 5Facility Superintendent 8 1 1 1Industrial Automation Programmer 8 6 6 6Interceptor Superintendent 8 2 2 2Plant Superintendent 8 18 18 (1) 17
Expenditure Budget
Positions
Operations DepartmentThe Operations Department is responsible for operating and maintaining HRSD's treatment plants, pump stations, pipelines, buildings andequipment. HRSD provides wastewater treatment services for over 1.7 million people in 20 cities, counties and towns. The department includesthe Division of Water Technology and Research whose primary purpose is to research new technologies with a focus on rapid deployment ofinnovative solutions and water quality. Services are delivered through 11 divisions. There are three major treatment plant divisions (each withthree treatment plants). Services to small communities that are in the HRSD service area are provided by the Small Communities Division (SCD) –Middle Peninsula which operates four smaller treatment plants and the associated sewer collection systems for four counties on the MiddlePeninsula and the Town of West Point. The SCD – Surry includes the operation of two treatment plants and the associated sewer collectionsystems in the County of Surry. The SCD – Eastern Shore includes the operation of two treatment plants and the associated sewer collectionservices for the Towns of Nassawadox and Onancock . The Electrical and Instrumentation Division supports the electrical and instrumentationmaintenance and construction needs of all HRSD facilities as well as programming industrial controls and automation at HRSD facilities. The twoInterceptor Divisions operate and maintain over 500 miles of interceptor pipelines and over 100 pump stations ensuring wastewater is conveyed toeach treatment plant. The Support Systems Division is responsible for the maintenance of the HRSD fleet, all buildings, operation of two carpentryshops, a full-service machine shop and managing an infrastructure assessment team. The department is also responsible for energy managementand research to find innovative, cost effective ways of managing our energy consumption more effectively.
27

GradeAdopted FY-2021 Adjustments
Final FY-2021 Adjustments FY-2022
Chief Foreman 7 2 2 2Chief Maintenance Management 7 2 2 2Chief Systems Operator 7 2 2 2Electrical & Instrumentation Process Specialist 7 1 1 1Electrical & Instrumentation Specialist 7 64 64 64Interceptor Specialist 7 0 2 2 2Lead Operator 7 33 33 33Operations Support Specialist 7 1 1 1Automotive Foreman 6 2 2 2Coatings Inspector 6 2 2 2Condition Assessment Supervisor 6 1 1 1Interceptor Foreman 6 7 7 7Interceptor Inspector 6 4 (2) 2 2Interceptor Systems Supervisor 6 2 2 2Machinist Foreman 6 1 1 1Maintenance Planner 6 7 7 7Pump Station Supervisor 6 2 2 2Automotive Technician 5 5 5 5Carpenter 5 4 4 4Equipment Technician 5 3 3 3Facility Maintenance Technician 5 2 2 2Interceptor Technician 5 30 30 30Machinist 5 2 2 2Maintenance Operator 5 69 1 70 (1) 69Plant Operator 5 78 7 85 (3) 82Automotive Coordinator 4 1 1 1Heavy Equipment Operator 1 4 19 19 19Materials Operations Coordinator 4 2 2 2Operations Admin Coordinator 4 1 1 1Operations Coordinator 4 2 2 2Plant Administrative Assistant 3 0 9 9 1 10Utility Administrative Assistant 3 1 1 1SCADA Administrative Assistant 3 1 1 1Interceptor Assistant 2 28 28 28Maintenance Operations Assistant 2 46 (1) 45 (1) 44Plant Clerk 2 9 (9) 0 0Facility Assistant 1 1 1 1Custodian 1 4 4 4
Subtotal - Operations 503 8 511 (5) 506
Small CommunitiesSystems Manager 9 1 1 1Systems Superintendent 8 1 1 1 2Systems Chief Foreman 7 1 1 1Systems Lead Operator 7 3 3 3Systems Foreman 6 1 1 1 2Systems Operator 5 10 10 2 12Administrative Coordinator 4 1 1 1Heavy Equipment Operator 1 4 1 1 1Maintenance Operations Assistant 2 3 3 3SCD Lab Assistant 2 1 1 1Facility Assistant 1 0 0 0
Subtotal - Small Communities 23 0 23 4 27
Total 526 8 534 (1) 533
Operations Department Positions (continued)
28

FY-2022 FY-2021 Increase/ PercentageBudget Budget (Decrease) Change
Personal Services 4,439,309$ 4,063,953$ 375,356$ 9%Fringe Benefits 1,576,016 1,497,746 78,270 5%Material & Supplies 38,547 42,320 (3,773) (9%)Transportation 23,270 26,635 (3,365) (13%)Contractual Services 912,241 707,681 204,560 29%Miscellaneous 119,500 183,619 (64,119) (35%)Total 7,108,883$ 6,521,954$ 586,929$ 9%
GradeAdopted FY-2021 Adjustments
Final FY-2021 Adjustments FY-2022
Director of Engineering 12 1 1 1Chief of Asset Management 11 1 1 1Chief of Design & Construction 11 2 2 2Chief of Design & Construction - SWIFT 11 1 1 1Chief of Planning & Analysis 11 1 1 1Condition Assessment Manager 9 2 2 2Data Analysis Manager 9 1 1 1Enterprise Data Scientist 9 0 1 1 1GIS Manager 9 1 1 1Hydraulic Analysis Manager 9 4 4 4Project Manager 9 10 10 10Real Estate Manager 8 2 2 2CMMS Analyst 7 2 2 2Data Analyst 7 5 5 5GIS Analyst 7 2 2 2Planning Engineer 7 2 2 2Contract Specialist 6 3 3 3GIS CAD Technician 5 2 2 2Administrative Coordinator 4 1 1 1Engineering Clerk 2 1 1 1Total 44 1 45 0 45
Positions
Engineering DepartmentThe Engineering Department is responsible for facility planning, design and construction and related support. The Asset Management Division isresponsible for the Computerized Maintenance Management System (CMMS), Condition Assessment, and Emergency Management proceduresto extend the life of assets at the lowest life cycle cost. The Design and Construction Divisions deliver capital projects in a manner consistent withHRSD’s quality standards. The Planning and Analysis Division manages numerous diverse functions including Hydraulic Modeling, GeographicInformation System (GIS), Data Analysis and Records Management System and plans the capital infrastructure required to meet the region'sfuture wastewater needs. The department is also responsible for all property and land acquisition to meet the needs of HRSD.
Expenditure Budget
29

FY-2022 FY-2021 Increase/ Percentage Budget Budget (Decrease) Change
Personal Services 8,459,559$ 8,324,104$ 135,455$ 2%Fringe Benefits 3,424,426 3,346,602 77,824 2%Material & Supplies 1,623,700 1,518,100 105,600 7%Transportation 26,206 35,706 (9,500) (27%)Utilities 2,700 2,700 - 0%Contractual Services 1,700,500 1,726,700 (26,200) (2%)Major Repairs 76,000 87,600 (11,600) (13%)Miscellaneous 583,050 635,400 (52,350) (8%)Total 15,896,141$ 15,676,912$ 219,229$ 1%
GradeAdopted FY-2021 Adjustments
Final FY-2021 Adjustments FY-2022
Director of Water Quality 12 1 1 1Chief of Lab 11 1 1 1Chief of P3 11 1 1 1Chief of TSD 11 1 1 1TSD Geologist 10 1 1 1Environmental Scientist 9 7 7 7Lab Manager 9 4 4 4Lab Quality Assurance Manager 9 1 1 1LIMS Optimization Manager 9 1 1 1P3 Manager 9 4 4 4WQ/Ops Quality Assurance Manager 9 1 1 1Lab EDMS Administrator 8 1 1 1Lab Operations Manager 8 1 1 1Lab Supervising Chemist 8 13 13 13P3 Supervising Specialist 8 3 3 3TSD Operations Manager 8 1 1 1TSD Supervising Specialist 8 3 3 3P3 Administrative Supervising Specialist 7 1 1 1P3 PIMS Analyst 7 1 1 1TSD Specialist 7 12 12 12Lab EDMS Analyst 6 1 1 1Lab Quality Assurance Specialist 6 1 1 1Lab Specialist 6 14 14 14P3 Specialist 6 4 4 1 5Lab Data Technician 5 1 1 1Lab Technician 5 5 5 5P3 Administrative Technician 5 1 1 1P3 Technician 5 10 10 10TSD Technician 5 8 8 8CEL Operations Coordinator 4 1 1 1Lab Assistant 4 0 7 7 7Lab Data Coordinator 4 1 1 1TSD Operations Coordinator 4 1 1 1WQ Administrative Coordinator 4 1 1 1P3 Administrative Assistant 3 2 2 2Lab Assistant 2 7 (7) 0 0TSD Assistant 2 1 1 1Total 118 0 118 1 119
Expenditure Budget
Positions
Water Quality DepartmentThe Water Quality (WQ) Department's mission is to provide quality environmental services to support HRSD and its partners. This departmenthelps ensure compliance with HRSD environmental permits and leads regulatory advocacy through the work of three divisions. The CentralEnvironmental Laboratory (CEL) Division uses the Environmental Data Management System (EDMS) and other tools to provide analytical supportfor numerous monitoring, research and regulatory purposes. The Pretreatment and Pollution Prevention (P3) Division monitors wastewaterconveyed to treatment plants using the Pretreatment Information Management System (PIMS) and other tools, and implements its IndustrialWastewater Discharge Regulations to protect treatment plant staff, facilities and processes. The Technical Services Division (TSD) isresponsible for activities including environmental monitoring, specialized sampling, treatment process and research studies, the MunicipalAssistance Program (MAP) to assist localities, as well as all reporting required by HRSD permits.
30

FY-2022 FY-2021 Increase/ Percentage Budget Budget (Decrease) Change
Personal Services 275,506$ (500,005)$ 775,511$ (155%)Fringe Benefits (201,900) (786,499) 584,599 (74%)Material & Supplies 26,000 26,000 - 0%Utilities 440,000 480,000 (40,000) (8%)Contractual Services 7,500,221 7,700,390 (200,169) (3%)Miscellaneous 599,900 817,000 (217,100) (27%)Total General Expenses 8,639,727$ 7,736,886$ 902,841$ 12%
Publically Sold Bonds - Principal 22,430,000$ 21,545,000$ 885,000$ 4%Publically Sold Bonds - Interest 22,730,000 23,759,200 (1,029,200) (4%)VCWRLF Bonds 19,148,209 16,103,622 3,044,587 19%
Subtotal - Debt Service 64,308,209 61,407,822 2,900,387 5%
Transfer to CIP 114,463,921 94,953,112 19,510,809 21%Transfer to General Reserve - - - 0%Transfer to Risk Management 260,000 260,000 - 0%
Subtotal - Transfers 114,723,921 95,213,112 19,510,809 20%
Total Debt Service and Transfers 179,032,130$ 156,620,934$ 22,411,196$ 14%
General Expenses, Debt Service and Transfers
Expenditure Budget
General Expenses includes operating expenditures not assigned to any specific HRSD Department. Debt Service includes payments on bonds issued byHRSD and through the Virginia Clean Water Revolving Loan Fund (VCWRLF). Transfers are made to fund the Capital Improvement Program (CIP) andthe Risk Management reserve. The costs incurred to issue bonds are included in General Expenses - Miscellaneous.
31

This page was intentionally left blank
32


Capital Budget HRSD prepares a Capital Improvement Program (CIP) each year for the capital projects currently underway or proposed for the future. The first year of the CIP is authorized as the Capital Budget for FY-2022 in the amount of $290 million. The remaining years (FY-2023 to FY-2031) include all known projects planned for these years; however, approval of the plan does not authorize the Capital Budgets for those years. Each year’s Capital Budget will be approved during the budget process for the specific year.
The ten-year Capital Improvement Program for FY-2022 to FY-2031 highlights the anticipated cost of each project and the fiscal year(s) in which the work is expected to occur. All costs listed in the CIP are stated in current year dollars and total approximately $3.0 billion.
The bond component of the plan may include one or all of the following:
• Interim or construction financings
• Federally subsidized borrowing programs administered by the Virginia Resource Authority and the Environmental Protection Agency
• HRSD Revenue Bonds or Notes The grant component represents funds estimated to be received from a federal or state agency for specific projects. Other reimbursements, if any, include amounts paid by other parties who may participate in a project.
33

Capital Budget
CIP Budget Forecast (in thousands) Total FY-2022
to FY-2031 FY-2022 FY-2023 FY-2024 FY-2025 FY-2026Beginning Capital Reserves 190,854$ -$ -$ -$ -$ -$ Bonds 285,791 - - 285,791 - - VCWRLF 400,000 100,000 100,000 100,000 100,000 - WIFIA 850,460 40,659 86,314 169,494 149,751 75,575 WQIF 127,500 - 2,500 15,000 17,500 27,500
Grants and Other Reimbursements 48,677 - 2,055 7,818 9,278 7,409 Cash 1,320,500 121,994 124,157 114,213 125,600 117,997 Transfer from Line of Credit (34,995) 27,347 94,974 (157,316) 17,871 6,519 Total Capital Resources 3,188,787 290,000 410,000 535,000 420,000 235,000 Capital Expenditures 2,995,000 290,000 410,000 535,000 420,000 235,000 Ending Capital Reserves 193,787$ -$ -$ -$ -$ -$
Capital Expenditures (in thousands) Total FY-2022
to FY-2031 FY-2022 FY-2023 FY-2024 FY-2025 FY-2026Administration 16,186$ 3,750$ 3,659$ 4,537$ 4,239$ -$ Army Base 17,970 6,567 6,381 5,022 - - Atlantic 77,729 12,119 18,754 23,398 11,962 7,485 Boat Harbor 273,563 41,379 46,859 74,549 52,827 16,741 Chesapeake-Elizabeth 24,739 6,997 3,978 2,586 2,367 2,859 Eastern Shore 24,630 4,394 6,051 2,885 5,000 545 James River 257,741 32,339 70,135 81,947 59,844 13,475 Middle Peninsula 106,433 18,276 30,437 29,355 6,836 7,305 Nansemond 343,124 35,520 46,578 102,990 98,085 28,567 Surry 29,442 15,959 7,566 2,343 3,541 33 Virginia Initiative Plant 172,362 24,536 48,749 41,265 13,928 7,897 Williamsburg 12,706 4,299 3,812 856 - - York River 55,784 12,164 14,886 9,723 10,399 7,575 General 1,248,254 71,701 94,116 128,068 128,733 128,723 Future Improvements 217,014 - - - 2,239 2,604 Sub-Total 2,877,675 290,000 401,961 509,524 400,000 223,810 Contingency 117,325 - 8,039 25,476 20,000 11,190 Total Expenditures 2,995,000$ 290,000$ 410,000$ 535,000$ 420,000$ 235,000$
34

Capital Budget
CIP Budget Forecast (in thousands) Beginning Capital ReservesBondsVCWRLFWIFIAWQIF
Grants and Other Reimbursements CashTransfer from Line of CreditTotal Capital ResourcesCapital ExpendituresEnding Capital Reserves
Capital Expenditures (in thousands) AdministrationArmy BaseAtlanticBoat HarborChesapeake-ElizabethEastern ShoreJames RiverMiddle PeninsulaNansemondSurryVirginia Initiative PlantWilliamsburgYork RiverGeneralFuture ImprovementsSub-TotalContingencyTotal Expenditures
FY-2027 FY-2028 FY-2029 FY-2030 FY-2031-$ 2,856$ 38,240$ 92,962$ 56,796$ - - - - - - - - - -
75,135 99,706 82,092 49,953 21,781 25,000 25,000 7,500 5,000 2,500 8,087 7,543 4,644 1,843 -
154,024 163,135 170,486 107,038 121,856 (24,390) 237,856 298,240 302,962 256,796 202,933 235,000 260,000 210,000 200,000 200,000
2,856$ 38,240$ 92,962$ 56,796$ 2,933$
FY-2027 FY-2028 FY-2029 FY-2030 FY-2031-$ -$ -$ -$ -$ - - - - -
1,321 303 508 - 1,880 37,273 3,934 - - - 3,476 2,477 - - - 5,455 300 - - -
- - - - - 7,736 4,644 1,843 - - 4,739 13,407 9,451 3,780 7
- - - - - 1,826 10,603 11,022 9,383 3,153
- - - - 3,739 1,037 - - - -
160,173 209,258 173,308 105,834 48,340 774 2,693 3,868 71,479 133,358
223,810 247,619 200,000 190,476 190,476 11,190 12,381 10,000 9,524 9,524
235,000$ 260,000$ 210,000$ 200,000$ 200,000$
35

FY-2022 to FY-2031Cash Flow Projections (in thousands)
CIP No Project Name Total FY-2022
to FY-2031 FY-2022 FY-2023 FY-2024 FY-2025
AD012300 Central Environmental Laboratory Phase II $ 2,126 $ 124 $ 82 $ 960 $ 960 AD012310 Central Environmental Laboratory Phase II - Study $ 50 $ 50 $ - $ - $ - AD012500 Cybersecurity Practice & Procedure Initiative $ 14,010 $ 3,577 $ 3,577 $ 3,577 $ 3,279
Subtotal $ 16,186 $ 3,750 $ 3,659 $ 4,537 $ 4,239
AB010000 Army Base 24-Inch and 20-Inch Transmission Main Replacements $ 7,800 $ 588 $ 3,616 $ 3,596 $ - AB010500 Section W Force Main Replacement $ 3,036 $ 177 $ 1,435 $ 1,425 $ - AB011800 Army Base to VIP Transmission Force Main $ 49,930 $ - $ - $ - $ - AB011900 Army Base Treatment Plant Administration Building Renovation (2021) $ 1,134 $ 1,002 $ 130 $ 2 $ - AB012000 Wards Corner Sanitary Sewer Pumping Station $ 6,000 $ 4,800 $ 1,200 $ - $ -
Subtotal $ 17,970 $ 6,567 $ 6,381 $ 5,022 $ -
AT011520 Shipps Corner Pressure Reducing Station Modifications $ 1,486 $ 87 $ 1,278 $ 116 $ - AT011900 Great Bridge Interceptor Extension 16-Inch Replacement $ 4,615 $ 65 $ 236 $ 2,177 $ 2,136 AT012920 Atlantic Treatment Plant Access Road Extension $ 9,654 $ 1,123 $ 4,084 $ 4,447 $ - AT013000 Washington District Pump Station Area Sanitary Sewer Improvements $ 6,050 $ 1,856 $ 2,784 $ 1,264 $ 146 AT013110 South Norfolk Area Gravity Sewer Improvements, Phase II $ 7,830 $ 497 $ 3,676 $ 3,656 $ -
AT013200Doziers Corner Pump Station and Washington District Pump Station Flooding Mitigation Improvements $ 2,837 $ - $ 57 $ 425 $ 2,356
AT013700Atlantic Trunk Interceptor Force Main Relocation (VDOT Laskin Road Betterment) $ 351 $ 61 $ 61 $ 130 $ 100
AT014000 Lynnhaven-Great Neck IFM (SF-021) Relocation $ 987 $ 395 $ 395 $ 197 $ - AT014301 Atlantic Service Area I-I Reduction Phase I (CHES) $ 11,911 $ - $ 721 $ 998 $ 1,447 AT014302 Atlantic Service Area I-I Reduction Phase II (CHES) $ 9,770 $ 1,045 $ 1,728 $ 3,806 $ 3,185 AT014303 Chesapeake Pump Station Capacity Improvements (AT-HPP-01C) $ 866 $ - $ - $ - $ - AT014500 Atlantic Treatment Plant Influent Screens (1-3) Replacement $ 2,441 $ 2,441 $ - $ - $ - AT014600 Kempsville Interceptor Force Main Replacement - Phase I $ 5,393 $ 281 $ 760 $ 2,895 $ 1,458 AT014800 Atlantic Treatment Plant Electrical Workspace Renovation $ 514 $ 514 $ - $ - $ - AT014900 Atlantic Treatment Plant Gravity Belt Thickener Expansion $ 1,475 $ 1,082 $ 393 $ - $ - AT015000 Atlantic Treatment Plant Polymer System Replacement $ 3,375 $ 1,902 $ 1,473 $ - $ - AT015100 Atlantic Treatment Plant Solids Storage Pad Improvements $ 672 $ 422 $ 250 $ - $ - AT015200 Cedar Road Interceptor Force Main Replacement Phase I $ 5,628 $ 349 $ 857 $ 3,287 $ 1,136 AT015300 High Priority Projects Round 2 Project 2 $ 26,850 $ - $ - $ - $ -
Subtotal $ 77,729 $ 12,119 $ 18,754 $ 23,398 $ 11,962
BH013020 Willard Avenue Pump Station Replacement $ 11,979 $ 7,562 $ 4,413 $ 3 $ - BH014000 West Avenue and 35th Street Interceptor Force Main Replacement $ 2,391 $ 1,040 $ 1,352 $ - $ - BH014220 Hampton Trunk Sewer Extension Divisions I and J Relocation Phase II $ 12,451 $ 6,218 $ 6,218 $ 9 $ 6 BH014500 Ivy Home-Shell Road Sewer Extension Division I Replacement $ 1,998 $ 585 $ 1,410 $ 4 $ - BH014600 46th Street Diversion Sewer Rehabilitation Replacement $ 6,836 $ 4,311 $ 2,521 $ 4 $ - BH014900 Hampton Trunk Sewer Extension Division K Gravity Improvements $ 5,722 $ 3,611 $ 2,109 $ 3 $ - BH015600 Hampton Trunk A and B Replacement-Jefferson Avenue to Walnut Avenue $ 6,688 $ 6,680 $ 8 $ - $ - BH015700 Boat Harbor Treatment Plant Pump Station Conversion $ 65,382 $ 5,752 $ 5,205 $ 26,940 $ 24,840
BH015710 Boat Harbor Treatment Plant Transmission Force Main Section 1 (Subaqueous) $ 64,498 $ 2,394 $ 12,637 $ 33,375 $ 16,092 BH015720 Boat Harbor Treatment Plant Transmission Force Main Section 2 (Land) $ 22,020 $ 1,973 $ 7,739 $ 12,308 $ - BH015730 Boat Harbor Treatment Plant Decommission and Demolition $ 28,626 $ - $ - $ 516 $ 1,866 BH015801 14th Street Offline Storage (BH-HPP-01A) $ 15,124 $ - $ 885 $ 839 $ 8,425 BH015802 Claremont Pump Station Upgrade (BH-HPP-01B) $ 11,157 $ - $ - $ 546 $ 766 BH015803 Chesapeake Avenue Interceptor Improvements (BH-HPP-01C) $ 15,071 $ - $ - $ - $ 831 BH015900 Bloxoms Corner Force Main Replacement $ 3,620 $ 1,254 $ 2,362 $ 4 $ - BH016100 High Priority Projects Round 2 Project 3 $ 26,380 $ - $ - $ - $ -
Subtotal $ 273,563 $ 41,379 $ 46,859 $ 74,549 $ 52,827
CE010520 Newtown Road Interceptor Force Main Relocation $ 1,728 $ 1,645 $ 83 $ - $ -
CE011300Birchwood Trunk 24-Inch 30-Inch Force Main at Independence Boulevard Replacement Phase II $ 1,548 $ 381 $ 1,167 $ - $ -
CE011600 Poplar Hall Davis Corner Trunk 24-Inch Gravity Sewer Improvements $ 1,836 $ 139 $ 668 $ 1,029 $ - CE011700 Western Trunk Force Main Replacement $ 83 $ 83 $ - $ - $ - CE011810 Chesapeake-Elizabeth Treatment Plant Decommissioning $ 11,304 $ 204 $ 2,057 $ 1,419 $ 2,128 CE011821 Elbow Road Pressure Reducing Station $ 227 $ 227 $ - $ - $ - CE011823 Virginia Beach Boulevard Force Main Phase VI $ 1,088 $ 1,088 $ - $ - $ - CE011825 Salem Road Interconnect Force Main $ 925 $ 925 $ - $ - $ - CE011830 Little Creek Pump Station Modifications $ 6 $ 6 $ - $ - $ - CE011835 Virginia Beach City Pump Station Upgrades, Phase V $ 1,200 $ 1,200 $ - $ - $ - CE011836 Norfolk City Pump Station Upgrades $ 615 $ 615 $ - $ - $ - CE011840 Oceana Off-Line Storage Facility $ 82 $ 82 $ - $ - $ - CE011850 Atlantic Service Area Automated Diversion Facilities Phase I $ 402 $ 402 $ - $ - $ - CE012100 Witchduck Road Interceptor Force Main Improvements $ 3,694 $ - $ 3 $ 138 $ 239
Subtotal $ 24,739 $ 6,997 $ 3,978 $ 2,586 $ 2,367 Note: VIP - Virginia Initiative Plant
VDOT - Virginia Department of Transportation IFM - Interceptor Force Main CHES - City of Chesapeake BH - Boat Harbor Treatment Plant HPP - High Priority Project
Administration
Army Base
Atlantic
Boat Harbor
Chesapeake-Elizabeth
36

FY-2022 to FY-2031Cash Flow Projections (in thousands)
CIP No Project Name
AD012300 Central Environmental Laboratory Phase IIAD012310 Central Environmental Laboratory Phase II - StudyAD012500 Cybersecurity Practice & Procedure Initiative
Subtotal
AB010000 Army Base 24-Inch and 20-Inch Transmission Main ReplacementsAB010500 Section W Force Main ReplacementAB011800 Army Base to VIP Transmission Force MainAB011900 Army Base Treatment Plant Administration Building Renovation (2021)AB012000 Wards Corner Sanitary Sewer Pumping Station
Subtotal
AT011520 Shipps Corner Pressure Reducing Station ModificationsAT011900 Great Bridge Interceptor Extension 16-Inch ReplacementAT012920 Atlantic Treatment Plant Access Road ExtensionAT013000 Washington District Pump Station Area Sanitary Sewer ImprovementsAT013110 South Norfolk Area Gravity Sewer Improvements, Phase II
AT013200Doziers Corner Pump Station and Washington District Pump Station Flooding Mitigation Improvements
AT013700Atlantic Trunk Interceptor Force Main Relocation (VDOT Laskin Road Betterment)
AT014000 Lynnhaven-Great Neck IFM (SF-021) RelocationAT014301 Atlantic Service Area I-I Reduction Phase I (CHES)AT014302 Atlantic Service Area I-I Reduction Phase II (CHES)AT014303 Chesapeake Pump Station Capacity Improvements (AT-HPP-01C)AT014500 Atlantic Treatment Plant Influent Screens (1-3) ReplacementAT014600 Kempsville Interceptor Force Main Replacement - Phase IAT014800 Atlantic Treatment Plant Electrical Workspace RenovationAT014900 Atlantic Treatment Plant Gravity Belt Thickener ExpansionAT015000 Atlantic Treatment Plant Polymer System ReplacementAT015100 Atlantic Treatment Plant Solids Storage Pad ImprovementsAT015200 Cedar Road Interceptor Force Main Replacement Phase IAT015300 High Priority Projects Round 2 Project 2
Subtotal
BH013020 Willard Avenue Pump Station ReplacementBH014000 West Avenue and 35th Street Interceptor Force Main ReplacementBH014220 Hampton Trunk Sewer Extension Divisions I and J Relocation Phase IIBH014500 Ivy Home-Shell Road Sewer Extension Division I ReplacementBH014600 46th Street Diversion Sewer Rehabilitation ReplacementBH014900 Hampton Trunk Sewer Extension Division K Gravity ImprovementsBH015600 Hampton Trunk A and B Replacement-Jefferson Avenue to Walnut AvenueBH015700 Boat Harbor Treatment Plant Pump Station Conversion
BH015710 Boat Harbor Treatment Plant Transmission Force Main Section 1 (Subaqueous)BH015720 Boat Harbor Treatment Plant Transmission Force Main Section 2 (Land)BH015730 Boat Harbor Treatment Plant Decommission and DemolitionBH015801 14th Street Offline Storage (BH-HPP-01A)BH015802 Claremont Pump Station Upgrade (BH-HPP-01B)BH015803 Chesapeake Avenue Interceptor Improvements (BH-HPP-01C)BH015900 Bloxoms Corner Force Main ReplacementBH016100 High Priority Projects Round 2 Project 3
Subtotal
CE010520 Newtown Road Interceptor Force Main Relocation
CE011300Birchwood Trunk 24-Inch 30-Inch Force Main at Independence Boulevard Replacement Phase II
CE011600 Poplar Hall Davis Corner Trunk 24-Inch Gravity Sewer ImprovementsCE011700 Western Trunk Force Main ReplacementCE011810 Chesapeake-Elizabeth Treatment Plant DecommissioningCE011821 Elbow Road Pressure Reducing StationCE011823 Virginia Beach Boulevard Force Main Phase VICE011825 Salem Road Interconnect Force MainCE011830 Little Creek Pump Station ModificationsCE011835 Virginia Beach City Pump Station Upgrades, Phase VCE011836 Norfolk City Pump Station UpgradesCE011840 Oceana Off-Line Storage FacilityCE011850 Atlantic Service Area Automated Diversion Facilities Phase ICE012100 Witchduck Road Interceptor Force Main Improvements
SubtotalNote: VIP - Virginia Initiative Plant
VDOT - Virginia Department of Transportation IFM - Interceptor Force Main CHES - City of Chesapeake BH - Boat Harbor Treatment Plant HPP - High Priority Project
Administration
Army Base
Atlantic
Boat Harbor
Chesapeake-Elizabeth
FY-2026 FY-2027 FY-2028 FY-2029 FY-2030 FY-2031
$ - $ - $ - $ - $ - $ - $ - $ - $ - $ - $ - $ - $ - $ - $ - $ - $ - $ - $ - $ - $ - $ - $ - $ -
$ - $ - $ - $ - $ - $ - $ - $ - $ - $ - $ - $ - $ - $ - $ - $ - $ - $ - $ - $ - $ - $ - $ - $ - $ - $ - $ - $ - $ - $ - $ - $ - $ - $ - $ - $ -
$ - $ - $ - $ - $ - $ - $ - $ - $ - $ - $ - $ - $ - $ - $ - $ - $ - $ - $ - $ - $ - $ - $ - $ - $ - $ - $ - $ - $ - $ -
$ - $ - $ - $ - $ - $ -
$ - $ - $ - $ - $ - $ - $ - $ - $ - $ - $ - $ - $ 7,478 $ 1,267 $ - $ - $ - $ - $ 7 $ - $ - $ - $ - $ - $ - $ 54 $ 303 $ 508 $ - $ - $ - $ - $ - $ - $ - $ - $ - $ - $ - $ - $ - $ - $ - $ - $ - $ - $ - $ - $ - $ - $ - $ - $ - $ - $ - $ - $ - $ - $ - $ - $ - $ - $ - $ - $ - $ - $ - $ - $ - $ - $ - $ - $ - $ - $ - $ - $ - $ 1,880 $ 7,485 $ 1,321 $ 303 $ 508 $ - $ 1,880
$ - $ - $ - $ - $ - $ - $ - $ - $ - $ - $ - $ - $ - $ - $ - $ - $ - $ - $ - $ - $ - $ - $ - $ - $ - $ - $ - $ - $ - $ - $ - $ - $ - $ - $ - $ - $ - $ - $ - $ - $ - $ - $ 2,645 $ - $ - $ - $ - $ -
$ - $ - $ - $ - $ - $ - $ - $ - $ - $ - $ - $ - $ 244 $ 25,004 $ 996 $ - $ - $ - $ 4,975 $ - $ - $ - $ - $ - $ 6,390 $ 3,454 $ - $ - $ - $ - $ 2,487 $ 8,815 $ 2,938 $ - $ - $ - $ - $ - $ - $ - $ - $ - $ - $ - $ - $ - $ - $ - $ 16,741 $ 37,273 $ 3,934 $ - $ - $ -
$ - $ - $ - $ - $ - $ -
$ - $ - $ - $ - $ - $ - $ - $ - $ - $ - $ - $ - $ - $ - $ - $ - $ - $ - $ 2,128 $ 2,128 $ 1,241 $ - $ - $ - $ - $ - $ - $ - $ - $ - $ - $ - $ - $ - $ - $ - $ - $ - $ - $ - $ - $ - $ - $ - $ - $ - $ - $ - $ - $ - $ - $ - $ - $ - $ - $ - $ - $ - $ - $ - $ - $ - $ - $ - $ - $ - $ - $ - $ - $ - $ - $ - $ 731 $ 1,348 $ 1,236 $ - $ - $ - $ 2,859 $ 3,476 $ 2,477 $ - $ - $ -
37

FY-2022 to FY-2031Cash Flow Projections (in thousands)
CIP No Project Name Total FY-2022
to FY-2031 FY-2022 FY-2023 FY-2024 FY-2025
ES010100 Eastern Shore Infrastructure Improvements - Transmission Force Main Phase I $ 12,860 $ 4,204 $ 5,771 $ 2,885 $ -
ES010200 Eastern Shore Infrastructure Improvements - Transmission Force Main Phase II $ 11,300 $ - $ - $ - $ 5,000 ES010300 Onancock Treatment Plant Administration Building Upgrade $ 470 $ 190 $ 280 $ - $ -
Subtotal $ 24,630 $ 4,394 $ 6,051 $ 2,885 $ 5,000
JR011730 Jefferson Avenue Interceptor Force Main Replacement Phase III $ 17,474 $ 9,709 $ 7,758 $ 7 $ -
JR013000Morrison Pump Station Discharge Force Main Replacement & Capacity Enhancements $ 1,437 $ 1,435 $ 3 $ - $ -
JR013200 Lucas Creek-Woodhaven Interceptor Force Main Replacement Phase II $ 2,107 $ 160 $ 1,776 $ 171 $ 1 JR013400 James River Treatment Plant Advanced Nutrient Reduction Improvements $ 215,992 $ 17,862 $ 50,187 $ 74,628 $ 59,840 JR013500 Lucas Creek Pump Station Replacement $ 9,278 $ 1,933 $ 4,404 $ 2,938 $ 3
JR013600 James River Treatment Plant Primary Treatment and Automation Improvements $ 11,452 $ 1,240 $ 6,008 $ 4,204 $ - JR013700 High Priority Projects Round 2 Project 6 $ 17,090 $ - $ - $ - $ -
Subtotal $ 257,741 $ 32,339 $ 70,135 $ 81,947 $ 59,844
MP011700Middle Peninsula Interceptor Systems Pump Station Control and SCADA Upgrades and Enhancements $ 2,520 $ 1,149 $ 1,149 $ 222 $ -
MP012000 King William Treatment Plant Improvements Phase I $ 1,615 $ 1,612 $ 3 $ - $ - MP013000 Small Communities Collection System Rehabilitation Phase I $ 14 $ 14 $ - $ - $ - MP013020 Small Communities Collection System Rehabilitation Phase III $ 1,002 $ 995 $ 7 $ - $ - MP013300 King William Treatment Plant Improvements Phase II $ 13,844 $ 518 $ 6,650 $ 6,650 $ 26 MP013500 Middlesex Collection System-Cooks Corner $ 1,757 $ 1,754 $ 3 $ - $ - MP013600 Middlesex Interceptor Force Main Phase I-Cooks Corner $ 240 $ 239 $ 0 $ - $ - MP013710 Middlesex Interceptor System Program Phase II-Saluda Pump Station $ 1,756 $ 213 $ 839 $ 703 $ 2 MP013720 Middlesex Interceptor System Program Phase II-Hartfield Pump Station $ 4,272 $ 688 $ 1,952 $ 1,630 $ 2 MP013730 Middlesex Interceptor System Program Phase II-Transmission Force Main $ 26,922 $ 5,041 $ 10,938 $ 10,938 $ 5 MP013800 Middlesex Interceptor System Program Phase III $ 3,448 $ 20 $ 330 $ 2,319 $ 780 MP013900 Urbanna Wastewater Treatment Plant Reliability Improvements $ 257 $ 257 $ - $ - $ - MP014100 Middlesex Collection System-Christ’s Church Service Area $ 1,043 $ 18 $ 18 $ 18 $ 18 MP014200 Middlesex Collection System-Topping Service Area Phase I $ 3,420 $ 330 $ 1,160 $ 1,540 $ 390 MP014300 Middlesex Collection System-Locust Hill Service Area $ 3,593 $ 80 $ 80 $ 80 $ 80 MP014410 Middlesex County Hartfield Collection System Phase I $ 551 $ 99 $ 214 $ 214 $ 22 MP014500 Middlesex Collection System-Saluda Service Area $ 3,015 $ 107 $ 107 $ 526 $ 1,133 MP014510 Middlesex County Saluda Collection System Phase I $ 139 $ 32 $ 51 $ 51 $ 5 MP014600 Middlesex Collection System-Deltaville Service Area $ 25,963 $ 448 $ 3,320 $ 4,204 $ 4,259 MP014700 Small Communities Rehabilitation Phase IV $ 1,436 $ 1,432 $ 4 $ 1 $ - MP014800 Small Communities Rehabilitation Phase V $ 419 $ 53 $ 366 $ - $ -
MP014900 Middle Peninsula Operations Center Locker Room and Administrative Facilities $ 1,460 $ 1,455 $ 5 $ - $ - MP015000 Sharon Road Gravity Sewer Improvements $ 1,020 $ 1,016 $ 4 $ - $ - MP015100 West Point Pump Station 4 (Thompson Avenue) Rehabilitation $ 706 $ 313 $ 391 $ 3 $ - MP015300 King William Central Crossing Pump Station Rehabilitation $ 975 $ 107 $ 760 $ 108 $ - MP015400 Middlesex Interceptor System Program Phase IV $ 2,527 $ - $ - $ - $ 115 MP015500 Small Communities Rehabilitation Phase VI $ 1,210 $ 141 $ 1,069 $ - $ - MP015600 West Point Treatment Plant Final Effluent Pump Station Improvements $ 665 $ 73 $ 517 $ 75 $ - MP015700 West Point Treatment Plant Secondary Clarifier Improvements $ 644 $ 71 $ 500 $ 73 $ -
Subtotal $ 106,433 $ 18,276 $ 30,437 $ 29,355 $ 6,836
NP010620 Suffolk Pump Station Replacement $ 22,151 $ 7,860 $ 8,575 $ 5,716 $ - NP012400 Western Branch Sewer System Gravity Improvements $ 2,895 $ 167 $ 167 $ 2,561 $ - NP012600 Deep Creek Interceptor Force Main Replacement $ 50 $ 50 $ - $ - $ - NP013000 Nansemond Treatment Plant Motor Control Center Replacements $ 1,513 $ 825 $ 688 $ - $ - NP013400 Deep Creek Interceptor Force Main Risk Mitigation Project $ 591 $ 542 $ 49 $ - $ - NP013700 Nansemond Treatment Plant Struvite Recovery Facility Improvements $ 15,016 $ 9,480 $ 5,535 $ - $ -
NP013820 Nansemond Treatment Plant Advanced Nutrient Reduction Improvements Ph II $ 214,610 $ 3,716 $ 23,471 $ 85,588 $ 84,401 NP013901 Nansemond Service Area I-I Reduction Phase II (CHES) $ 15,849 $ - $ - $ - $ 262 NP013902 Nansemond Service Area I-I Reduction Phase III (CHES) $ 15,773 $ - $ - $ - $ - NP014000 Wilroy Pressure Reducing Station and Offline Storage (NP-HPP-03) $ 27,441 $ 1,173 $ 1,514 $ 5,723 $ 10,875 NP014100 Nansemond Treatment Plant Shoreline Improvements Phase II $ 3,000 $ - $ - $ - $ - NP014400 Nansemond Treatment Plant Influent Screen Replacement $ 559 $ 553 $ 6 $ - $ - NP014500 Nansemond Treatment Plant Regional Residuals Facility Upgrade $ 1,545 $ 1,545 $ - $ - $ - NP014600 West Road Interceptor Force Main Extension $ 7,103 $ 218 $ 940 $ 3,397 $ 2,548 NP014700 Nansemond Treatment Plant Digester Capacity Upgrade $ 15,027 $ 9,390 $ 5,633 $ 4 $ - NP014800 High Priority Projects Round 2 Project 8 $ 28,150 $ - $ - $ - $ -
Subtotal $ 343,124 $ 35,520 $ 46,578 $ 102,990 $ 98,085 Note: SCADA - Supervisory Control and Data Acquisition
NP - Nansemond Treatment Plant CHES - City of Chesapeake
James River
Middle Peninsula
Nansemond
Eastern Shore
38

FY-2022 to FY-2031Cash Flow Projections (in thousands)
CIP No Project Name
ES010100 Eastern Shore Infrastructure Improvements - Transmission Force Main Phase I
ES010200 Eastern Shore Infrastructure Improvements - Transmission Force Main Phase IIES010300 Onancock Treatment Plant Administration Building Upgrade
Subtotal
JR011730 Jefferson Avenue Interceptor Force Main Replacement Phase III
JR013000Morrison Pump Station Discharge Force Main Replacement & Capacity Enhancements
JR013200 Lucas Creek-Woodhaven Interceptor Force Main Replacement Phase IIJR013400 James River Treatment Plant Advanced Nutrient Reduction ImprovementsJR013500 Lucas Creek Pump Station Replacement
JR013600 James River Treatment Plant Primary Treatment and Automation ImprovementsJR013700 High Priority Projects Round 2 Project 6
Subtotal
MP011700Middle Peninsula Interceptor Systems Pump Station Control and SCADA Upgrades and Enhancements
MP012000 King William Treatment Plant Improvements Phase IMP013000 Small Communities Collection System Rehabilitation Phase IMP013020 Small Communities Collection System Rehabilitation Phase IIIMP013300 King William Treatment Plant Improvements Phase IIMP013500 Middlesex Collection System-Cooks CornerMP013600 Middlesex Interceptor Force Main Phase I-Cooks CornerMP013710 Middlesex Interceptor System Program Phase II-Saluda Pump StationMP013720 Middlesex Interceptor System Program Phase II-Hartfield Pump StationMP013730 Middlesex Interceptor System Program Phase II-Transmission Force MainMP013800 Middlesex Interceptor System Program Phase IIIMP013900 Urbanna Wastewater Treatment Plant Reliability ImprovementsMP014100 Middlesex Collection System-Christ’s Church Service AreaMP014200 Middlesex Collection System-Topping Service Area Phase IMP014300 Middlesex Collection System-Locust Hill Service AreaMP014410 Middlesex County Hartfield Collection System Phase IMP014500 Middlesex Collection System-Saluda Service AreaMP014510 Middlesex County Saluda Collection System Phase IMP014600 Middlesex Collection System-Deltaville Service AreaMP014700 Small Communities Rehabilitation Phase IVMP014800 Small Communities Rehabilitation Phase V
MP014900 Middle Peninsula Operations Center Locker Room and Administrative FacilitiesMP015000 Sharon Road Gravity Sewer ImprovementsMP015100 West Point Pump Station 4 (Thompson Avenue) RehabilitationMP015300 King William Central Crossing Pump Station RehabilitationMP015400 Middlesex Interceptor System Program Phase IVMP015500 Small Communities Rehabilitation Phase VIMP015600 West Point Treatment Plant Final Effluent Pump Station ImprovementsMP015700 West Point Treatment Plant Secondary Clarifier Improvements
Subtotal
NP010620 Suffolk Pump Station ReplacementNP012400 Western Branch Sewer System Gravity ImprovementsNP012600 Deep Creek Interceptor Force Main ReplacementNP013000 Nansemond Treatment Plant Motor Control Center ReplacementsNP013400 Deep Creek Interceptor Force Main Risk Mitigation ProjectNP013700 Nansemond Treatment Plant Struvite Recovery Facility Improvements
NP013820 Nansemond Treatment Plant Advanced Nutrient Reduction Improvements Ph IINP013901 Nansemond Service Area I-I Reduction Phase II (CHES)NP013902 Nansemond Service Area I-I Reduction Phase III (CHES)NP014000 Wilroy Pressure Reducing Station and Offline Storage (NP-HPP-03)NP014100 Nansemond Treatment Plant Shoreline Improvements Phase IINP014400 Nansemond Treatment Plant Influent Screen ReplacementNP014500 Nansemond Treatment Plant Regional Residuals Facility UpgradeNP014600 West Road Interceptor Force Main ExtensionNP014700 Nansemond Treatment Plant Digester Capacity UpgradeNP014800 High Priority Projects Round 2 Project 8
SubtotalNote: SCADA - Supervisory Control and Data Acquisition
NP - Nansemond Treatment Plant CHES - City of Chesapeake
James River
Middle Peninsula
Nansemond
Eastern Shore FY-2026 FY-2027 FY-2028 FY-2029 FY-2030 FY-2031
$ - $ - $ - $ - $ - $ -
$ 545 $ 5,455 $ 300 $ - $ - $ - $ - $ - $ - $ - $ - $ - $ 545 $ 5,455 $ 300 $ - $ - $ -
$ - $ - $ - $ - $ - $ -
$ - $ - $ - $ - $ - $ - $ - $ - $ - $ - $ - $ - $ 13,475 $ - $ - $ - $ - $ - $ - $ - $ - $ - $ - $ -
$ - $ - $ - $ - $ - $ - $ - $ - $ - $ - $ - $ - $ 13,475 $ - $ - $ - $ - $ -
$ - $ - $ - $ - $ - $ - $ - $ - $ - $ - $ - $ - $ - $ - $ - $ - $ - $ - $ - $ - $ - $ - $ - $ - $ - $ - $ - $ - $ - $ - $ - $ - $ - $ - $ - $ - $ - $ - $ - $ - $ - $ - $ - $ - $ - $ - $ - $ - $ - $ - $ - $ - $ - $ - $ - $ - $ - $ - $ - $ - $ - $ - $ - $ - $ - $ - $ - $ - $ - $ - $ - $ - $ 18 $ 207 $ 467 $ 277 $ - $ - $ - $ - $ - $ - $ - $ - $ 1,231 $ 1,622 $ 420 $ - $ - $ - $ 0 $ - $ - $ - $ - $ - $ 1,133 $ 10 $ - $ - $ - $ - $ - $ - $ - $ - $ - $ - $ 4,204 $ 4,204 $ 3,757 $ 1,565 $ - $ - $ - $ - $ - $ - $ - $ - $ - $ - $ - $ - $ - $ -
$ - $ - $ - $ - $ - $ - $ - $ - $ - $ - $ - $ - $ - $ - $ - $ - $ - $ - $ - $ - $ - $ - $ - $ - $ 718 $ 1,693 $ - $ - $ - $ - $ - $ - $ - $ - $ - $ - $ - $ - $ - $ - $ - $ - $ - $ - $ - $ - $ - $ - $ 7,305 $ 7,736 $ 4,644 $ 1,843 $ - $ -
$ - $ - $ - $ - $ - $ - $ - $ - $ - $ - $ - $ - $ - $ - $ - $ - $ - $ - $ - $ - $ - $ - $ - $ - $ - $ - $ - $ - $ - $ - $ - $ - $ - $ - $ - $ -
$ 17,434 $ - $ - $ - $ - $ - $ 1,601 $ 2,961 $ 8,255 $ 2,772 $ - $ - $ 1,376 $ 1,570 $ 4,520 $ 4,520 $ 3,780 $ 7 $ 8,156 $ - $ - $ - $ - $ - $ - $ 209 $ 632 $ 2,159 $ - $ - $ - $ - $ - $ - $ - $ - $ - $ - $ - $ - $ - $ - $ - $ - $ - $ - $ - $ - $ - $ - $ - $ - $ - $ - $ - $ - $ - $ - $ - $ - $ 28,567 $ 4,739 $ 13,407 $ 9,451 $ 3,780 $ 7
39

FY-2022 to FY-2031Cash Flow Projections (in thousands)
CIP No Project Name Total FY-2022
to FY-2031 FY-2022 FY-2023 FY-2024 FY-2025
SU010200 Surry Hydraulic Improvements and Interceptor Force Main $ 21,349 $ 14,232 $ 7,116 $ - $ - SU010300 Surry Water and Sewer Infrastructure Improvements – Phase 1 $ 1,426 $ 1,426 $ - $ - $ - SU010400 Surry Force Main and Pump Station-Dominion Power Extension $ 6,667 $ 300 $ 450 $ 2,343 $ 3,541
Subtotal $ 29,442 $ 15,959 $ 7,566 $ 2,343 $ 3,541
VP010920Norview Estabrook Division I 18-Inch Force Main Replacement Phase II, Section 2 $ 3,043 $ 165 $ 974 $ 1,428 $ 476
VP014010 Ferebee Avenue Pump Station Replacement $ 7,565 $ - $ 2,775 $ 4,106 $ 684
VP014020Sanitary Sewer Project 1950 12 Inch Force Main and 24 and 18 Inch Gravity Replacement $ 10,250 $ 2,317 $ 4,533 $ 3,400 $ -
VP014700 Ingleside Road Pump Station Replacement $ 2,969 $ 2,969 $ - $ - $ - VP014800 Lee Avenue-Wesley Street Horizontal Valve Replacement $ 3,267 $ 381 $ 2,886 $ - $ - VP015320 Larchmont Area Sanitary Sewer Improvements $ 34,924 $ 1,463 $ 8,923 $ 10,410 $ 8,922 VP015400 Lafayette Norview-Estabrook Pump Station Replacements $ 18,342 $ 3,963 $ 7,843 $ 6,536 $ - VP016500 Norview-Estabrook Division I 12-Inch Force Main Replacement $ 2,720 $ 148 $ 870 $ 1,277 $ 426 VP016700 Norview-Estabrook Division I 18-Inch Force Main Replacement Phase III $ 3,667 $ 201 $ 1,172 $ 1,721 $ 574 VP017110 Central Norfolk Area Gravity Sewer Improvements Phase I $ 15 $ 15 $ - $ - $ - VP017120 Central Norfolk Area Gravity Sewer Improvements Phase II $ 6,325 $ 630 $ 2,439 $ 3,193 $ 63 VP018000 Park Avenue Pump Station Replacement $ 10,380 $ 3,490 $ 5,168 $ 1,723 $ - VP018200 Effingham Interceptor Vault Removal $ 2,072 $ 1,624 $ 448 $ - $ - VP018301 VIP Service Area I-I Reduction Phase I (PORTS) $ 11,564 $ 1,546 $ 5,713 $ 4,305 $ - VP018302 Portsmouth Pump Station Upgrades (VIP-HPP-04B) $ 10,527 $ - $ - $ - $ - VP018303 VIP Service Area I-I Reduction Phase III (PORTS) $ 9,015 $ 925 $ 859 $ 2,622 $ 2,622 VP018304 Camden Avenue Pump Station Upgrades (VIP-HPP-04D) $ 5,478 $ - $ - $ - $ - VP018305 Camden Avenue Gravity Improvements (VIP-HPP-04E) $ 2,621 $ - $ - $ - $ - VP018400 State Street Pressure Reducing Station and Offline Storage (VIP-HPP-05) $ 18,711 $ 161 $ 161 $ 161 $ 161 VP018500 Elizabeth River Crossing Reliability Improvements $ 1,661 $ 1,511 $ 150 $ - $ - VP018800 Virginia Initiative Plant Administration Building Renovation $ 2,462 $ 1,671 $ 777 $ 13 $ - VP018900 Norchester Pump Station Screening Improvements $ 469 $ 89 $ 310 $ 70 $ - VP019000 Colley Ave Pump Station Pump Replacement $ 640 $ 64 $ 576 $ - $ - VP019100 Virginia Initiative Plant Incinerator Burner Replacement $ 1,800 $ 600 $ 900 $ 300 $ - VP019200 Virginia Initiative Plant Motor Control Center Replacements $ 1,875 $ 604 $ 1,271 $ - $ - VP019300 High Priority Projects Round 2 Project 4 $ 12,380 $ - $ - $ - $ - VP019400 High Priority Projects Round 2 Project 5 $ 14,940 $ - $ - $ - $ -
Subtotal $ 172,362 $ 24,536 $ 48,749 $ 41,265 $ 13,928
WB012400 Williamsburg Treatment Plant Generator and Switchgear Replacement $ 335 $ 333 $ 2 $ - $ - WB012500 Lodge Road Pump Station Upgrades $ 1,489 $ 102 $ 532 $ 855 $ - WB012600 Kingsmill Pump Station Piping Replacement and Wet Well Rehabilitation $ 1,146 $ 1,146 $ - $ - $ - WB012900 Williamsburg Treatment Plant Administration Building Renovation $ 2,406 $ 2,212 $ 193 $ 1 $ - WB013000 Williamsburg Treatment Plant Intermediate Clarifier Wet Weather System $ 1,933 $ 381 $ 1,553 $ - $ - WB013100 Williamsburg Treatment Plant Outfall Flow Control System Repairs $ 1,657 $ 125 $ 1,532 $ - $ - WB013200 High Priority Projects Round 2 Project 1 $ 53,410 $ - $ - $ - $ -
Subtotal $ 12,706 $ 4,299 $ 3,812 $ 856 $ -
YR010300Foxridge Sanitary Sewer System Sections 1, 4 & 5 Gravity and Woodland Road Fox Hill Road Gravity Sewer Rehabilitation $ 3,242 $ 236 $ 1,559 $ 1,447 $ -
YR010520 Magruder Mercury Interceptor Force Main Replacement - Section B $ 4,261 $ 322 $ 1,438 $ 2,496 $ 5 YR010530 Magruder Mercury Interceptor Force Main Replacement - Section C $ 5,807 $ 33 $ 60 $ 529 $ 1,663 YR010900 Tabb Pressure Reducing Station and Offline Storage Facility $ 17,004 $ 2,711 $ 10,716 $ 3,577 $ - YR011900 Bethel-Poquoson Force Main Part III Replacement $ 405 $ 97 $ 194 $ 113 $ -
YR013710York River Treatment Plant Advanced Nutrient Reduction Improvements Phase I $ 200 $ 200 $ - $ - $ -
YR013900 York River System Isolation Valve Installation and Replacement $ 4,452 $ 4,452 $ - $ - $ - YR014000 York River Treatment Plant Administration Building Renovation $ 1,912 $ 1,364 $ 547 $ 1 $ - YR014100 Coliseum Pressure Reducing Station Enhanced Storage $ 8,031 $ - $ - $ 559 $ 5,271 YR014200 LaSalle Avenue Boat Harbor to York River Interconnect Force Main $ 6,948 $ 41 $ - $ 557 $ 3,461 YR014300 Bethel-Poquoson Force Main Phase II (Wythe Creek Road) Replacement $ 2,493 $ 2,488 $ 5 $ - $ - YR014500 York River Treatment Plant Headworks Motor Control Center Replacement $ 184 $ 184 $ - $ - $ -
YR014600Bethel-Poquoson Force Main Part IV Replacement-Wythe Creek Exposed Crossing $ 845 $ 35 $ 366 $ 444 $ -
Subtotal $ 55,784 $ 12,164 $ 14,886 $ 9,723 $ 10,399 Note: PORTS - City of Portsmouth
VIP - Virginia Initiative Plant HPP - High Priority Project
Surry
Williamsburg
York River
Virginia Initiative Plant
40

FY-2022 to FY-2031Cash Flow Projections (in thousands)
CIP No Project Name
SU010200 Surry Hydraulic Improvements and Interceptor Force MainSU010300 Surry Water and Sewer Infrastructure Improvements – Phase 1SU010400 Surry Force Main and Pump Station-Dominion Power Extension
Subtotal
VP010920Norview Estabrook Division I 18-Inch Force Main Replacement Phase II, Section 2
VP014010 Ferebee Avenue Pump Station Replacement
VP014020Sanitary Sewer Project 1950 12 Inch Force Main and 24 and 18 Inch Gravity Replacement
VP014700 Ingleside Road Pump Station ReplacementVP014800 Lee Avenue-Wesley Street Horizontal Valve ReplacementVP015320 Larchmont Area Sanitary Sewer ImprovementsVP015400 Lafayette Norview-Estabrook Pump Station ReplacementsVP016500 Norview-Estabrook Division I 12-Inch Force Main ReplacementVP016700 Norview-Estabrook Division I 18-Inch Force Main Replacement Phase IIIVP017110 Central Norfolk Area Gravity Sewer Improvements Phase IVP017120 Central Norfolk Area Gravity Sewer Improvements Phase IIVP018000 Park Avenue Pump Station ReplacementVP018200 Effingham Interceptor Vault RemovalVP018301 VIP Service Area I-I Reduction Phase I (PORTS)VP018302 Portsmouth Pump Station Upgrades (VIP-HPP-04B)VP018303 VIP Service Area I-I Reduction Phase III (PORTS)VP018304 Camden Avenue Pump Station Upgrades (VIP-HPP-04D)VP018305 Camden Avenue Gravity Improvements (VIP-HPP-04E)VP018400 State Street Pressure Reducing Station and Offline Storage (VIP-HPP-05)VP018500 Elizabeth River Crossing Reliability ImprovementsVP018800 Virginia Initiative Plant Administration Building RenovationVP018900 Norchester Pump Station Screening ImprovementsVP019000 Colley Ave Pump Station Pump ReplacementVP019100 Virginia Initiative Plant Incinerator Burner ReplacementVP019200 Virginia Initiative Plant Motor Control Center ReplacementsVP019300 High Priority Projects Round 2 Project 4VP019400 High Priority Projects Round 2 Project 5
Subtotal
WB012400 Williamsburg Treatment Plant Generator and Switchgear ReplacementWB012500 Lodge Road Pump Station UpgradesWB012600 Kingsmill Pump Station Piping Replacement and Wet Well RehabilitationWB012900 Williamsburg Treatment Plant Administration Building RenovationWB013000 Williamsburg Treatment Plant Intermediate Clarifier Wet Weather SystemWB013100 Williamsburg Treatment Plant Outfall Flow Control System RepairsWB013200 High Priority Projects Round 2 Project 1
Subtotal
YR010300Foxridge Sanitary Sewer System Sections 1, 4 & 5 Gravity and Woodland Road Fox Hill Road Gravity Sewer Rehabilitation
YR010520 Magruder Mercury Interceptor Force Main Replacement - Section BYR010530 Magruder Mercury Interceptor Force Main Replacement - Section CYR010900 Tabb Pressure Reducing Station and Offline Storage FacilityYR011900 Bethel-Poquoson Force Main Part III Replacement
YR013710York River Treatment Plant Advanced Nutrient Reduction Improvements Phase I
YR013900 York River System Isolation Valve Installation and ReplacementYR014000 York River Treatment Plant Administration Building RenovationYR014100 Coliseum Pressure Reducing Station Enhanced StorageYR014200 LaSalle Avenue Boat Harbor to York River Interconnect Force MainYR014300 Bethel-Poquoson Force Main Phase II (Wythe Creek Road) ReplacementYR014500 York River Treatment Plant Headworks Motor Control Center Replacement
YR014600Bethel-Poquoson Force Main Part IV Replacement-Wythe Creek Exposed Crossing
SubtotalNote: PORTS - City of Portsmouth
VIP - Virginia Initiative Plant HPP - High Priority Project
Surry
Williamsburg
York River
Virginia Initiative Plant
FY-2026 FY-2027 FY-2028 FY-2029 FY-2030 FY-2031
$ - $ - $ - $ - $ - $ - $ - $ - $ - $ - $ - $ - $ 33 $ - $ - $ - $ - $ - $ 33 $ - $ - $ - $ - $ -
$ - $ - $ - $ - $ - $ - $ - $ - $ - $ - $ - $ -
$ - $ - $ - $ - $ - $ - $ - $ - $ - $ - $ - $ - $ - $ - $ - $ - $ - $ - $ 5,205 $ - $ - $ - $ - $ - $ - $ - $ - $ - $ - $ - $ - $ - $ - $ - $ - $ - $ - $ - $ - $ - $ - $ - $ - $ - $ - $ - $ - $ - $ - $ - $ - $ - $ - $ - $ - $ - $ - $ - $ - $ - $ - $ - $ - $ - $ - $ - $ - $ - $ - $ - $ - $ - $ 289 $ 762 $ 6,178 $ 3,298 $ - $ - $ 1,986 $ - $ - $ - $ - $ - $ 211 $ 254 $ 2,095 $ 2,918 $ - $ - $ 45 $ 242 $ 1,677 $ 656 $ - $ - $ 161 $ 569 $ 652 $ 4,149 $ 9,383 $ 3,153 $ - $ - $ - $ - $ - $ - $ - $ - $ - $ - $ - $ - $ - $ - $ - $ - $ - $ - $ - $ - $ - $ - $ - $ - $ - $ - $ - $ - $ - $ - $ - $ - $ - $ - $ - $ - $ - $ - $ - $ - $ - $ - $ - $ - $ - $ - $ - $ - $ 7,897 $ 1,826 $ 10,603 $ 11,022 $ 9,383 $ 3,153
$ - $ - $ - $ - $ - $ - $ - $ - $ - $ - $ - $ - $ - $ - $ - $ - $ - $ - $ - $ - $ - $ - $ - $ - $ - $ - $ - $ - $ - $ - $ - $ - $ - $ - $ - $ - $ - $ - $ - $ - $ - $ 3,739 $ - $ - $ - $ - $ - $ 3,739
$ - $ - $ - $ - $ - $ - $ - $ - $ - $ - $ - $ - $ 2,486 $ 1,036 $ - $ - $ - $ - $ - $ - $ - $ - $ - $ - $ - $ - $ - $ - $ - $ -
$ - $ - $ - $ - $ - $ - $ - $ - $ - $ - $ - $ - $ - $ - $ - $ - $ - $ - $ 2,200 $ 1 $ - $ - $ - $ - $ 2,889 $ - $ - $ - $ - $ - $ - $ - $ - $ - $ - $ - $ - $ - $ - $ - $ - $ -
$ - $ - $ - $ - $ - $ - $ 7,575 $ 1,037 $ - $ - $ - $ -
41

FY-2022 to FY-2031Cash Flow Projections (in thousands)
CIP No Project Name Total FY-2022
to FY-2031 FY-2022 FY-2023 FY-2024 FY-2025
GN010730 Horizontal Valve Replacement Phase III $ 1,039 $ 113 $ 337 $ 337 $ 253 GN013300 Treatment Plant Grease Handling Facilities $ 7,059 $ 5,640 $ 1,419 $ - $ - GN014900 North Shore Gravity Sewer Improvements Phase I $ 4,208 $ 1,890 $ 2,311 $ 7 $ - GN015000 South Shore Gravity Sewer Improvements Phase I $ 743 $ 70 $ 252 $ 422 $ - GN015300 Interceptor System Valve Improvements Phase I $ 2,566 $ 141 $ 902 $ 1,306 $ 218 GN015400 South Shore Aerial Crossing Improvements $ 260 $ 11 $ 127 $ 121 $ - GN015800 North Shore Automated Diversion Facilities $ 1,993 $ 748 $ 1,246 $ - $ - GN016210 SWIFT Nansemond Full Scale MAR Well Installation $ 1,513 $ 1,513 $ - $ - $ - GN016220 SWIFT Research Center Full Scale MAR Well Integration $ 782 $ 782 $ - $ - $ - GN016310 Integrated Planning of SWIFT $ 4,444 $ 904 $ 902 $ 913 $ 904 GN016311 Outfall Dispersion Modeling for Full Scale SWIFT $ 596 $ 177 $ 175 $ 176 $ 68 GN016320 Program Management of SWIFT Full Scale Implementation $ 67,805 $ 5,705 $ 5,448 $ 5,688 $ 5,688 GN016342 Williamsburg SWIFT Land Acquisition $ 1,497 $ - $ - $ - $ - GN016343 James River SWIFT Land Acquisition $ 9,561 $ 9,561 $ - $ - $ - GN016344 James River Land Improvements $ 4,675 $ 288 $ 758 $ 1,308 $ 1,314 GN016345 Boat Harbor Pump Station Land Acquisition $ 3,000 $ 3,000 $ - $ - $ - GN016346 Boat Harbor Transmission Force Main Land Acquisition $ 2,500 $ 2,500 $ - $ - $ - GN016350 Williamsburg SWIFT Facility $ 130,508 $ - $ - $ - $ - GN016351 Williamsburg Recharge Wells $ 24,444 $ - $ - $ - $ - GN016360 James River SWIFT Facility $ 251,225 $ 20,940 $ 55,964 $ 88,623 $ 69,586 GN016361 James River Recharge Wells $ 27,914 $ 2,106 $ 7,503 $ 9,445 $ 7,260 GN016370 York River SWIFT Facility $ 175,556 $ - $ - $ - $ - GN016371 York River Recharge Wells $ 27,500 $ - $ - $ - $ - GN016380 Nansemond SWIFT Facility $ 307,013 $ 1,398 $ 3,788 $ 3,499 $ 14,983 GN016381 Nansemond Recharge Wells $ 48,888 $ - $ - $ 1,412 $ 801 GN016390 VIP SWIFT Facility $ 334,132 $ - $ - $ 5,507 $ 342 GN016391 VIP Recharge Wells $ 73,332 $ 170 $ 1,942 $ 684 $ 609 GN016392 VIP SWIFT Site Work $ 38,894 $ 692 $ 327 $ 731 $ 21,718 GN016700 Treatment Plant Solids Handling Replacement Phase II $ 5,479 $ 1,409 $ 2,714 $ 1,357 $ - GN017100 Climate Change Planning $ 892 $ 892 $ - $ - $ -
GN017200Interceptor Systems Pump Station Control and SCADA Upgrades and Enhancements Phase II $ 5,581 $ 3,312 $ 2,235 $ 34 $ -
GN017300 Treatment Plant Dewatering Replacement Program $ 35,000 $ - $ - $ 3,889 $ 3,889 GN017400 Treatment Plant Dewatering Replacement Phase III $ 3,563 $ 748 $ 2,346 $ 469 $ - GN017500 Fleet Management Program $ 11,647 $ - $ 1,500 $ 1,500 $ 1,100 GN017900 Solids System Improvements for Army Base MHI Offline $ 3,549 $ 989 $ 1,920 $ 640 $ - GN018000 Inflow Reduction Program - Phase I $ 1,544 $ 1,544 $ - $ - $ - GN018100 Fleet Management (FY22) $ 3,600 $ 3,600 $ - $ - $ - GN018200 Water Quality Department Instrumentation Equipment (FY22) $ 463 $ 463 $ - $ - $ - GN018300 High Risk Clamp Replacement Program-Phase 1 $ 395 $ 395 $ - $ - $ -
Subtotal $ 1,248,254 $ 71,701 $ 94,116 $ 128,068 $ 128,733
IP010400 Interceptor System Rehabilitation and Replacement $ 217,014 $ - $ - $ - $ 2,239 Subtotal $ 217,014 $ - $ - $ - $ 2,239
$ 2,877,675 $ 290,000 $ 401,961 $ 509,524 $ 400,000 Note: SWIFT - Sustainable Water Initiative for Tomorrow
MAR - Managed Aquifer Recharge VIP - Virginia Initiative Plant SCADA - Supervisory Control and Data Acquisition MHI - Multiple Hearth Incinerator
CIP TOTALS
Future Improvements
General
42

FY-2022 to FY-2031Cash Flow Projections (in thousands)
CIP No Project Name
GN010730 Horizontal Valve Replacement Phase IIIGN013300 Treatment Plant Grease Handling FacilitiesGN014900 North Shore Gravity Sewer Improvements Phase IGN015000 South Shore Gravity Sewer Improvements Phase IGN015300 Interceptor System Valve Improvements Phase IGN015400 South Shore Aerial Crossing ImprovementsGN015800 North Shore Automated Diversion FacilitiesGN016210 SWIFT Nansemond Full Scale MAR Well InstallationGN016220 SWIFT Research Center Full Scale MAR Well IntegrationGN016310 Integrated Planning of SWIFTGN016311 Outfall Dispersion Modeling for Full Scale SWIFTGN016320 Program Management of SWIFT Full Scale ImplementationGN016342 Williamsburg SWIFT Land AcquisitionGN016343 James River SWIFT Land AcquisitionGN016344 James River Land ImprovementsGN016345 Boat Harbor Pump Station Land AcquisitionGN016346 Boat Harbor Transmission Force Main Land AcquisitionGN016350 Williamsburg SWIFT FacilityGN016351 Williamsburg Recharge WellsGN016360 James River SWIFT FacilityGN016361 James River Recharge WellsGN016370 York River SWIFT FacilityGN016371 York River Recharge WellsGN016380 Nansemond SWIFT FacilityGN016381 Nansemond Recharge WellsGN016390 VIP SWIFT FacilityGN016391 VIP Recharge WellsGN016392 VIP SWIFT Site WorkGN016700 Treatment Plant Solids Handling Replacement Phase IIGN017100 Climate Change Planning
GN017200Interceptor Systems Pump Station Control and SCADA Upgrades and Enhancements Phase II
GN017300 Treatment Plant Dewatering Replacement ProgramGN017400 Treatment Plant Dewatering Replacement Phase IIIGN017500 Fleet Management ProgramGN017900 Solids System Improvements for Army Base MHI OfflineGN018000 Inflow Reduction Program - Phase IGN018100 Fleet Management (FY22)GN018200 Water Quality Department Instrumentation Equipment (FY22)GN018300 High Risk Clamp Replacement Program-Phase 1
Subtotal
IP010400 Interceptor System Rehabilitation and ReplacementSubtotal
Note: SWIFT - Sustainable Water Initiative for Tomorrow MAR - Managed Aquifer Recharge VIP - Virginia Initiative Plant SCADA - Supervisory Control and Data Acquisition MHI - Multiple Hearth Incinerator
CIP TOTALS
Future Improvements
General FY-2026 FY-2027 FY-2028 FY-2029 FY-2030 FY-2031
$ - $ - $ - $ - $ - $ - $ - $ - $ - $ - $ - $ - $ - $ - $ - $ - $ - $ - $ - $ - $ - $ - $ - $ - $ - $ - $ - $ - $ - $ - $ - $ - $ - $ - $ - $ - $ - $ - $ - $ - $ - $ - $ - $ - $ - $ - $ - $ - $ - $ - $ - $ - $ - $ - $ 627 $ 194 $ - $ - $ - $ - $ - $ - $ - $ - $ - $ - $ 5,688 $ 5,688 $ 5,688 $ 5,688 $ 5,688 $ 5,688 $ 632 $ 865 $ - $ - $ - $ - $ - $ - $ - $ - $ - $ - $ 1,007 $ - $ - $ - $ - $ - $ - $ - $ - $ - $ - $ - $ - $ - $ - $ - $ - $ - $ - $ - $ - $ - $ - $ - $ - $ - $ - $ - $ - $ 1,065 $ 16,112 $ - $ - $ - $ - $ - $ 1,600 $ - $ - $ - $ - $ - $ - $ - $ - $ - $ - $ 1,412 $ - $ - $ - $ - $ - $ - $ 60,565 $ 91,555 $ 86,265 $ 40,669 $ 4,291 $ - $ 1,761 $ 12,129 $ 17,142 $ 13,063 $ 2,580 $ - $ 9,361 $ 33,193 $ 83,586 $ 97,342 $ 78,613 $ 25,514 $ 10,167 $ 10,772 $ 10,801 $ 10,772 $ 10,772 $ 10,772 $ 15,426 $ - $ - $ - $ - $ - $ - $ - $ - $ - $ - $ - $ - $ - $ - $ - $ - $ -
$ - $ - $ - $ - $ - $ - $ 3,889 $ 3,889 $ 3,889 $ 3,889 $ 3,889 $ 3,889 $ - $ - $ - $ - $ - $ - $ 1,887 $ 1,887 $ 1,887 $ 1,886 $ - $ - $ - $ - $ - $ - $ - $ - $ - $ - $ - $ - $ - $ - $ - $ - $ - $ - $ - $ - $ - $ - $ - $ - $ - $ - $ - $ - $ - $ - $ - $ - $ 128,723 $ 160,173 $ 209,258 $ 173,308 $ 105,834 $ 48,340
$ 2,604 $ 774 $ 2,693 $ 3,868 $ 71,479 $ 133,358 $ 2,604 $ 774 $ 2,693 $ 3,868 $ 71,479 $ 133,358 $ 223,810 $ 223,810 $ 247,619 $ 200,000 $ 190,476 $ 190,476
43

This page was intentionally left blank
44
