hr organization assessment survey data...
TRANSCRIPT

HR Organization Assessment Survey Data Review
December 10, 2015Indianapolis, IN

HR2020 Survey Results Agenda
• Welcome / Overall Timeline
• Survey Background and Results Reviewo HR Activity Surveyo HR Customer Survey
• Focus Group Results

HR 2020 Kick-off
DEC ’15OCT ’15SEPT ’15 NOV ’15
HR Current State Data Gathering(Org Structure, Delivery Model, Offerings, Volumes)
HR Customer Feedback Future StateDefinition•Operating Model•Org Design•Job Design•Current resource
placement
JAN-MAR ’16
Data CollectionSurvey & Focus Groups Data Analysis HR Strategy
Workshop 12/10/15•Results Review•Validate HR’s Vision & Mission
HR Function Feedback
Data CollectionSurvey & Focus Groups Data Analysis
Change Management & Communication
Process Re-design
Timeline (4-6 month look ahead)

Background – HR Activity Survey The HR Activity Survey was administered October 29 - November 6:
o Captures the distribution of HR-related activities across the organization
o Includes 279 activities typically performed across 14 major functional areas in HR
o Participants included 304 staff across the University who perform HR activities; a total of 192 individuals responded for a response rate of 63%.
Key Survey Findings included:o In general, employees performing HR activities are engaged in a very wide range of activities, meaning the work is highly
fragmented across all HR functions
o A higher than average percentage of time is spent performing administrative / transactional activities and significantly less time is spent on strategic, higher value-added activities and services
o There is a significant level of staff involvement in a number of administrative activities that should be considered for process optimization, including tasks such as:
– Employee data entry / management, includingnew hire, transfers and termination processing
– Customer service across all HR functions– Recruiting and on-boarding– Employee relations

Background – HR Customer Survey The HR Customer Survey was administered October 29 - November 6:
o The participants included all HR employees and select clients from all divisionso 776 of 1,909 total employees participated, for a response rate of 40.6%o 207 HR associates responded o 569 HR customers responded
The survey included:o 59 HR activities across seven key functions: Communication, Compensation, Benefits, Employee Relations,
HR Technology, Organization Effectiveness, and Talent Managemento Ten behavioral attributes describing the HR function as a wholeo Twelve overall HR function behavior questions
Participants were asked to rate the Importance of and how well HR met their needs for each activity and behavioral attribute
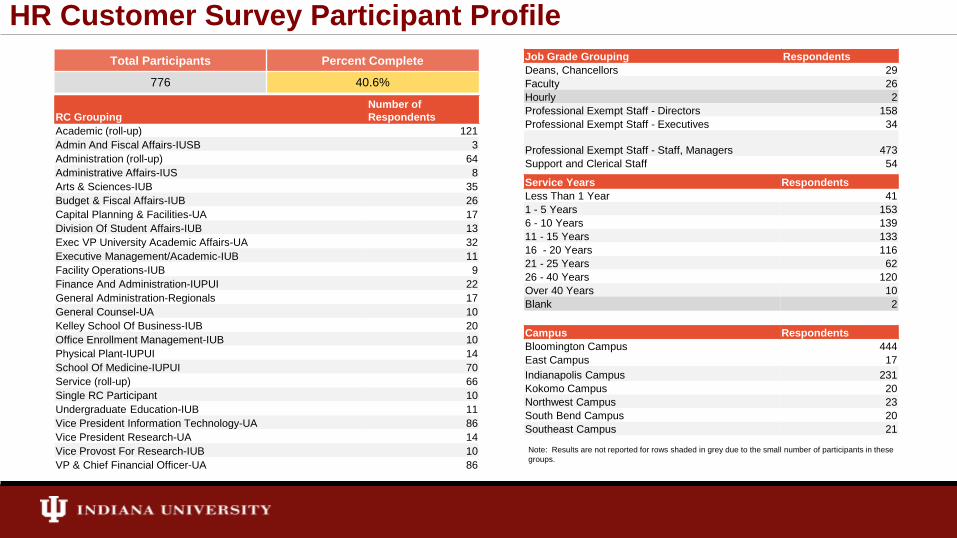
HR Customer Survey Participant ProfileTotal Participants Percent Complete
776 40.6%
Job Grade Grouping RespondentsDeans, Chancellors 29Faculty 26Hourly 2Professional Exempt Staff - Directors 158Professional Exempt Staff - Executives 34
Professional Exempt Staff - Staff, Managers 473Support and Clerical Staff 54
Service Years RespondentsLess Than 1 Year 411 - 5 Years 1536 - 10 Years 13911 - 15 Years 13316 - 20 Years 11621 - 25 Years 6226 - 40 Years 120Over 40 Years 10Blank 2
Campus RespondentsBloomington Campus 444East Campus 17Indianapolis Campus 231Kokomo Campus 20Northwest Campus 23South Bend Campus 20Southeast Campus 21
RC GroupingNumber of Respondents
Academic (roll-up) 121Admin And Fiscal Affairs-IUSB 3Administration (roll-up) 64Administrative Affairs-IUS 8Arts & Sciences-IUB 35Budget & Fiscal Affairs-IUB 26Capital Planning & Facilities-UA 17Division Of Student Affairs-IUB 13Exec VP University Academic Affairs-UA 32Executive Management/Academic-IUB 11Facility Operations-IUB 9Finance And Administration-IUPUI 22General Administration-Regionals 17General Counsel-UA 10Kelley School Of Business-IUB 20Office Enrollment Management-IUB 10Physical Plant-IUPUI 14School Of Medicine-IUPUI 70Service (roll-up) 66Single RC Participant 10Undergraduate Education-IUB 11Vice President Information Technology-UA 86Vice President Research-UA 14Vice Provost For Research-IUB 10VP & Chief Financial Officer-UA 86
Note: Results are not reported for rows shaded in grey due to the small number of participants in these groups.
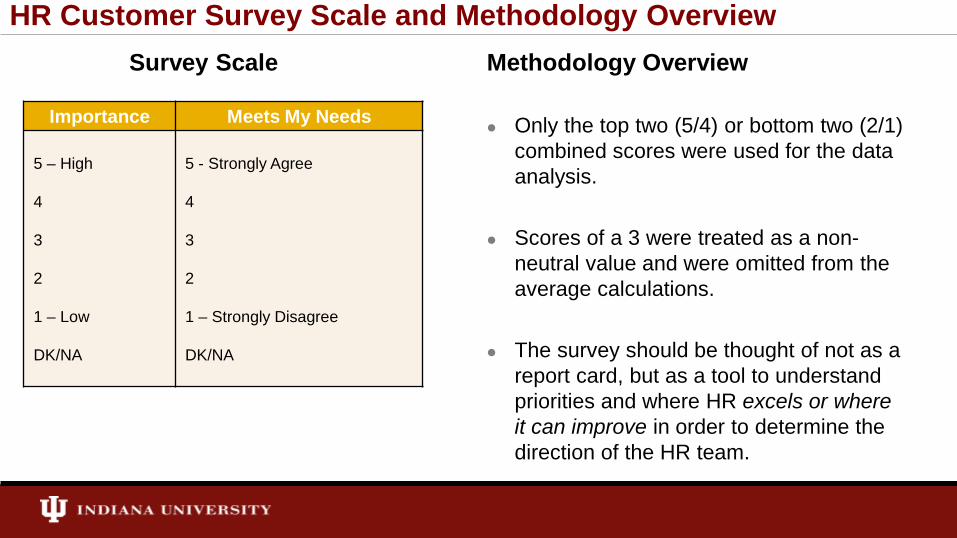
HR Customer Survey Scale and Methodology OverviewSurvey Scale Methodology Overview
Only the top two (5/4) or bottom two (2/1) combined scores were used for the data analysis.
Scores of a 3 were treated as a non-neutral value and were omitted from the average calculations.
The survey should be thought of not as a report card, but as a tool to understand priorities and where HR excels or where it can improve in order to determine the direction of the HR team.
Importance Meets My Needs
5 – High
4
3
2
1 – Low
DK/NA
5 - Strongly Agree
4
3
2
1 – Strongly Disagree
DK/NA
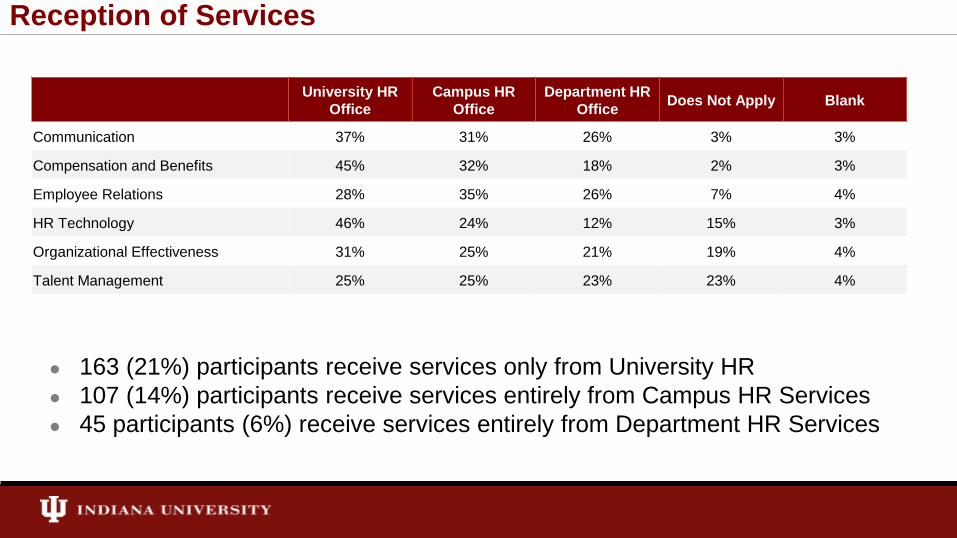
Reception of Services
University HR Office
Campus HR Office
Department HR Office Does Not Apply Blank
Communication 37% 31% 26% 3% 3%
Compensation and Benefits 45% 32% 18% 2% 3%
Employee Relations 28% 35% 26% 7% 4%
HR Technology 46% 24% 12% 15% 3%
Organizational Effectiveness 31% 25% 21% 19% 4%
Talent Management 25% 25% 23% 23% 4%
163 (21%) participants receive services only from University HR 107 (14%) participants receive services entirely from Campus HR Services 45 participants (6%) receive services entirely from Department HR Services
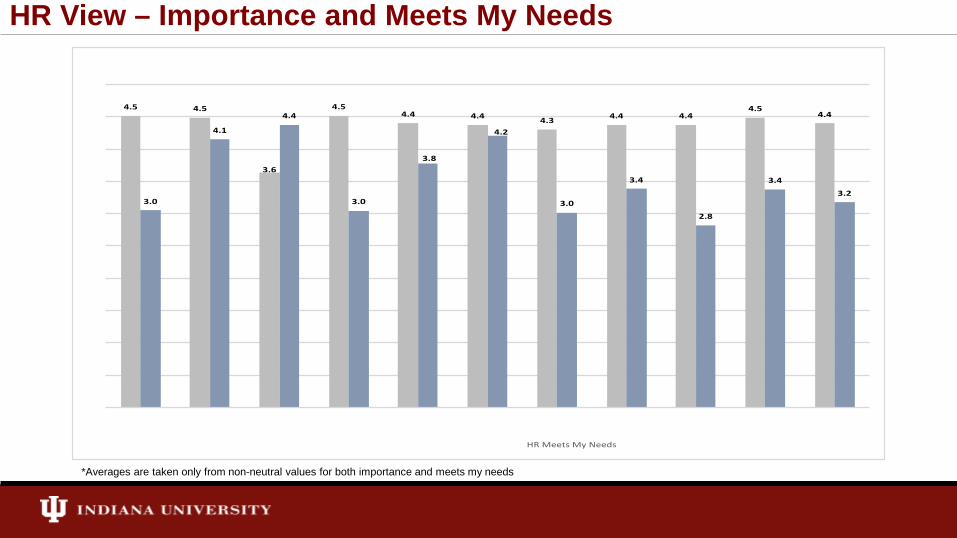
HR View – Importance and Meets My Needs
*Averages are taken only from non-neutral values for both importance and meets my needs

Customer View – Importance and Meets My Needs
*Averages are taken only from non-neutral values for both importance and meets my needs

HR vs. Customer Views – Importance and Meets My Needs
*Averages are taken only from non-neutral values for both importance and meets my needs

HR vs. Customer Views – Importance and Meets My Needs
*Averages are taken only from non-neutral values for both importance and meets my needs
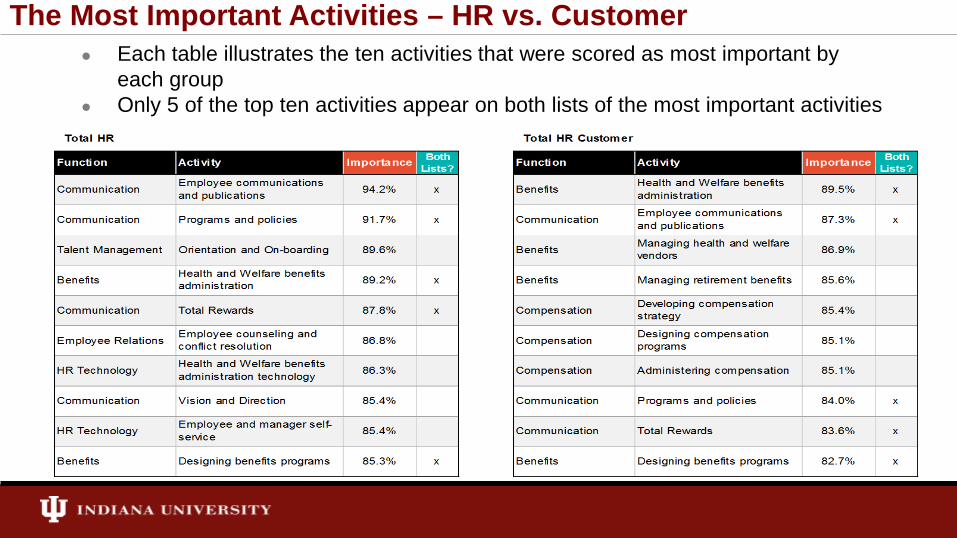
The Most Important Activities – HR vs. Customer Each table illustrates the ten activities that were scored as most important by
each group Only 5 of the top ten activities appear on both lists of the most important activities

Customer View – Importance and Meets My Needs vs. Resources
*Averages are taken only from non-neutral values for both importance and meets my needs

HR Resource Allocation – Fragmentation ExamplesTop 15 Employment & Recruiting Activities sorted by Overall FTE
Activity Identifier # of Staff % Time FTE
New Hire Data Collection / Processing 74 1.7% 3.28
OLA and PeopleAdmin Job Posting Administration 89 1.6% 3.07
Application / Resume Processing 61 1.5% 2.87
Candidate Interviews and Assessment 78 1.0% 1.91
Employment and Staffing Customer Service 70 0.9% 1.74
Position Requirements Development 81 0.9% 1.73
Requisition Processing 51 0.8% 1.58
Orientation 72 0.8% 1.57
Employment and Recruiting / Sourcing 67 0.8% 1.53
Pre-Employment Background Checks 63 0.8% 1.52
Employment and Recruitment Advertising 65 0.7% 1.41
Determining Job Offers 64 0.7% 1.28
Pre-Boarding 68 0.7% 1.27
Employment and Recruiting Program Strategy 46 0.6% 1.15
External Job Posting Administration 57 0.6% 1.14
Top 15 Benefits Activities sorted by Overall FTEActivity Identifier # of Staff % Time FTE
Benefits Customer Service 46 1.6% 3.13
Benefits Counseling 51 1.0% 1.84
Open Enrollment 27 0.6% 1.10
Benefits Administration / Enrollment 24 0.5% 1.05
Leave of Absence Administration 61 0.5% 1.05
Workers Compensation Plan Administration12 0.5% 1.04
Benefits Administration 21 0.5% 1.00
ACA Administration 8 0.5% 0.92
Benefits Data Reconciliation 15 0.4% 0.79
New Hire Benefits Enrollment 25 0.4% 0.76
Benefits Reporting 9 0.3% 0.59
Benefits Communication Development and Delivery
16 0.3% 0.58
Life Event Administration 20 0.3% 0.54
Employee Health & Wellness Customer Service
12 0.3% 0.51
COBRA Administration 5 0.2% 0.47

Talent Management
*Averages are taken only from non-neutral values for both importance and meets my needs
0.050.3
0.2
1.0
0.20.1
0.70.3
1.9
0.3
4.2 4.2 4.14.4 4.3
2.5
3.0 2.9 2.9
2.5
0.0
0.5
1.0
1.5
2.0
2.5
3.0
3.5
4.0
4.5
5.0
Workforce Planning Designing performancemanagement programs
Administering performancemanagement
Poor performer managementand remediation
Succession planning
Customer View - Importance and Meets My Needs vs. HR Resource Allocation
HR % of Time HR FTE Equiv. Average Customer Importance Average Customer Meets My Needs

Compensation
0.4
0.90.8
1.8
4.6 4.5
2.5
3.0
0.0
0.5
1.0
1.5
2.0
2.5
3.0
3.5
4.0
4.5
5.0
Developing compensation strategy/Designing compensation Programs Administering compensation
Customer View - Importance and Meets My Needs vs. HR Resource Allocation
HR % of Time HR FTE Equiv. Average Customer Importance Average Customer Meets My Needs
*Averages are taken only from non-neutral values for both importance and meets my needs

0.50.3 0.2
0.90.6
0.4
4.5 4.5 4.64.4
3.83.5
3.8
2.9
0.0
0.5
1.0
1.5
2.0
2.5
3.0
3.5
4.0
4.5
5.0
Employee communications andpublications
Programs and policies Total Rewards Vision and Direction
Customer View - Importance and Meets My Needs vs. HR Resource Allocation
HR % of Time HR FTE Equiv. Average Customer Importance Average Customer Meets My Needs
*Averages are taken only from non-neutral values for both importance and meets my needs
Communication

0.1 0.2
1.0
0.3 0.4
2.0
4.5 4.6 4.6 4.6
3.5
4.34.1 4.0
0.0
0.5
1.0
1.5
2.0
2.5
3.0
3.5
4.0
4.5
5.0
Developing benefits strategy Health and Welfare benefitsadministration
Managing health and welfare vendors Managing retirement benefits
Customer View - Importance and Meets My Needs vs. HR Resource Allocation
HR % of Time HR FTE Equiv. Average Customer Importance Average Customer Meets My Needs
*Averages are taken only from non-neutral values for both importance and meets my needs
Benefits

0.2
3.1
0.4
6.0
4.34.5
4.2
3.8 3.7
2.6
0.0
1.0
2.0
3.0
4.0
5.0
6.0
7.0
8.0
0.0
0.5
1.0
1.5
2.0
2.5
3.0
3.5
4.0
4.5
5.0
Compliance and reporting Employee counseling and conflictresolution/Supporting progressive disciplinary actions
Turnover analysis
Customer View - Importance Meets My Needs vs. HR Resource Allocation
HR % of Time HR FTE Equiv. Average Customer Importance Average Customer Meets My Needs
*Averages are taken only from non-neutral values for both importance and meets my needs
Employee Relations

1.5
2.82.8
5.4
4.5 4.4
3.0 3.1
0.0
1.0
2.0
3.0
4.0
5.0
6.0
7.0
8.0
0.0
0.5
1.0
1.5
2.0
2.5
3.0
3.5
4.0
4.5
5.0
Orientation and On-boarding Recruiting - internal/external
Customer View - Importance and Meets My Needs vs. HR Resource Allocation
HR % of Time HR FTE Equiv. Average Customer Importance Average Customer Meets My Needs
*Averages are taken only from non-neutral values for both importance and meets my needs
Employment & Recruiting

0.03 0.130.060.24
4.14.3
4.1
2.9
3.63.3
0.0
0.5
1.0
1.5
2.0
2.5
3.0
3.5
4.0
4.5
5.0
HR Measurement Policy development Strategic HR planning
Customer View - Importance and Meets My Needs vs. HR Resource Allocation
HR % of Time HR FTE Equiv. Average Customer Importance Average Customer Meets My Needs
*Averages are taken only from non-neutral values for both importance and meets my needs
HR Strategy & Planning

0.1
0.6
0.1
1.1
4.5 4.5 4.54.3 4.2
4.3 4.2 4.3
3.3
2.9
0.0
0.5
1.0
1.5
2.0
2.5
3.0
3.5
4.0
4.5
5.0
Employee and manager self-service
Retirement benefitsadministration technology
Health and Welfare benefitsadministration technology
Compensation administrationtechnology
Talent management technology
Customer View - Importance and Meets My Needs vs. HR Resource Allocation
HR % of Time HR FTE Equiv. Average Customer Importance Average Customer Meets My Needs
*Averages are taken only from non-neutral values for both importance and meets my needs
HR Technology

1.00.8
2.0
1.5
4.2 4.3 4.2
3.1 3.1 3.0
0.0
0.5
1.0
1.5
2.0
2.5
3.0
3.5
4.0
4.5
5.0
Culture and values Managing organizational change Organizational Design
Customer View - Importance and Meets My Needs vs. HR Resource Allocation
HR % of Time HR FTE Equiv. Average Customer Importance Average Customer Meets My Needs
*Averages are taken only from non-neutral values for both importance and meets my needs
Organizational Development

0.30.7
4.3 4.4
3.3 3.3
0.0
0.5
1.0
1.5
2.0
2.5
3.0
3.5
4.0
4.5
5.0
Designing training and development programs Designing leadership development programs
Customer View - Importance and Meets My Needs vs. HR Resource Allocation
HR % of Time HR FTE Equiv. Average Customer Importance Average Customer Meets My Needs
*Averages are taken only from non-neutral values for both importance and meets my needs
Training

HR’s demonstration of fundamental HR attributes This chart illustrates how HR and HR Customers tend to agree or disagree when
asked about HR’s ability to deliver on select fundamental attributes The areas with the greatest agreement include Integrity followed by Relevance;
the area with the greatest area of disagreement involves Reactiveness
74%
44%
43%
30%
44%
54%
40%
36%
39%
60%
20%
36%
33%
37%
31%
26%
38%
36%
33%
29%
6%
20%
24%
33%
25%
20%
23%
28%
28%
10%
0% 10% 20% 30% 40% 50% 60% 70% 80% 90% 100%
Integrity
Partnership
Responsiveness
Proactiveness
Flexibility
Easy to work with
Continuous improvement
Change assistance
Business acumen
Relevance
Agree/Tend to Agree Neutral Disagree/Tend to DisagreeRepresents the Agree or Tend to Agree Benchmark Norm

Data Cuts by Employee Type
• Executives• Deans and Chancellors• Faculty• Exempt Staff• Non-exempt (Support, Service, and Clerical Staff)

Dashboard – Executives
82%
42%
39%
18%
41%
53%
47%
35%
47%
65%
6%
18%
18%
44%
32%
18%
21%
38%
21%
6%
12%
39%
42%
38%
27%
29%
32%
27%
32%
29%
0% 20% 40% 60% 80% 100%
Integrity
Par tnership
Responsiveness
Proactiveness
Flexibility
Easy to work with
Continuous improvement
Change assistance
Business acumen
Relevance
HR Attributes
Agree/Tend to Agree Neutral Disagree/Tend to Disagree

Dashboard – Deans and Chancellors
86%
43%
45%
28%
48%
52%
45%
43%
48%
69%
10%
43%
35%
38%
24%
31%
38%
39%
28%
21%
3%
14%
21%
35%
28%
17%
17%
18%
24%
10%
0% 20% 40% 60% 80% 100%
Integrity
Par tnership
Responsiveness
Proactiveness
Flexibility
Easy to work with
Continuous improvement
Change assistance
Business acumen
Relevance
HR Attributes
Agree/Tend to Agree Neutral Disagree/Tend to Disagree
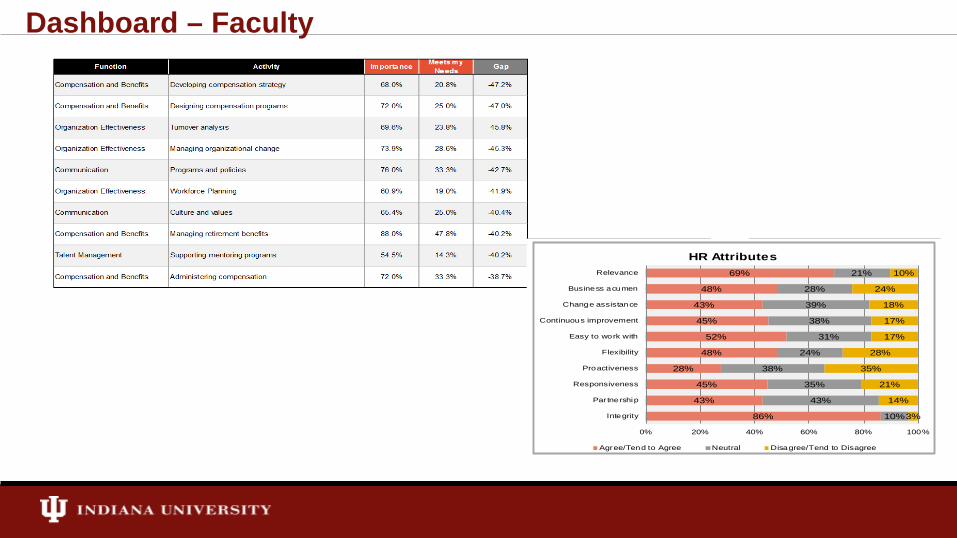
Dashboard – Faculty
86%
43%
45%
28%
48%
52%
45%
43%
48%
69%
10%
43%
35%
38%
24%
31%
38%
39%
28%
21%
3%
14%
21%
35%
28%
17%
17%
18%
24%
10%
0% 20% 40% 60% 80% 100%
Integrity
Par tnership
Responsiveness
Proactiveness
Flexibility
Easy to work with
Continuous improvement
Change assistance
Business acumen
Relevance
HR Attributes
Agree/Tend to Agree Neutral Disagree/Tend to Disagree

Dashboard – Exempt Staff
80%
51%
40%
30%
48%
56%
37%
38%
37%
65%
15%
27%
30%
36%
26%
22%
35%
30%
33%
25%
5%
22%
30%
35%
26%
22%
28%
32%
30%
10%
0% 20% 40% 60% 80% 100%
Integrity
Par tnership
Responsiveness
Proactiveness
Flexibility
Easy to work with
Continuous improvement
Change assistance
Business acumen
Relevance
HR Attributes
Agree/Tend to Agree Neutral Disagree/Tend to Disagree

Dashboard – Non-exempt (Support, Service, and Clerical Staff)
85%
62%
65%
47%
62%
76%
64%
60%
62%
72%
4%
6%
6%
18%
9%
2%
15%
9%
8%
2%
11%
32%
29%
35%
28%
23%
21%
30%
30%
26%
0% 20% 40% 60% 80% 100%
Integrity
Par tnership
Responsiveness
Proactiveness
Flexibility
Easy to work with
Continuous improvement
Change assistance
Business acumen
Relevance
HR Attributes
Agree/Tend to Agree Neutral Disagree/Tend to Disagree

Focus Group Summary
Focus Groups were conducted October – December:
o The participants included HR employees and a cross section of select customers from all divisions
o Focus groups were held on all 7 campuses
The focus group questions included:
o What does HR do well?
o What can HR do to improve?
o What suggestions / ideas do you have that would help HR better meet your needs?
Results were reported in aggregate, grouped by HR view and Customer view.

Focus Group Participant Profile
Campus Group HR Customers Total Participants
Bloomington 41 99 140
East 4 10 14
Indianapolis 15 81 96
Kokomo 4 19 23
Northwest 2 23 25
South Bend 3 14 17
Southeast 4 20 24
Total Participants339

HR Focus Groups – What does HR do well?HR View – Themes
• “We genuinely want to help and will do whatever it takes.”
• “We are welcoming and make everyone feel they matter.”
• “We have a strong benefits package, a strength for attraction and retention.”
• “We partner with our customers and each other.”
• “If we don’t know something we will learn.”
• “We get tremendous support from UHR.”
Sample Comments• Customer service driven• Approachable• Care for customers / each other• Strong support from UHR
oBenefits, Employee Relations, OD/Training, HR TechnologyoRegional campus assistance
• Knowledgeable and willing to learn• Know when to ask for help• Benefits offerings and information provided• Provide customers with information• Offer good guidance / advice • Dependable and responsive

Customer Focus Groups – What does HR do well?Customer View – Themes
• “HR really cares for people and is warm and welcoming.”
• “HR has high integrity and trust; follows through on commitments.”
• “They want to help, but they are so short staffed.”
• “HR website and quality of benefits information provided; we like campus vendor visits.”
• “I get good advice on how to handle difficult employee relations issues.”
Sample Comments• Customer service driven• Care for customers • Strong support from UHR
oBenefits, Employee Relations, OD/Training, Job postingsoRegional campus assistance
• Responsive; but too few resources in some areas oEmployment and Recruiting, Indianapolis Campus HR
• Competitive benefits offerings and information provided; vendor visits
• Training programs offered, especially leadership development

HR Focus Groups – What can HR do to improve?HR View – Themes
• “There is lots of duplication everywhere; the same questions are answered routinely.”
• “There is turnover/movement and a lack of documentation on “how to” which makes training difficult.”
• “Need to better define the line between HR and academic affairs regarding faculty HR support.”
• “We need to fill HR jobs; too many open for too long.”
• “HR programs need to be jointly developed with campus input vs. pushed down and made to fit.”
Sample Comments• Improve efficiency• Better internal training for HR• Clarify roles for Academic Affairs vs. HR;
UHR vs. Campus HR• Need an HR career path, more professional
development• Better performance management in HR;
employee and leaders jointly working on development
• Define who is accountable for what • Some areas in HR are understaffed• Include RCs and all campuses in HR policy
and program design• Resolve conflicts between fiscal and HR
policies
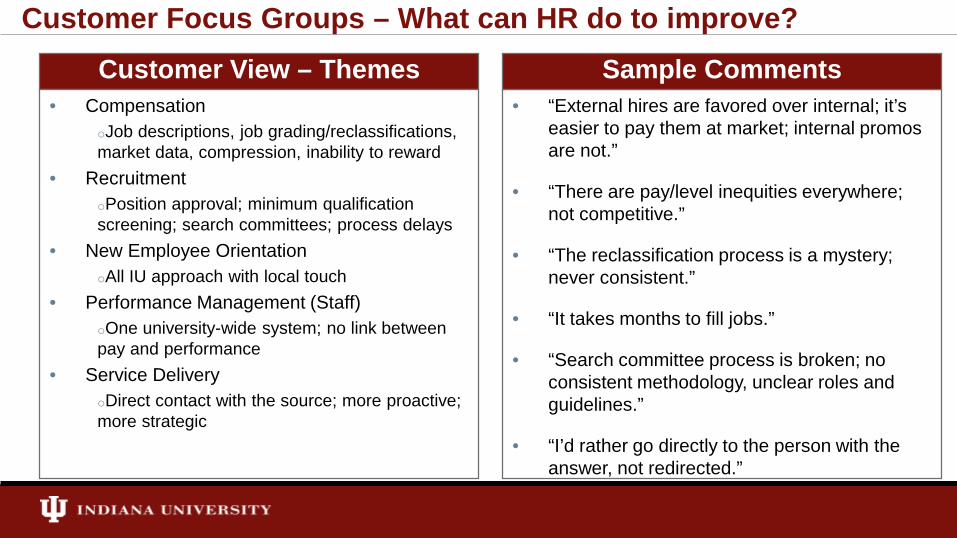
Customer Focus Groups – What can HR do to improve?Customer View – Themes
• “External hires are favored over internal; it’s easier to pay them at market; internal promos are not.”
• “There are pay/level inequities everywhere; not competitive.”
• “The reclassification process is a mystery; never consistent.”
• “It takes months to fill jobs.”
• “Search committee process is broken; no consistent methodology, unclear roles and guidelines.”
• “I’d rather go directly to the person with the answer, not redirected.”
Sample Comments• Compensation
oJob descriptions, job grading/reclassifications, market data, compression, inability to reward
• RecruitmentoPosition approval; minimum qualification screening; search committees; process delays
• New Employee OrientationoAll IU approach with local touch
• Performance Management (Staff)oOne university-wide system; no link between pay and performance
• Service DeliveryoDirect contact with the source; more proactive; more strategic

HR Focus Groups – Suggestions to better meet your needs?HR View – Themes
• HR knowledgebase or ticket system with FAQs. to share.”
• “Have UHR shadow campus RC people / cross train with UHR.”
• “Provide HR training / professional development i.e. SHRM.”
• “Hold an HR Session quarterly or 2-3 times per year.”
• “Better define roles, especially support for faculty HR issues and RC/campus vs. UHR”
• “There needs to be more collaboration within HR; too siloed.”
Sample Comments• Create a knowledge base or portal to share
best practices• Publish a ‘who to call for what’ • Provide more training and professional
development for HR• More cross-training (in HR and HR
shadowing RC/Campus HR Reps)• Better training for non-HR people doing HR
related work; assign a buddy/mentor• Quarterly or annual all HR session• Communicate new HR people/role changes;
do meet and greets• Do more benchmarking to bring in best
practices
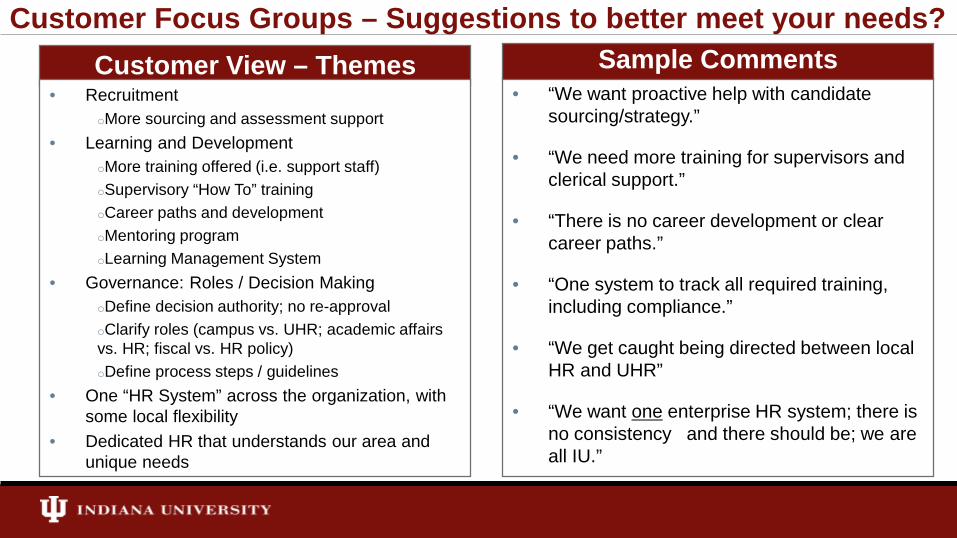
Customer Focus Groups – Suggestions to better meet your needs?Customer View – Themes
• “We want proactive help with candidate sourcing/strategy.”
• “We need more training for supervisors and clerical support.”
• “There is no career development or clear career paths.”
• “One system to track all required training, including compliance.”
• “We get caught being directed between local HR and UHR”
• “We want one enterprise HR system; there is no consistency and there should be; we are all IU.”
• RecruitmentoMore sourcing and assessment support
• Learning and Development oMore training offered (i.e. support staff)oSupervisory “How To” trainingoCareer paths and developmentoMentoring programoLearning Management System
• Governance: Roles / Decision MakingoDefine decision authority; no re-approvaloClarify roles (campus vs. UHR; academic affairs vs. HR; fiscal vs. HR policy)oDefine process steps / guidelines
• One “HR System” across the organization, with some local flexibility
• Dedicated HR that understands our area and unique needs
Sample Comments

QuestionsRemote participants can email the moderator at [email protected]

Thank you to all participants for your feedback!