hplc
DESCRIPTION
HPLCTRANSCRIPT

HIGH PERFORMANCE LIQUID CHROMATOGRAPHY
Kromatografi Cair Kinerja Tinggi (HPLC)

Extraction Distillation Precipitation Chromatography
Several different separation technique:

• HPLC adalah alat yang sangat bermanfaat
dalam analisis. Bagian ini menjelaskan
bagaimana pelaksanaan dan penggunaan
serta prinsip HPLC yang sama dengan
kromatografi lapis tipis dan kromatografi
kolom

Chromatography is an analytical chemistry techniques for the separation of mixtures. It involves passing the sample, a mixture which contains the analyte, in the "mobile phase", often in a stream of solvent, through the "stationary phase.“ Separation based on differences of migration of each component due to the difference of the nature (interaction) of each component to the stationary and, mobile phase

A,B,C
A B C
C
B
A
Mobile Phase
Stationary
phase
The stationary phase in HPLC
refers to the solid support
contained within the column
•the mobile phase continuously flows

CHROMATOGRAPHY: most widely used Qualitative and quantitative Many variety of compounds Good precision and accuracy Many choices of developing separation method

• HPLC merupakan perkembangan tingkat tinggi dari kromatografi kolom. Selain dari pelarut yang menetes melalui kolom di bawah grafitasi, didukung melalui tekanan tinggi sampai dengan 400 atm. Ini membuatnya lebih cepat. HPLC memungkinkan penggunaan partikel berukuran sangat kecil untuk material terpadatkan dalam kolom yang akan memberi luas permukaan yang lebih besar berinteraksi antara fase diam dan molekul-molekul yang melintasinya. Hal ini memungkinkan pemisahan yang lebih baik dari komponen-komponen dalam campuran. Perkembangan yang lebih luas melalui kromatografi kolom mempertimbangkan metode pendeteksian yang dapat digunakan. Metode-metode ini sangat otomatis dan sangat peka.

CLASSIFICATION

Mobile Phase Gas Liquid Samples Volatile - Less volatile Thermally stable - Less thermally - High molecular weight compound - ionic species Collection(rec.) Less convenient Easy Column Limited Greater variety Interaction One phase Two phases Operating temp. High room temperature Detector Limited Choice More Choices
Parameters GC LC

The differences between modern and classical LC
Classical LC Column used only once Solvent flow gravity/cappilarity Detection manually, coloring Quantitation Less precise, accuracy speed of Sep Slow Resolution low
HPLC reusable Pump Continuously More Faster Better

MODERN VS CLASSICAL LC
Bed Preparation
Sample application Solvent flow
Detection, quantitation
Result
Color Form
TLC
HPLC

MECHANISM OF SEPARATION IN HPLC

EXCLUTION CHROMATOGRAPHY
Separation are based on a sieving process If Solute is larger than the largest pores, it will be excluded and smaller molecule can enter a few pore have longer retention time.
Small M Large BM
THF (Molecular Sieving/GPC: Gel Permeation
Chromatography)
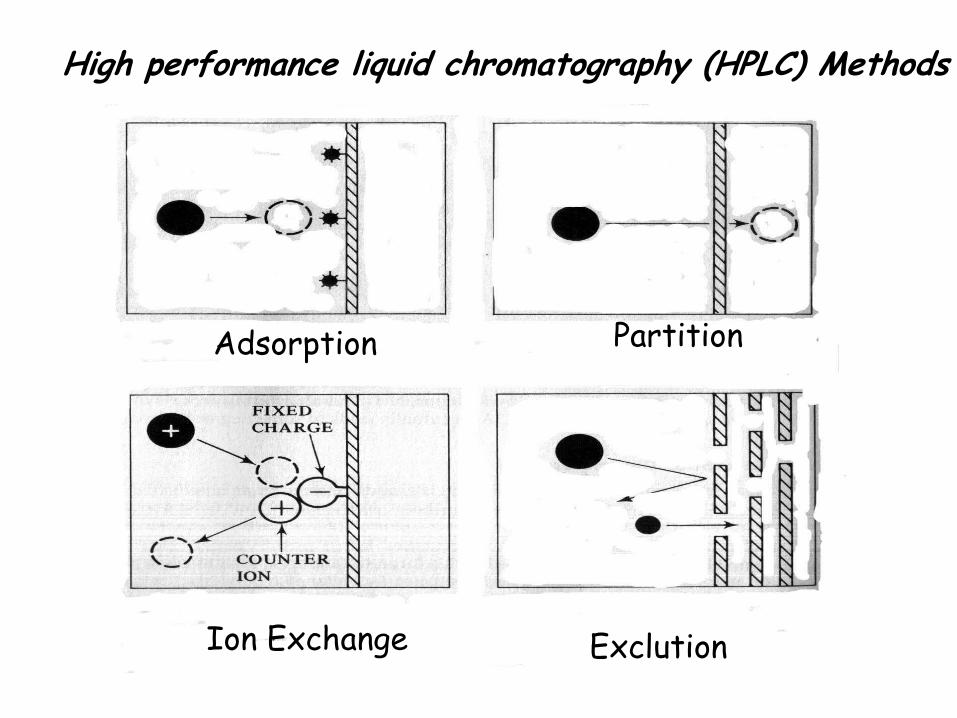
Adsorption Partition
Ion Exchange Exclution
High performance liquid chromatography (HPLC) Methods

High performance liquid chromatography (HPLC) Methods

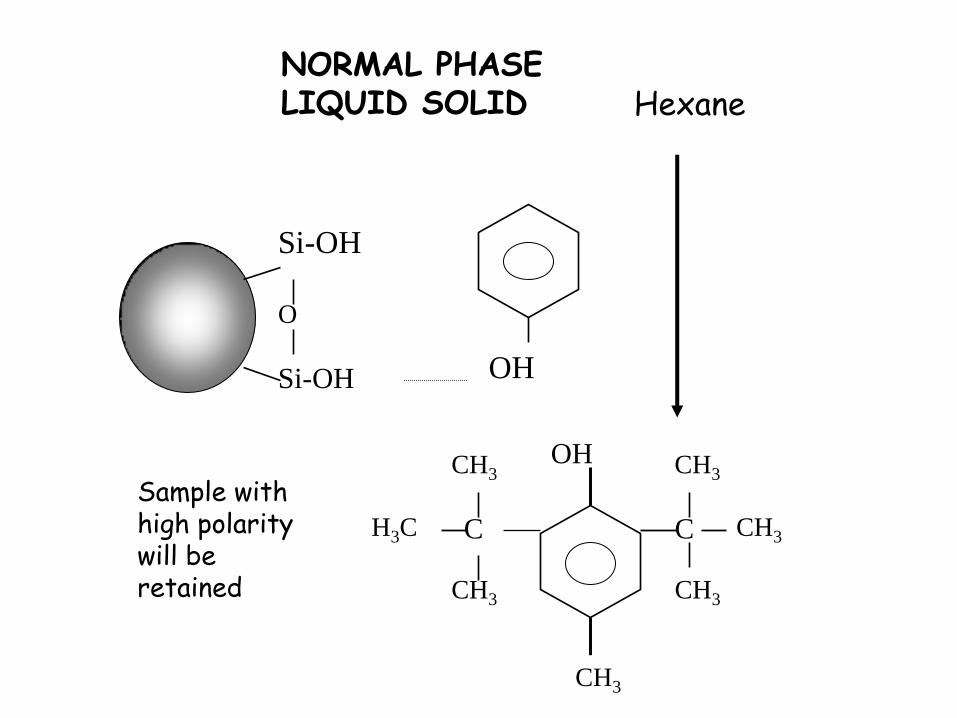
Fase normal HPLC
sama dengan kromatografi lapis tipis atau
kromatografi kolom. Kolom diisi partikel silika yg
sangat kecil 7 pelarut non polar misalnya heksan.
Kolom in 4.6 mm panjang 150 sd. 250 mm.
Senyawa-senyawa polar dalam campuran melalui
kolom akan melekat lebih lama pada silika yang
polar dibanding dengan senyawa-senyawa non polar.
Oleh karena itu, senyawa yang non polar kemudian
akan lebih cepat melewati kolom.

Fase balik HPLC( bentuk yang biasa digunakan dalam HPLC)
ukuran kolom sama, tp silika (fase diam) dimodifikasi menjadi non
polar melalui pelekatan rantai-rantai hidrokarbon panjang pada
permukaannya secara sederhana baik berupa atom karbon 8 atau 18.
Sebagai contoh, pelarut polar digunakan berupa campuran air dan
alkohol seperti metanol.
Dalam kasus ini, akan terdapat atraksi kuat antara pelarut polar dan
molekul polar dalam campuran yang melalui kolom. Atraksi yang
terjadi tidak sekuat atraksi fase diam dan molekul-molekul polar
dalam larutan. Oleh karena itu, molekul-molekul polar dalam
campuran akan menghabiskan waktunya untuk bergerak bersama
dengan pelarut.

Fase balik HPLC( sambungan)
Senyawa-senyawa non polar dalam campuran akan cenderung
membentuk atraksi dengan gugus hidrokarbon karena adanya
dispersi gaya van der Waals. Senyawa-senyawa ini juga akan
kurang larut dalam pelarut karena membutuhkan pemutusan ikatan
hydrogen sebagaimana halnya senyawa-senyawa tersebut berada
dalam molekul-molekul air atau metanol misalnya. Oleh karenanya,
senyawa-senyawa ini akan menghabiskan waktu dalam larutan dan
akan bergerak lambat dalam kolom.
Ini berarti bahwa molekul-molekul polar akan bergerak lebih cepat
melalui kolom.
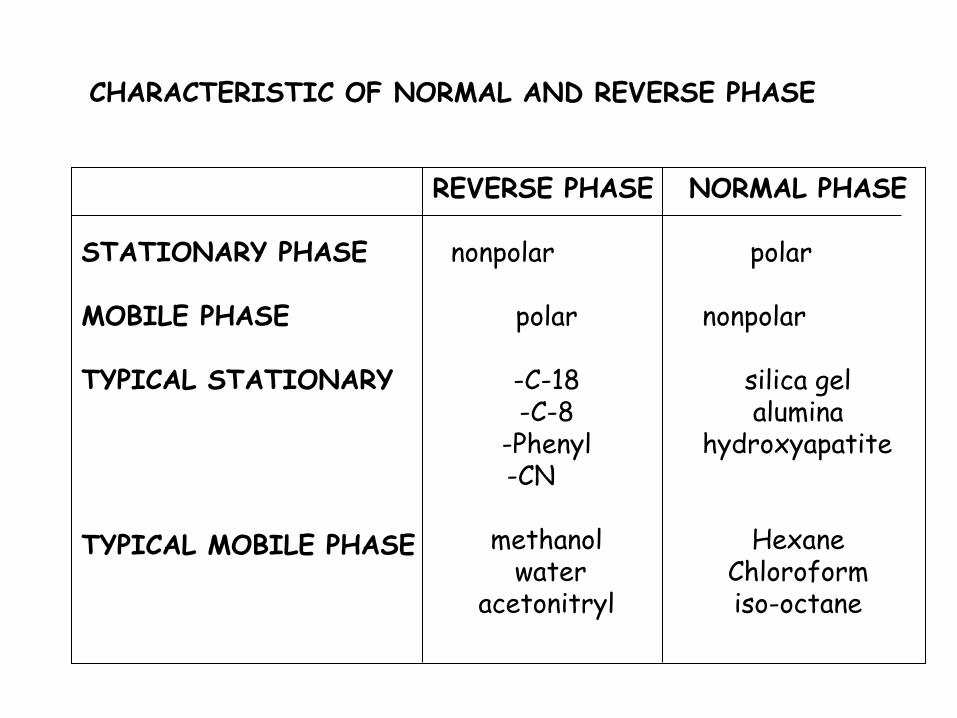
CHARACTERISTIC OF NORMAL AND REVERSE PHASE
STATIONARY PHASE MOBILE PHAS E TYPICAL STATIONARY
TYPICAL MOBILE PHASE
NORMAL PHASE polar
nonpolar
silica gel alumina
hydroxyapatite
Hexane Chloroform iso-octane
REVERSE PHASE
nonpolar
polar
-C-18 -C-8
-Phenyl -CN
methanol
water acetonitryl
O
Si-OH
Si-OH OH
Hexane
OH
C
CH3
CH3
CH3 C
CH3
CH3
H3C
CH3
NORMAL PHASE LIQUID SOLID
Sample with high polarity will be retained


Si-O-Si-C18
OH
CH3CN/H2O
OH
C
CH3
CH3
CH3 C
CH3
CH3
H3C
CH3
REVERSE PHASE
Sample with high polarity will be eluted easily


Reverse phase most widely used Polar, nonpolar, neutral, ionic compound
Ionic compound by reverse
phase Ion suppression Ion pairing Ion excgange

Ion pairing
X+ + Y- XY
Ionic Sample Counter Ion neutral
HA H+ + A- Neutal PH << Ionic
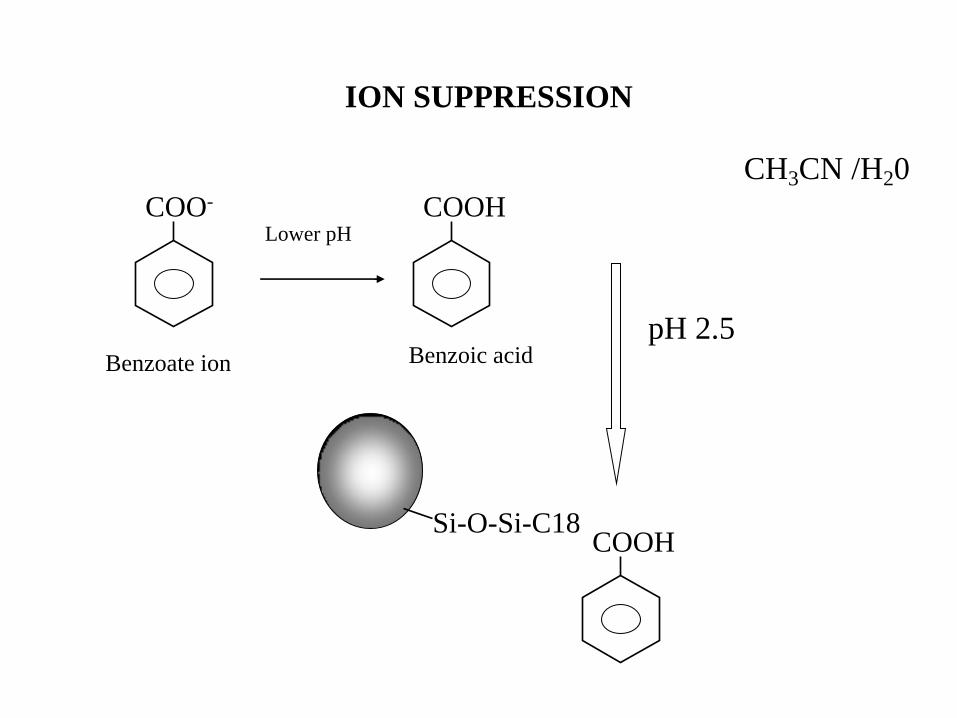
ION SUPPRESSION
CH3CN /H20
COO- COOH
Si-O-Si-C18 COOH
Lower pH
Benzoate ion Benzoic acid pH 2.5
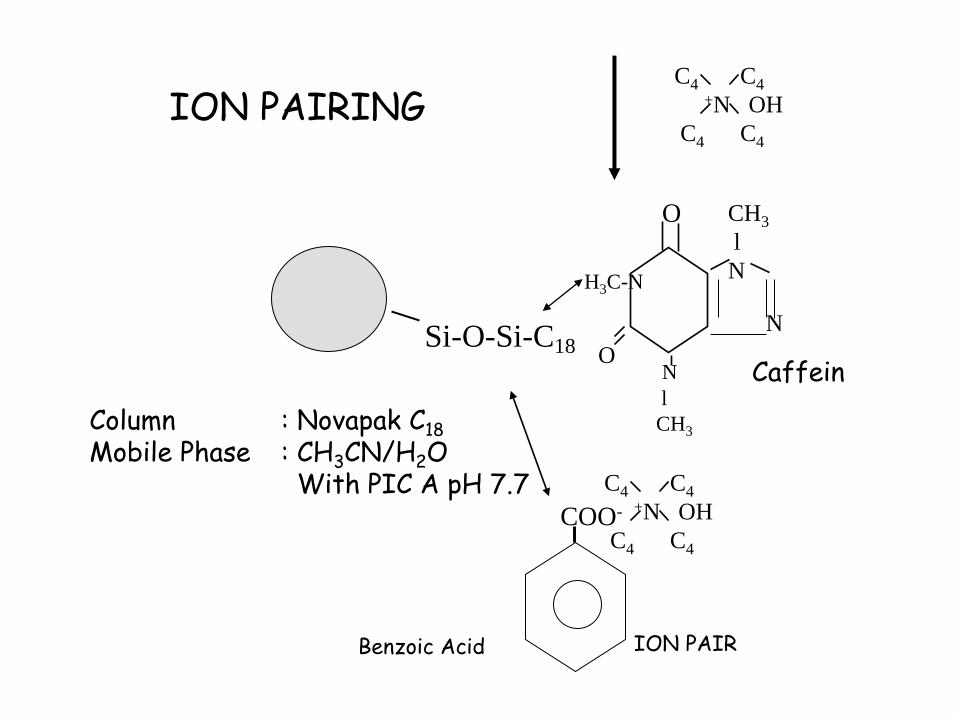
Column : Novapak C18 Mobile Phase : CH3CN/H2O With PIC A pH 7.7
ION PAIRING C4 C4
+N OH
C4 C4
CH3
l
N
N
l
CH3
COO-
ION PAIR Benzoic Acid
N
H3C-N
O
O
Si-O-Si-C18
C4 C4
+N OH
C4 C4
Caffein

ION PAIR REAGENTS
PIC B FOR BASES
N+
H2PO4-
SO3-
SO3-
SO3-
SO3-
STRONG BASE STRONG ACIDS
PIC A FOR ACID
Pentan Sulfonat Acid
Hexane Sulfonic Acid
Heptane Sulfonic acid
Octane Sulfonic Acid Tetra Butyl Amonium
Phosphate
CHEMICAL STRUCTURE

ION EXCHANGE THEORY
SO3- , COO-
Cation Exchange
-(R)2NH+
Anion Exchange
X - + R+Y- Y- + R+X- (anion exchange)
X + + R-Y+ Y+ + R-X+ (Cation exchange)

Retention Time
Waktu yang dibutuhkan oleh senyawa untuk bergerak melalui kolom
menuju detektor disebut sebagai waktu retensi. Waktu retensi diukur
berdasarkan waktu pd saat sampel diinjeksikan sampai sampel
menunjukkan ketinggian puncak yang maksimum dari senyawa itu.
Senyawa-senyawa yang berbeda memiliki waktu retensi yang berbeda.
Untuk beberapa senyawa, waktu retensi akan sangat bervariasi dan
bergantung pada:
tekanan yang digunakan (karena itu akan berpengaruh pada laju alir dari
pelarut)
•kondisi dari fase diam (tidak hanya terbuat dari material apa, tetapi juga
pada ukuran partikel)
•komposisi yang tepat dari pelarut
temperatur pada kolom

Retention Time
the retention time (tR ),
the time taken for the
mobile phase to pass
through the column is
called tM.
capacity factor = k'A = t R - tM / tM
A term called the retention factor, k', is
often used to describe the migration rate of
an analyte on a column

Column Efficiency
Column efficiency, also known as plate count, is a measure of the
dispersion of a peak. Narrow peaks take up less space in the
chromatogram and thus allow more peaks to be separated. They are also
easier to integrate since they give better resolution and less overlapping.
Efficiency is usually explained using the concept of theoretical plates.
This model supposes that the column contains a large number of separate
layers. Separate equilibrations of the sample between the stationary and
mobile phase occur in these plates.
where t is the retention time of the peak of interest and W is the
peak width at the base

Theoretical plate

Similar to the measurement
for resolution, the
measurement for efficiency
may also be performed
using the peak width at half
height, where Wh/2 is the
peak width as half height
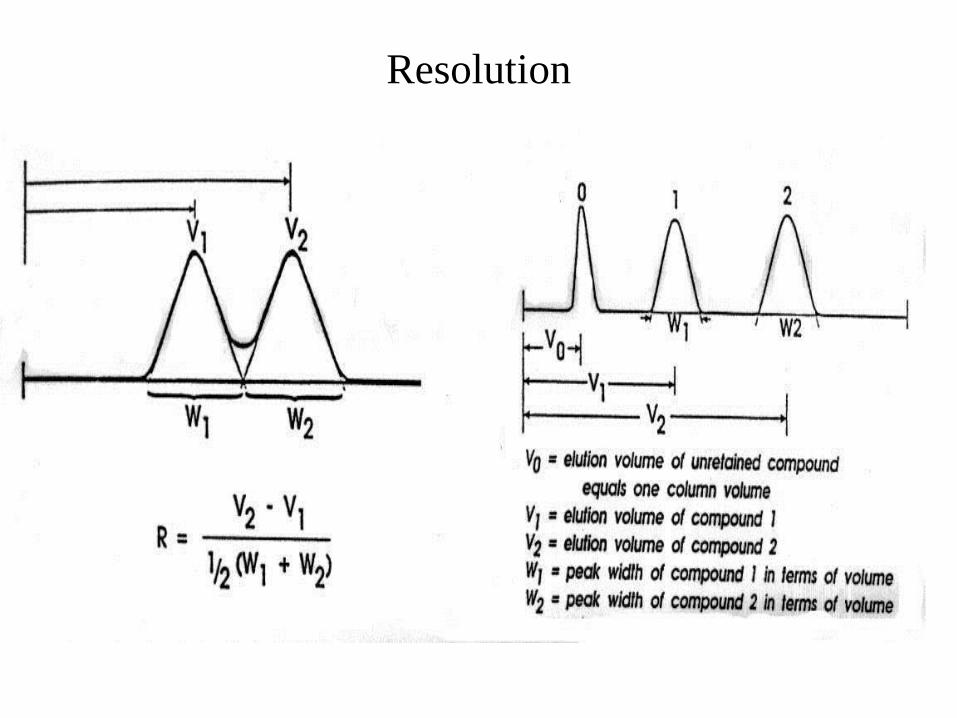
Resolution

Resolution
• Chromatogram = A plot of the detector’s signal as
function of elution time or volume.
• Retention time = The time a solute takes to move
from the point of injection to the detector (tr).
• Retention volume =The volume of mobile phase
needed to move a solute from its point of injection to
the detector (Vr).
• baseline width = The width of a solute’s
chromatographic band measured at the baseline (w).


< TD>

< TD>

< TD>

< TD>

< TD>

< TD>

< TD>

< TD>

< TD>

< TD>

< TD>

< TD>

< TD>

< TD>

< TD>

< TD>

< TD>

< TD>

< TD>

In relation with the physical parameters
expressed as follow:
'
' N
41 R
Selectivity efficiency Capacity

< TD>

< TD>

< TD>

< TD>

< TD>

OPTIMISING RESOLUTION
By MODIFYING κ’, α and N
A. κ1 (RETENTION FACTOR)
CHANGE SOLVENT RATIO / MIXTURES
(SOLVENT STRENGTHS) E.G. 50/50 MeOH/H20 - 70/30 MeOH/H20
B. α (SELECTIVITY FACTOR)
• CHANGE MOBILE PHASE CHEMISTRY
(CHANGE SOLVENT TYPES)
E.G. MeOH/H20 - THF/H20ADD
• BUFFER/MODIFIER
• CHANGE COLUMN TYPE

C. N (EFFICIENCY FACTOR):
• CHANGE FLOW RATE (DECREASING F.R. INCREASES
EFFICIENCY)
• CHANGE PARTICLE SIZE (DECREASE PARTICLE
SIZE INCREASES EFFICIENCY
• CHANGE TO A LONGER COLUMN (INCREASES
COLUMN LENGHTH INCREASE EFFICIENCY)

0
01
V
V - V ',tentionRe
01
02
V- V
V - V
'
' ',ySelectivit
2
1
1
W
V16 N,Efficiency
The physical meaning
κ1 = 0 (No separation, compound elutes at void vol. (vow))
κ1 = 2 - 10 (recommended value)
α = 1.0 (no separation)
α = 2.0 (good peak separation)
N = 3000 – 10.000 plates / column
R = 1.5 (baseline separation)


HPLC COMPONENT
EQUIPMENT AND OPERATION

Pumps
material :stainless steel, titanium or some ceramic
materials that are resistant to corrosive
Flow rate : 0.1 ml/min to 5-10 ml/min in analytical column
(i.d. 4-5 mm) deviation : less than 0.5-1%.
Reservoir : inert, mobile phase degassed , vacuum,
purge by helium or ultra sonic

Sample Injector

Chromatographic column
id are 2 to 3 mm lengths are 5-30 cm
packing material with diameter 3-10 m

Detector
Selective detector with signal proportional
to the concentration of only specific substance
in eluate
Universal (non specific) detector, with
response proportional to the a certain overall
property of the eluate, i.e. of both the solute
and the component of mobile phase. (RI)
UV/VIS detector Io
Log = bc = A
I
Io = incident light
I = the itensity of the
transmitted light
= Molar absortivity
b = Cell pathlength
c = Sample concentration
A = Absorbance
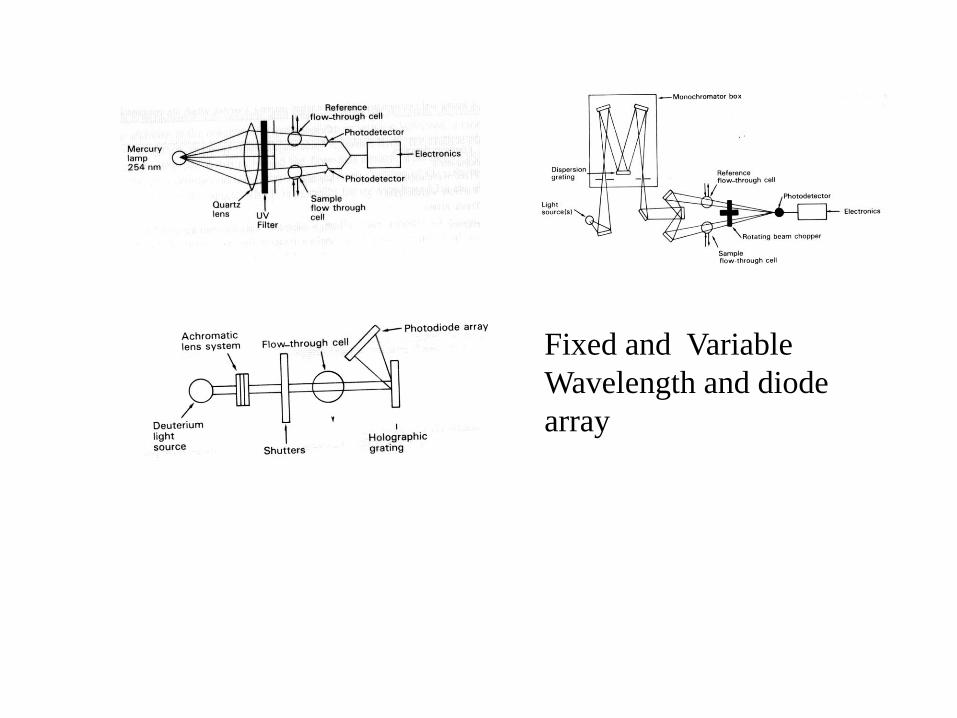
Fixed and Variable
Wavelength and diode
array
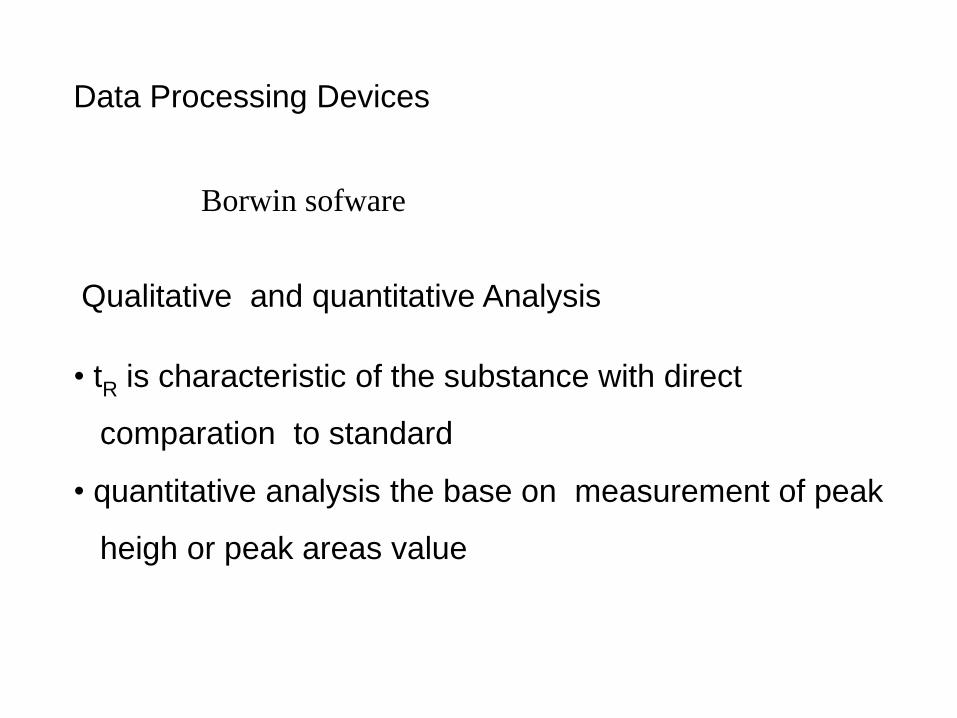
Data Processing Devices
Borwin sofware
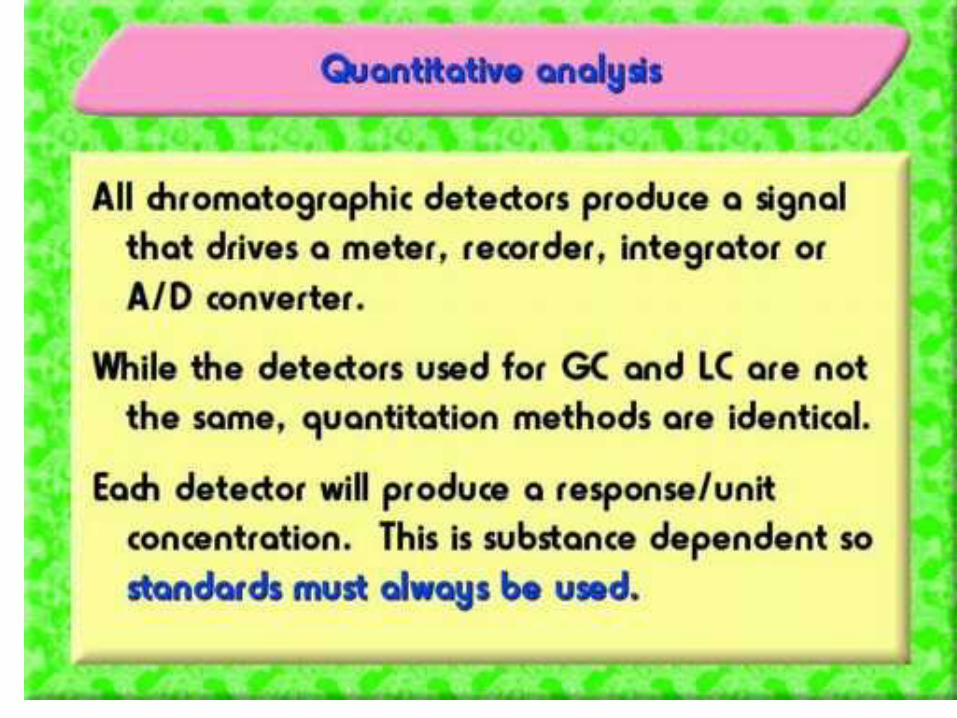
Qualitative and quantitative Analysis
• tR is characteristic of the substance with direct
comparation to standard
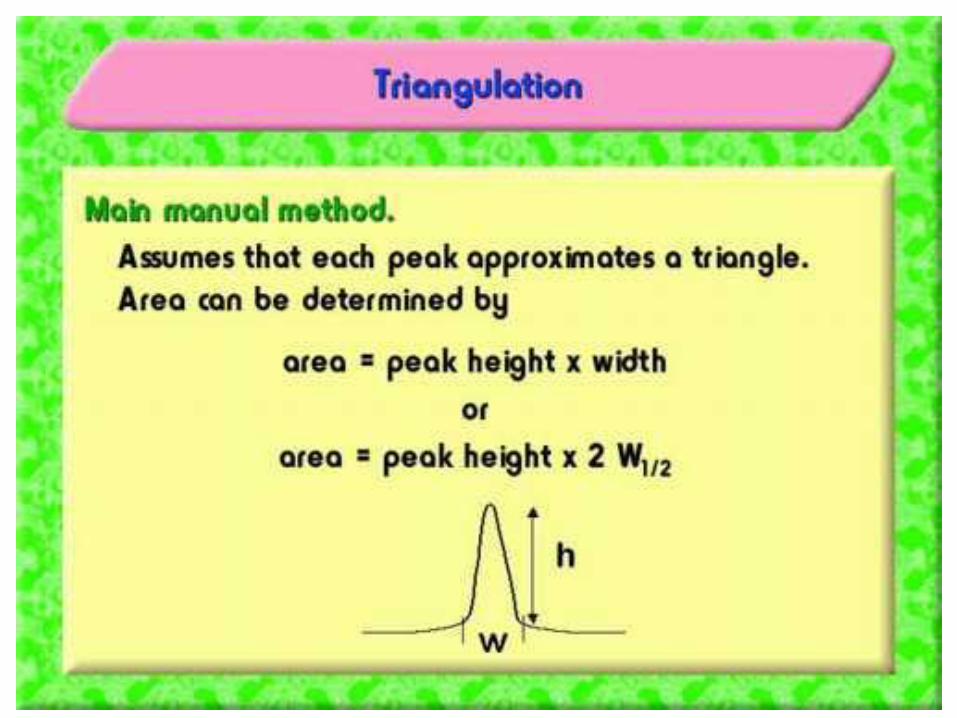
• quantitative analysis the base on measurement of peak
heigh or peak areas value

1. TURN ON THE POWER
2. PREPARE FILTERED AND DEGASSED SOLVENT, AND
FILTERED SAMPLE
3.”PRIME” PUMP TO REMOVE BUBLE
4. ADJUST FLOW RATE COMPISITION OF SOLVENT
AND WAVELENGH USING BORWIN SOFTWARE
5. EQUILBRATE THE SYSTEM BY FOLLOWING THE
WORKING SOLVENT
6. INJECT STANDARD/ SAMPLE
7. INTEGRATE AND PRINT CHROTOGRAM RESULT
(y-RAM SOFTWARE)
OPERATON OF HPLC

SAMPLE PREPARATION
The purpose : to clean up the sample
Reduce overall sample load onto column
Remove interference associates with matrix
Concentrate the component of interest
Enhance sensitivity
Remove particulate
Protect the column
Improve the chromatographic separation peak
Type of sample clean up
Extraction
Filtration
TLC
Selective precipitation
Open column technique
Centrifugation
Guard column

A. Solvent
Have high purity, HPLC grade
Miscible each other if using more different solvent
pH 3,5 – 7,0 ( bonded phase)
UV adsorption
Toxicity
Volatility
A.1. H2O as a solvent
Use high quality of water (bidest)
Prepared freshly daily
Use appropriate containers
PRACTICAL HINT FOR AINTENANCE

A.2 Degassing
Purpose :
To removed gasses especially O2 and N2
To prevent bubble formation in pump and fluid system
To reach great precision of retention time and quantitation
Type: Helium Spurge, Vacuum, Sonication
A.3. pH Consideration
Reverse and normal phase 3,5 - 8.0 (8< pH
silica solubility ; PH < 2 bonded destroyed)
Ion exchange pH: 2 - 12
A.4 Solvent miscibility
A.5 Use of buffer : To improve Resolution
High quality, fresh, avoid precipitation

C. Column
C1. Column handling
To maximize the column lifetime
Avoid mechanical, thermal and pressure shocks
Always increase solvent flow rates slowly (0.1- 0.5 incr.)
Follow manufacture instruction
C2. Guard column
Protect column from particulate and chemical contaminant
Sample clean up
Trace enrichment using proper guard column
B. Filtration: remove particulate
To maintain life time column and pumping system
Type : Teflon, Nylon, cellulose

C3. Column cleaning
.Reverse phase column
Flush with 1005 Org. Solvent as MeOH for 15 min
Contaminated non proteinaceous material
Sequence cleaning ;
Wash solvent Volume
Water 30 ml
Methanol 30 ml
THF 30 ml
Methylene chloride 30 ml
THF 30 ml
Methanol 30 ml
Water 30 ml
Proteinaceus material : injecting 200 ul sludge of DMSO

Normal phase column
Sequence cleaning ;
Wash solvent Volume
Isooctane 50 ml
Methylene chloride 50 ml
Methanol 50 ml
Methylene chloride 50 ml
Isooctane 50ml
Solvent should be dry ( less than 500 ppm water)

Store the column in appropriate solvent ( Manual)
Store with end fitting connected
Protect from mechanical, thermal shock and
vibration
Flush column thoroughly prior to storage
Leaving column less 72 hours does not require
storage procedure
C4. Column storage recommendation
< TD>

< TD>

< TD>

< TD>

< TD>

< TD>

< TD>
< TD>

< TD>

< TD>

< TD>

< TD>

< TD>

< TD>

< TD>

< TD>

< TD>

< TD>

< TD>

< TD>


< TD>

< TD>

< TD>

< TD>

< TD>

< TD>

< TD>

Istilah-istilah
• Chromatogram = A plot of the detector’s signal as
function of elution time or volume.
• Retention time = The time a solute takes to move
from the point of injection to the detector (tr).
• Retention volume =The volume of mobile phase
needed to move a solute from its point of injection
to the detector (Vr).
• baseline width = The width of a solute’s
chromatographic band measured at the baseline
(w).


Soal-soal
