hplc-uv method for the determination of enalapril in … 3 • issue 1 • 1000130 j anal bioanal...
TRANSCRIPT
Volume 3 • Issue 1 • 1000130J Anal Bioanal TechniquesISSN:2155-9872 JABT, an open access journal
Open AccessResearch Article
Naveed et al., J Anal Bioanal Techniques 2012, 3:1 DOI: 10.4172/2155-9872.1000130
Keywords: Enalapril maleate; HPLC; Validation
IntroductionEnalapril maleate is chemically described as (S)-1-[N-[1-
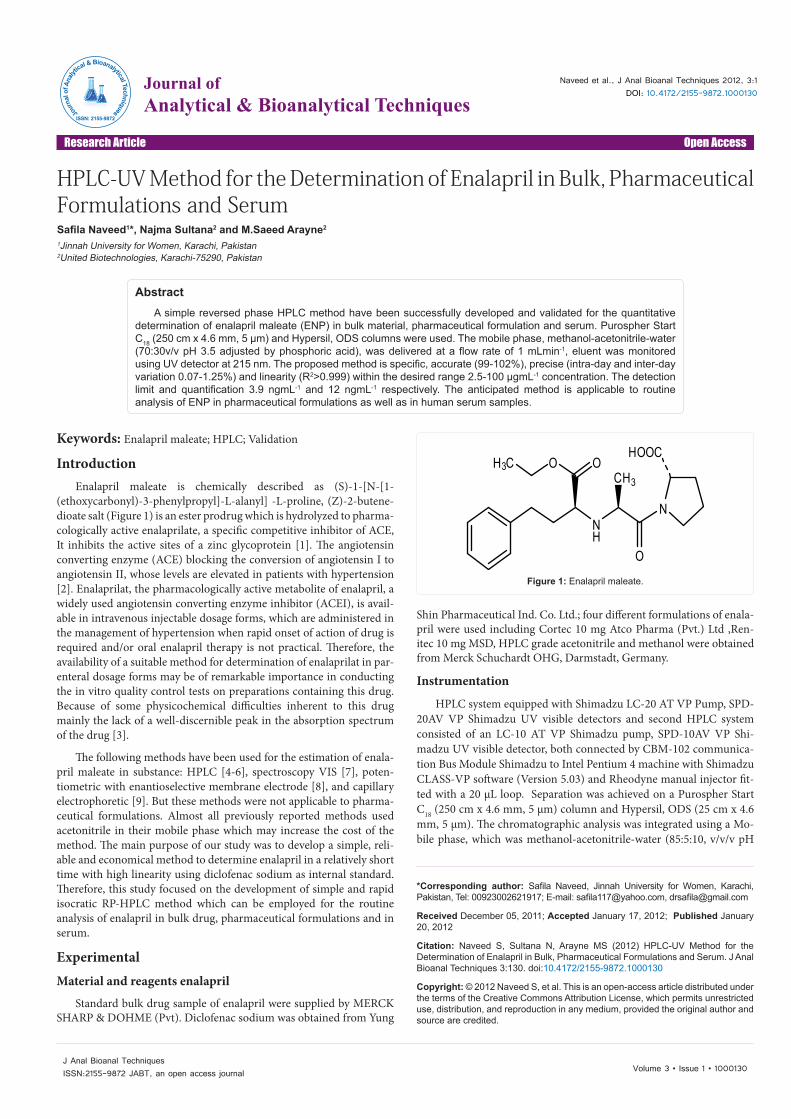
(ethoxycarbonyl)-3-phenylpropyl]-L-alanyl] -L-proline, (Z)-2-butene-dioate salt (Figure 1) is an ester prodrug which is hydrolyzed to pharma-cologically active enalaprilate, a specific competitive inhibitor of ACE, It inhibits the active sites of a zinc glycoprotein [1]. The angiotensin converting enzyme (ACE) blocking the conversion of angiotensin I to angiotensin II, whose levels are elevated in patients with hypertension [2]. Enalaprilat, the pharmacologically active metabolite of enalapril, a widely used angiotensin converting enzyme inhibitor (ACEI), is avail-able in intravenous injectable dosage forms, which are administered in the management of hypertension when rapid onset of action of drug is required and/or oral enalapril therapy is not practical. Therefore, the availability of a suitable method for determination of enalaprilat in par-enteral dosage forms may be of remarkable importance in conducting the in vitro quality control tests on preparations containing this drug. Because of some physicochemical difficulties inherent to this drug mainly the lack of a well-discernible peak in the absorption spectrum of the drug [3].
The following methods have been used for the estimation of enala-pril maleate in substance: HPLC [4-6], spectroscopy VIS [7], poten-tiometric with enantioselective membrane electrode [8], and capillary electrophoretic [9]. But these methods were not applicable to pharma-ceutical formulations. Almost all previously reported methods used acetonitrile in their mobile phase which may increase the cost of the method. The main purpose of our study was to develop a simple, reli-able and economical method to determine enalapril in a relatively short time with high linearity using diclofenac sodium as internal standard. Therefore, this study focused on the development of simple and rapid isocratic RP-HPLC method which can be employed for the routine analysis of enalapril in bulk drug, pharmaceutical formulations and in serum.
ExperimentalMaterial and reagents enalapril
Standard bulk drug sample of enalapril were supplied by MERCK SHARP & DOHME (Pvt). Diclofenac sodium was obtained from Yung
Shin Pharmaceutical Ind. Co. Ltd.; four different formulations of enala-pril were used including Cortec 10 mg Atco Pharma (Pvt.) Ltd ,Ren-itec 10 mg MSD, HPLC grade acetonitrile and methanol were obtained from Merck Schuchardt OHG, Darmstadt, Germany.
Instrumentation
HPLC system equipped with Shimadzu LC-20 AT VP Pump, SPD-20AV VP Shimadzu UV visible detectors and second HPLC system consisted of an LC-10 AT VP Shimadzu pump, SPD-10AV VP Shi-madzu UV visible detector, both connected by CBM-102 communica-tion Bus Module Shimadzu to Intel Pentium 4 machine with Shimadzu CLASS-VP software (Version 5.03) and Rheodyne manual injector fit-ted with a 20 μL loop. Separation was achieved on a Purospher Start C18 (250 cm x 4.6 mm, 5 μm) column and Hypersil, ODS (25 cm x 4.6 mm, 5 μm). The chromatographic analysis was integrated using a Mo-bile phase, which was methanol-acetonitrile-water (85:5:10, v/v/v pH
*Corresponding author: Safila Naveed, Jinnah University for Women, Karachi, Pakistan, Tel: 00923002621917; E-mail: [email protected], [email protected]
Received December 05, 2011; Accepted January 17, 2012; Published January 20, 2012
Citation: Naveed S, Sultana N, Arayne MS (2012) HPLC-UV Method for the Determination of Enalapril in Bulk, Pharmaceutical Formulations and Serum. J Anal Bioanal Techniques 3:130. doi:10.4172/2155-9872.1000130
Copyright: © 2012 Naveed S, et al. This is an open-access article distributed under the terms of the Creative Commons Attribution License, which permits unrestricted use, distribution, and reproduction in any medium, provided the original author and source are credited.
AbstractA simple reversed phase HPLC method have been successfully developed and validated for the quantitative
determination of enalapril maleate (ENP) in bulk material, pharmaceutical formulation and serum. Purospher Start C18 (250 cm x 4.6 mm, 5 µm) and Hypersil, ODS columns were used. The mobile phase, methanol-acetonitrile-water (70:30v/v pH 3.5 adjusted by phosphoric acid), was delivered at a flow rate of 1 mLmin-1, eluent was monitored using UV detector at 215 nm. The proposed method is specific, accurate (99-102%), precise (intra-day and inter-day variation 0.07-1.25%) and linearity (R2>0.999) within the desired range 2.5-100 µgmL-1 concentration. The detection limit and quantification 3.9 ngmL-1 and 12 ngmL-1 respectively. The anticipated method is applicable to routine analysis of ENP in pharmaceutical formulations as well as in human serum samples.
HPLC-UV Method for the Determination of Enalapril in Bulk, Pharmaceutical Formulations and SerumSafila Naveed1*, Najma Sultana2 and M.Saeed Arayne2
1Jinnah University for Women, Karachi, Pakistan 2United Biotechnologies, Karachi-75290, Pakistan
NH
O
N
HOOC
CH3
O OH3C
Figure 1: Enalapril maleate.
Journal ofAnalytical & Bioanalytical TechniquesJo
urna
l of A
nalyt
ical & Bioanalytical Techniques
ISSN: 2155-9872
Volume 3 • Issue 1 • 1000130J Anal Bioanal TechniquesISSN:2155-9872 JABT, an open access journal
Citation: Naveed S, Sultana N, Arayne MS (2012) HPLC-UV Method for the Determination of Enalapril in Bulk, Pharmaceutical Formulations and Serum. J Anal Bioanal Techniques 3:130. doi:10.4172/2155-9872.1000130
Page 2 of 4
2.75 adjusted by phosphoric acid). The mobile phase was sonicated by DGU-14 AM on-line degasser, and filtered through 0.45-micron mem-brane filter, calibrated Pyrex glassware was used for the solution and mobile phase preparation.
Preparation of solutions
To produce a concentration of 100 μgmL−1, 10 mg of the enalapril and internal standard were diluted to 100 mL with mobile phase. This solution was used for preparation of working solutions which were pre-pared by diluting the stock solutions with the same solvent to contain 2.5-100 μgmL−1 for enalapril and for IS then filtered with 0.45-micron membrane filter. These solutions were ready to inject.
Analysis of formulation
Twenty tablets of four different brands were accurately weighed, grinded to make a fine powder. Calculated quantity of powder of each brand was weighed, which was corresponding to 10 mg of enalapril and shifted to separate 100 mL volumetric flask. Each was dissolved in the mobile phase and filtered through a membrane filter (0.45 μ). The sam-ple solutions were further diluted to desired concentrations and then used for the analysis.
Procedure for human serum
Plasma sample, obtained from healthy volunteers, was collected and stored at -20°C. Then, 1.0mL of frozen plasma mixed with 10 mL of acetonitrile. The mixture was vortexed for one minute and then cen-trifuged for 10 minutes at 10,000 rpm. It was then alienated superna-tant by filtration (0.45 µ pore size membrane filter). An aliquot serum sample was fortified with enalapril to get final concentrations of 100, 20, 25,10,5 and 2.5 μgmL-1.
Results and DiscussionMethod development and optimization
To select the optimal chromatographic conditions, different C18 stationary phases have been tried. Best separation, adequate resolution short retention time and symmetric peak of ENP and Internal Stan-dard were achieved by two difference columns which were Purospher STAR RP-and Hypersil, ODS. To investigate appropriate wavelength for determination of ENP and IS, we scanned solution of both drugs by UV-visible spectrophotometer. It was observed that the maximum ab-sorbance of drug was obtained at 215 nm. Diclofenac sodium was used as an internal standard, retention time of enalapril was found to be 2.4 min and that of internal standard was 4.0 minutes respectively.
Initially methanol and water were tried in the ratio of 80:20 (v/v), as a result, ENP and IS did not separate properly, so the above mobile phase was varied as 90:10 (v/v), both drugs separated but the peak was not symmetrical. When mobile phase (methanol-water, 70:30 v/v) both drugs showed typical peak nature and symmetry. To select the optimum mobile phase pH range 2.5 to 4.0 were investigated, excellent perfor-mance was achieved at pH 3.5 adjusted with phosphoric acid. Total run time was 5 min; short analysis times are essential for routine analysis.
Method validation
The developed method was validated by various parameters which include system suitability, selectivity, specificity, accuracy test, linear-ity, precision, robustness, ruggedness, sensitivity, limit of detection and quantification, according to US Pharmacopeia and ICH guidelines.
System suitability
The HPLC system was equilibrated with the initial mobile phase composition, followed by 6 injections of the same standard. These 6 consecutive injections were used to evaluate the system suitability on each day of method validation. Parameter of system suitability are peaks symmetry (symmetry factor), theoretical plates of the column, mass distribution ratio (capacity factor), and resolution as summarized in table 1.
Specificity and selectivity
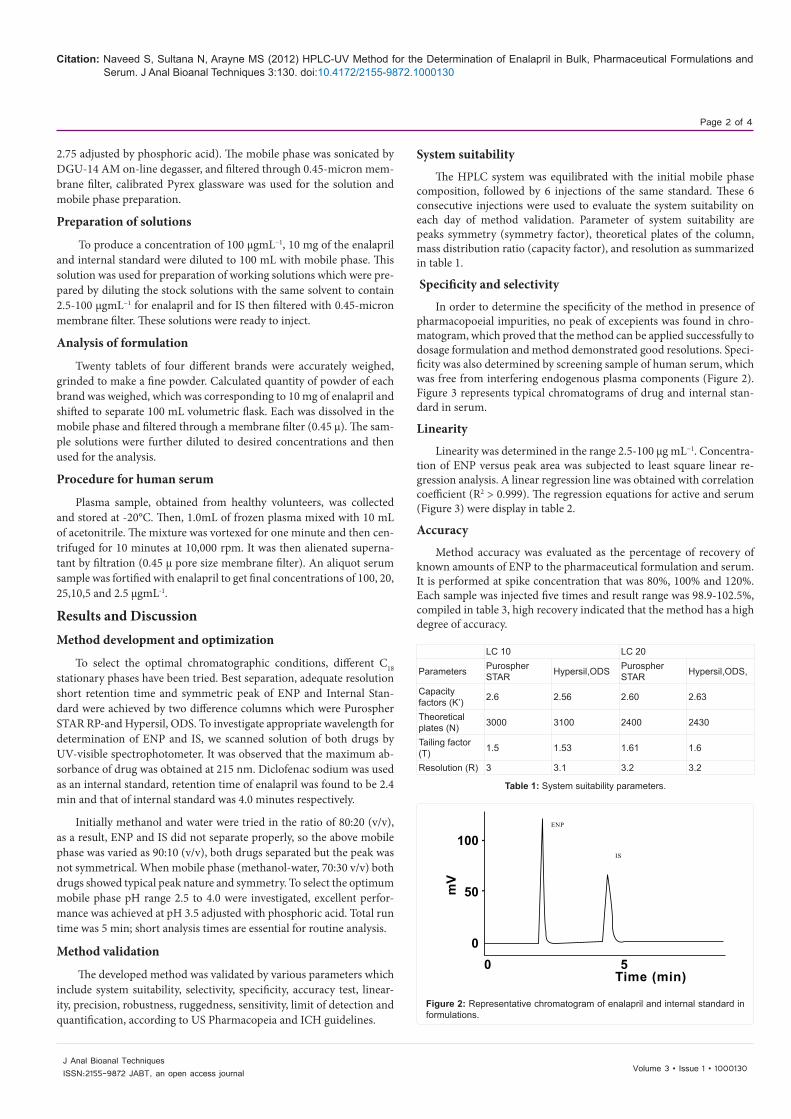
In order to determine the specificity of the method in presence of pharmacopoeial impurities, no peak of excepients was found in chro-matogram, which proved that the method can be applied successfully to dosage formulation and method demonstrated good resolutions. Speci-ficity was also determined by screening sample of human serum, which was free from interfering endogenous plasma components (Figure 2). Figure 3 represents typical chromatograms of drug and internal stan-dard in serum.
Linearity
Linearity was determined in the range 2.5-100 μg mL−1. Concentra-tion of ENP versus peak area was subjected to least square linear re-gression analysis. A linear regression line was obtained with correlation coefficient (R2 > 0.999). The regression equations for active and serum (Figure 3) were display in table 2.
Accuracy
Method accuracy was evaluated as the percentage of recovery of known amounts of ENP to the pharmaceutical formulation and serum. It is performed at spike concentration that was 80%, 100% and 120%. Each sample was injected five times and result range was 98.9-102.5%, compiled in table 3, high recovery indicated that the method has a high degree of accuracy.
LC 10 LC 20
Parameters Purospher STAR Hypersil,ODS Purospher
STAR Hypersil,ODS,
Capacity factors (K’) 2.6 2.56 2.60 2.63
Theoretical plates (N) 3000 3100 2400 2430
Tailing factor (T) 1.5 1.53 1.61 1.6
Resolution (R) 3 3.1 3.2 3.2
Table 1: System suitability parameters.
100
50
0
mV
0 5 Time (min)
ENP
IS
Figure 2: Representative chromatogram of enalapril and internal standard in formulations.

Volume 3 • Issue 1 • 1000130J Anal Bioanal TechniquesISSN:2155-9872 JABT, an open access journal
Citation: Naveed S, Sultana N, Arayne MS (2012) HPLC-UV Method for the Determination of Enalapril in Bulk, Pharmaceutical Formulations and Serum. J Anal Bioanal Techniques 3:130. doi:10.4172/2155-9872.1000130
Page 3 of 4
tions of each parameter. When a parameter was changed ± 0.2 % (in flow rate), ± 0.2% (pH 3.5), and ± 5 % wave length from its optimum condition, the shifting in retention time of ± 0.2% was observed that assessed as inconsequentiality. The method proved to be quite stable (Table 5).
Ruggedness
Ruggedness of our method was determined in two different labs. Lab 1 was Research Institute of Pharmaceutical Sciences, Department of Pharmaceutical Chemistry, Faculty of Pharmacy, University of Kara-chi while other lab was lab 9, Department of Chemistry, Faculty of sci-ence, University of Karachi. Two different instruments one was LC 10 and LC 20. Two different columns Purospher STAR C18 and Hypersil, ODS were used. All parameters were compared the developed method did not show any remarkable difference in calculated results from ac-ceptable limits in precision, but the area under curve of peak was af-fected with change of wavelength.
30
20
10
0
mV
ENP
IS
Time (min)0 5
Figure 3: Representative chromatogram of enalapril and internal standard in serum.
Systems Column Drug Conc. (µgmL-1)
Regression Equa-tions r2
LC 10Hypersil,ODS
Active 2.5-100 y=2340.4x + 3022.3 0.9995Serum 2.5-100 y = 2339.4x + 3221 0.9996
Purospher STAR
Active 2.5-100 y = 2361x + 1398.7 0.9999Serum 2.5-100 y = 2361x + 1398.7 0.9999
LC 20Hypersil,ODS
Active 2.5-100 y=2340.4x + 3022.3 0.9995Serum 2.5-100 y = 2339.4x + 3221 0.9996
Purospher STAR
Active 2.5-100 y = 2361x + 1398.7 0.9999Serum 2.5-100 y = 2361x + 1398.7 0.9999
Table 2: Regression statistics.
Systems LC 10 LC 20
Columns Conc. (µgmL-1)
Conc.Found(µgmL-1)
Recovery (%)
Conc. Found (µgmL-1)
Recovery (%)
Hypersil,ODS8 8.06 100.75 8.06 100.7510 9.89 98.9 9.98 99.812 12.3 102.5 12 100
Purospher STAR 8 7.99 99.875 8.03 100.375
10 9.89 98.9 10.03 100.0312 12.03 100.25 12.05 100.41667
Table 3: Accuracy of enalapril.
Precision
Precision of the proposed method was determined by repeatability (intra-day precision) and intermediate precision (inter-day precision). It was expressed as relative standard deviation (RSD). Six different con-centrations of ENP in the linear range were analyzed in the same day (intra-day precision) and two consecutive days (inter-day precision); every sample was injected five times. Both intra- and inter-day RSD val-ues were in the range 0.07-1.25% confirming good precision (Table 4). The results were insignificant and indicated no remarkable deference in interday and intraday precision.
Limit of detection and limit of quantification
The limits of detection (LOD) (was calculated by lowest concen-tration of ENP) and quantification (LOQ) were determined from the calibration curve. The LOD and LOQ were 3.9ngmL-1 and 12ngmL-1 respectively.
Robustness
Robustness was performed by making minor changes in the per-centage of mobile phase (methanol or water) wave length, pH and flow rate. Therefore, five repeated samples were injected under small varia-
Level tR K’ T (Rs)A: pH of mobile phase3.2 -0.2 2.2 2.5 1.51 2.373.5 0 2.4 2.6 1.53 3.03.7 0.2 2.6 2.2 1.58 2.35 S.D (n=6) 0.2 0.212132 0.036056 0.01B: Flow rate (mLmin-1)0.8 -0.2 2.6 2.1 1.56 2.321 0 2.4 2.6 1.53 3.01.2 0.2 2.2 2.5 1.51 2.37 S.D (n=6) 0.2 0.282843 0.025166 0.026458C: Percentage of water in mobile phase (V/V)90/10 -20 2.6 2.7 1.52 2.3970/30 0 2.4 2.6 1.53 3.080/20 -10 2.2 2.4 1.57 2.32 S.D (n=6) 0.2 0.212132 0.026458 0.035119C: Wavelength (nm)210 -5 2.5 2.7 1.52 2.39215 0 2.4 2.6 1.53 3.0220 5 2.3 2.5 1.59 2.33 S.D (n=6) 0.141421 0.141421 0.037859 0.03
tR = Retention time, K’= Capacity factors, T = Tailing factor, Rs = Resolution.
Table 5: Robustness of the method (n=6).
Column Purospher STAR Hypersil,ODS
Systems Conc. (µgmL-1)
Formulation (%RSD)
Serum (%RSD)
Formulation (%RSD)
Serum (%RSD)
Intra-day variation
Inter-day variation
Intra-day variation
Intra-day variation
Inter-day variation
Intra-day variation
LC 10
2.5 0.36 0.35 0.56 0.48 0.64 0.985 0.36 0.30 0.59 1.03 0.21 0.5610 0.36 0.50 0.52 0.42 0.37 0.3625 0.69 0.42 0.96 1.03 0.33 0.5450 0.45 0.26 0.69 0.23 0.30 0.38100 0.23 0.13 0.57 0.53 0.03 0.69
LC 20
2.5 0.69 0.33 0.39 0.17 0.33 0.575 0.86 0.75 0.48 0.42 0.33 0.3810 0.86 0.23 0.93 0.07 0.54 0.6925 0.06 0.39 0.36 0.22 0.07 0.3650 0.88 0.55 0.36 0.85 0.35 0.68100 0.22 0.29 0.56 0.07 0.61 0.36
Table 4: Precision of ENP.
Volume 3 • Issue 1 • 1000130J Anal Bioanal TechniquesISSN:2155-9872 JABT, an open access journal
Citation: Naveed S, Sultana N, Arayne MS (2012) HPLC-UV Method for the Determination of Enalapril in Bulk, Pharmaceutical Formulations and Serum. J Anal Bioanal Techniques 3:130. doi:10.4172/2155-9872.1000130
Page 4 of 4
ConclusionA simple and reliable HPLC method for determining in bulk, hu-
man serum and pharmaceutical dosage formulation has been success-fully developed. The limit of quantification, small sample volume and short chromatographic time of this method are particularly adapted for routine assay. The intra-run and inter-run variability and accuracy re-sults were in acceptable limit according to ICH guidelines. The short analysis time (< 5min) enables its application in routine and quality control analysis of finished products.
References
1. Sweetman SC (2005) Martindale: The Complete Drug Reference. Pharmaceu-tical press, London & Chicago 34: 900-901.
2. Dominic P Ip, Gerald S, Brenner (1987) Analytical Profiles of Drug Substances. Academic Press 16: 207-243.
3. Hosnieh T, Mehrdad H (2001) A simple HPLC method for quantitation of enala-prilat. J Pharm Biomed Anal 24: 675-680.
4. H. Trabelsi, Bouabdallah S, Sabbah F, Raouafi K, Bouzouita K (2000) Study of the Cis-trans isomerization of enalapril by reversed-phase liquid chromatogra-phy. J Chromatogr A 871: 189-199.
5. Yu C, Zhang H, Hong YC, Chen GL, Zhang Yaowu SM, Fenxi Z (1996) 16: 389-391.
6. Oklobdzija M, Kuftinec J, Hohnjec M, Kajfez F (1988) Physio-chemical and Analytical Characteristics of enalpril. Acta Pharm Jugosl 38: 167-181.
7. Stanisz B (1999) The application of vis spectrometric determination of enalpril maleate in substance, in tablets and estimation of ester group stability. Acta Pol Pharm-Drug Res 56: 431-434.
8. Prasad CVN, Saha RN, Parimoo P (1999) Simultaneous determination of am-lodipine-enalapril maleate and amlodipine-lisinopril in combined tablet prepara-tions by derivative spectrophotometry. Pharm Parmacol Commun 5: 383-388.
9. Hillaert S, W van den Bossche (2000) Optimization of capillary electrophoretic separation of several inhibitors of the angiotensin-converting enzyme. Journal of Chromatography A 895: 33-42.