how$to$build$asimple$ stateflow$ model$ - eth zürich · atzero$crossing$of$asine$input.$ $ •...
TRANSCRIPT

How to Build a Simple Stateflow Model
Jim Freudenberg University of Michigan
EECS 461: Embedded Control Systems

IntroducFon • This set of slides will show you how build a simple model using Simulink and Stateflow.
• We will use 32-‐bit Matlab release 2011b, the same version of Matlab as currently used in the EECS 461 Embedded Control Lab. • InstrucFons for installing 32-‐bit Matlab 2011b on your laptop are contained in the “Course LogisFcs” document on CTools • Recently Matlab has changed from models with a .mdl suffix to models with a .slx suffix. (The underlying soWware is different, and enables addiFonal features.) • If you insist on using a more recent version of Matlab, and you want me to examine your model for debugging, then you should save your model as a .mdl file In Matlab 2011b. Look for a “save as” command, or perhaps an “export” command. (Different versions of Matlab do this differently.)

Power Switch Simulink Model • Simulink model of a power switch that toggles on and off at zero crossing of a sine input. • At each switch, a counter is incremented

Inside the State Chart
• Two states of the power switch: on and off • TransiFons between the States happen whenever the event “switch” occurs. • When a transiFon occurs, the variable “counter” is incremented • By default, the iniFal state is “off”

To Run SimulaFon
• Open Scope by clicking on it • Run simulaFon by selecFng “start” from the SimulaFon menu • If the Scope does not display the enFre sine waveform, go to the Scope parameters menu, navigate to the History submenu, and turn off the “Limit data points” opFon. • Change the size or colors of the plo`ed lines using the Graphics submenu

Create Simulink Model
• Create a new Simulink model by selecFng File/New/Model in the Matlab command window. • Save the model with a name, e.g. “my_switch” • In the View Menu, select “Library Browser” and navigate down to Stateflow

Add Statechart to Simulink Model
• Drag Statechart to the Simulink model • Change name from “Chart” to “On_off”

Adding States to a Statechart • Open Statechart “On_off” by double-‐clicking • Drag two states from the menu at leW into the chart. • Name them “Power_on” and “Power_off” by ediFng the ? In the upper leW corner • NOTE: to delete a state, highlight it and select “Cut” from the “Edit” menu

CreaFng TransiFons between States • To create a transiFon between states, hold the cursor over the border of
the starFng state – it will turn into crosshairs. • Hold down the mouse bu`on drag the mouse to the terminal state – this will create a transiFon (denoted by an arrow) connecFng the states • Click on the transiFon and replace the resulFng ? with the name of the event that causes the transiFon.

Add a Default TransiFon • Specify the iniFal state (Power_off in this case) by adding a default transiFon

Adding an Event • Add an event that is “Input from Simulink” • A window will open allowing you to name the event (call it Switch), and to specify what triggers the event. In our case, use rising edges of a sine wave. • If you add mulFple events input from Simulink, the Port menu will have more than opFon.
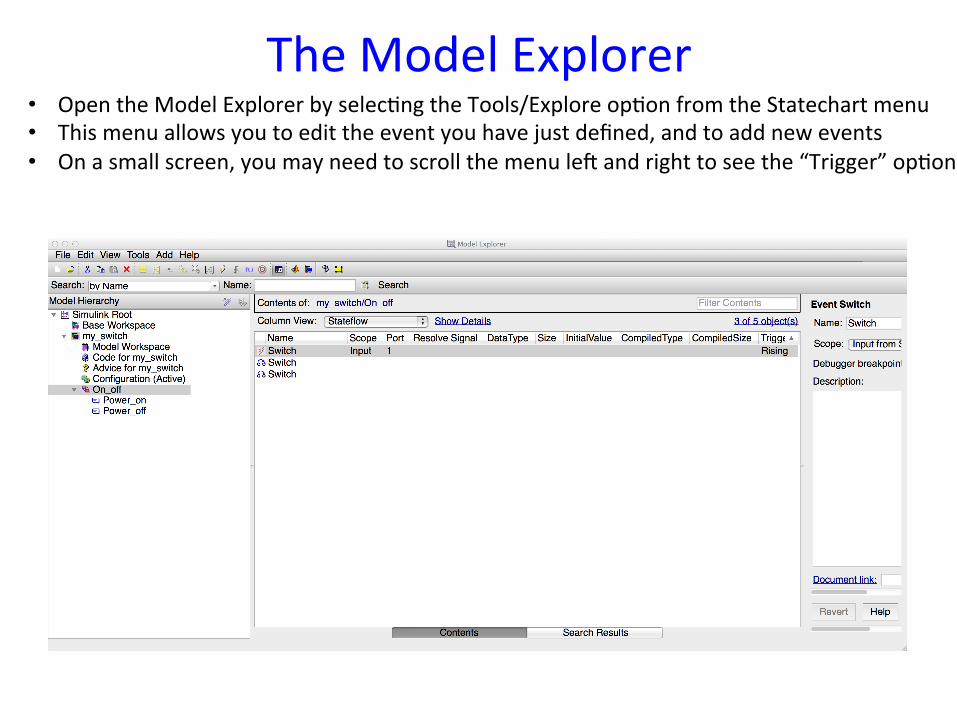
The Model Explorer • Open the Model Explorer by selecFng the Tools/Explore opFon from the Statechart menu • This menu allows you to edit the event you have just defined, and to add new events • On a small screen, you may need to scroll the menu leW and right to see the “Trigger” opFon

Adding the Sine Input • Return to the top-‐level Simulink diagram • The Statechart “On-‐off” now has an arrow entering it. • Add a Sine Wave input from the View/Library Browser/Sources menu • Add a Scope from the View/Library Browser/Sinks menu • Use the mouse to connect these blocks. • Double click on the Sine Wave block and specify the parameters as shown.
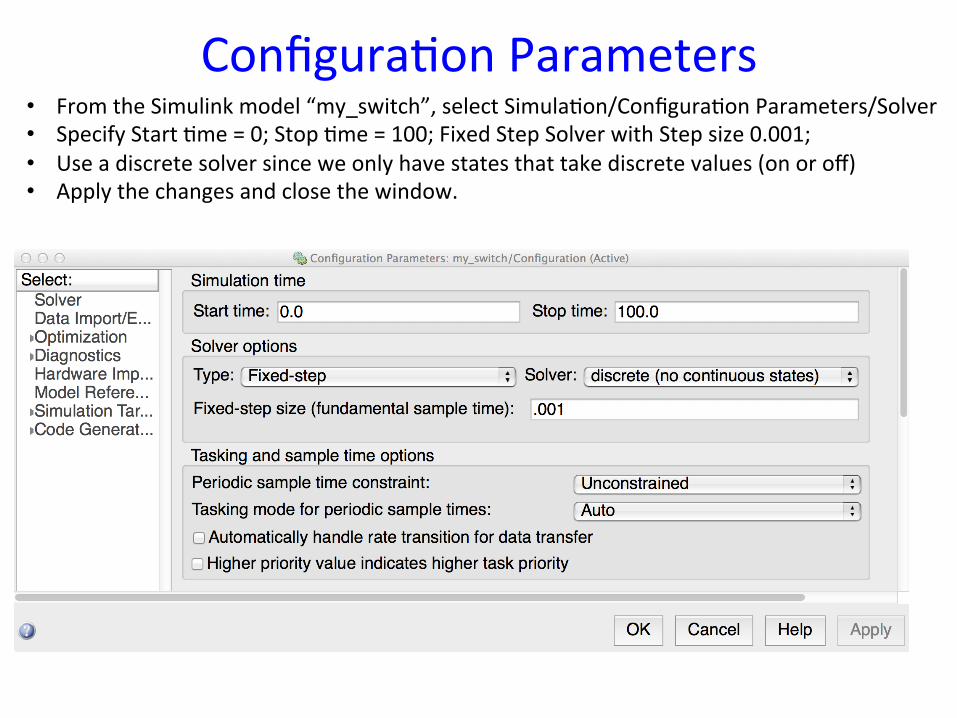
ConfiguraFon Parameters • From the Simulink model “my_switch”, select SimulaFon/ConfiguraFon Parameters/Solver • Specify Start Fme = 0; Stop Fme = 100; Fixed Step Solver with Step size 0.001; • Use a discrete solver since we only have states that take discrete values (on or off) • Apply the changes and close the window.
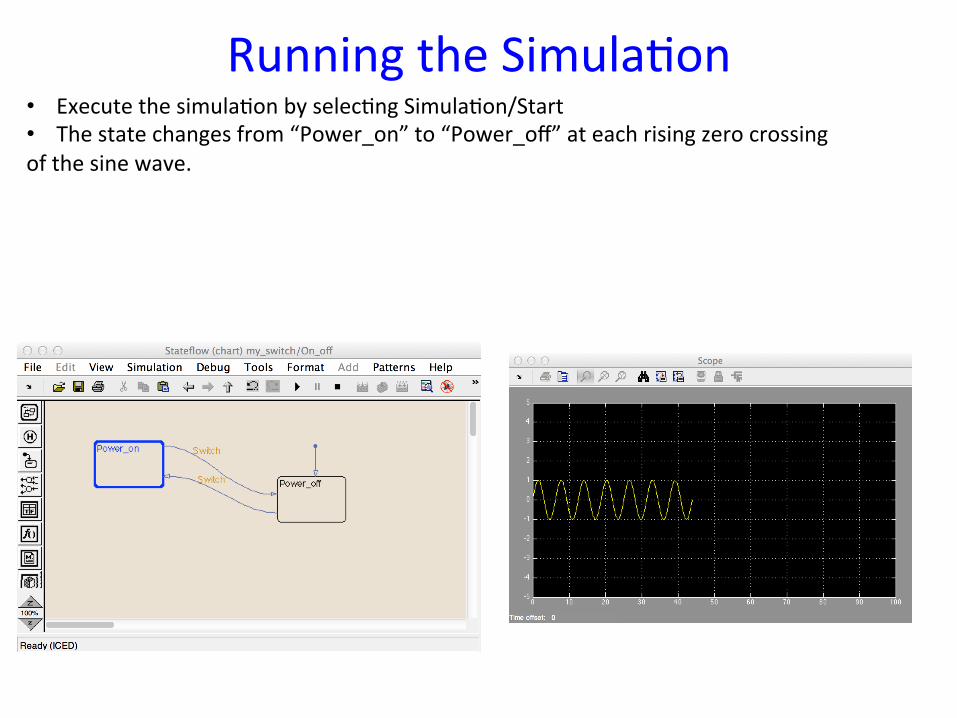
Running the SimulaFon • Execute the simulaFon by selecFng SimulaFon/Start • The state changes from “Power_on” to “Power_off” at each rising zero crossing of the sine wave.

CounFng TransiFons • Add data that is “Output to Simulink” • A window will open allowing you to name the data (call it “counter”), and to specify its data type: leave it set to the default “double”. • Leave “iniFal value” blank to use the default value of zero

Increment the Counter • Increment the counter every Fme the event “Switch” occurs by placing “counter++” in curly braces following each occurrence of Switch • Don’t forget to use a semicolon to prevent the value of counter from being printed to the screen each Fme it is incremented.

Count the TransiFons • Add a display block from the View/Library Browser/Sinks menu

Toggle a Bit • Add a new data variable “light”: iniFal value 0, data type double • Set “light = 0;” in the Power_off state • Set “light = 1;” in the Power_on state

Change Port Values • The output “light” is assigned port 2 by default • To connect it to the scope requires signal flow lines to cross à bad modeling pracFce. • To make model more readable, change port value for “light” from 2 to 1 • Note port value for “counter” is now 2

Display a Square Wave • Connect the output “light” to the scope used to display the sine wave using a “Mux” block from the Library Browser/Signal RouFng Menu
• Running the simulaFon shows a square wave that toggles between 0 and 1 at rising zero crossings of the sine wave • To make thicker lines on the plots, double-‐click the Scope. In the Parameters/Graphics menu, set linewidths to 2.