howit ispropagatinginnovations and acceleratingcompetition
TRANSCRIPT

Professor Erik Brynjolfsson
MIT Center for Digital Business MIT Sloan Schoolhttp://digital.mit.edu
Generous support for this research was provided by the National Generous support for this research was provided by the National Science Foundation and the MIT Center for Digital Business.Science Foundation and the MIT Center for Digital Business.Copyright © 2009 Erik Brynjolfsson. Reproduction prohibited 1
How IT is Propagating Innovations
and Accelerating Competition
2

3
Source: The Conference Board and Groningen Growth and Development Centre, Total Economy Database, January 2007, http://www.ggdc.net.Notes: Labor productivity is defined as real GDP per hour worked. Trend estimates are based on a Hodrick-Prescott filter with a smoothing parameter of 100.
4
5
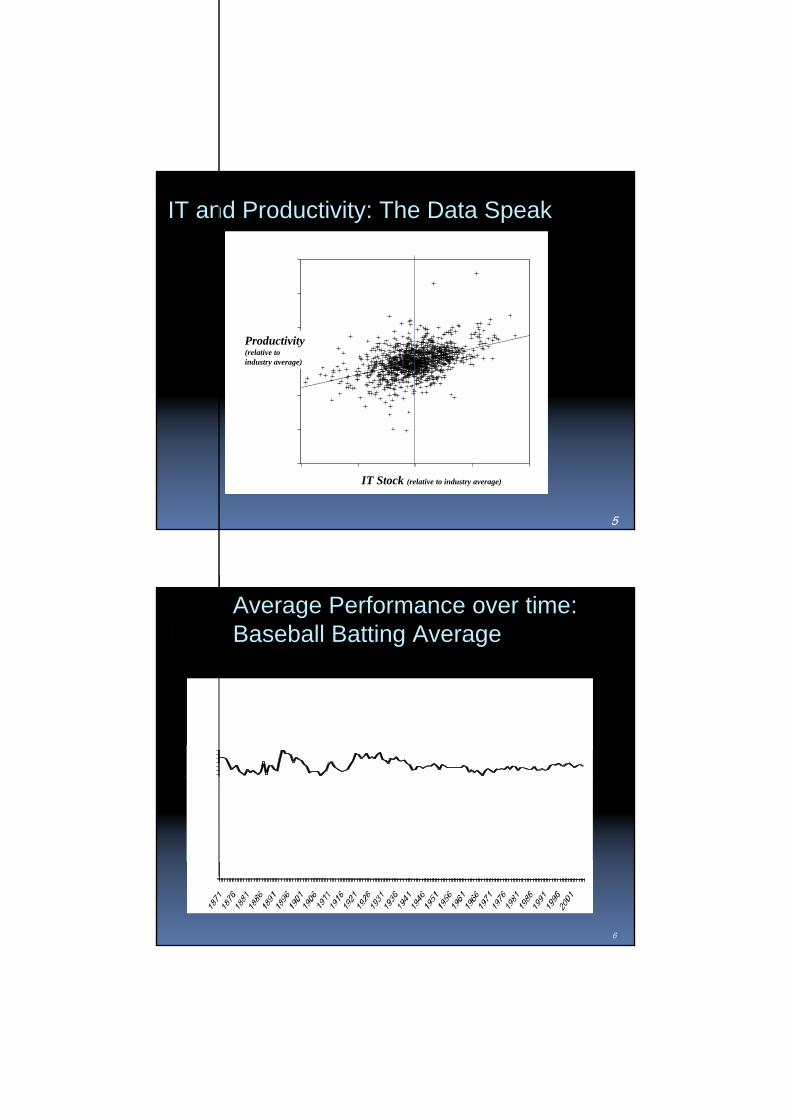
IT and Productivity: The Data Speak
IT Stock (relative to industry average)
Productivity(relative to industry average)
Average Performance over time:Baseball Batting Average
6

Spread Around the Average
7
Baseball Data
“… I never dreamed that the decline of variation would be so regular… the decline of standard deviations for batting averages is so regular that the pattern [in the graph] looks like a law of nature… I can assure you that this pattern represents regularity with a vengeance.”- Stephen Jay Gould, Full House
8

The Full House Hypothesis
“Complex systems improve when the best performers play by the same rules over extended periods of time. As systems improve, they equilibrate and variation decreases.”- Stephen Jay Gould, Full House
9
The Real Quantity of IT
Real US Corporate IT Stock
0
40
80
120
160
1965 1970 1975 1980 1985 1990 1995 2000 2005
IT S
toc
k, n
orm
aliz
ed (
year
200
0 =
10
0)
10

The Information Explosion
Digital Information is Doubling Every 1.2 years
The size of the largest data warehouses is tripling every two years
Exceeds processor growth predicted by Moore’s law
Compiled from Industry Sources,Richard Winter and The Data Warehousing Institute
11
Our Hypothesis
Hypothesis: The IT discontinuity starting in the mid 1990s represents a significant ‘rules change’ for business, and is associated with an increase in performance spread
12

20 high IT industries
20. Fabricated metal product manufacturing
19. Motion picture and sound recording
18. Electrical equipment and appliance mfg.
17. Miscellaneous manufacturing
16. Chemical manufacturing
15. Wholesale trade
14. Motor vehicle, body, trailer, & parts mfg.
13. Machinery manufacturing
12. Computer and electronic product mfg.
11. Credit intermediation and related activities
10. Other transportation equipment mfg.
9. Legal services
8. Rental and leas. serv. & lessors
7. Insurance carriers and related activities
6. Administrative and support services
5. Publishing industries
4. Securities, commodity contracts, investments
3. Other prof., scientific and technical svces
2. Information and data processing services
1. Computer syst. design and related services
8 Manufacturing3 Financial Services6 Other Services3 Other
13
Corporate Performance Spread
0
10
20
30
40
50
60
Intra-Quartile Range
Performance Spread: Gross Profit Margin
Low IT Industries
14

Corporate Performance Spread
0
10
20
30
40
50
60
Intra-Quartile Range
Performance Spread: Gross Profit Margin
Low IT Industries
High IT Industries
15
Other Performance Measures
Gross Profit Margin EBITDA Margin Profit Margin ROA ROE Tobin’s Q Market value / revenue
For each metric, there has been a statistically significant increase in performance spread in IT intensive industries
16

17
Average EBITDA margin by industry category, 1960-2004
Performance Spread (IQR) Increased
High IT Industries
Low IT Industries
Medium IT Industries
18
What Do the Winners Do?
19
Experiment
&
Scale
20
Experiment
20

21
Experimentation has never been easier
A-B experiments at Amazon (and at MIT E53-313)
22
Question: How often does Google run field experiments?

From 21 to… $30.7
Billion�Gary Loveman• Zero executive experience
• Zero background in Casinos
• But, an MIT PhD who knows how to make numbers talkResults• Transformed Harrah’s from second tier to number one gaming company in the world
• Completed a $30.7 Billion LBO
• Introduced a culture of pervasive field experimentation
• “There are two ways to get fired from Harrah’s…”
“We have come out on top in the casino wars by mining our customer data deeply, running marketing experiments and using the results to develop and implement finely tuned marketing and services strategies that keep our customers coming back.”
•-- Gary Loveman, CEO, Harrah’s23
Other ExamplesGoogle
Page rank algorithm 2008 is very different from 1999 algorithm Advertising auctions are continuously fine tuned Even HR – are you a record-holder in something?
Netflix How do YOU pick your next movie?
Tesco From #2 to #1
VA Hospitals “Evidence based medicine”
Capital One Credit card offers tests
Call Center Employee incentives and customer service
Schools in Africa Digital cameras reduce teacher absenteeism
Field Experiments with rapid feedback = R&D
24

25
Scale
26
What Does IT Do?
1. Replicate Bits

27
28
What Does IT Do?
1. Replicate Bits2. Replicate Processes

29
Case Study: CVS
Basic ‘script fulfillment process:
• 27% of scripts encountered a problem
• 16% of customers disappointed at pick-up
Quality
Assurance
INVENTORY
INVENTORY
Drop-offDataEntry
ProductionQuality
AssurancePick-up
Standardscript path
Data entry
RPh
RPh
Shelves
Dr. call or
Production
ConsultareaDrop-off
Pick-up
Quality
Assurance
INVENTORY
INVENTORY
Drop-offDataEntry
ProductionQuality
AssurancePick-up
Standardscript path
Data entry
RPh
RPh
Shelves
Dr. call or
Production
ConsultareaDrop-off
Pick-up
1 hour before pick-up1st step = drug utilization review (DUR)
2nd step = insurance check
30
CVS: Scale without Mass
• Short-term results: customer satisfaction scores Wait time satisfaction: 76 86 Overall pharmacy satisfaction: 86 91
• New process embedded in Enterprise IT (EIT) 100% compliance
• Rapid roll-out to over 4000 retail pharmacies
Drop -offDataEntry
Insurancecheck
Production DUR QA Pick -up
While customer is present
Drop -offDataEntry
Insurancecheck
Production DUR QA Pick -up
While customer is present
New fulfillment process:

31
Emerging Technologies
Cloud Computing- From Custom to Components- Conway’s Law- Scale and Flexibilty
Enterprise 2.0- Enterprise Wikis- Social Networks
Many-to-many knowledge sharing within a companies community of employees, customers and suppliers
Thousands of small ideas from hundreds of users
Cloud Scalability Amazon Customer: Animoto
On April 14th 2008 Animoto provided a new plugin for facebook …
http://blog.animoto.com/
32

33
Case Study: Cisco Mac Wiki
- Over 10,000 Macintosh users at Cisco, but no central IS support
- A few users established a wiki, where users could post tips, tricks, files, links and other content- Example: tip for using the Linux printers which
were ubiquitous at Cisco
- Many users all over world got up to speed entirely via Mac Wiki
- Thousands of small ideas from hundreds of users
34
IT Has Reduced the Costs of Experimenting and Scaling

35
Experiment
Scale
Synergies Amplify their Benefits
36
4 Facts 3 Hypotheses
1. IT makes it easier to experiment and then replicate innovations Experimentation Platform Share successes and insights Propagate best practices Monitoring and compliance
2. Boundary of firm remains important• Brynjolfsson, Hitt and Yang, 2004, etc• B&N vs. Amazon; K-mart vs. Wal-mart,
etc.
3. IT discontinuity Soaring MIPS, bps, storage, etc. Enterprise IT (ERP, etc) Cloud computing and Web 2.0
4. Business Innovation continues Alta Vista vs. Lycos vs. Yahoo vs. Google Merrill/Schwab/Merrill/Schwab
1. High IT industries should have experienced greater Performance Spread
2. High IT industries should have experienced greater Turbulence
3. High IT industries should have experienced greater Concentration growth
==> More “Schumpeterian”competition throughout economy, not just high tech industries

37
Data
• Industry Concentration, Performance and Turbulence (Compustat) Revenue (SALES) and enterprise value (EV) Turbulence: the average rank change of all firms in that
industry Concentration growth rate: % change in Herfindahl index
(HI)
• IT Intensity of an Industry (Bureau of Economic Analysis) IT capital service flow as a share of total capital service flow
(1987-2004): 63 industries
• Weights (Bureau of Economic Analysis) Full-time employees (FTE) National Income and Product Accounts
38
Average EBITDA margin by industry category, 1960-2004
Performance Spread (IQR) Increased
High IT Industries
Low IT Industries
Medium IT Industries

39
Average sales turbulence by industry category, 1960-2004
High IT-using Industries
Medium IT-using Industries
Low IT-using Industries
Sales Turbulence Increased
40
Average C20 index by industry category, 1965 2004
Medium IT Industries
Concentration Increased
High IT Industries
Low IT Industries
41
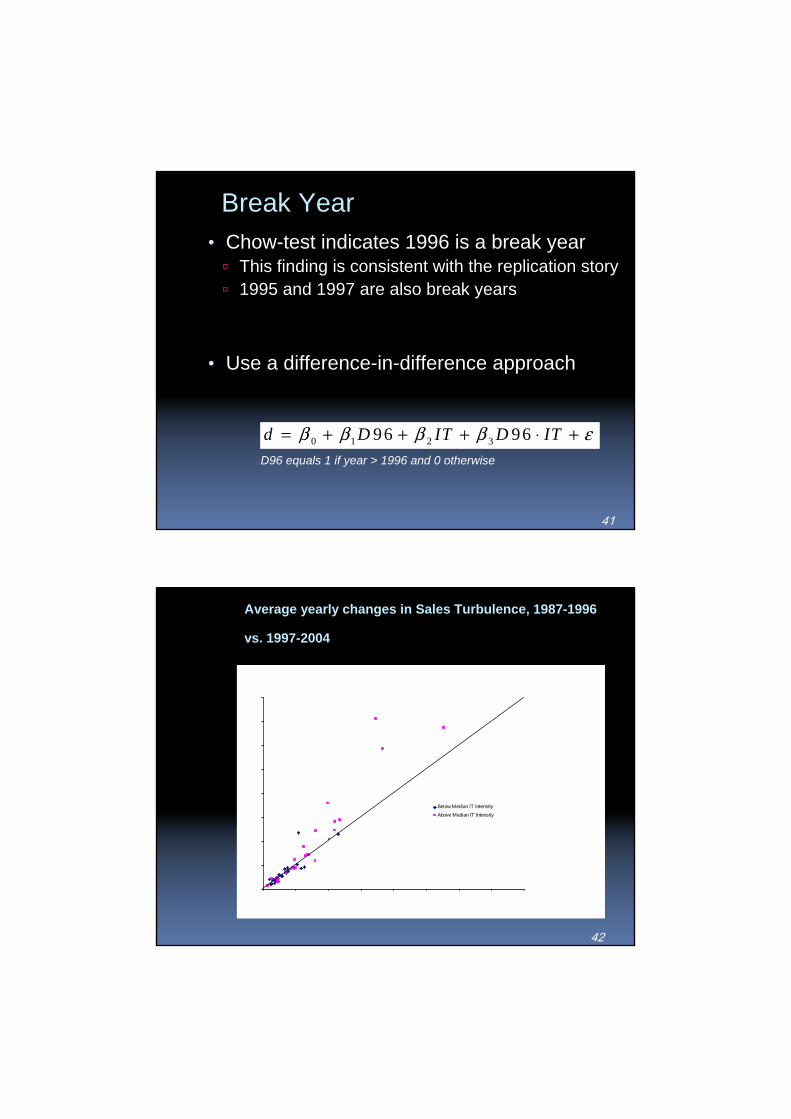
Break Year• Chow-test indicates 1996 is a break year This finding is consistent with the replication story 1995 and 1997 are also break years
• Use a difference-in-difference approach
0 1 2 396 96d D IT D ITβ β β β ε= + + + ⋅ +D96 equals 1 if year > 1996 and 0 otherwise
42
Average yearly changes in Sales Turbulence, 1987-1996
vs. 1997-2004
Below Median IT Intensity
Above Median IT Intensity

43
Model 1 2 3 4 5 60.56*** 0.30*** 0.93*** 0.23 0.68*** 0.36(0.17) (0.08) (0.15) (0.18) (0.25) (0.64)0.99** 0.68*** 1.20*** 0.81*** 1.16*** -0.77*(0.42) (0.24) (0.42) (0.28) (0.40) (0.47)
0.57** 0.787** 0.77***(0.27) (0.36) (0.18)
0.041*** 0.04*** 0.033*** 0.04*** 0.032*** 0.05***(0.00) (0.00) (0.00) (0.00) (0.00) (0.00)
Weights yes yes yesIndustry fixed effects yes
Drop Outliers yes yes yes yes yesDrop low-density industries yes yes yes yes yes
Observations 1096 936 936 936 936 936Number of industries 61 52 52 52 52 52
R-squared 0.74 0.77 0.91 0.77 0.90 0.94
IT-intensity
Post-1996 dummy
Post-1996 dummy * IT-intensity
# of firms
Turbulence: Sales
44
Average yearly changes in the Herfindahl Index of sales, 1987-1996 vs. 1997-2004
-15
-10
-5
0
5
10
15
20
25
30
15 -10 -5 0 5 10 15 20 25 30
Below Median IT Intensity
Above Meidan IT Intensity

45
Concentration Growth: Sales
Model 1 2 3 4 5 6-0.165 -0.207 -0.843 -0.576 -1.853*** -0.55(0.32) (0.31) (0.52) (0.40) (0.72) (3.54)
4.685*** 3.534*** 4.335*** 3.172*** 3.601*** -9.380***(0.81) (0.82) (0.90) (0.92) (0.92) (3.47)
0.833 2.066** 6.034***(0.57) (1.02) (1.49)
0.001 0.002* 0.058*** 0.00 0.007*** -0.008*(0.00) (0.00) (0.02) (0.00) (0.00) (0.00)
Weights yes yes yesIndustry fixed effects yes
Drop Outliers yes yes yes yes yesDrop low-density industries yes yes yes yes yes
Observations 1098 954 954 954 954 954Number of industries 61 53 53 53 53 53
R-squared 0.04 0.03 0.01 0.02 0.06 0.19
IT-intensity
Post-1996 dummy
Post-1996 dummy * IT-intensity
# of firms
46
Conclusions
1. We’re in the midst of a discontinuity in the economy Leaders are pulling away from laggards
2. The improved ability of firms to experiment and then replicate business processes, via IT, appears to be associated not only with productivity, but also withchanges in the nature of innovation and competition
• More turbulence• More concentration• More performance heterogeneity More “Schumpeterian”
3. Other explanations (e.g. R&D) may also be factors.4. These trends may not persist Investments in IT and EIT may tail off Replication may become easier across firm boundaries

47
Questions?
To learn more, see
http://digital.mit.edu/erik
andBrynjolfsson and McAfee “The Future of the Web:
Beyond Enterprise 2.0”, MIT Sloan Management Review, Vol. 48. No. 3, 2007.
McAfee and Brynjolfsson “Investing in the IT That Makes a Competitive Difference” Harvard Business Review, July-August 2008 (Special Centennial edition)
48
Implications for Managers
1. Heightened value of innovation Adjust recruiting, retention and incentives systems Innovations can be big or small
2. Invest in technologies and platforms that encourage, aggregate, codify and/or propagate innovations
- ERP/SCM/CRM etc.- Cloud computing, Enterprise-strength Web 2.0
and Social networking
3. Manage for innovation and agility Adjust recruiting, retention and incentives systems Innovations can be big or small Run field experiments to test your ideas

Experiments at Harrah’sCritical Success Factor at Harrah’s: Acquiring and upselling customers
Flexible IT platform for:1. Microtargeting - not blanket offers2. Continuous Experimentation3. Computing and maximizing lifetime total value, not just transaction value4. Indentify marginal behavior, not average behavior
- Info Econ 101: “Information is only valuable if it changes behavior”5. Loyalty program: 15% revenues returned as incentives
Total Gold Program at Harrah’s$11k Diamond$7K PlatinumStart Gold
What are Critical Success Factors at Novartis?
What types of experiments could you enable?50