how you can save energy & money with building performance analysis
TRANSCRIPT

How You Can Save Energy & Money with Building Performance Analysis
Michelle M. Farrell LEED AP, DGNB
Head of European Division
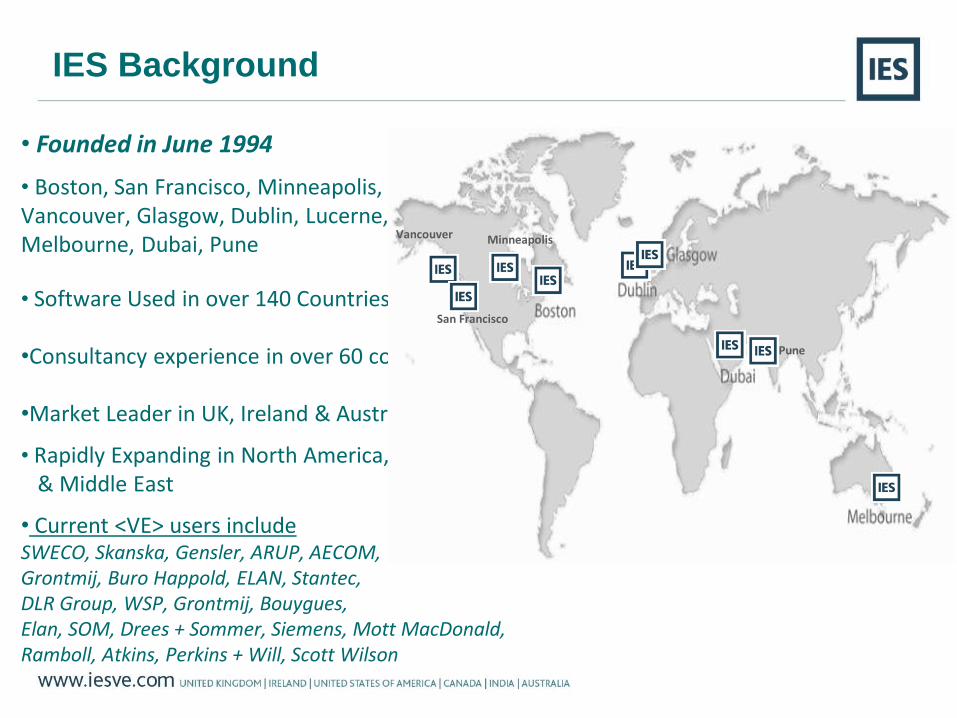
IES Background
• Founded in June 1994
• Boston, San Francisco, Minneapolis, Vancouver, Glasgow, Dublin, Lucerne,Melbourne, Dubai, Pune
• Software Used in over 140 Countries
•Consultancy experience in over 60 countries
•Market Leader in UK, Ireland & Australia
• Rapidly Expanding in North America, Europe & Middle East
• Current <VE> users includeSWECO, Skanska, Gensler, ARUP, AECOM, Grontmij, Buro Happold, ELAN, Stantec, DLR Group, WSP, Grontmij, Bouygues, Elan, SOM, Drees + Sommer, Siemens, Mott MacDonald, Ramboll, Atkins, Perkins + Will, Scott Wilson
Vancouver Minneapolis
Pune
San Francisco

Who is the typical energy analysis user?
ARCHITECTURAL- Designers- Architects- Master planners- Urban designers- Interior Designers
GREEN CONSULTANTS- BREEAM- LEED- DGNB- Estidama- Required by code- Other “green” rating systems
ENGINEERS- HVAC- Mechanical- Electrical- Building Physics- Other “green” rating
systems
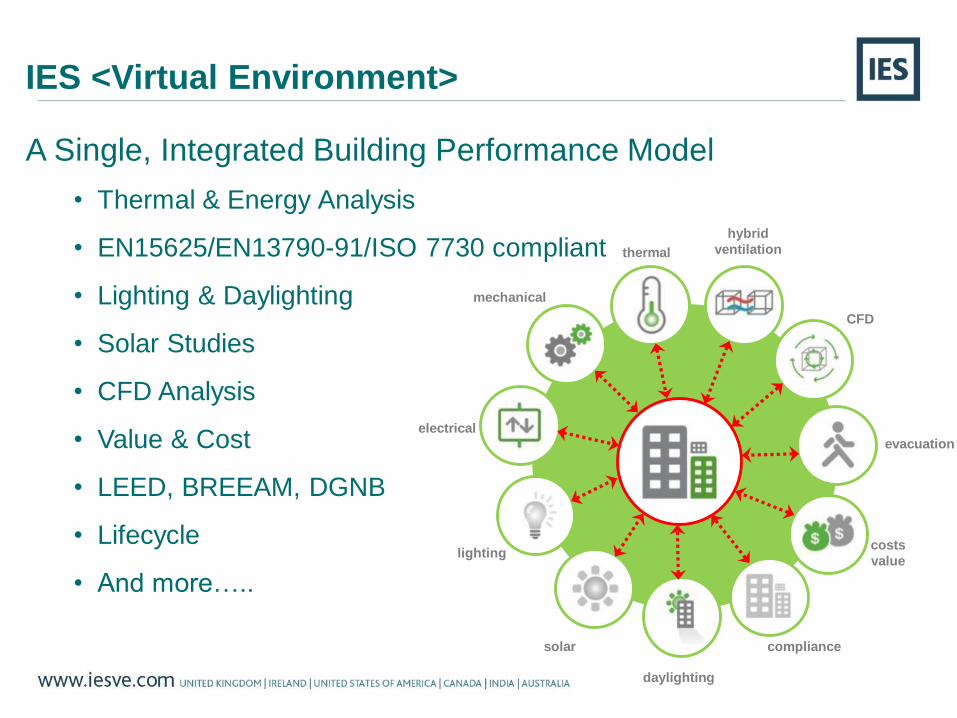
IES <Virtual Environment>
A Single, Integrated Building Performance Model
• Thermal & Energy Analysis
• EN15625/EN13790-91/ISO 7730 compliant
• Lighting & Daylighting
• Solar Studies
• CFD Analysis
• Value & Cost
• LEED, BREEAM, DGNB
• Lifecycle
• And more…..xx
thermal
hybrid
ventilation
CFD
evacuation
costs
value
compliance
daylighting
solar
lighting
electrical
mechanical
These facts all come from “The Business Case for Green Building” which was published by the World Green Building Council.
You can find links to this document on the Intelligent BIM Solutions website.
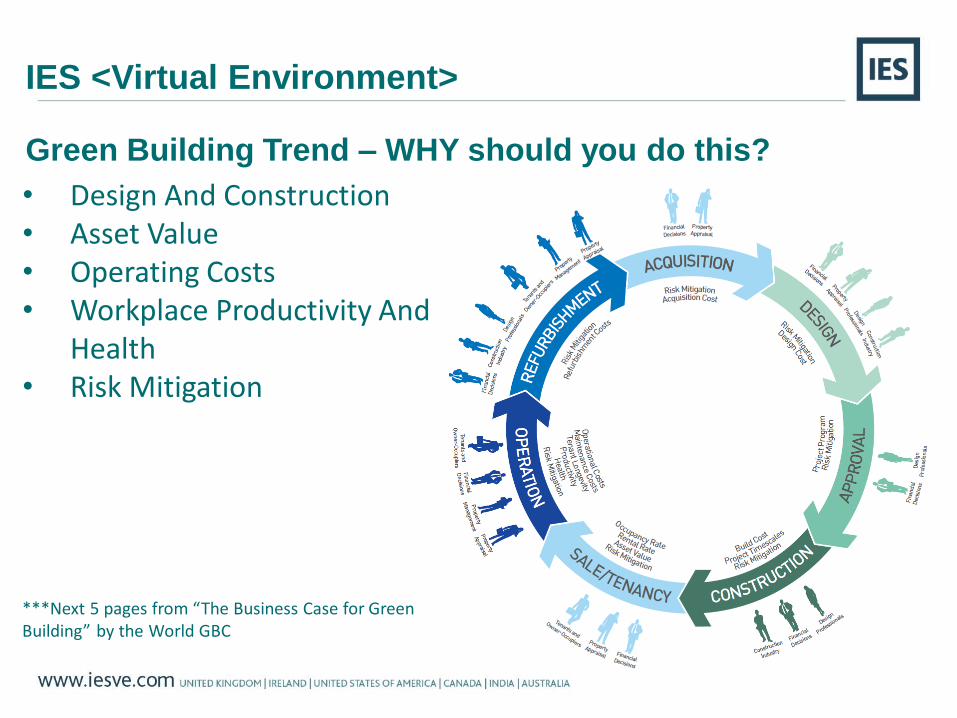
IES <Virtual Environment>
Green Building Trend – WHY should you do this?
• Design And Construction• Asset Value• Operating Costs• Workplace Productivity And
Health• Risk Mitigation
***Next 5 pages from “The Business Case for Green Building” by the World GBC

IES <Virtual Environment>
Design and Construction
Benefits
Investment Costs:Costs are not always as high as developers initially believe – and can range from 0% - 12.5% increase in design and construction costs verses conventional code buildings.
Also, involvement in the design process earlier significantly reduces costs.
IES <Virtual Environment>
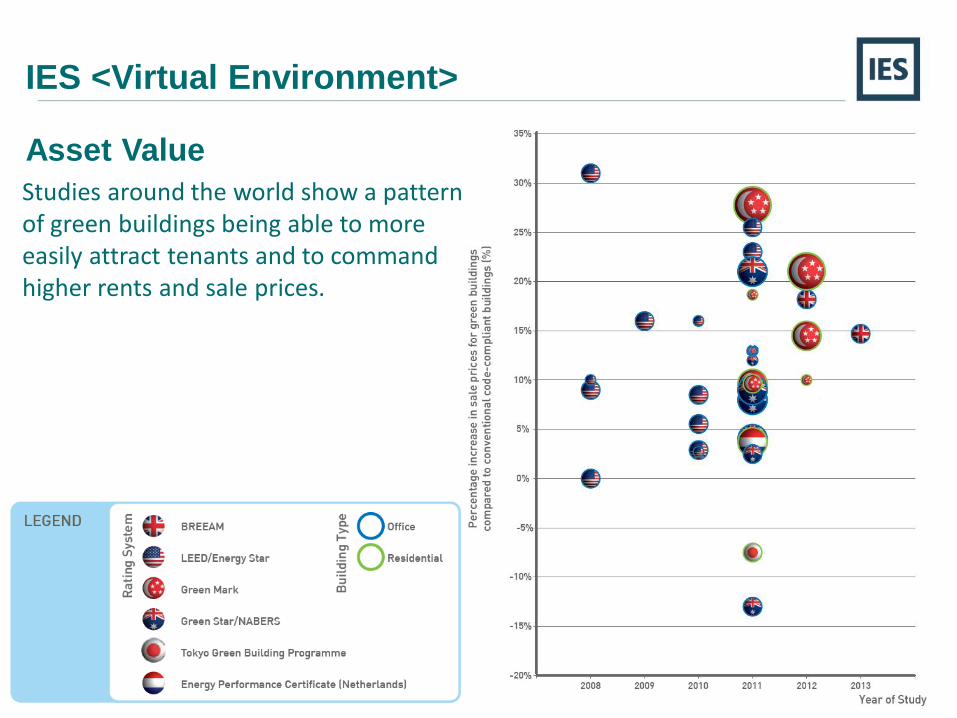
Asset Value
Studies around the world show a pattern of green buildings being able to more easily attract tenants and to command higher rents and sale prices.

The Business Case for Green Building
Asset Value
Where green buildings have generated higher sales prices, this increase in value is largely driven by higher rental rates, lower operating costs, higher occupancy rates and lower yields.
The Business Case for Green Building
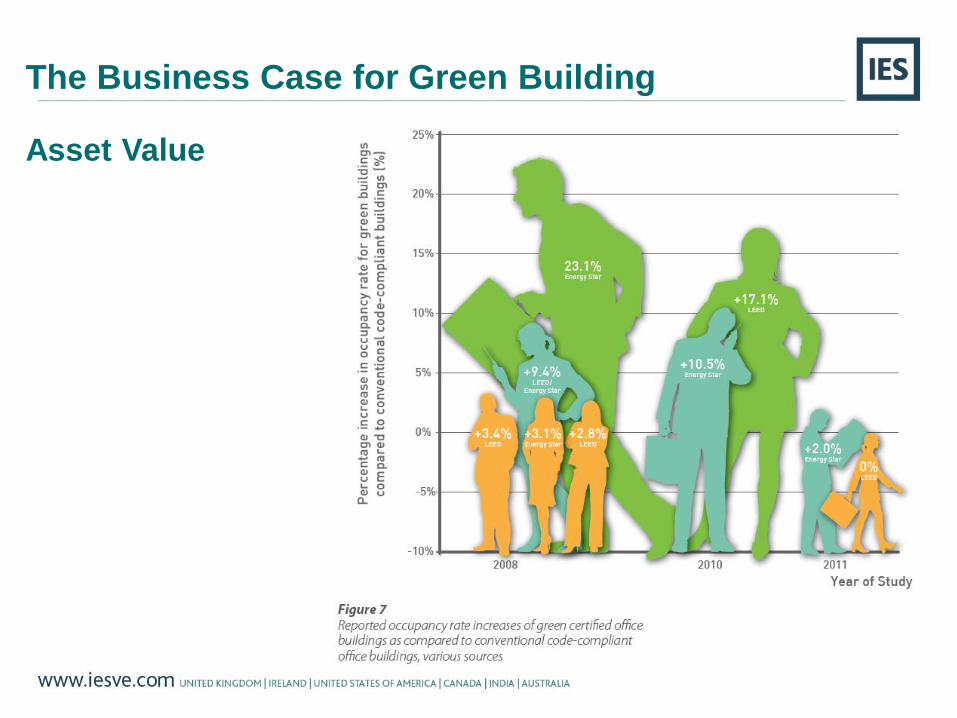
Asset Value
The Business Case for Green Building
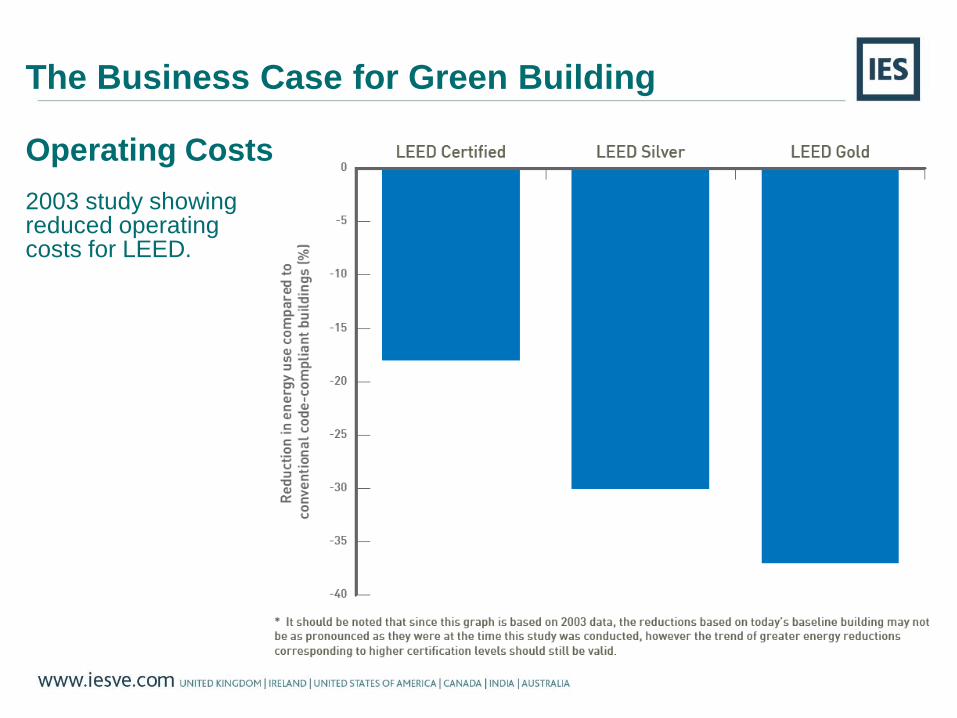
Operating Costs
2003 study showingreduced operating costs for LEED.
The Business Case for Green Building
Example Marketing Video
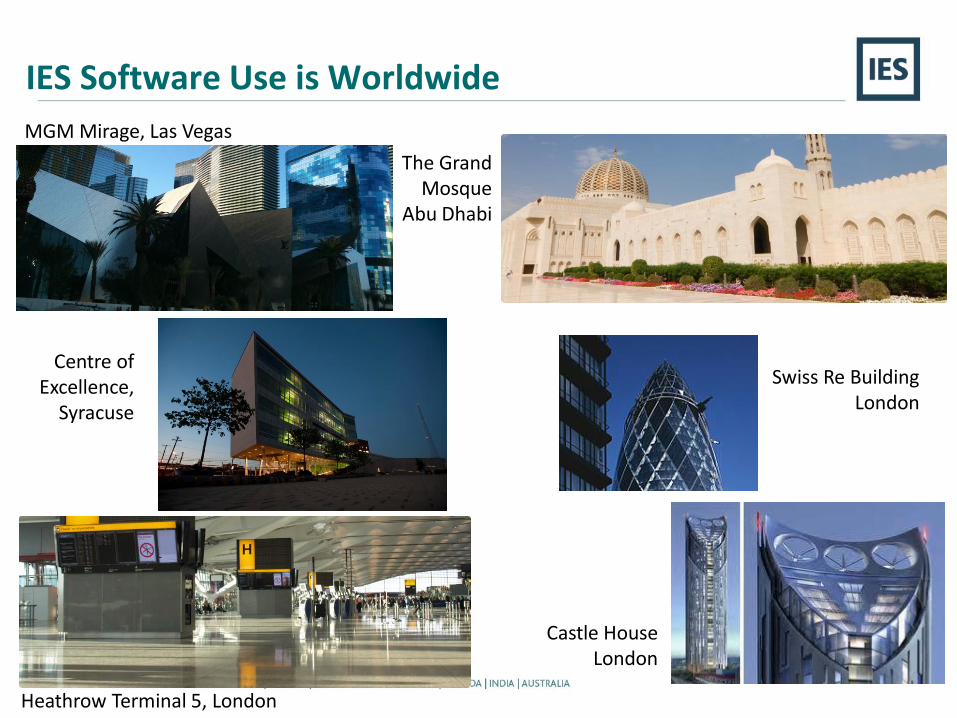
Swiss Re Building London
Castle House London
MGM Mirage, Las Vegas
Heathrow Terminal 5, London
The Grand Mosque
Abu Dhabi
Centre of Excellence,
Syracuse
IES Software Use is Worldwide

“The Walgreens team reviewed internal loads such as refrigerated coolers by the checkout counters and under shelf lighting. While seemingly small loads, they added up and had a compound effect on load reduction when removed. This allows for HVAC systems to be smaller, and the store has moved closer to the net-zero goal. After reviewing lighting systems and the refrigeration systems, it was determined what the typical energy signature would be for the store, and the remaining energy use will be offset by a large solar array covering the entire store roof.”
Benjamin Skelton, P.E., President and CEO of the Cyclone Energy Group (CEG)
• Innovative use of a geo-exchange coupled CO2 triple temperature refrigeration system provides all freezer, cooler, store HVAC and domestic water pre-heat. The combined system allows for free transfer of heat between uses. For instance, rejected heat from cooling the freezers and coolers is used for water heating and store heat.
• Using CO2 refrigerants (which is more environmentally friendly)
• PV / Solar Panels• Daylight Harvesting• Automated Shades• Geothermal• CO2 refrigeration• Energy recovery
Walgreen’s Net Zero Energy Retail Store
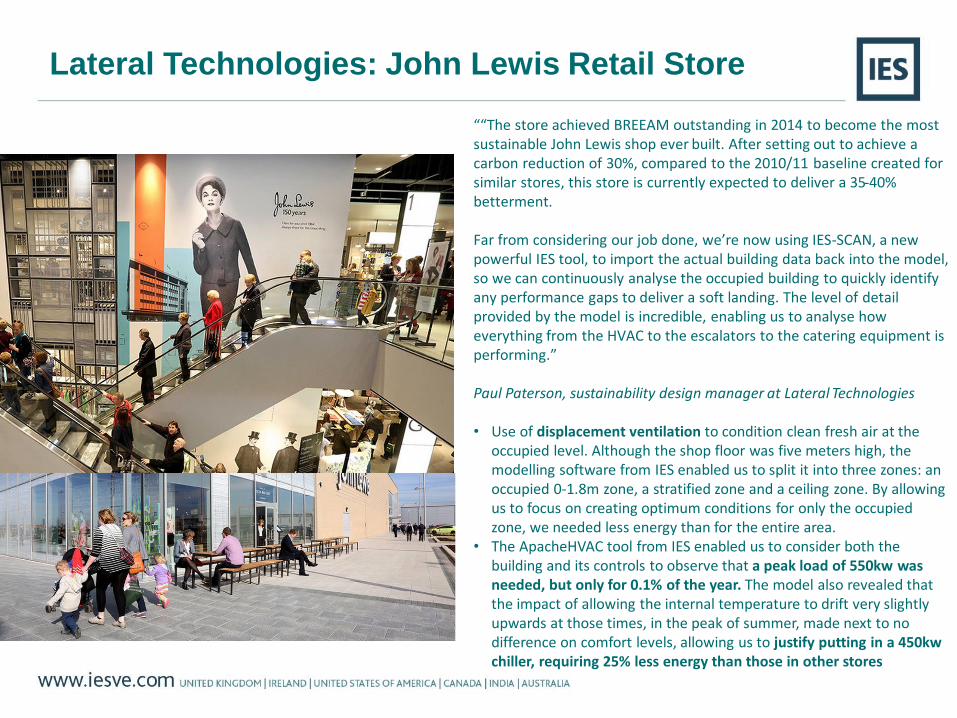
““The store achieved BREEAM outstanding in 2014 to become the most sustainable John Lewis shop ever built. After setting out to achieve a carbon reduction of 30%, compared to the 2010/11 baseline created for similar stores, this store is currently expected to deliver a 35-40% betterment.
Far from considering our job done, we’re now using IES-SCAN, a new powerful IES tool, to import the actual building data back into the model, so we can continuously analyse the occupied building to quickly identify any performance gaps to deliver a soft landing. The level of detail provided by the model is incredible, enabling us to analyse how everything from the HVAC to the escalators to the catering equipment is performing.”
Paul Paterson, sustainability design manager at Lateral Technologies
• Use of displacement ventilation to condition clean fresh air at the occupied level. Although the shop floor was five meters high, the modelling software from IES enabled us to split it into three zones: an occupied 0-1.8m zone, a stratified zone and a ceiling zone. By allowing us to focus on creating optimum conditions for only the occupied zone, we needed less energy than for the entire area.
• The ApacheHVAC tool from IES enabled us to consider both the building and its controls to observe that a peak load of 550kw was needed, but only for 0.1% of the year. The model also revealed that the impact of allowing the internal temperature to drift very slightly upwards at those times, in the peak of summer, made next to no difference on comfort levels, allowing us to justify putting in a 450kw chiller, requiring 25% less energy than those in other stores
Lateral Technologies: John Lewis Retail Store
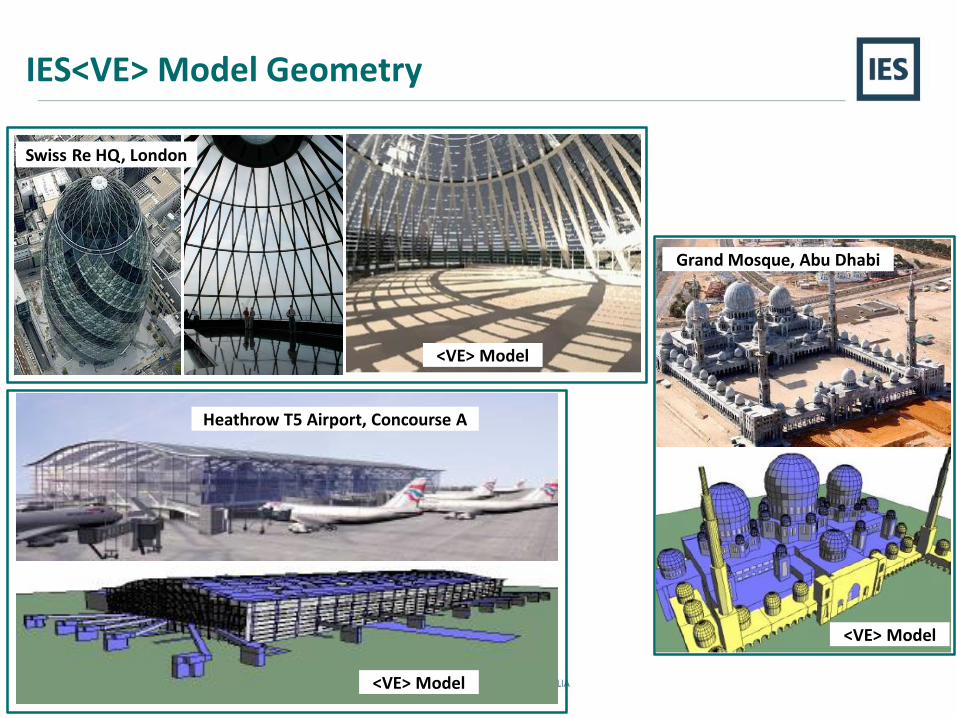
IES<VE> Model Geometry
Swiss Re HQ, London
<VE> Model
<VE> Model
Grand Mosque, Abu Dhabi
<VE> Model
Heathrow T5 Airport, Concourse A
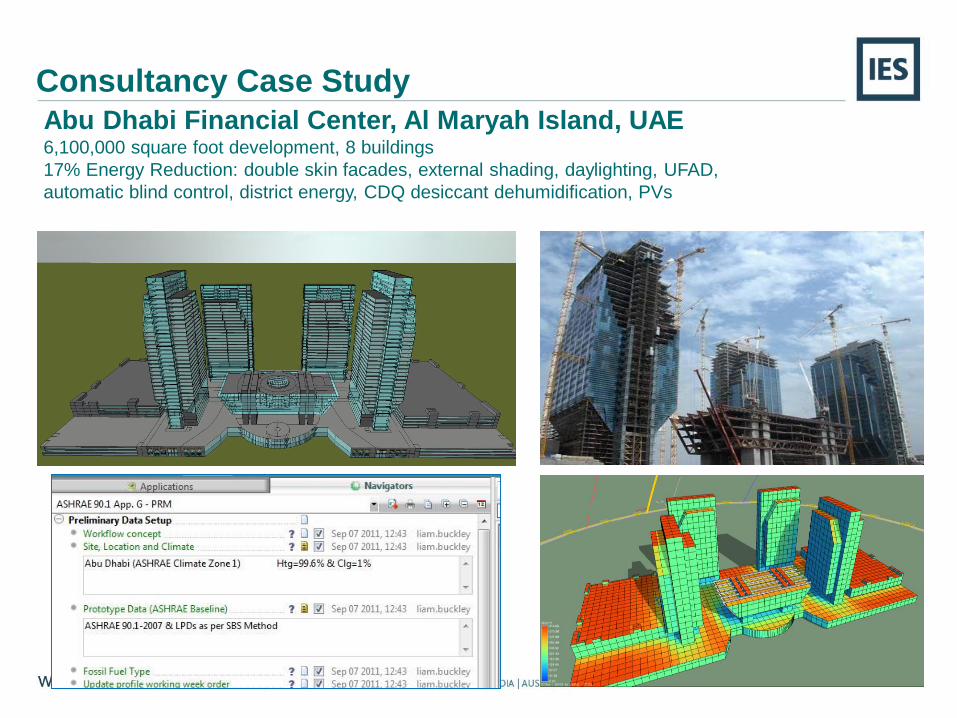
Consultancy Case StudyAbu Dhabi Financial Center, Al Maryah Island, UAE6,100,000 square foot development, 8 buildings
17% Energy Reduction: double skin facades, external shading, daylighting, UFAD,
automatic blind control, district energy, CDQ desiccant dehumidification, PVs
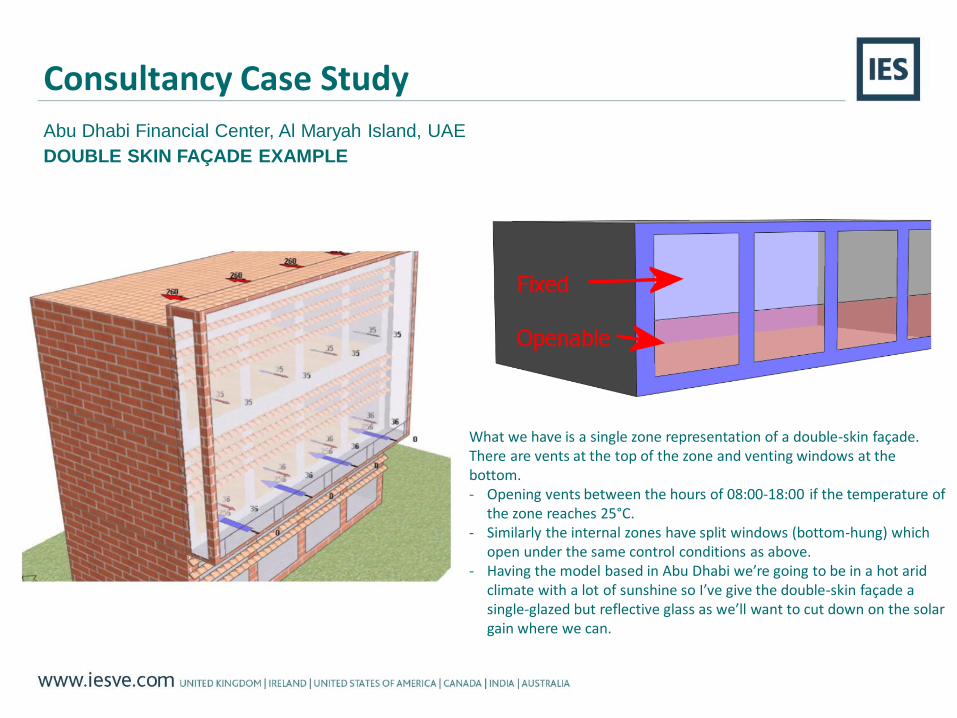
Consultancy Case Study
Abu Dhabi Financial Center, Al Maryah Island, UAE
DOUBLE SKIN FAÇADE EXAMPLE
What we have is a single zone representation of a double-skin façade. There are vents at the top of the zone and venting windows at the bottom. - Opening vents between the hours of 08:00-18:00 if the temperature of
the zone reaches 25°C. - Similarly the internal zones have split windows (bottom-hung) which
open under the same control conditions as above. - Having the model based in Abu Dhabi we’re going to be in a hot arid
climate with a lot of sunshine so I’ve give the double-skin façade a single-glazed but reflective glass as we’ll want to cut down on the solar gain where we can.
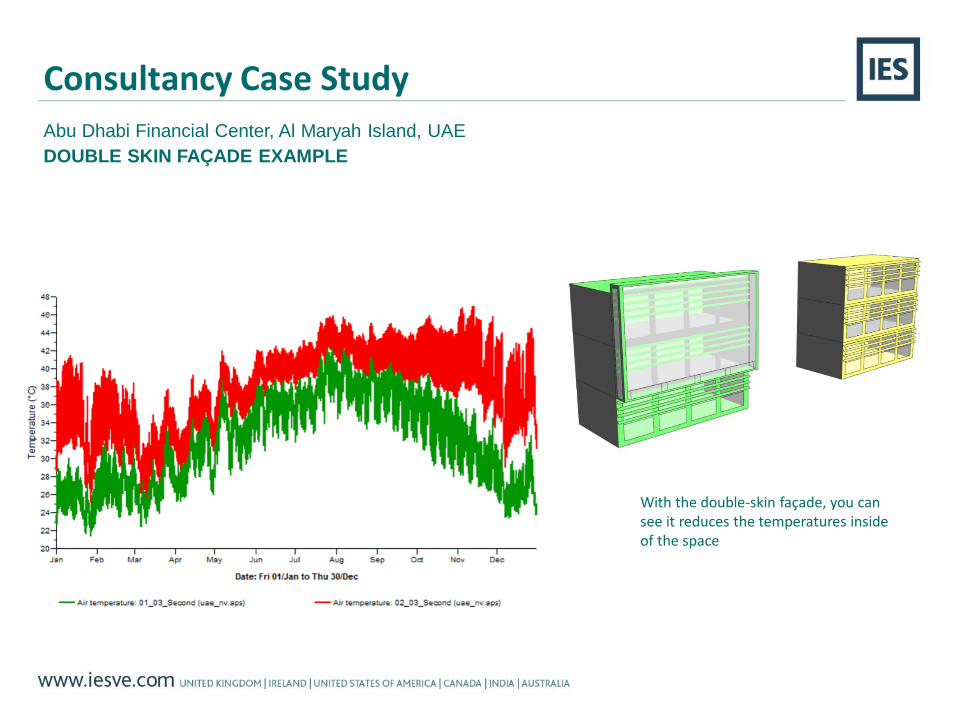
With the double-skin façade, you can see it reduces the temperatures inside of the space
Consultancy Case Study
Abu Dhabi Financial Center, Al Maryah Island, UAE
DOUBLE SKIN FAÇADE EXAMPLE

Consultancy Case StudyLake Murray Nature Center, Oklahoma, USA
Software Platform Interoperability: SketchUp =>> IES<VE> =>> GaiaGLD50% Water Reduction53% Energy Reduction: Natural Ventilation, Lake Source Heat Pump, Daylighting
Natural Ventilation

Heathrow Airport, Terminal 5, London
Summary:• Detailed energy and
environmental modelling• Roof, façade and solar shading
design• Fabric air tightness and
thermal performance• HVAC sizing and selection• Occupant comfort
(thermal/visual)• Building regulations Part L
In conjunction with:
For and on behalf of:
<VE> model of T5 Concourse A
Annual heating and coolingdemand profiles (CHP sizing)
Architectural visualisation of T5 Concourse A
Daylight and glare analysis
T5A under construction
Section through building showing natural air movement

Consultancy Case Study
Nanaimo Regional General Hospital, BC, CanadaInnovative Sustainable Design with Thermal LabyrinthECMs: Daylighting, Natural Ventilation, Displacement VentilationThermal Labyrinth: Free heating, free cooling and increased ventilation
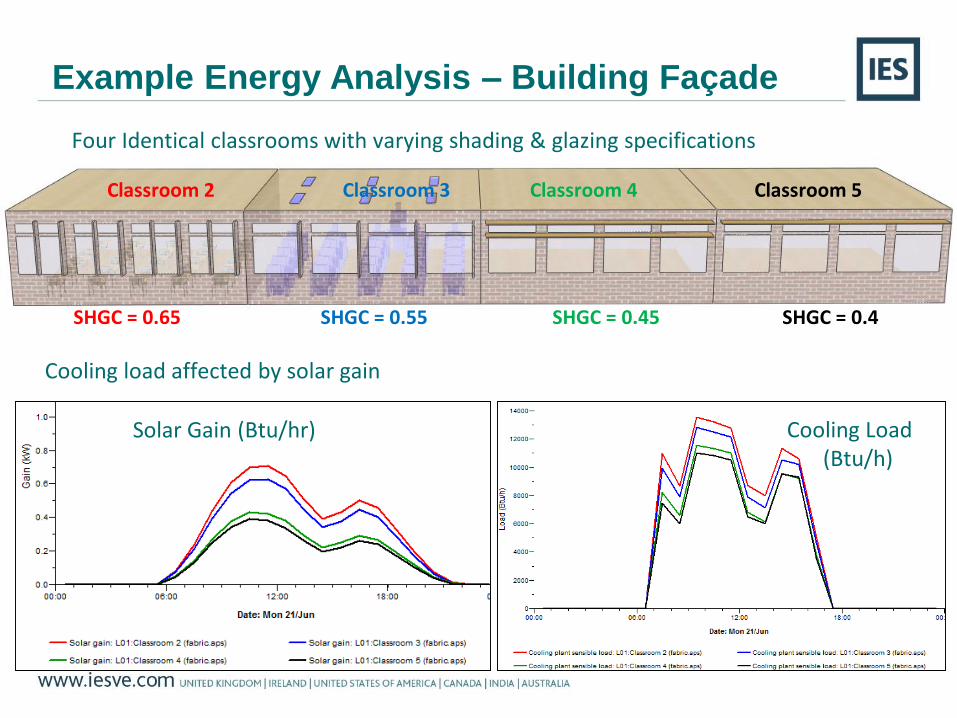
Example Energy Analysis – Building Façade
Cooling load affected by solar gain
Classroom 2 Classroom 3 Classroom 4 Classroom 5
SHGC = 0.65 SHGC = 0.45 SHGC = 0.4 SHGC = 0.55
Cooling Load (Btu/h)
Solar Gain (Btu/hr)
Four Identical classrooms with varying shading & glazing specifications

Example Energy Analysis – Building Fabric
Infiltration heat loss can account for up to 15-50% of a building’s Heating Load....
...Building Pressure Tests
0 2000 4000 6000 8000 10000 12000 14000
Heating Load (Btu/h)
Fabric Loss
Infiltration Loss
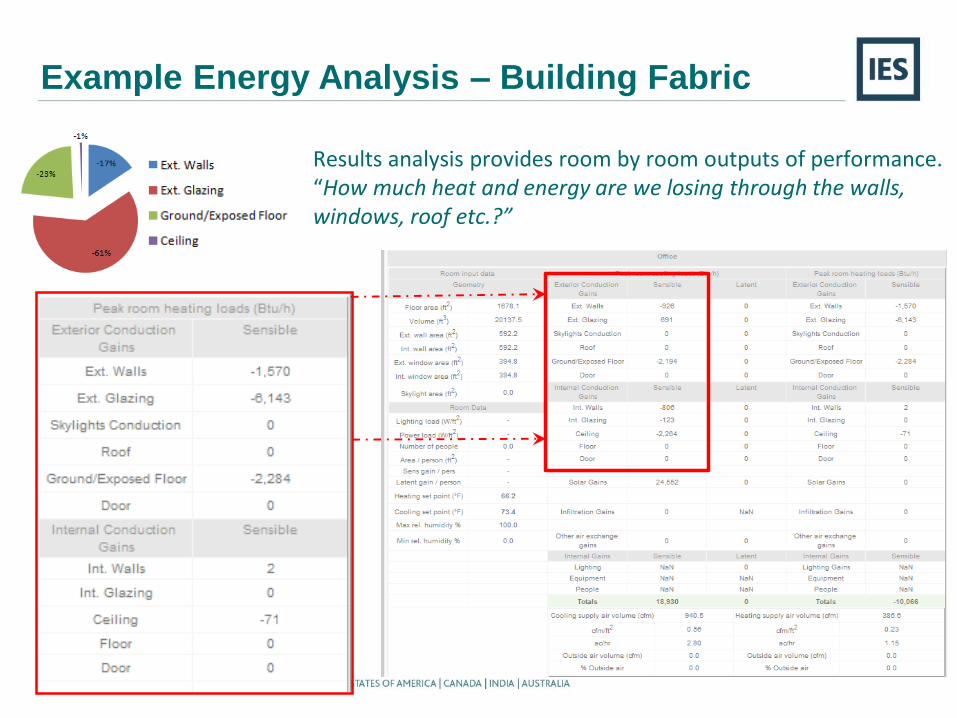
Results analysis provides room by room outputs of performance.“How much heat and energy are we losing through the walls, windows, roof etc.?”
Example Energy Analysis – Building Fabric

Energy Analysis – Building Fabric
Extensive database of opaque & transparent constructions
Constructions can be created, customised or you can use our detailed library.
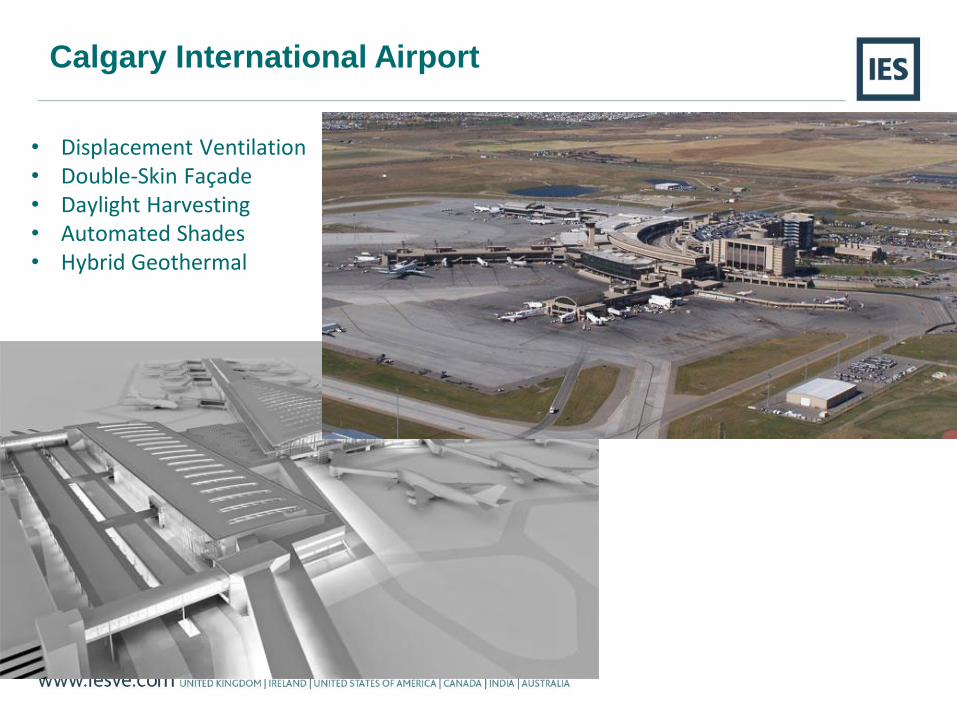
Calgary International Airport
• Displacement Ventilation• Double-Skin Façade• Daylight Harvesting• Automated Shades• Hybrid Geothermal

Calgary International Airport
• Displacement Ventilation• Double-Skin Façade
• Daylight Harvesting• Automated Shades• Hybrid Geothermal
IES allows you to simulate exactly how much energy you can save through the use of:- Exterior or interior shading
devices that automatically come down when the lux levels reach a certain number
- How much electrical energy you can save when you use electrical light dimmers
- The amount of energy you could save by using “step dimming” or “continuous dimming”
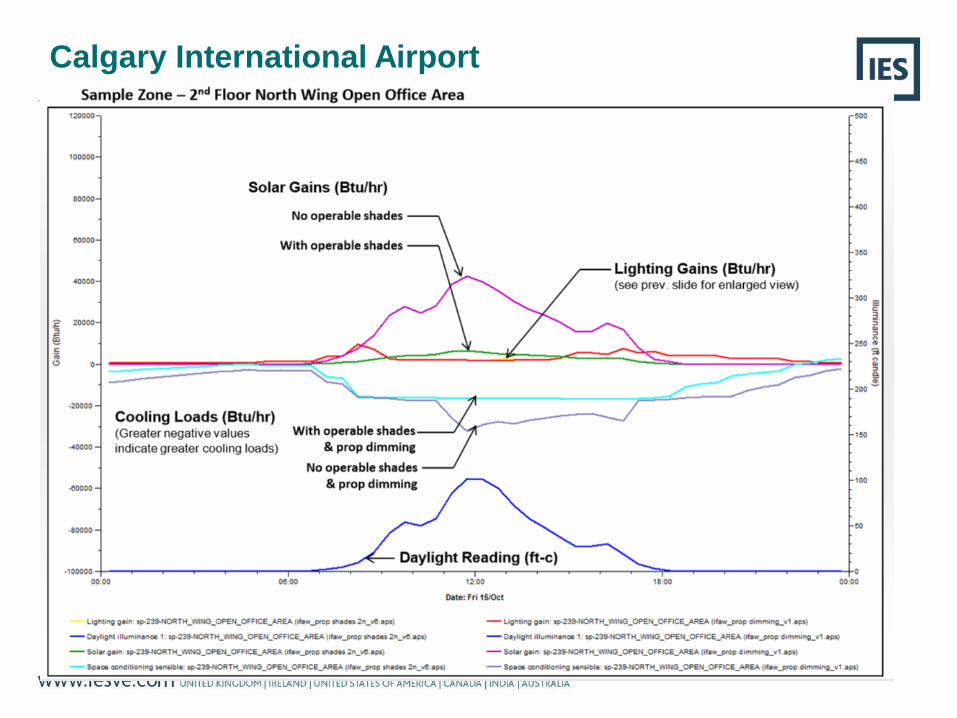
Calgary International Airport

What can analysis fit in our process?
A E S T H E T I C S
Schematic Design
FO
RM
Ear
ly D
esig
n D
evel
op
men
t
MA
TE
RIA
LS
/OR
IEN
TA
TIO
N
Lat
er D
esig
n D
evel
op
men
t
Other Tests
• Material
• Constructions (R-
Value of Walls)
• Orientations
• Layout of Building
• Window/Wall Ratio
• Shading Options
We generally
now have an
idea about the
design
We now know
the design form,
lets test the
materials,
orientation and
more.
Many options on
the table, just
experimenting

Later Design Development
Compare these options:
• Material
• Constructions (U-Value of Walls)
• Windows (type, coating, layout)
• Orientations
• Layout of Building
• Window/Wall Ratio
• Shading Options
Important thing is that we do this EARLY in the design
phase so we have the chance to impact building
performance.

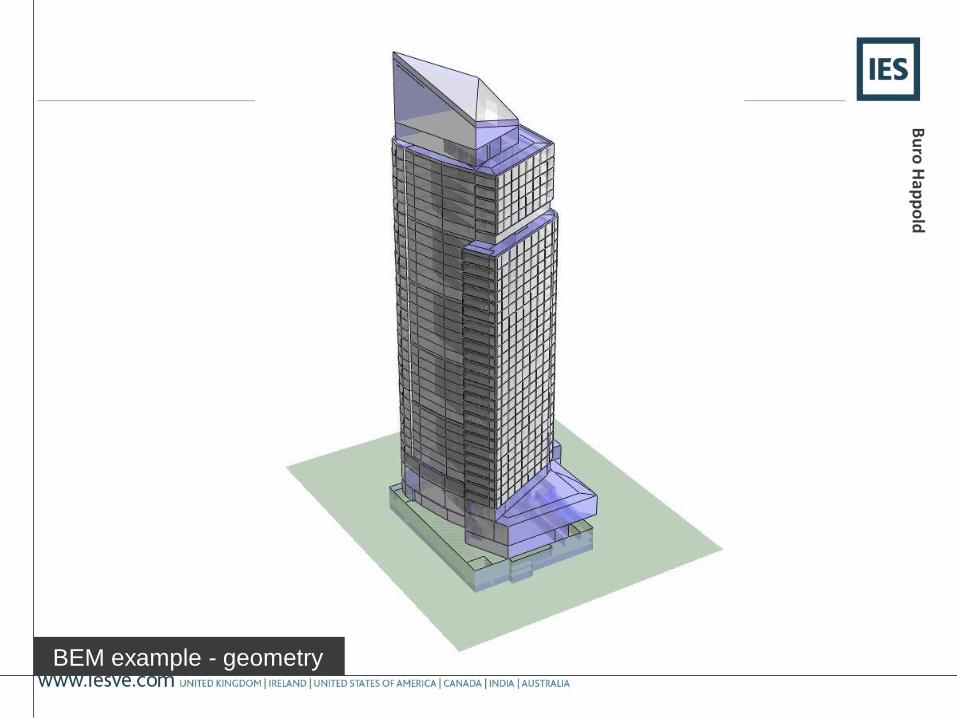
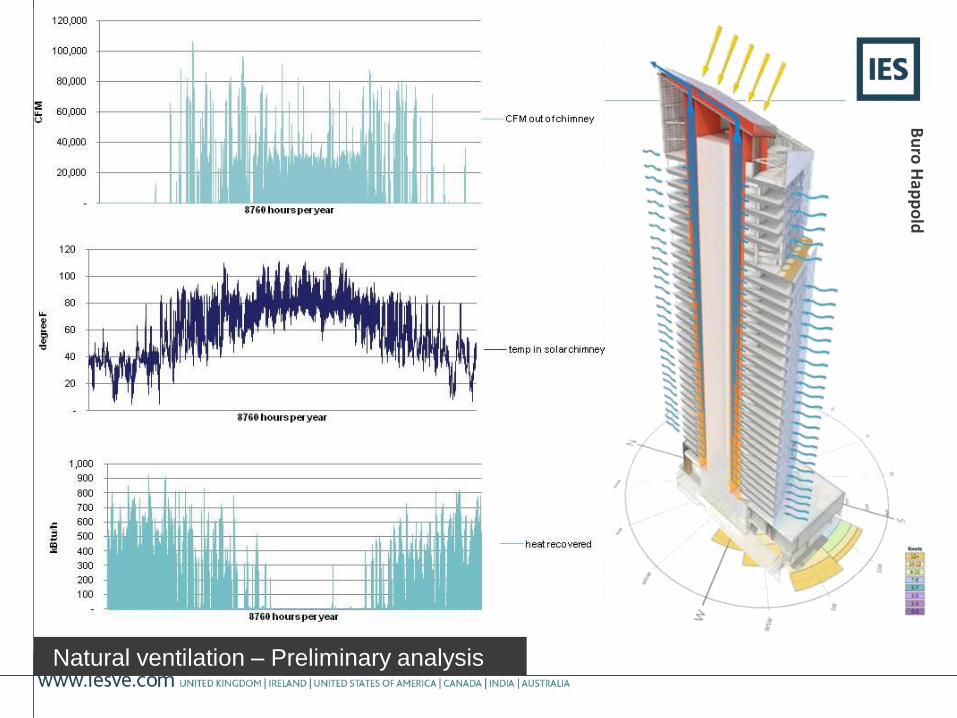
The Tower at PNC Plaza
Bu
roH
app
old
Bu
roH
app
old
BEM example - geometry
Bu
roH
app
old
Natural ventilation – Preliminary analysis
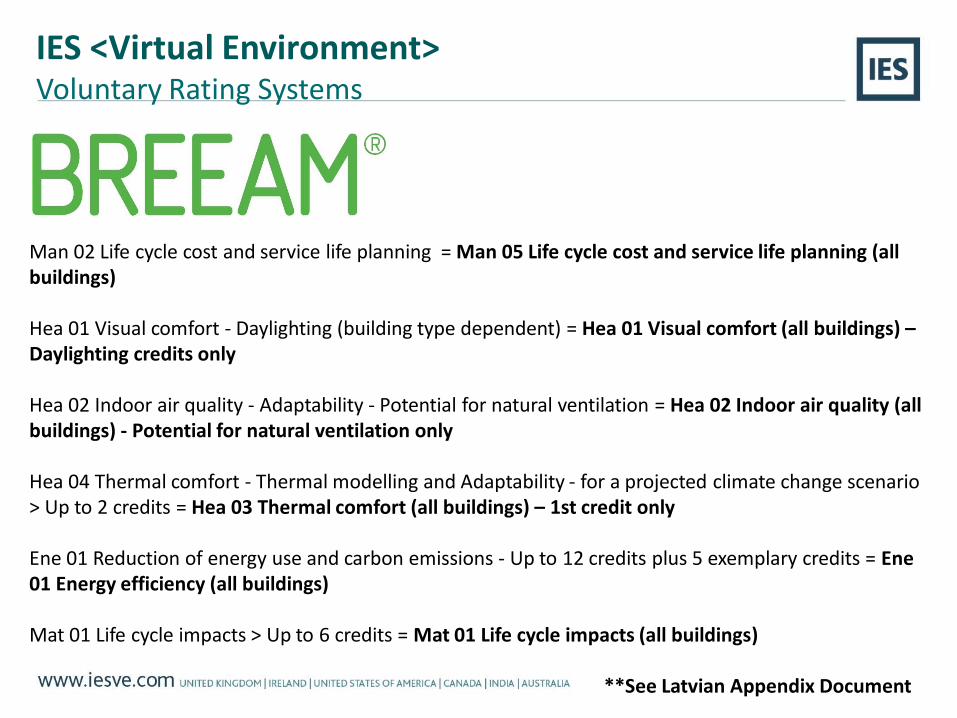
Man 02 Life cycle cost and service life planning = Man 05 Life cycle cost and service life planning (all buildings)
Hea 01 Visual comfort - Daylighting (building type dependent) = Hea 01 Visual comfort (all buildings) –Daylighting credits only
Hea 02 Indoor air quality - Adaptability - Potential for natural ventilation = Hea 02 Indoor air quality (all buildings) - Potential for natural ventilation only
Hea 04 Thermal comfort - Thermal modelling and Adaptability - for a projected climate change scenario > Up to 2 credits = Hea 03 Thermal comfort (all buildings) – 1st credit only
Ene 01 Reduction of energy use and carbon emissions - Up to 12 credits plus 5 exemplary credits = Ene01 Energy efficiency (all buildings)
Mat 01 Life cycle impacts > Up to 6 credits = Mat 01 Life cycle impacts (all buildings)
**See Latvian Appendix Document
IES <Virtual Environment>Voluntary Rating Systems

Daylighting Studies
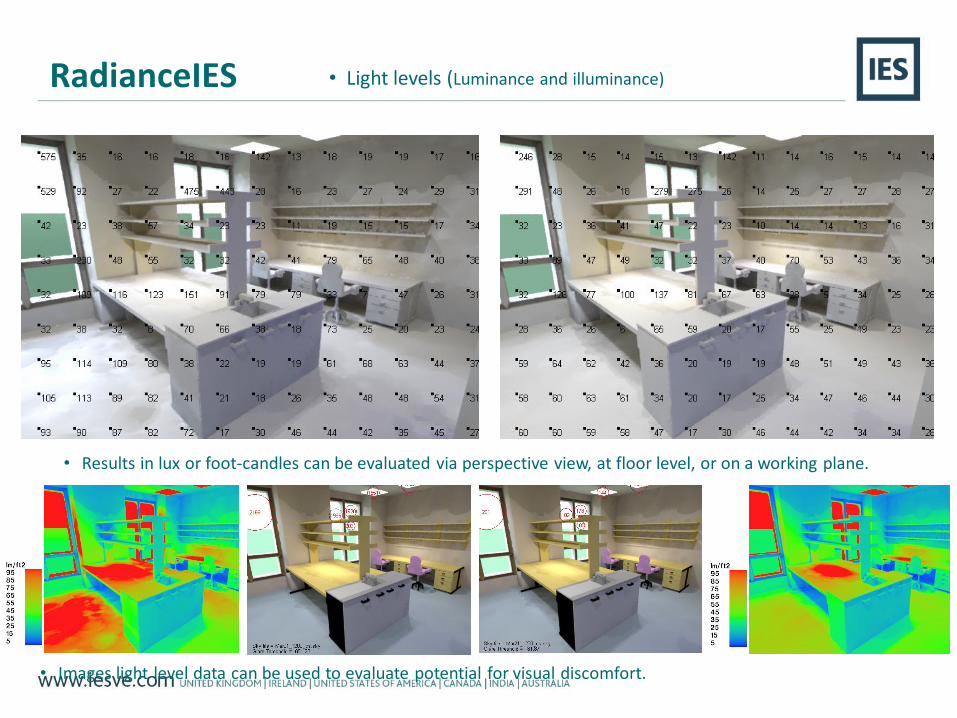
RadianceIES • Light levels (Luminance and illuminance)
• Images light level data can be used to evaluate potential for visual discomfort.
• Results in lux or foot-candles can be evaluated via perspective view, at floor level, or on a working plane.
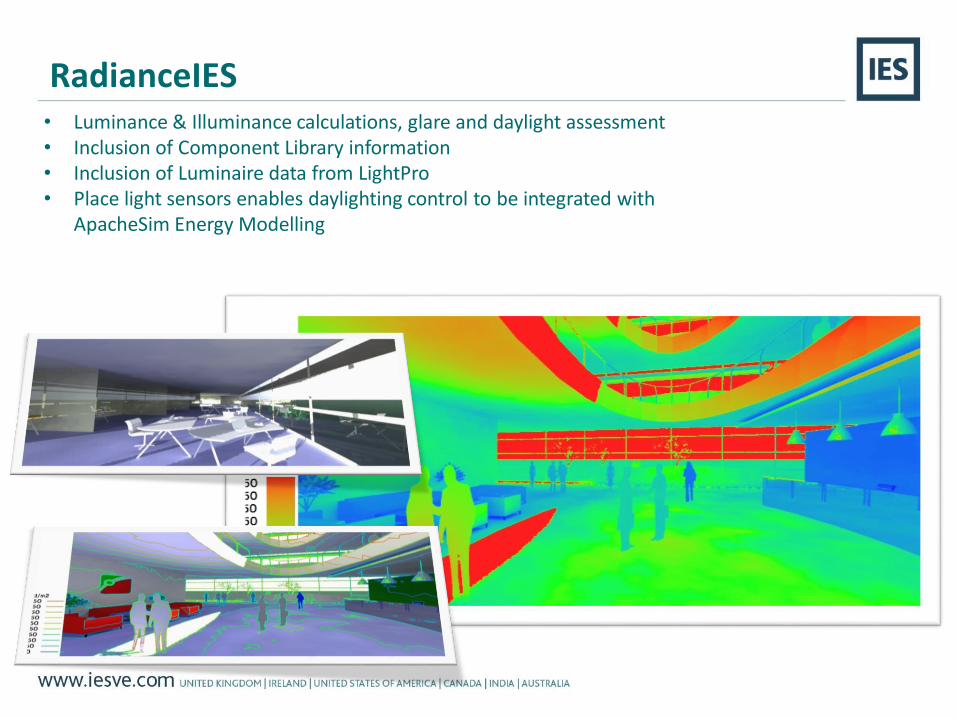
• Luminance & Illuminance calculations, glare and daylight assessment• Inclusion of Component Library information• Inclusion of Luminaire data from LightPro• Place light sensors enables daylighting control to be integrated with
ApacheSim Energy Modelling
RadianceIES

No Solar Shading
With Solar Shading
• Will glare be problematic late in
the day?
• How Effective is the External
Shade at reducing Glare?
RadianceIES

SC=0.6
VLT=75%
SC=0.2
VLT=35%
Daylighting Quality Exterior Tint
Radiance – Glazing Option Visualization
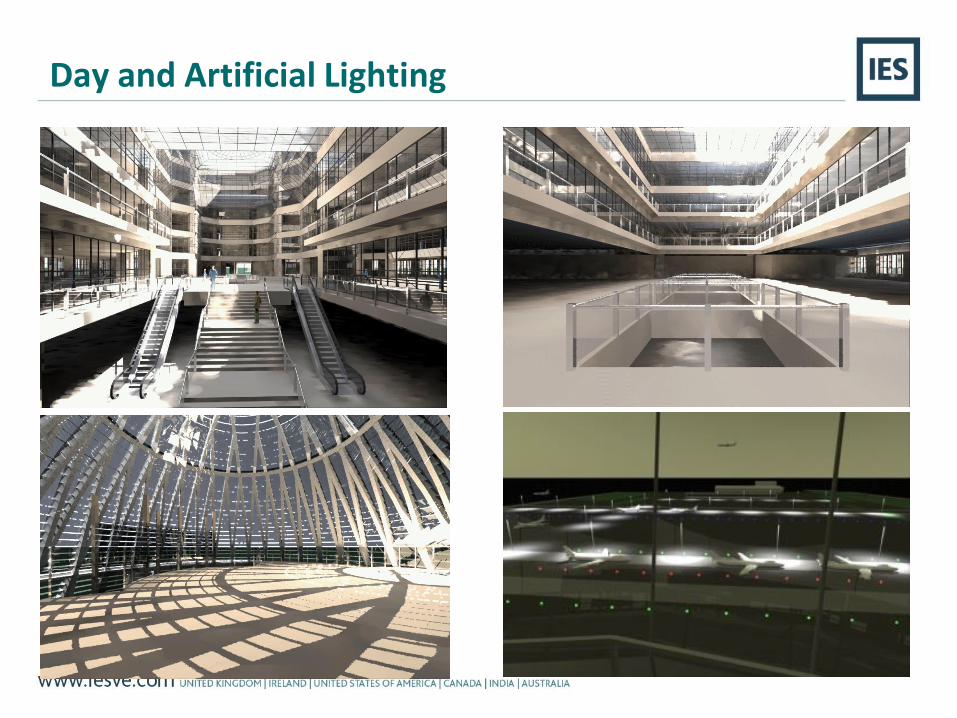
Day and Artificial Lighting
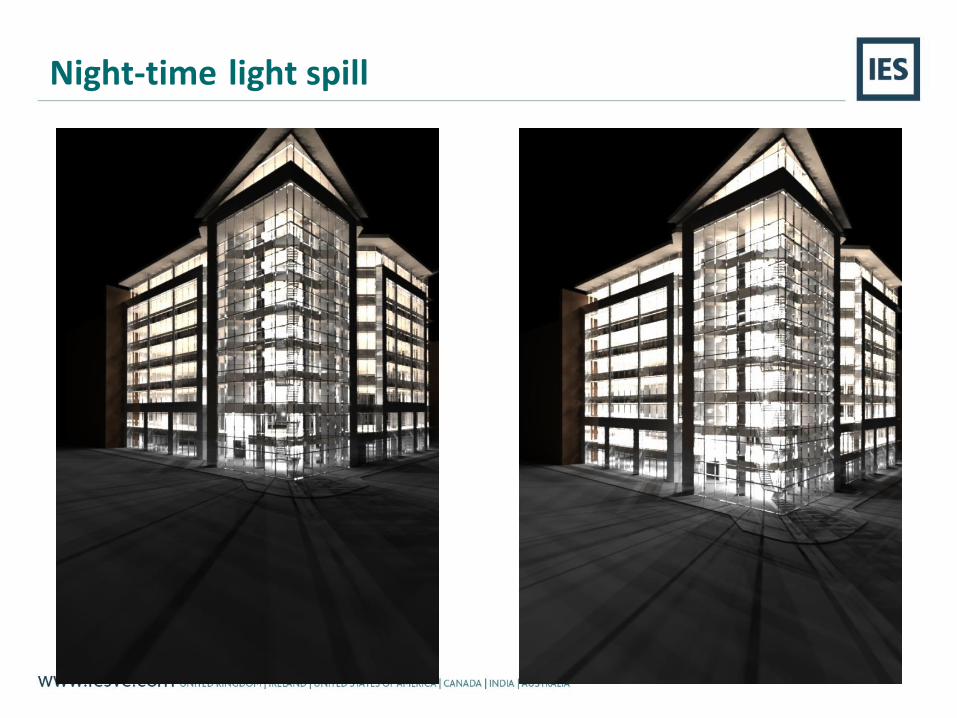
Night-time light spill
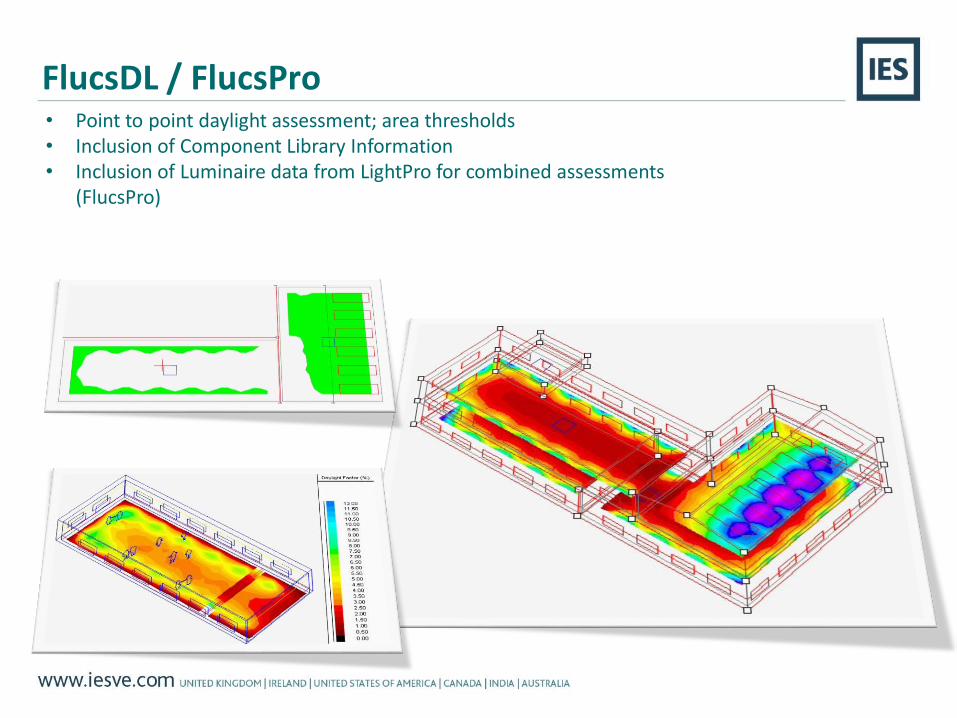
FlucsDL / FlucsPro• Point to point daylight assessment; area thresholds• Inclusion of Component Library Information• Inclusion of Luminaire data from LightPro for combined assessments
(FlucsPro)
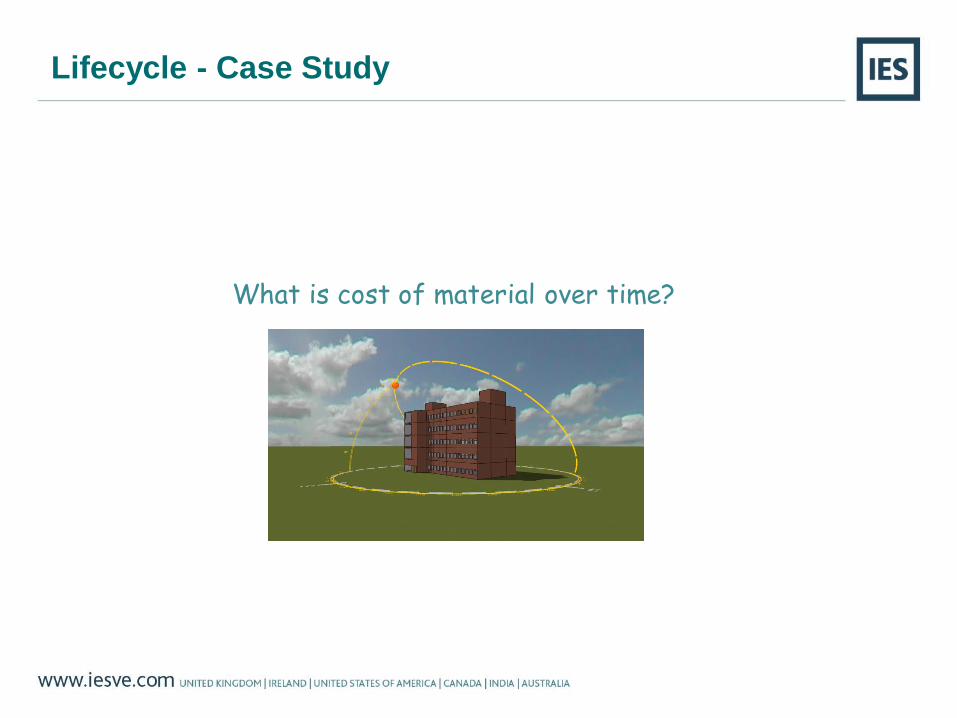
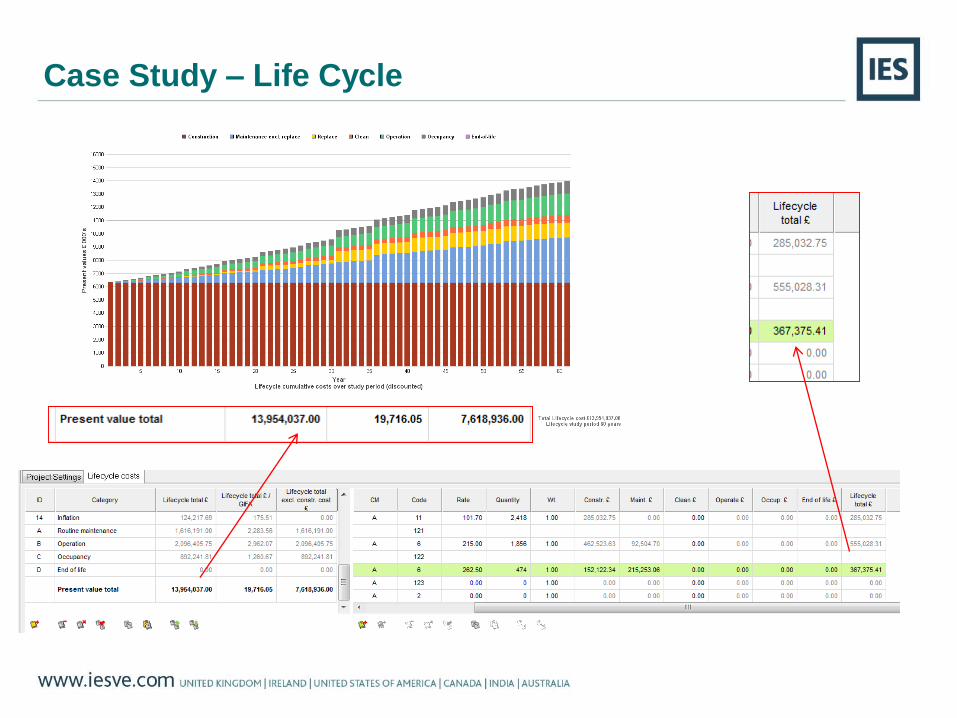
Lifecycle - Case Study
What is cost of material over time?
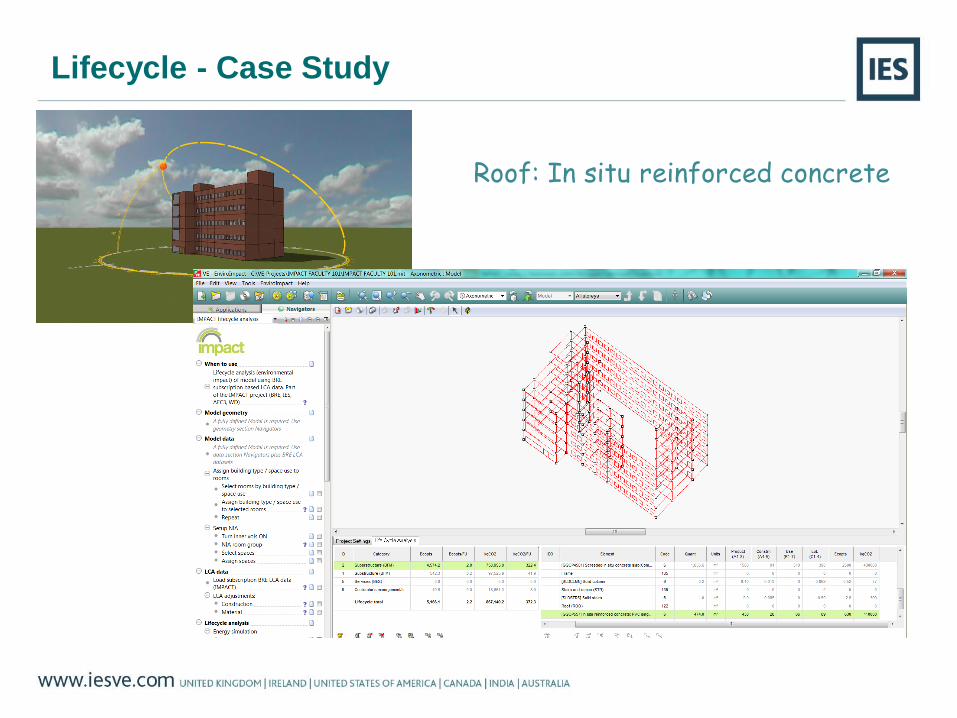
Lifecycle - Case Study
Roof: In situ reinforced concrete
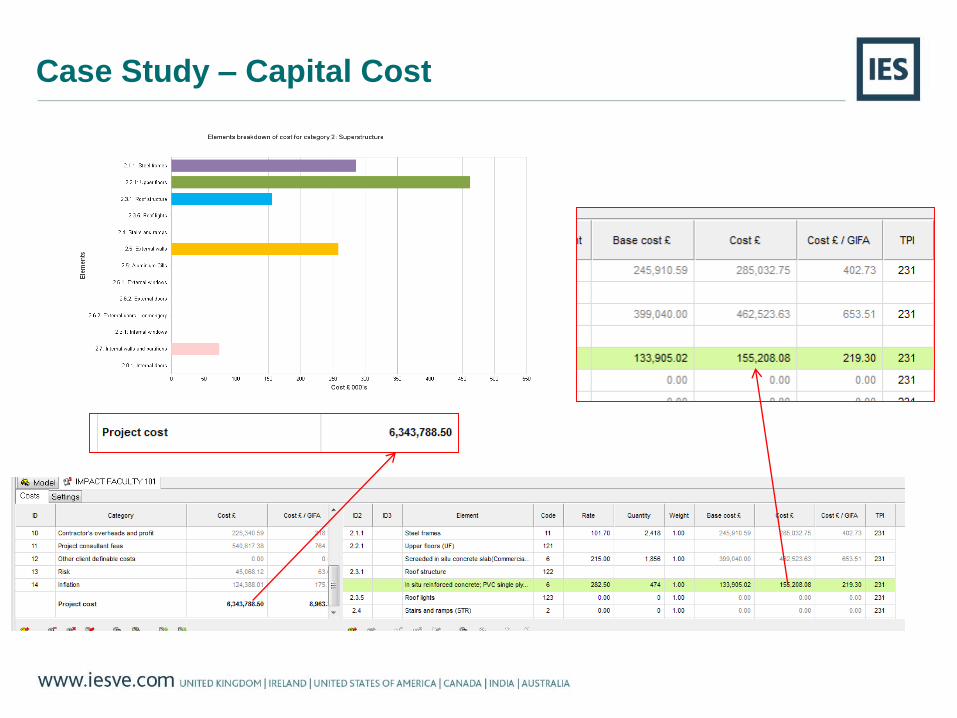
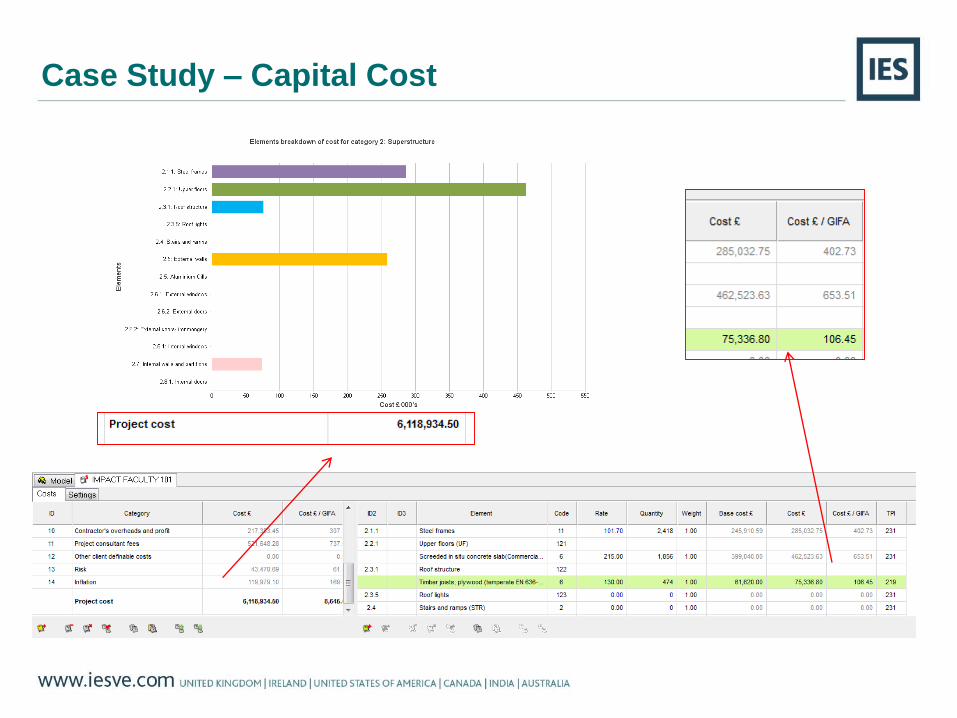
Case Study – Capital Cost

Case Study – Life Cycle
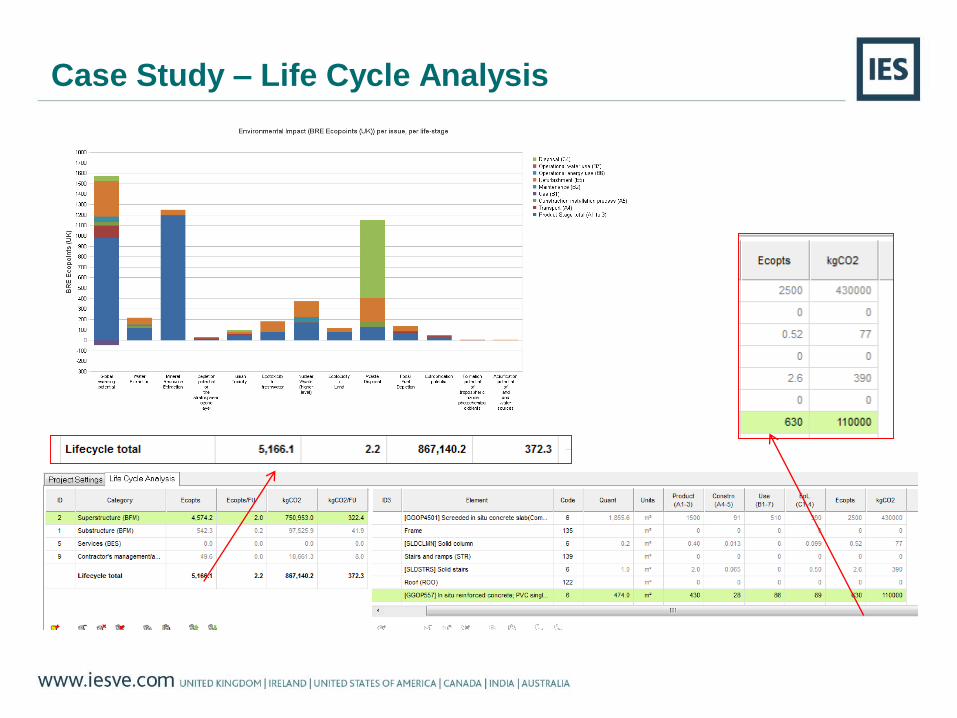
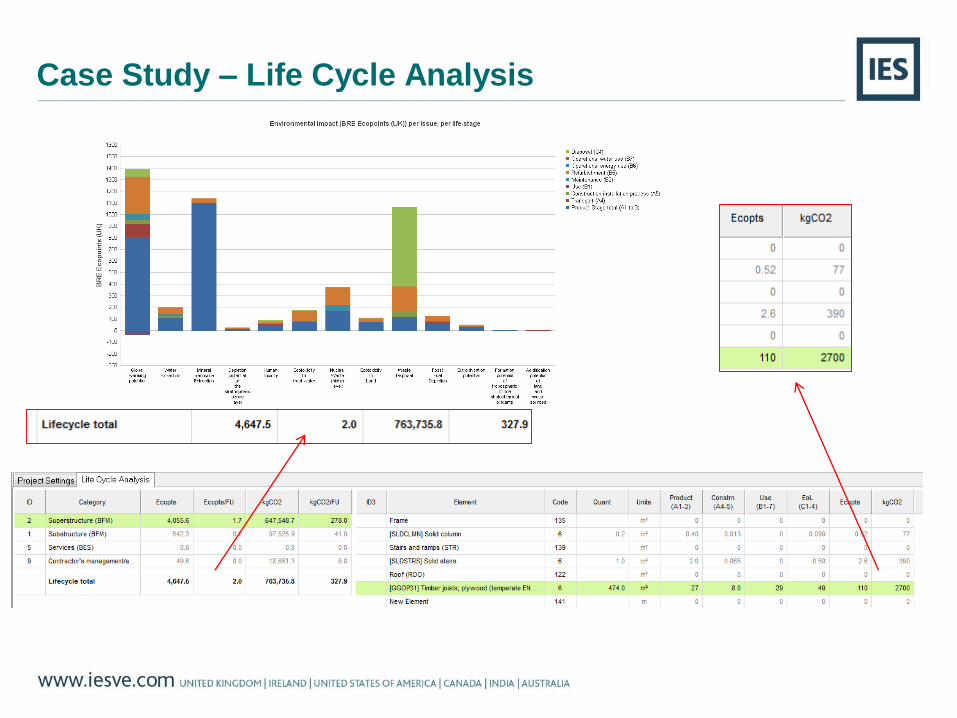
Case Study – Life Cycle Analysis
Case Study – Roof Option 1
Roof: In situ reinforced concrete
• Capital Expenditure: £6.34m / £155k
• LCC: £7.63m / £375k
• LCA: 5,166 EP / 630 EP
Case Study – Roof Option 2
Profiled metal deep decking with in situ concrete

Case Study – Capital Cost
Case Study – Life Cycle

Case Study – Life Cycle Analysis

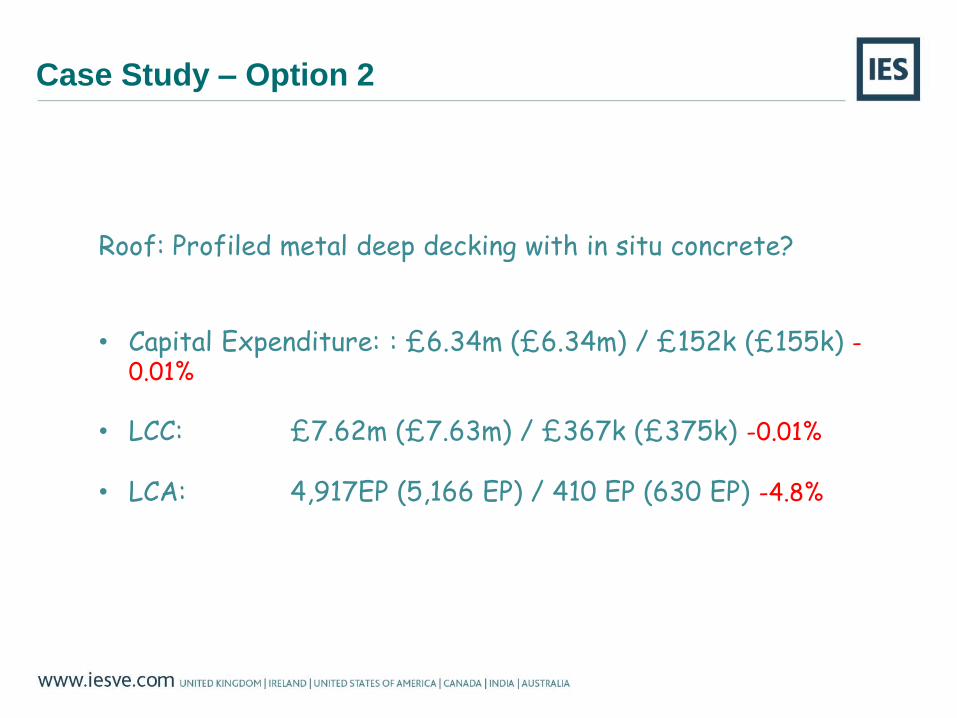
Case Study – Option 2
Roof: Profiled metal deep decking with in situ concrete?
• Capital Expenditure: £6.34m (£6.34m) / £152k (£155k)
• LCC: £7.62m (£7.63m) / £367k (£375k)
• LCA: 4,917EP (5,166 EP) / 410 EP (630 EP)
Case Study – Option 2
Roof: Profiled metal deep decking with in situ concrete?
• Capital Expenditure: : £6.34m (£6.34m) / £152k (£155k) -0.01%
• LCC: £7.62m (£7.63m) / £367k (£375k) -0.01%
• LCA: 4,917EP (5,166 EP) / 410 EP (630 EP) -4.8%

Case Study – Option 3
Roof: Timber Frame
Case Study – Capital Cost
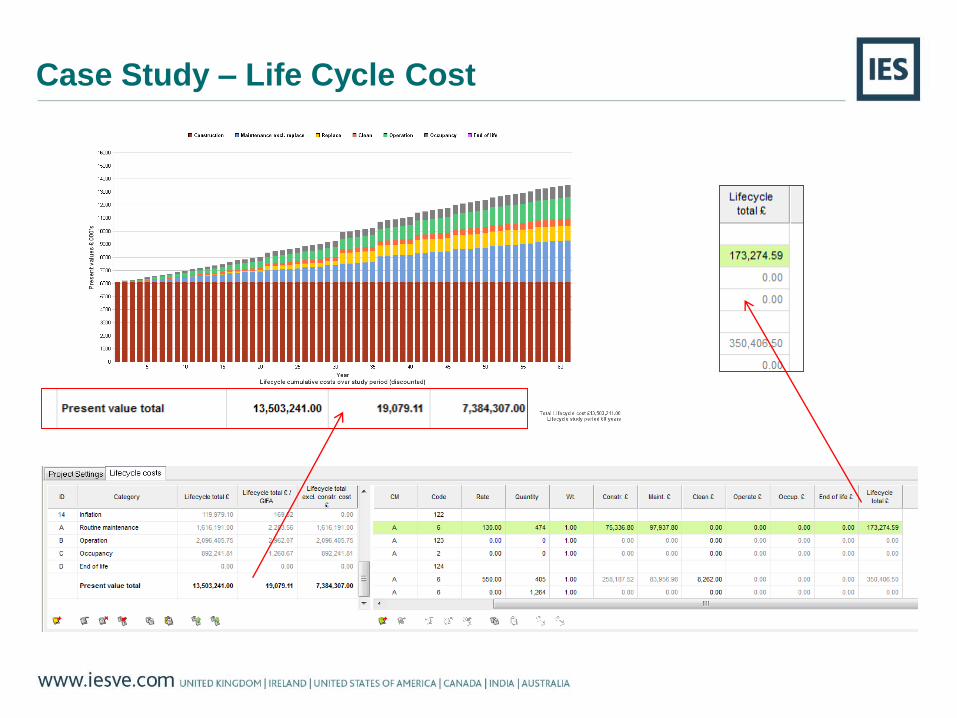
Case Study – Life Cycle Cost
Case Study – Life Cycle Analysis
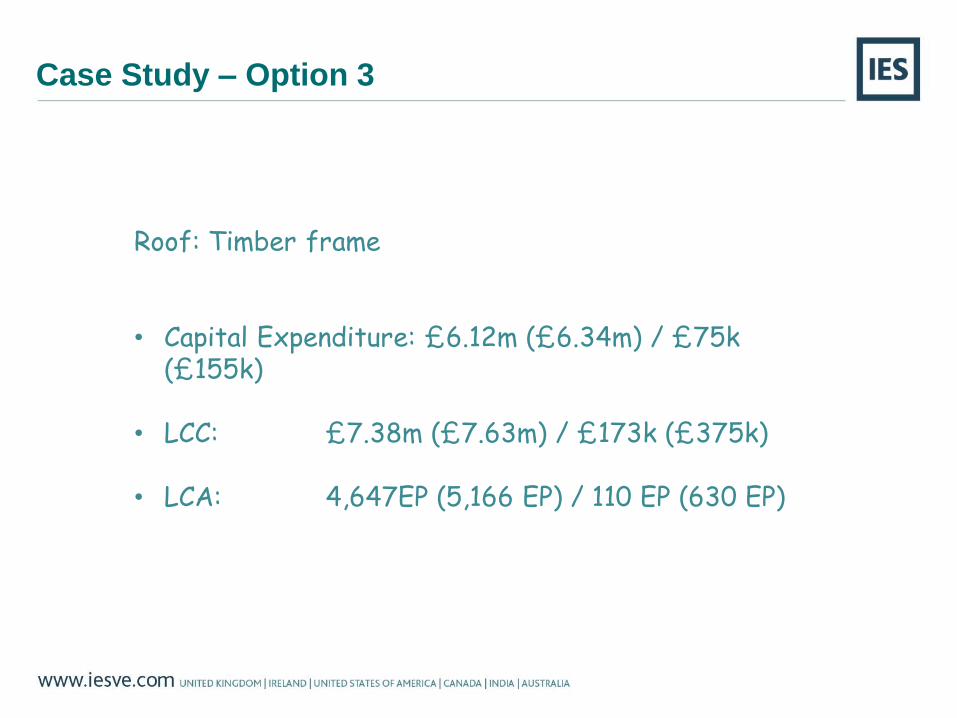
Case Study – Option 3
Roof: Timber frame
• Capital Expenditure: £6.12m (£6.34m) / £75k (£155k)
• LCC: £7.38m (£7.63m) / £173k (£375k)
• LCA: 4,647EP (5,166 EP) / 110 EP (630 EP)
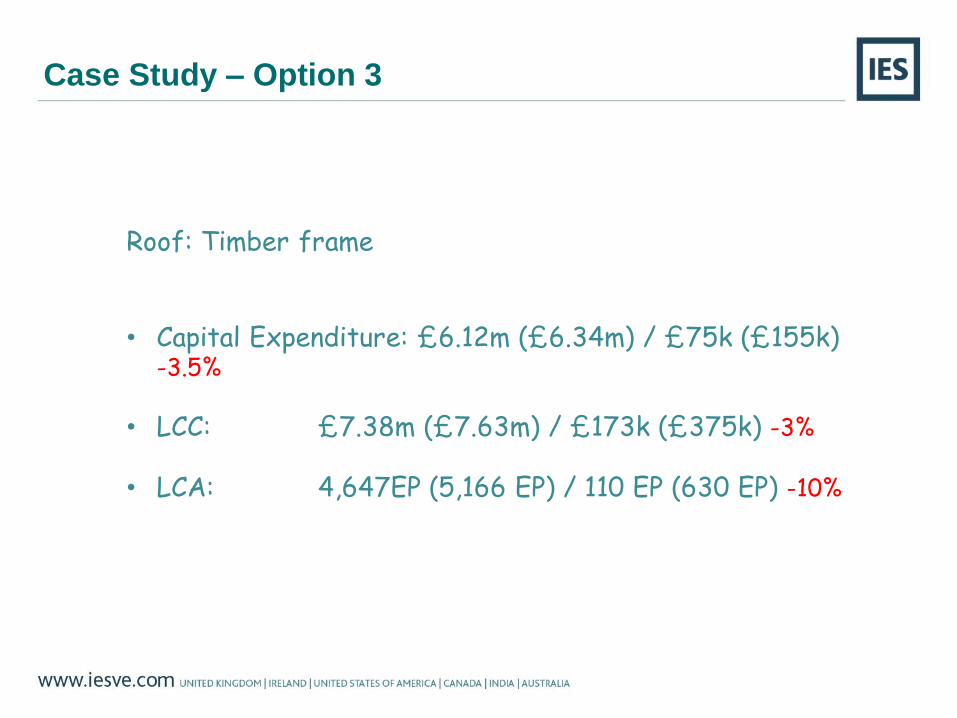
Case Study – Option 3
Roof: Timber frame
• Capital Expenditure: £6.12m (£6.34m) / £75k (£155k) -3.5%
• LCC: £7.38m (£7.63m) / £173k (£375k) -3%
• LCA: 4,647EP (5,166 EP) / 110 EP (630 EP) -10%
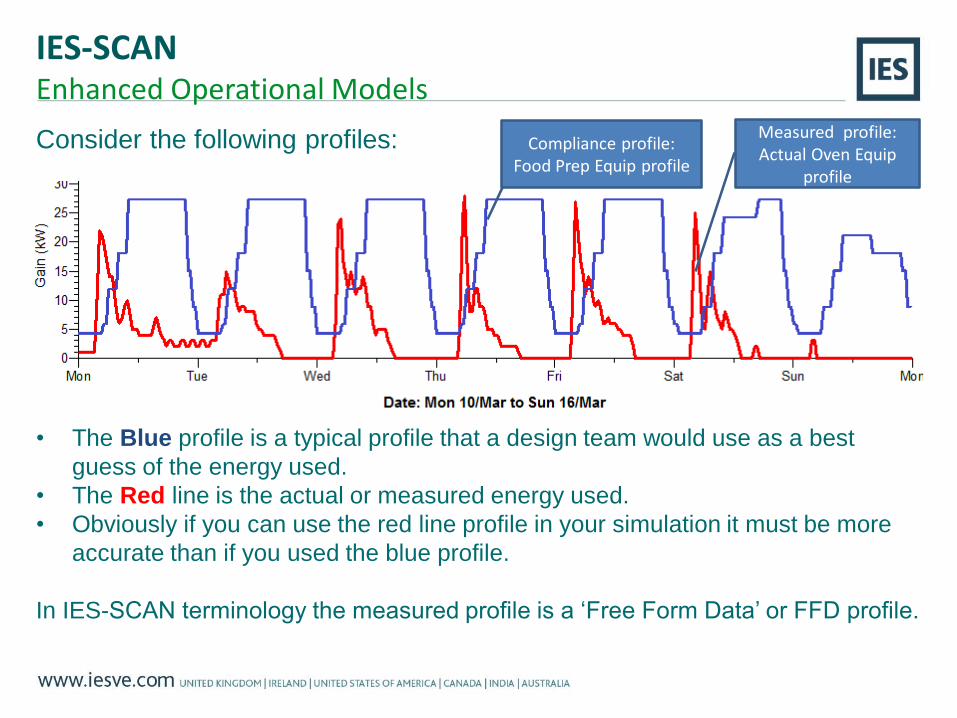
IES-SCANEnhanced Operational Models
Consider the following profiles:
• The Blue profile is a typical profile that a design team would use as a best
guess of the energy used.
• The Red line is the actual or measured energy used.
• Obviously if you can use the red line profile in your simulation it must be more
accurate than if you used the blue profile.
In IES-SCAN terminology the measured profile is a ‘Free Form Data’ or FFD profile.
Compliance profile: Food Prep Equip profile
Measured profile: Actual Oven Equip
profile

IES-SCANFree Form Data Profiles
IES-SCAN is an extremely easy and unique online process of
creating Free Form Data (FFD) profiles.
The FFD’s maximise the accuracy of the VE Operational Model by using
the actual building data rather than guessing or restricting the building
operational information.
With IES-SCAN you can:
• Import BMS and other data in a variety of formats and convert the data
into FFD’s.
• FFD’s of any time frequency can be assigned i.e. from one hour to one
minute. Obviously the smaller the time frequency the more accurate
the calibration.
• The FFD’s can be assigned to the VE Model of the building to replace
rigid profiles of occupancy; room set points; or energy consumption.

1. These examples are aimed to show the difference between
using a Compliance profile with BMS data converted in
IES-SCAN and used to calibrate the Operational Model
(OM).
Free Form Data Profiles
IES-SCANExamples

2. The Compliance office electrical Lighting profile is taken
from the ASHRAE 90.1 methodology.
• Compliance lighting profile with ASHRAE 90.1 Office lighting
profile assigned
IES-SCANOffice Building: Lighting
Closer view
of profile
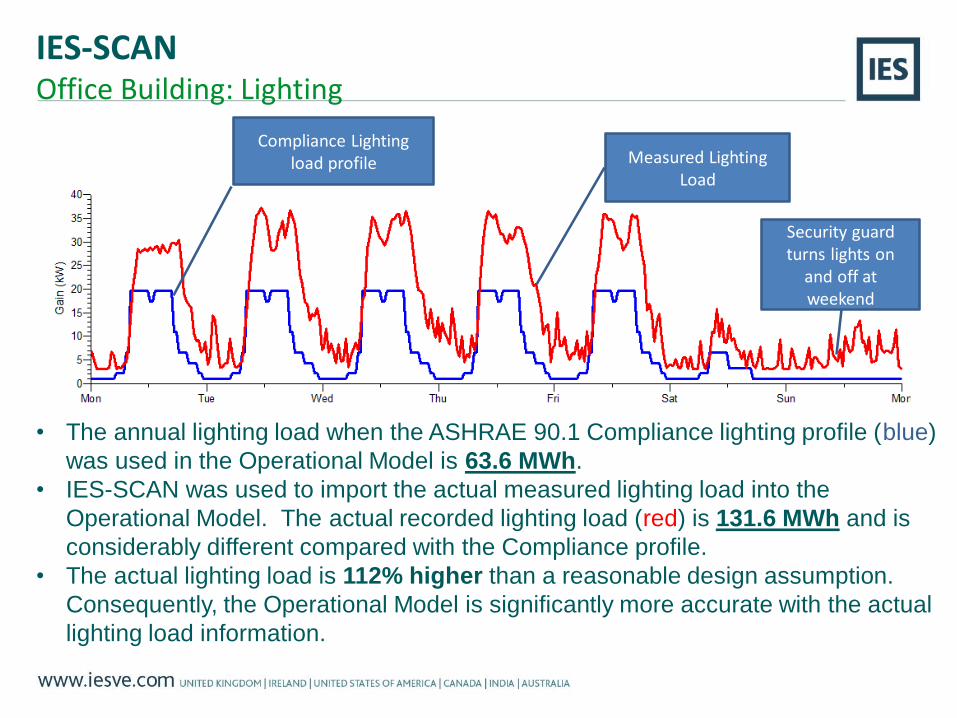
Measured Lighting Load
Compliance Lighting load profile
Security guard turns lights on
and off at weekend
• The annual lighting load when the ASHRAE 90.1 Compliance lighting profile (blue)
was used in the Operational Model is 63.6 MWh.
• IES-SCAN was used to import the actual measured lighting load into the
Operational Model. The actual recorded lighting load (red) is 131.6 MWh and is
considerably different compared with the Compliance profile.
• The actual lighting load is 112% higher than a reasonable design assumption.
Consequently, the Operational Model is significantly more accurate with the actual
lighting load information.
IES-SCANOffice Building: Lighting
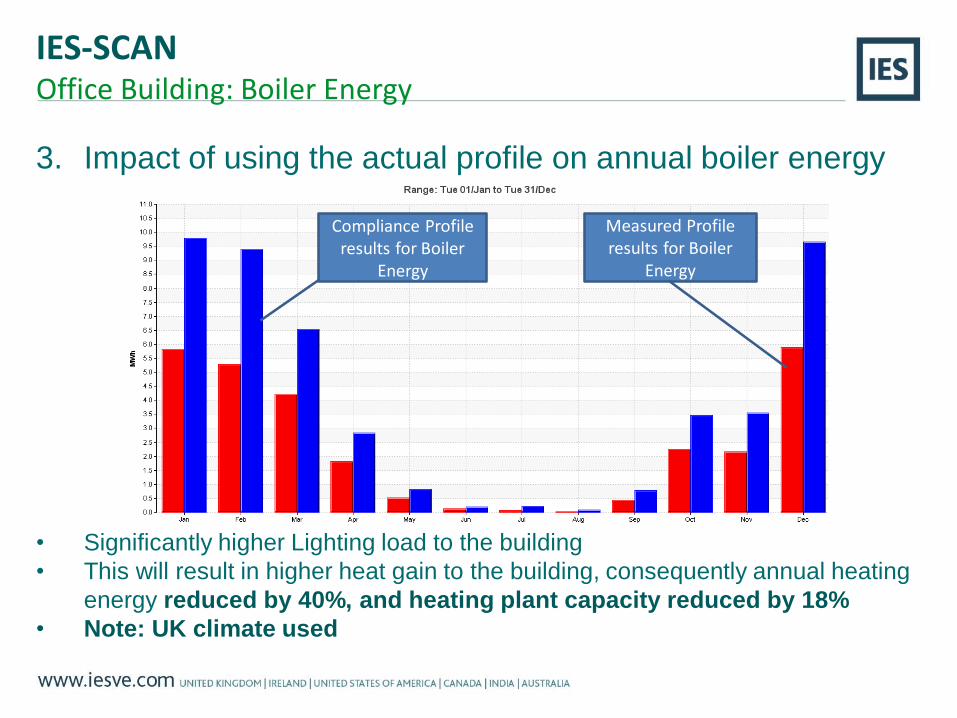
3. Impact of using the actual profile on annual boiler energy
• Significantly higher Lighting load to the building
• This will result in higher heat gain to the building, consequently annual heating
energy reduced by 40%, and heating plant capacity reduced by 18%
• Note: UK climate used
Compliance Profile results for Boiler
Energy
Measured Profile results for Boiler
Energy
IES-SCANOffice Building: Boiler Energy
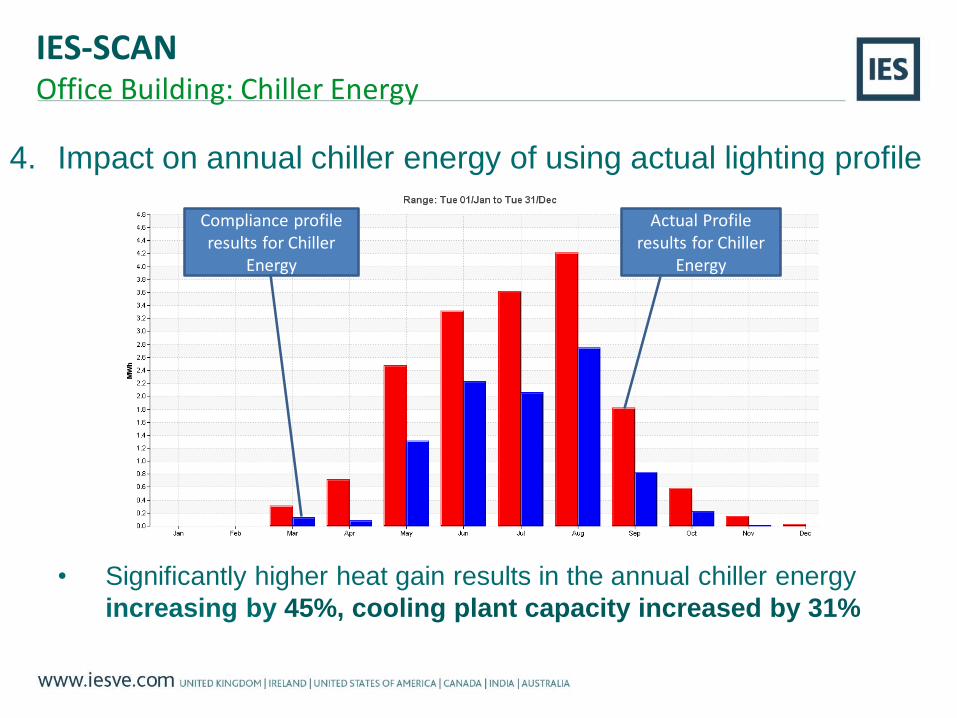
4. Impact on annual chiller energy of using actual lighting profile
• Significantly higher heat gain results in the annual chiller energy
increasing by 45%, cooling plant capacity increased by 31%
Compliance profile results for Chiller
Energy
Actual Profile results for Chiller
Energy
IES-SCANOffice Building: Chiller Energy