how wealthy are residential solar...
TRANSCRIPT

How Wealthy Are Residential Solar Customers?
Household Income and Solar Adoption in the U.S.
Shayle Kann
Head of GTM Research
Attila Toth
CEO, PowerScout
April 2017

1Residential Solar Income Analysis - April 2017
v
We provide critical market intelligence on:
GTM NEWS GTM EVENTS GTM RESEARCH
Solar Power
Energy Storage
Grid Edge
Learn more at www.gtmresearch.com
About GTM Research
GTM Research is the
leading market analysis and
advisory firm on the
transformation of the
global electricity industry.
vIn-Depth Market Reports
Analyst Access
Data and Forecasts
All our subscriptions include:

2Residential Solar Income Analysis - April 2017
2
Free customized benefits report
Machine learning-driven predictive analytics
Curated list of products and service providers
Superb content, optimized for mobile and social
Multiple up-sell opportunities As seen on:
About PowerScout
The First AI-Enabled
Marketplace for
Sustainable Smart home
Improvement

3Residential Solar Income Analysis - April 2017
How wealthy are residential solar customers?
This question has surfaced repeatedly, most often when policymakers or regulators are considering solar incentives and/or changes to electricity rates. In
particular, battles over net energy metering (NEM) have often included charged debates over whether solar is for the wealthy or for the masses. In response to
one such dispute in Nevada, for example, the Wall Street Journal editorial board called net metering “regressive political income redistribution."
These statements on both sides have rarely been backed by data, and instead have relied on a general impression of who solar customers might be.
Previous analyses have attempted to answer this question by using ZIP code-level data on solar adoption. Examples of previous work come from:
• The Center for American Progress (2013)
• Kevala Analytics (2015)
While these analyses provide valuable information, the methodologies employed do not account for the (sometimes wide) income variations within ZIP codes.
By contrast, this report presents – for the first time – household-level data on the relationship between residential solar and household income. While the
findings are broadly consistent with previous research, a number of key differences emerge.
Introduction

4Residential Solar Income Analysis - April 2017
• PowerScout identified solar households by analyzing satellite images using its proprietary Convolutional Neural Network (CNN) machine-
learning algorithm. The CNN model was trained with hundreds of thousands of labeled images of homes with and without solar panels
until the model was able to distinguish between the two types.
• We then matched the 521,449 positively identified solar homes to their income band, and compared the distribution of solar
installations to the distribution of the general state population.
• We used GTM Research data on total solar market size to determine sample representation of state and national solar markets.
We believe this sample is statistically significant for the states analyzed.
Our Methodology

5Residential Solar Income Analysis - April 2017
The Result: Our Data
Residential Solar Market Coverage in This Analysis
• We focused on four leading residential solar states: California,
Massachusetts, New Jersey and New York. Together, these states account for
65% of all residential solar installations to date.
• We identified over 521,000 solar installations in these four states,
representing 62% of those markets and 41% of all solar projects nationwide.
• Our coverage was greatest in California, where we identified over two-
thirds of all residential solar installations, and least comprehensive in
Massachusetts, where we identified one-fourth of all current projects.
• We believe these samples to be representative of each state’s overall solar
installation pool without any systemic bias.
LocationSolar
Households Analyzed
Total Solar Households
% of All Installations
Covered
CA 444,783 642,446 69%
NJ 28,445 60,628 47%
MA 15,588 62,088 25%
NY 32,633 70,072 47%
Total: Four States 521,449 835,234 62%
Total: National 521,449 1,278,494 41%

Residential Solar Income Analysis - April 2017
Findings and Analysis
7Residential Solar Income Analysis - April 2017
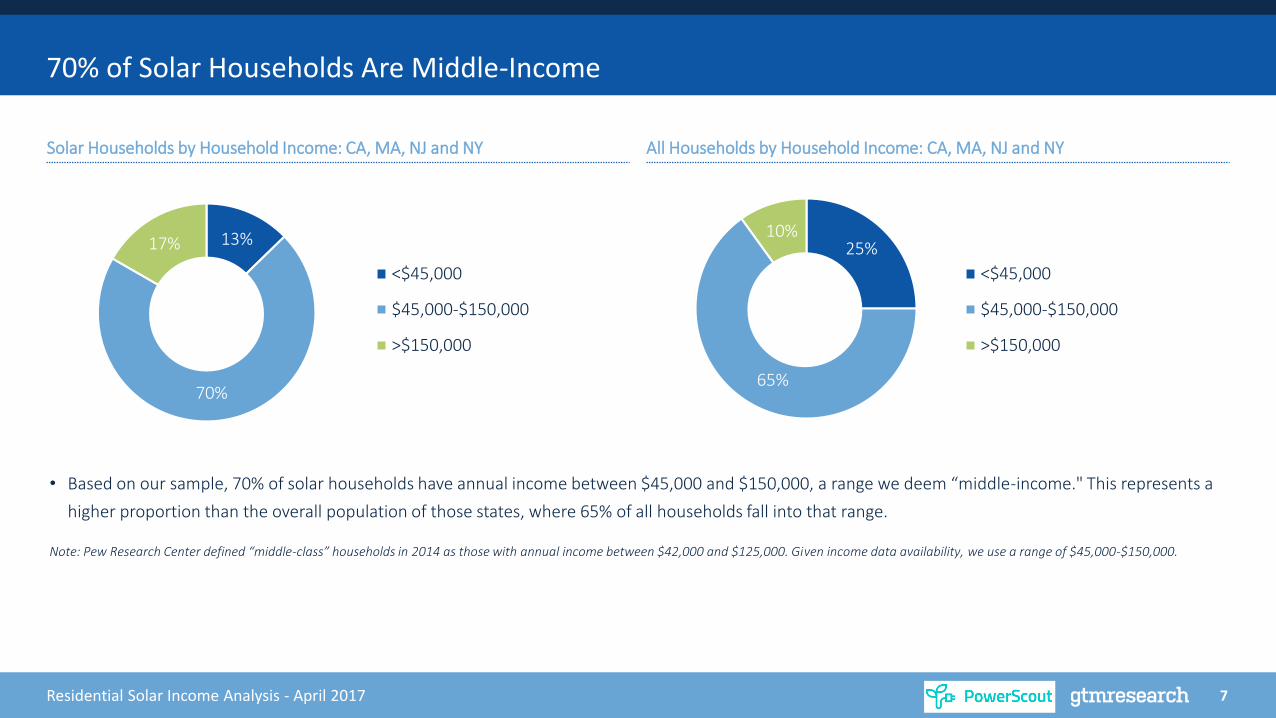
70% of Solar Households Are Middle-Income
Solar Households by Household Income: CA, MA, NJ and NY All Households by Household Income: CA, MA, NJ and NY
• Based on our sample, 70% of solar households have annual income between $45,000 and $150,000, a range we deem “middle-income." This represents a
higher proportion than the overall population of those states, where 65% of all households fall into that range.
Note: Pew Research Center defined “middle-class” households in 2014 as those with annual income between $42,000 and $125,000. Given income data availability, we use a range of $45,000-$150,000.
13%
70%
17%
<$45,000
$45,000-$150,000
>$150,000
25%
65%
10%
<$45,000
$45,000-$150,000
>$150,000

8Residential Solar Income Analysis - April 2017
Overall Distribution of Solar Households vs. General Population in CA, MA, NJ and NY
But Solar Households Do Tend to Skew Higher-Income Than the General Population
39.0%
44.3%
16.7%
55.6%
34.5%
9.9%
0.0%
10.0%
20.0%
30.0%
40.0%
50.0%
60.0%
<$74,999 $75,000-$149,999 >$149,999
Perc
enta
ge o
f H
ou
seh
old
s
Household Income
Solar Households All Households
• In our sample, 61% of solar households had annual an income of at least $75,000, as compared to 44% of the overall population of those states.

9Residential Solar Income Analysis - April 2017
Overall Distribution of Solar Households vs. General Population in CA, MA, NJ and NY
Households With Income Between $100k and $150k Are the Biggest Solar Demographic
0.00%
5.00%
10.00%
15.00%
20.00%
25.00%
30.00%
< $10,000 $15,000 -$19,999
$25,000 -$29,999
$35,000 -$39,999
$45,000 -$49,999
$55,000 -$59,999
$65,000 -$74,999
$100,000 -$149,999
$175,000 -$199,999
>= $250,000
Perc
enta
ge o
f H
ou
seh
old
s
Household Income
Solar Households All Households
10Residential Solar Income Analysis - April 2017
Overall Distribution of Solar Households vs. General Population in CA, MA, NJ and NY
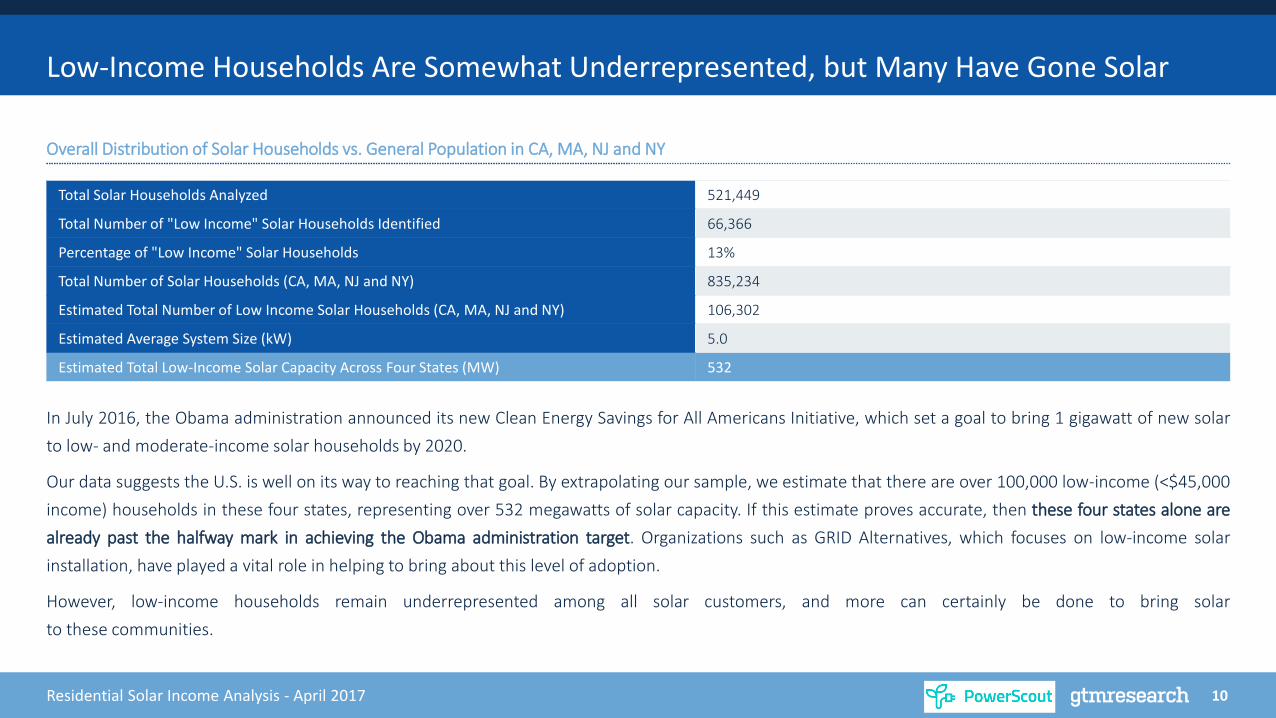
Low-Income Households Are Somewhat Underrepresented, but Many Have Gone Solar
In July 2016, the Obama administration announced its new Clean Energy Savings for All Americans Initiative, which set a goal to bring 1 gigawatt of new solar
to low- and moderate-income solar households by 2020.
Our data suggests the U.S. is well on its way to reaching that goal. By extrapolating our sample, we estimate that there are over 100,000 low-income (<$45,000
income) households in these four states, representing over 532 megawatts of solar capacity. If this estimate proves accurate, then these four states alone are
already past the halfway mark in achieving the Obama administration target. Organizations such as GRID Alternatives, which focuses on low-income solar
installation, have played a vital role in helping to bring about this level of adoption.
However, low-income households remain underrepresented among all solar customers, and more can certainly be done to bring solar
to these communities.
Total Solar Households Analyzed 521,449
Total Number of "Low Income" Solar Households Identified 66,366
Percentage of "Low Income" Solar Households 13%
Total Number of Solar Households (CA, MA, NJ and NY) 835,234
Estimated Total Number of Low Income Solar Households (CA, MA, NJ and NY) 106,302
Estimated Average System Size (kW) 5.0
Estimated Total Low-Income Solar Capacity Across Four States (MW) 532

11Residential Solar Income Analysis - April 2017
All States Are Not Equal
Household Income: Massachusetts Household Income: New York
Household Income: California Household Income: New Jersey
0%
5%
10%
15%
20%
25%
30%
< $10,000 $20,000 -$24,999
$35,000 -$39,999
$50,000 -$54,999
$65,000 -$74,999
$150,000 -$174,999
>=$250,000
% o
f H
ou
seh
old
s
Solar Households All Households
0%
5%
10%
15%
20%
25%
< $10,000 $20,000 -$24,999
$35,000 -$39,999
$50,000 -$54,999
$65,000 -$74,999
$150,000 -$174,999
% o
f H
ou
seh
old
s
Solar Households All Households
0%
5%
10%
15%
20%
25%
30%
< $10,000 $20,000 -$24,999
$35,000 -$39,999
$50,000 -$54,999
$65,000 -$74,999
$150,000 -$174,999
>=$250,000
% o
f H
ou
seh
old
s
Solar Households All Households
0%
5%
10%
15%
20%
25%
30%
< $10,000 $20,000 -$24,999
$35,000 -$39,999
$50,000 -$54,999
$65,000 -$74,999
$150,000 -$174,999
>=$250,000
% o
f H
ou
seh
old
s
Solar Households All Households

12Residential Solar Income Analysis - April 2017
Percentage of Solar Households Under State Median Income
New Jersey Has the Highest Share of Lower-Income Solar Households; New York Has the Lowest
34% 33%
29%
24%
0%
5%
10%
15%
20%
25%
30%
35%
40%
NJ MA CA NY
% o
f H
ou
seh
old
s

13Residential Solar Income Analysis - April 2017
Percentage of Households With >$250,000 Annual Income
The Wealthiest Households Often Go Solar – Except in New Jersey
10%
5%4%
6%
5%
7%
4% 4%
0%
2%
4%
6%
8%
10%
12%
California New Jersey Massachusetts New York
% o
f H
ou
seh
old
s
Solar Households All Households
14Residential Solar Income Analysis - April 2017
Differences in Solar Income Distribution Between States
It is unclear why the income distribution of solar households is skewed more toward wealthier households in California and New York than it is in
Massachusetts and New Jersey. Some potential explanations:
• Subsidies
◦ In New York, the state provides an additional tax credit (up to $5,000) that is eligible to be claimed by the customer, and thus requires equivalent state
tax liability in order to be monetized.
• Rate Structure
◦ In California, tiered electric rate structures may have provided additional incentive for households with high electric consumption (which tend to be
wealthier) to adopt solar
• Timing of Adoption
◦ In more mature markets (e.g., California), many solar installations occurred when solar system prices were higher and were likely driven by early
adopters (who tend to be wealthier)
• Network/Neighborhood Effects
◦ Various factors above may have been magnified by network/neighborhood effects – people whose neighbors have gone solar are more likely to adopt
solar themselves

15Residential Solar Income Analysis - April 2017
Suggestions for Future Research and Analysis
There are two primary limitations of this analysis:
1. Our limited sample size, which covers a portion of four states rather than the entire national market
◦ Future research should attempt a wider geographic scope to capture more state market diversity
2. Our research is a snapshot, but solar demographics change over time
◦ Future snapshots should compare against this data to determine whether, for example, lower-income households have been
increasingly adopting solar as technology costs fall and financing options proliferate

How Wealthy Are Residential Solar Customers?
April 2017
Household Income and Solar Adoption in the U.S.
Shayle Kann
Head of GTM Research
Attila Toth
CEO, PowerScout