how to select a rgb led driver - ti.com
TRANSCRIPT

1SLVAEF3–August 2019Submit Documentation Feedback
Copyright © 2019, Texas Instruments Incorporated
How to Select a RGB LED Driver
Application ReportSLVAEF3–August 2019
How to Select a RGB LED Driver
Hardy Wu, Charles Chen, Kenneth Du, Shawn Ding, Alex Wang
ABSTRACTThis application report describes what key considerations for the user when selecting RGB LED drivers indesign. Some basic concepts for RGB LED drivers are also introduced.
Contents1 Introduction ................................................................................................................... 22 LED Connection Types ..................................................................................................... 23 LED Power Supply........................................................................................................... 34 Dimming Method ............................................................................................................. 45 Communication Interface ................................................................................................... 66 Driver Topology .............................................................................................................. 97 Autonomous Control ....................................................................................................... 108 Optical Performance Index................................................................................................ 119 Correlated Color Temperature Control ................................................................................. 13
List of Figures
1 Common Anode LEDs and Current Sink Pair ........................................................................... 22 Common Cathode and Current Source Pair ............................................................................. 23 Power Supply Demonstration .............................................................................................. 34 VLED Definition .............................................................................................................. 35 Forward Voltage ............................................................................................................. 46 Headroom Voltage........................................................................................................... 47 Dimming Method Demonstration .......................................................................................... 58 RGB Color Mixing Model ................................................................................................... 59 CIE 1931 Color Space Model .............................................................................................. 510 Linear Versus Exponential Dimming Curve .............................................................................. 611 Communication Interface Demonstration................................................................................. 712 Structure of I2C ............................................................................................................... 813 Structure of SPI .............................................................................................................. 814 Structure of Single Wire..................................................................................................... 915 Direct Driving Method ...................................................................................................... 916 Time-Multiplexing Driving Method ......................................................................................... 917 Function Diagram .......................................................................................................... 1018 Without Programmable Engine ........................................................................................... 1019 With Programmable Engine............................................................................................... 1020 The CIE XYZ Standard Observer Color Matching Functions ........................................................ 1221 The CIE 1931 xyY Space Chromaticity Diagram ...................................................................... 12
List of Tables
Introduction www.ti.com
2 SLVAEF3–August 2019Submit Documentation Feedback
Copyright © 2019, Texas Instruments Incorporated
How to Select a RGB LED Driver
TrademarksAll trademarks are the property of their respective owners.
1 IntroductionA single LED can emit monochromatic light in red, green, or blue. These three primary color LEDstogether can generate many different colors by adjusting their brightness. By combining multiple LEDs andprograming their drivers, vivid and beautiful effects and animations can be performed. Applications in (butnot limited to) the industrial, automotive, and personal electronics can achieve dramatic visual effects andbetter human-machine interfaces by using RGB LEDs.
To select the right driver for the design, the user has several key considerations to decide on:• What is the LED type, common anode, or common cathode?• What is the power supply type, line power, or battery power?• Which dimming method: PWM or analog dimming?• Is there a special requirement for the communication interface?• Which topology plan to drive LEDs: direct driving or time-multiplexing driving?• Is a programmable lighting engine desired?
Some advanced aspects of color mixing are also introduced:• What are the common indexes to evaluate the optical performance of RGB LEDs?• How is the color temperature of RGB LEDs controlled?
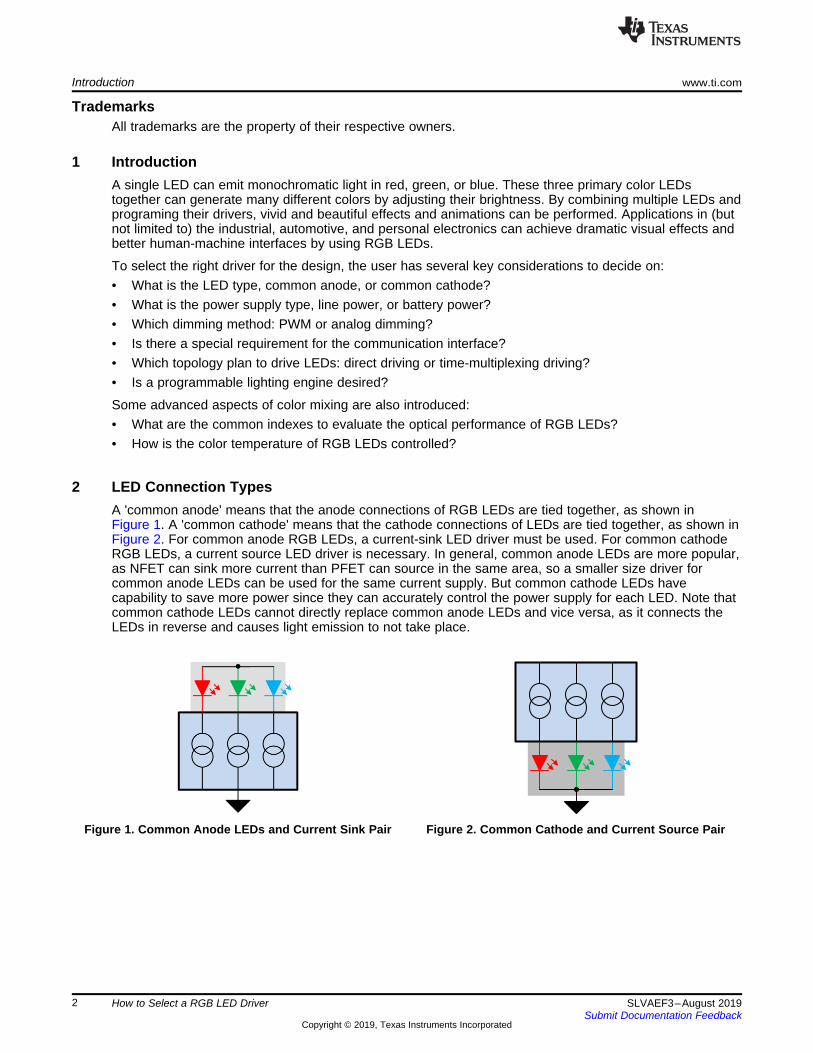
2 LED Connection TypesA 'common anode' means that the anode connections of RGB LEDs are tied together, as shown inFigure 1. A 'common cathode' means that the cathode connections of LEDs are tied together, as shown inFigure 2. For common anode RGB LEDs, a current-sink LED driver must be used. For common cathodeRGB LEDs, a current source LED driver is necessary. In general, common anode LEDs are more popular,as NFET can sink more current than PFET can source in the same area, so a smaller size driver forcommon anode LEDs can be used for the same current supply. But common cathode LEDs havecapability to save more power since they can accurately control the power supply for each LED. Note thatcommon cathode LEDs cannot directly replace common anode LEDs and vice versa, as it connects theLEDs in reverse and causes light emission to not take place.
Figure 1. Common Anode LEDs and Current Sink Pair Figure 2. Common Cathode and Current Source Pair

VF
VOUT
VLED
Power
LED F OUTV V V �
Line Power
Step-Up
Clock
Vin Vout
Battery Power
� Charge Pump
� DC-DC
Vin Vout
www.ti.com LED Power Supply
3SLVAEF3–August 2019Submit Documentation Feedback
Copyright © 2019, Texas Instruments Incorporated
How to Select a RGB LED Driver
3 LED Power Supply
3.1 Line Supply and Battery SupplyWhen the power supply comes from DC/DC, USB, or adapter, it is usually called a line power supply. Inthis case, LED drivers can be connected to the power supply directly, since the supply voltage is largerthan VLED. When it comes from battery power, which may be lithium ion batteries or AA batteries, supplyvoltage is not sufficient enough to power the RGB LEDs. Boost circuitry inside the driver is necessary toachieve the required VLED. Usually, there are two structures to boost the supply voltage: DC-DC orcharge pump.
Figure 3. Power Supply Demonstration
3.2 VLED DefinitionWhen it comes to LED driver design, power consideration is important. A common anode LED connection,for example, is shown in Equation 1. The voltage drop on the LED is called LED forward voltage, and thevoltage drop on the device channel is called channel output voltage. The LED power supply equals theLED forward voltage plus channel output voltage at the LED driver, as shown in Figure 4.
(1)
Figure 4. VLED Definition
Vout - Output voltage
I ou
t -O
utp
ut
curr
en
t
Vknee
VF -Forward voltage
I F -
Fo
rwa
rd c
urr
en
t
R G B W
LED Power Supply www.ti.com
4 SLVAEF3–August 2019Submit Documentation Feedback
Copyright © 2019, Texas Instruments Incorporated
How to Select a RGB LED Driver
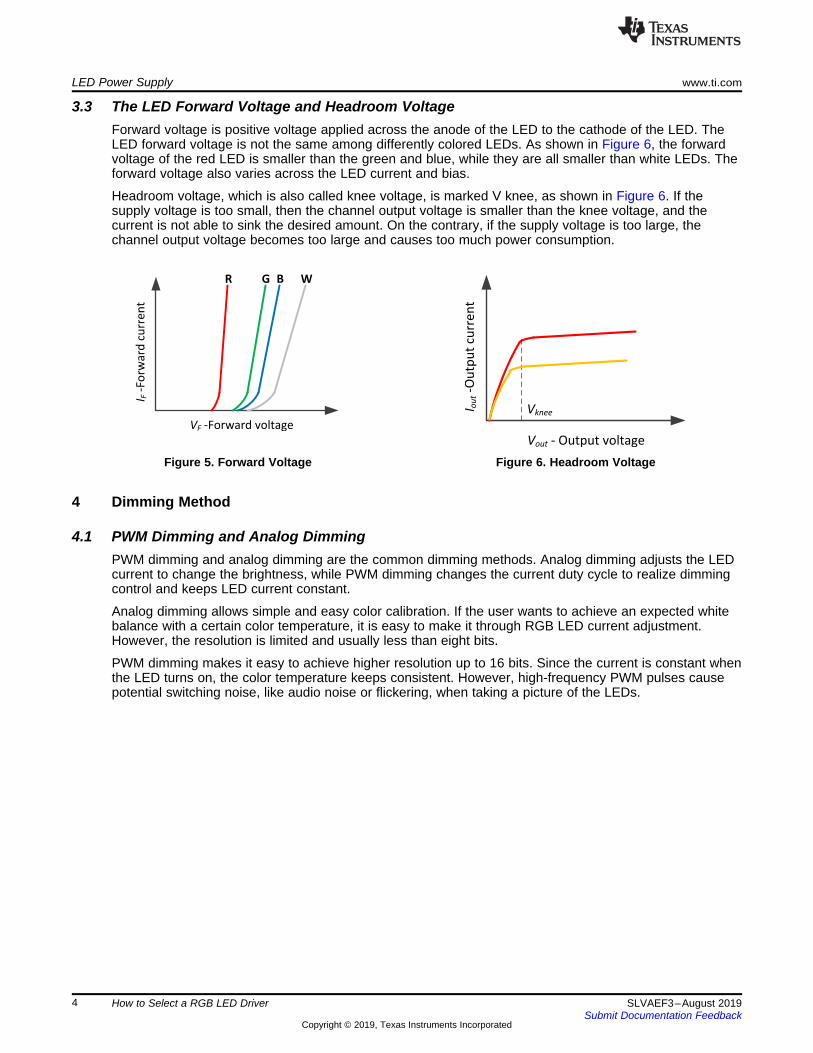
3.3 The LED Forward Voltage and Headroom VoltageForward voltage is positive voltage applied across the anode of the LED to the cathode of the LED. TheLED forward voltage is not the same among differently colored LEDs. As shown in Figure 6, the forwardvoltage of the red LED is smaller than the green and blue, while they are all smaller than white LEDs. Theforward voltage also varies across the LED current and bias.
Headroom voltage, which is also called knee voltage, is marked V knee, as shown in Figure 6. If thesupply voltage is too small, then the channel output voltage is smaller than the knee voltage, and thecurrent is not able to sink the desired amount. On the contrary, if the supply voltage is too large, thechannel output voltage becomes too large and causes too much power consumption.
Figure 5. Forward Voltage Figure 6. Headroom Voltage
4 Dimming Method
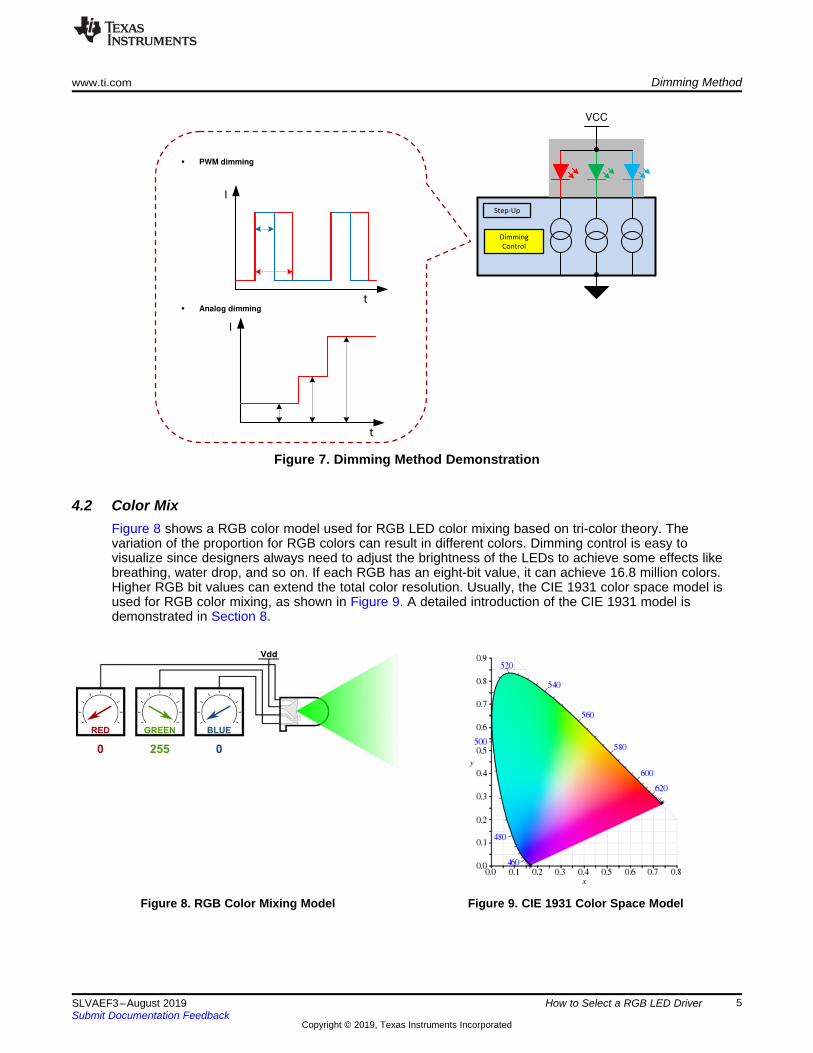
4.1 PWM Dimming and Analog DimmingPWM dimming and analog dimming are the common dimming methods. Analog dimming adjusts the LEDcurrent to change the brightness, while PWM dimming changes the current duty cycle to realize dimmingcontrol and keeps LED current constant.
Analog dimming allows simple and easy color calibration. If the user wants to achieve an expected whitebalance with a certain color temperature, it is easy to make it through RGB LED current adjustment.However, the resolution is limited and usually less than eight bits.
PWM dimming makes it easy to achieve higher resolution up to 16 bits. Since the current is constant whenthe LED turns on, the color temperature keeps consistent. However, high-frequency PWM pulses causepotential switching noise, like audio noise or flickering, when taking a picture of the LEDs.
Step-Up
VCC
Dimming
Control
� PWM dimming
� Analog dimming
t
I
t
I
www.ti.com Dimming Method
5SLVAEF3–August 2019Submit Documentation Feedback
Copyright © 2019, Texas Instruments Incorporated
How to Select a RGB LED Driver
Figure 7. Dimming Method Demonstration
4.2 Color MixFigure 8 shows a RGB color model used for RGB LED color mixing based on tri-color theory. Thevariation of the proportion for RGB colors can result in different colors. Dimming control is easy tovisualize since designers always need to adjust the brightness of the LEDs to achieve some effects likebreathing, water drop, and so on. If each RGB has an eight-bit value, it can achieve 16.8 million colors.Higher RGB bit values can extend the total color resolution. Usually, the CIE 1931 color space model isused for RGB color mixing, as shown in Figure 9. A detailed introduction of the CIE 1931 model isdemonstrated in Section 8.
Figure 8. RGB Color Mixing Model Figure 9. CIE 1931 Color Space Model
Pe
rce
ive
d B
rig
htn
ess
100 %
80 %
60 %
40 %
20 %
0 %
0 32 64 96 128 160 192 224 255
Luminance
Brightness Perception of Human Eye
PW
M O
utp
ut
Du
ty
100 %
80 %
60 %
40 %
20 %
0 %
0 32 64 96 128 160 192 224 255
LEDx_BRIGHTNESS Register Input
Logarithmic Scale Dimming Curve
255
PW
M O
utp
ut
Du
ty
100 %
80 %
60 %
40 %
20 %
0 %
0 32 64 96 128 160 192 224
LEDx_BRIGHTNESS Register Input
Linear Scale Dimming Curve
255
Pe
rce
ive
d B
rig
htn
ess
100 %
80 %
60 %
40 %
20 %
0 %
0 32 64 96 128 160 192 224
Luminance
Brightness Perception
Pe
rce
ive
d B
rig
htn
ess
100 %
80 %
60 %
40 %
20 %
0 %
0 32 64 96 128 160 192 224 255
Luminance
Brightness Perception
Human EyeExponential
Linear
Dimming Method www.ti.com
6 SLVAEF3–August 2019Submit Documentation Feedback
Copyright © 2019, Texas Instruments Incorporated
How to Select a RGB LED Driver
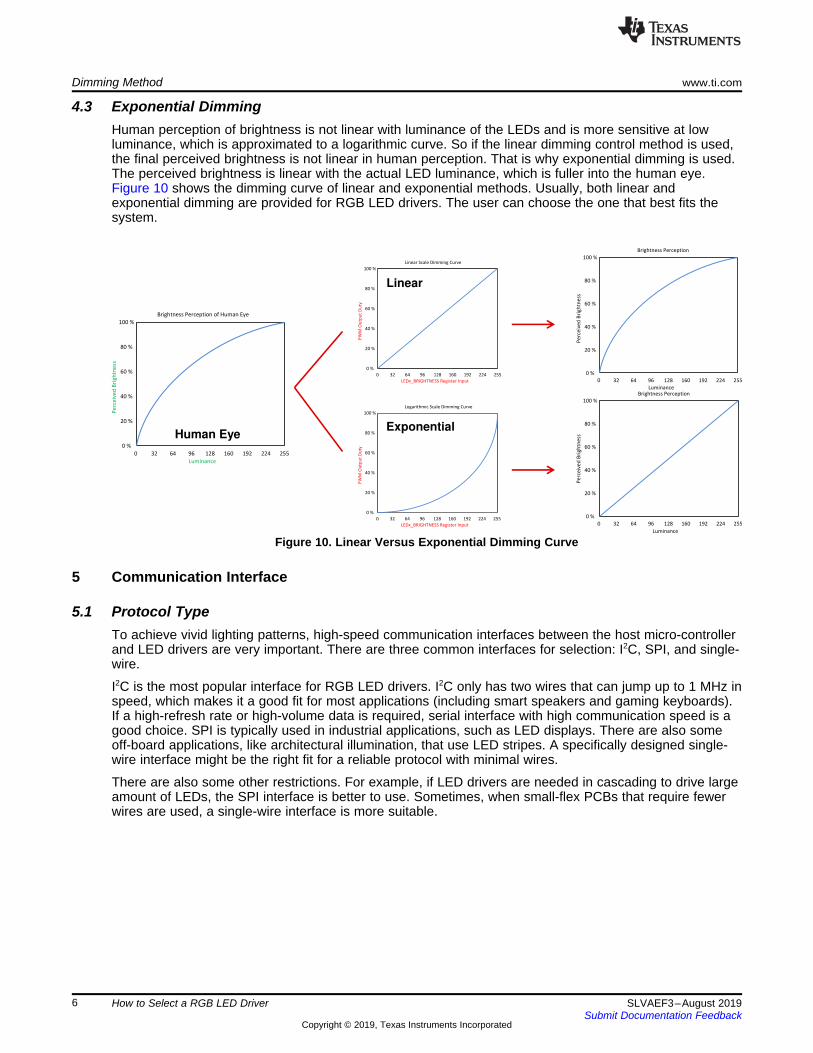
4.3 Exponential DimmingHuman perception of brightness is not linear with luminance of the LEDs and is more sensitive at lowluminance, which is approximated to a logarithmic curve. So if the linear dimming control method is used,the final perceived brightness is not linear in human perception. That is why exponential dimming is used.The perceived brightness is linear with the actual LED luminance, which is fuller into the human eye.Figure 10 shows the dimming curve of linear and exponential methods. Usually, both linear andexponential dimming are provided for RGB LED drivers. The user can choose the one that best fits thesystem.
Figure 10. Linear Versus Exponential Dimming Curve
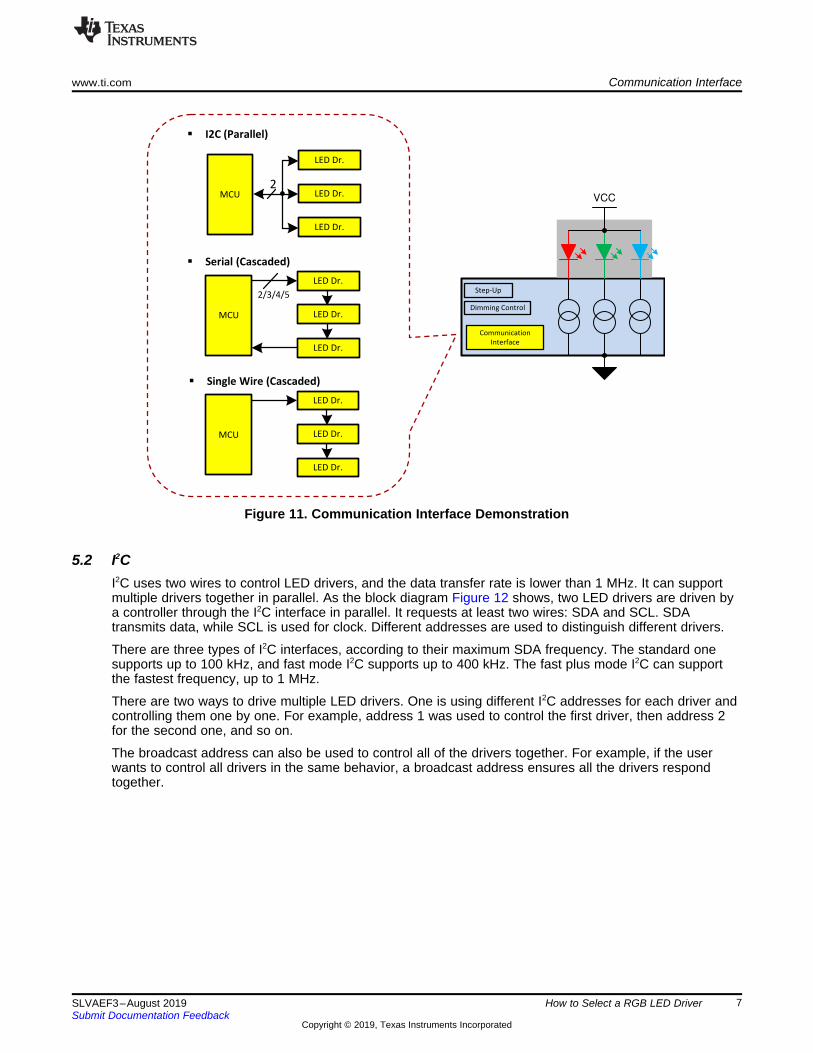
5 Communication Interface
5.1 Protocol TypeTo achieve vivid lighting patterns, high-speed communication interfaces between the host micro-controllerand LED drivers are very important. There are three common interfaces for selection: I2C, SPI, and single-wire.
I2C is the most popular interface for RGB LED drivers. I2C only has two wires that can jump up to 1 MHz inspeed, which makes it a good fit for most applications (including smart speakers and gaming keyboards).If a high-refresh rate or high-volume data is required, serial interface with high communication speed is agood choice. SPI is typically used in industrial applications, such as LED displays. There are also someoff-board applications, like architectural illumination, that use LED stripes. A specifically designed single-wire interface might be the right fit for a reliable protocol with minimal wires.
There are also some other restrictions. For example, if LED drivers are needed in cascading to drive largeamount of LEDs, the SPI interface is better to use. Sometimes, when small-flex PCBs that require fewerwires are used, a single-wire interface is more suitable.
Step-Up
VCC
Dimming Control
Communication
Interface
� I2C (Parallel)
� Serial (Cascaded)
MCU
LED Dr.
2/3/4/5
LED Dr.
LED Dr.
� Single Wire (Cascaded)
MCU
LED Dr.
LED Dr.
LED Dr.
MCU
LED Dr.
LED Dr.
LED Dr.
2
www.ti.com Communication Interface
7SLVAEF3–August 2019Submit Documentation Feedback
Copyright © 2019, Texas Instruments Incorporated
How to Select a RGB LED Driver
Figure 11. Communication Interface Demonstration
5.2 I2CI2C uses two wires to control LED drivers, and the data transfer rate is lower than 1 MHz. It can supportmultiple drivers together in parallel. As the block diagram Figure 12 shows, two LED drivers are driven bya controller through the I2C interface in parallel. It requests at least two wires: SDA and SCL. SDAtransmits data, while SCL is used for clock. Different addresses are used to distinguish different drivers.
There are three types of I2C interfaces, according to their maximum SDA frequency. The standard onesupports up to 100 kHz, and fast mode I2C supports up to 400 kHz. The fast plus mode I2C can supportthe fastest frequency, up to 1 MHz.
There are two ways to drive multiple LED drivers. One is using different I2C addresses for each driver andcontrolling them one by one. For example, address 1 was used to control the first driver, then address 2for the second one, and so on.
The broadcast address can also be used to control all of the drivers together. For example, if the userwants to control all drivers in the same behavior, a broadcast address ensures all the drivers respondtogether.

Controller
OU
T0
�
SIN
SCLK
LAT
GCLK
IREFGND
VCC
SOUT
IC1
RIREF
VCC
DATA
SCLK
LAT
GSCLK
DATA BACK
RIREF
VLED
OU
T1
OU
T2
OU
Tn
-1
OU
Tn
OU
Tn
-2
OU
T0
�
SIN
SCLK
LAT
GCLK
IREFGND
VCC
SOUT
IC2
VCC
OU
T1
OU
T2
OU
Tn
-1
OU
Tn
OU
Tn
-2
� �
Controller
VMCU
RPULLUPRPULLUP
EN/PWM
SDA
SCL
OUT0
OUT1
OUT23
VCC
GND
IC1
ADDR0
OUT2
VLED
VCC
OUT22
OUT21
ADDR1
EN/PWM
SDA
SCL
OUT0
OUT1
OUT23
VCC
GND
IC1
ADDR0
OUT2
VLED
VCC
OUT22
OUT21
ADDR1
Communication Interface www.ti.com
8 SLVAEF3–August 2019Submit Documentation Feedback
Copyright © 2019, Texas Instruments Incorporated
How to Select a RGB LED Driver
Figure 12. Structure of I2C
5.3 SPIThe data transfer rate of SPI is much higher than I2C, which is up to 35 MHz, so that SPI is suitable forapplications that require high-speed data transfer rates. In this scenario, the user can use multiple LEDdrivers in a cascade to drive all LEDs or LED arrays. Since the data transfer rate is high, large quantitiesof LED drivers can be used together. Serial interfaces are also suitable to drive time-multiplexing matrixdisplays.
For example, Figure 13 shows an interface with four wires. SIN is used for data input and SCLK is used incomparison with SIN to shift the data into the driver. LAT is used for latching the data into the internalregisters of the driver. GCLK is a clock reference for output PWM signals. For drivers with an internaloscillator, GCLK is not necessary.
Figure 13. Structure of SPI

VCC
Scan Line 1
Scan Line Y
Device 1
VCC
Device 1 Device N
Controller
OUT0 OUT2
SDI
IREFGND
VCC
SDO
IC1
RIREF
OUT0 OUT2OUT1
SDI
IREFGND
VCC
SDO
IC2
DATA
RIREF
VLED
OUT1
www.ti.com Communication Interface
9SLVAEF3–August 2019Submit Documentation Feedback
Copyright © 2019, Texas Instruments Incorporated
How to Select a RGB LED Driver
5.4 Single WireSingle-wire interfaces target applications that require multiple LED drivers in cascading, and long signalswires that need to avoid data losses. The maximum data transfer rate for a single-wire interface is 3 MHz.Just as the name implies, single-wire interfaces use one wire to communicate with the host. Drivers haveSDI for data input and SDO for output to the next driver, so there are not long signal wires from thecontroller. To make sure there are no data losses, an internal buffer is necessary. This makes it possibleto connect unlimited devices in a series. A single-wire interface can also reduce wire costs andcommunication failure, making it a great option for applications using a long LED stripe.
Figure 14. Structure of Single Wire
6 Driver TopologyDirect drive and time-multiplexing drive are two driver topologies for a different count of LEDs. When theLED channel count is less than 100, it is recommended to go with the direct driving method that makes foreasy connection and simple control. If the LED channel count is above 100, the time-multiplexing drivingmethod must be considered. It can reduce the device count dramatically with additional Y external FETsand some decode ICs, which can drive X times Y channels in total.
Figure 15. Direct Driving Method Figure 16. Time-Multiplexing Driving Method
The work sequence of the time-multiplexing LED matrix is introduced as follows: First, signal the first-lineswitch to turn on this line FET. Then, turn the current sinks in all channels on; the LEDs connected to thisline lights up. After turning the channels off, the LEDs of this line also turn off. Next, shut down the first-line FET. Signaling the second-line switch, which turns on the next line FET, then turns on all lines andfollows the same sequence. This begins the next period display.

Typical LED driver
Command based
pattern generator
Program memory
Autonomous Control www.ti.com
10 SLVAEF3–August 2019Submit Documentation Feedback
Copyright © 2019, Texas Instruments Incorporated
How to Select a RGB LED Driver
This is not a flawless structure, and it brings a lot of issues. The common issues of the display mainlyconsist of:• Dimming and first scan line• Color shift and low grayscale• Upper side and downside ghost• Caterpillar by open LED• Non-uniformity and low grayscale• Coupling issues
Fortunately, TI has the technology that can solve these problems and achieve great LED displayperformance.
7 Autonomous ControlIn order to improve the user experience in smart home or other human-machine interaction applications,advanced LED animation effects, like breathing and color changing, are used. However, a common issueis that the MCU becomes overloaded by trying to handle the fancy but complex lighting patterns. Tooptimize this, TI has a portfolio of RGB LED drivers that provide a unique programmable lighting enginefunction, which allows the LED driver to operate autonomously without MCU control.
Figure 17 shows an RGB LED driver diagram with a programmable lighting engine. Besides a digitalinterface and a multi-channel output stage, this LED driver also includes a programmable memory and acommand-based pattern generator. This allows for all lighting patterns to be coded as commands, whichare stored in the program memory inside the LED driver. When the animation effect starts, the patterngenerator compiles the commands and controls the output stage automatically.
Figure 17. Function Diagram
When playing the animation patterns without a programmable lighting engine, a MCU takes full ownershipof controlling the lighting patterns. It causes the MCU to complete the remaining operation and drainssystem power. With the use of a programmable lighting engine, it becomes a one-time job for the MCU toload the commands into the LED driver. After loading, the LED driver works as a commander to deliverthe programmed lighting patterns autonomously while the MCU is sleeping. The lighting engine can beoffloaded from the MCU and system-level standby power can be reduced.

1
Xx
X Y ZY
yX Y Z
Zz x y
X Y Z
� �
� �
� �� �
780
380
780
380
780
380
780
380
( ) ( )
( ) ( )
( ) ( )
100
( ) ( )
X k S x d
Y k S y d
Z k S z d
kS y d
O O O
O O O
O O O
O O O
³
³
³
³
time
MCU loading
MCULED Driver
Without Engine
time
MCU loading
MCULED Driver
With Engine
www.ti.com Optical Performance Index
11SLVAEF3–August 2019Submit Documentation Feedback
Copyright © 2019, Texas Instruments Incorporated
How to Select a RGB LED Driver
Figure 18. Without Programmable Engine Figure 19. With Programmable Engine
8 Optical Performance Index
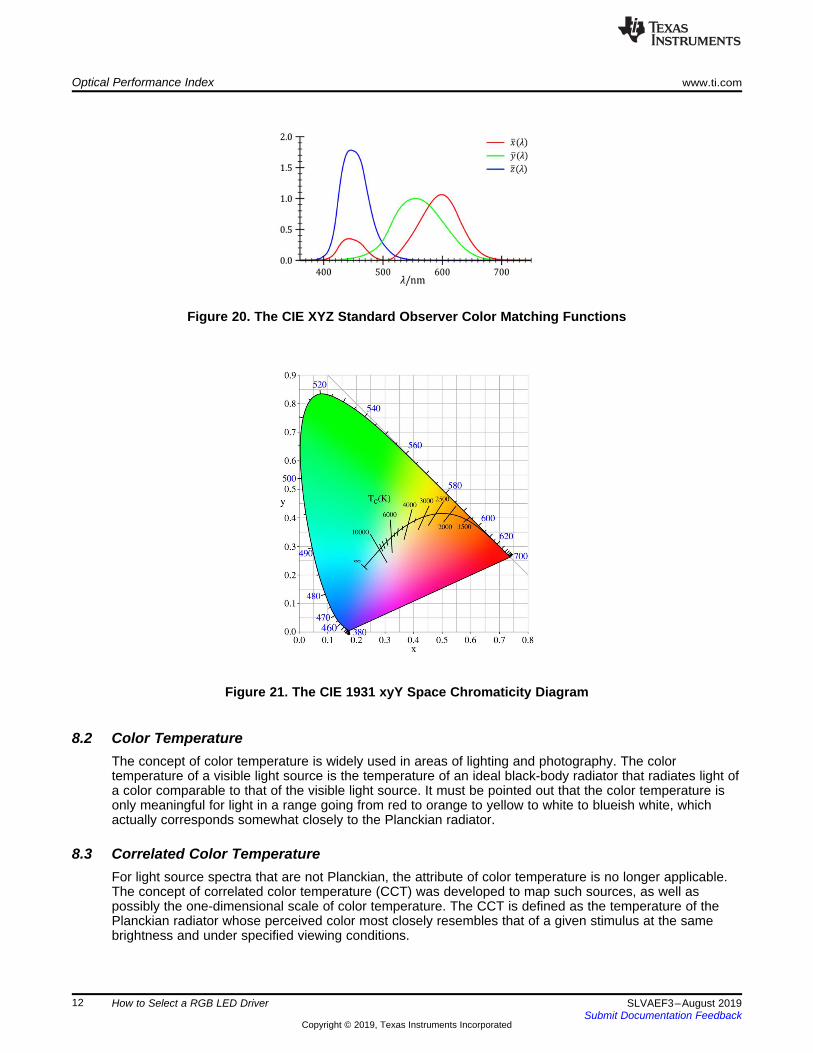
8.1 Introduction to CIE1931 Color SpaceAs shown in Figure 20, the color matching functions of the CIE are the numerical description of thechromatic response of the observer. They can be thought of as the spectral sensitivity curves of threelinear light detectors yielding the CIE tristimulus values X, Y, and Z. The tristimulus values X, Y, and Z canbe computed from spectral data with Equation 2, where S(λ) represents the relative energy distribution ofspectrum of light source. x(λ), y(λ), and z(λ) represent color matching functions; λ is the wavelength of theequivalent monochromatic light.
(2)
The tristimulus value Y is defined as luminance, since y(λ) is roughly analogous to the spectral sensitivityof human cone cells of middle wavelength types. The chromaticity coordinates x and y of the CIE 1931color space can be derived from three tristimulus values X, Y, and Z with Equation 3.
(3)
As shown in Figure 21, the derived color space specified by x, y, and Y is known as the CIE xyY colorspace. It is widely used to specify colors in practice. The tristimulus values X and Z can be calculatedback from the chromaticity values x, y, and the Y tristimulus value.
Optical Performance Index www.ti.com
12 SLVAEF3–August 2019Submit Documentation Feedback
Copyright © 2019, Texas Instruments Incorporated
How to Select a RGB LED Driver
Figure 20. The CIE XYZ Standard Observer Color Matching Functions
Figure 21. The CIE 1931 xyY Space Chromaticity Diagram
8.2 Color TemperatureThe concept of color temperature is widely used in areas of lighting and photography. The colortemperature of a visible light source is the temperature of an ideal black-body radiator that radiates light ofa color comparable to that of the visible light source. It must be pointed out that the color temperature isonly meaningful for light in a range going from red to orange to yellow to white to blueish white, whichactually corresponds somewhat closely to the Planckian radiator.
8.3 Correlated Color TemperatureFor light source spectra that are not Planckian, the attribute of color temperature is no longer applicable.The concept of correlated color temperature (CCT) was developed to map such sources, as well aspossibly the one-dimensional scale of color temperature. The CCT is defined as the temperature of thePlanckian radiator whose perceived color most closely resembles that of a given stimulus at the samebrightness and under specified viewing conditions.

( , , )GR B
B B B
CCTII I
[I I I
0.3320
0.1858
xA
y
�
�
3 2449 3525 6823.3 5520.33CCT A A A � � �
, 1 1 1 1 1 1
G GR R B B GR B
R B G B B B B B B
G GR B R B
R B G B B B R B G B B B
xx x
y y yx y
y y y y y y
II I II I
I I I I I I
I II I I I
I I I I I I
� � � �
� � � �
1 1 11
1 1 1 1
, 1 1 1 1
N N NNi i i i
i ii i ii i N i N
N N N N
i i
i i
i i i ii i N i i N
x x
y yx y
y y y y
I II I
I I
I II I
I I
¦ ¦ ¦¦
¦ ¦ ¦ ¦
www.ti.com Optical Performance Index
13SLVAEF3–August 2019Submit Documentation Feedback
Copyright © 2019, Texas Instruments Incorporated
How to Select a RGB LED Driver
8.4 Color Tolerance AdjustmentAccording to the definition of CCT, it can be concluded that multiple chromaticity coordinates can bemapped to a specific CCT. In other words, different colors can have the same CCT value. The linecorresponding to equal CCT is shown in Figure 21. In order to describe the color accurately by using CCT,the concept of color tolerance adjustment is usually used in different standards, which defines thedifference between the spectrum emitted by the light source and the standard spectrum.
9 Correlated Color Temperature ControlLet (xi, yi) denote the CIE 1931 chromaticity coordinates and Φi denote the luminous flux of the lightemitted by the ith LEDs. The color coordinates (x, y) of light synthesized by N LEDs can be calculated withEquation 4.
(4)
For RGB LEDs (i= R, G, B), the corresponding equations can be derived as Equation 5.
(5)
The CCT of the synthesized light is as Equation 6.
(6)
Since variations of the (xi, yi, i=R, G, B) are relatively small, the CCT synthesized by RGB LEDs can beexpressed as a function of the flux ratios Φi/ ΦB, as shown in Equation 7.
(7)
Hence, the color temperature can be controlled by adjusting the proportions of luminous flux of RGB LEDsaccording to Equation 7.
Besides, the luminous flux of light synthesized by RGB LEDs can be calculated by Equation 8 if PWMdimming is adopted, where ΦRN, ΦGN, and ΦBN represent the nominal luminous flux of R, G, and B LEDs atrated current, and DR, DG, and DB represent the duty cycles of each R, G, and B channels.

R G B
R RN G GN B BND D D
I I I I
I I I
� �
� �
Correlated Color Temperature Control www.ti.com
14 SLVAEF3–August 2019Submit Documentation Feedback
Copyright © 2019, Texas Instruments Incorporated
How to Select a RGB LED Driver
(8)
The concrete chromaticity coordinates can be derived from the expected CCT value, and the desired colortolerance adjustment required by different standard according to Equation 6. For a given color (x, y) andthe desired luminous flux Φ, the duty cycles can be can be solved exactly to achieve accurate colortemperature control of RGB LEDs according to Equation 5 and Equation 8.

IMPORTANT NOTICE AND DISCLAIMER
TI PROVIDES TECHNICAL AND RELIABILITY DATA (INCLUDING DATASHEETS), DESIGN RESOURCES (INCLUDING REFERENCEDESIGNS), APPLICATION OR OTHER DESIGN ADVICE, WEB TOOLS, SAFETY INFORMATION, AND OTHER RESOURCES “AS IS”AND WITH ALL FAULTS, AND DISCLAIMS ALL WARRANTIES, EXPRESS AND IMPLIED, INCLUDING WITHOUT LIMITATION ANYIMPLIED WARRANTIES OF MERCHANTABILITY, FITNESS FOR A PARTICULAR PURPOSE OR NON-INFRINGEMENT OF THIRDPARTY INTELLECTUAL PROPERTY RIGHTS.These resources are intended for skilled developers designing with TI products. You are solely responsible for (1) selecting the appropriateTI products for your application, (2) designing, validating and testing your application, and (3) ensuring your application meets applicablestandards, and any other safety, security, or other requirements. These resources are subject to change without notice. TI grants youpermission to use these resources only for development of an application that uses the TI products described in the resource. Otherreproduction and display of these resources is prohibited. No license is granted to any other TI intellectual property right or to any thirdparty intellectual property right. TI disclaims responsibility for, and you will fully indemnify TI and its representatives against, any claims,damages, costs, losses, and liabilities arising out of your use of these resources.TI’s products are provided subject to TI’s Terms of Sale (www.ti.com/legal/termsofsale.html) or other applicable terms available either onti.com or provided in conjunction with such TI products. TI’s provision of these resources does not expand or otherwise alter TI’s applicablewarranties or warranty disclaimers for TI products.
Mailing Address: Texas Instruments, Post Office Box 655303, Dallas, Texas 75265Copyright © 2019, Texas Instruments Incorporated