how to read a value line reportinvestor.valueline.com/hubfs/guides/1503516... · how to read a...
TRANSCRIPT

VALUE LINE INVESTMENT EDUCATION
How to Read a Value Line Report
Smart research. Smarter investing.™

©2017 Value Line, Inc. All Rights Reserved. Value Line, the Value Line logo, The Value Line Investment Survey, The Most Trusted Name in Investment Research, “Smart research. Smarter investing.”, Timeliness, and Safety are trademarks or registered trademarks of Value Line, Inc. and/or its affiliates in the United States and other countries. All other trademarks are the property of their respective owners. Factual material is obtained from sources believed to be reliable and any information contained herein is provided without warranties of any kind. VALUE LINE IS NOT RESPONSIBLE FOR ANY ERRORS OR OMISSIONS HEREIN OR ANY DAMAGES OR LOSSES ARISING FROM ANY USE OF THIS REPORT. This report is strictly for each subscriber’s own, non-commercial, internal use. No part of this report may be reproduced, resold, stored or transmitted in any printed, electronic or other form, or used for generating or marketing any printed or electronic publication, service or product. Nothing herein should be construed as an offer to buy or sell securities or to give individual investment advice. Value Line Arithmetic and Geometric indices calculated by Thomson Reuters. Information supplied by Thomson Reuters. 1503516

How to Read a Value Line Report 1
How to Read a Value Line Report
In order to make the best use of Value Line products, you’ll want to understand our research reports and put them in context. This guide was designed to help you do just that. Referring to this guide will assist you in using our services as forecasters of relative stock price performance as well as a source of interpretive analysis and historical information that will assist you in spotting trends.
I: GETTING STARTED
As a subscriber, you will receive three parts of The Value Line Investment Survey® each week. Part 1 is the Summary & Index, Part 2 is Selection & Opinion and Part 3 is Ratings & Reports. Below we will describe each section and discuss some of the ways to use them.
Part 1 — Summary & Index
We will start with the Summary & Index. The front cover contains a Table of Contents, three important market statis-tics, and a list of all the industries we follow in alphabetical order with their current industry rank shown next to the name. The page number is to the right. The market statistics are found in three boxes. The first box (A) has the median of estimated price/earnings ratios of all stocks with earnings covered in The Value Line Investment Survey (approximately 1,700). The second box (B) shows the median of estimated dividend yields (total dividends expected to be paid in the next 12 months divided by the recent price) of all dividend-paying stocks in The Value Line Investment Survey. The third box (C) contains the estimated median price appreciation
potential 3 to 5 years into the future for the approximately 1,700 stocks in The Value Line Investment Survey, based on Value Line’s hypothesized economic environment 3 to 5 years hence. A fairly good picture emerges of how the Value Line universe is evaluated.
What’s more, The Value Line Investment Survey comprises approximately 90% of the market capitalization of all eq-uities traded in U.S. markets, and therefore represents the stock market as a whole quite well.
Summary & Index
Industries, in alphabetical order .................................................................................................................................. 1Stocks, in alphabetical order .................................................................................................................................. 2-23Noteworthy Rank Changes .................................................................................................................................. 24-26
Industries, in order of Timeliness Rank .................. 24Timely Stocks in Timely Industries ......................... 26Timely Stocks (1 & 2 for Performance) ............. 27-29Conservative Stocks (1 & 2 for Safety) ............. 30-31Highest Dividend Yielding Stocks ........................... 32Stocks with High 3- to 5-year Price Potential ......... 32Biggest ″Free Flow″ Cash Generators ................... 33Best Performing Stocks last 13 Weeks .................. 33Worst Performing Stocks last 13 Weeks ................ 33Widest Discounts from Book Value ........................ 34
Stocks with Lowest P/Es ........................................ 35Stocks with Highest P/Es ........................................ 35Stocks with Highest Annual Total Returns ............. 36Stocks with Highest 3- to 5-year Dividend Yield .... 36High Returns Earned on Total Capital .................... 37Bargain Basement Stocks ...................................... 37Untimely Stocks (5 for Performance) ...................... 38Highest Dividend Yielding Non-utility Stocks .......... 38Highest Growth Stocks ........................................... 39
Advertising (9) ............................. 2389Aerospace/Defense (72) ............... 701Air Transport (63) .......................... 301Apparel (24) ................................. 2101Automotive (5) ............................... 101Auto Parts (12) .............................. 973
*Bank (77) ..................................... 2501Bank (Midwest) (94) ...................... 775Beverage (71) .............................. 1967Biotechnology (89) ........................ 828Brokers & Exchanges (80) .......... 1791Building Materials (11) ................. 1101Cable TV (4) ................................ 1016Chemical (Basic) (97) .................. 1597Chemical (Diversified) (67) .......... 2443Chemical (Specialty) (68) .............. 557Computers/Peripherals (53) ........ 1391
*Computer Software (69) .............. 2586Diversified Co. (65) ..................... 1737Drug (46) ..................................... 1609E-Commerce (36) ........................ 1811Educational Services (79) ........... 2001Electrical Equipment (59) ............ 1301Electric Util. (Central) (43) ............. 901Electric Utility (East) (42) .............. 138
Electric Utility (West) (14) ........... 2224Electronics (47) ........................... 1317Engineering & Const (74) ............ 1230Entertainment (34) ....................... 2328Entertainment Tech (88) ............. 2009Environmental (84) ........................ 411
*Financial Svcs. (Div.) (45) ........... 2534Food Processing (57) .................. 1901Foreign Electronics (1) ................ 1985Funeral Services (64) .................. 1833Furn/Home Furnishings (23) ....... 1147Healthcare Information (18) .......... 820Heavy Truck & Equip (85) ............. 151Homebuilding (7) ......................... 1123Hotel/Gaming (15) ....................... 2351Household Products (54) ............. 1187Human Resources (40) ............... 1640Industrial Services (41) ................. 379Information Services (48) .............. 436
*IT Services (73) ........................... 2608Insurance (Life) (95) .................... 1551Insurance (Prop/Cas.) (93) ............ 754
*Internet (50) ................................. 2631Investment Banking (37) ............. 1803Investment Co. (--) ...................... 1202
Investment Co.(Foreign) (--) .......... 421Machinery (78) ............................ 1701Maritime (28) ................................. 330Medical Services (10) .................... 793Med Supp Invasive (76) ................ 170Med Supp Non-Invasive (82) ........ 196Metal Fabricating (60) ................... 729Metals & Mining (Div.) (61) ......... 1580Natural Gas Utility (75) .................. 546Natural Gas (Div.) (29) .................. 524Newspaper (81) ........................... 2382Office Equip/Supplies (21) .......... 1409Oil/Gas Distribution (70) ................ 604Oilfield Svcs/Equip. (92) .............. 2418Packaging & Container (38) ........ 1173Paper/Forest Products (17) ......... 1163Petroleum (Integrated) (20) ........... 501Petroleum (Producing) (33) ......... 2399Pharmacy Services (2) .................. 964Pipeline MLPs (51) ........................ 616Power (49) ................................... 1213Precious Metals (3) ..................... 1563Precision Instrument (66) .............. 112
*Public/Private Equity (35) ............ 2657Publishing (96) ............................ 2374
Railroad (55) .................................. 339R.E.I.T. (27) ................................. 1511Recreation (13) ............................ 2301Reinsurance (87) ......................... 2023Restaurant (19) ............................. 351Retail Automotive (8) ................... 2118Retail Building Supply (58) .......... 1138Retail (Hardlines) (22) ................. 2163Retail (Softlines) (26) .................. 2200Retail Store (16) .......................... 2132Retail/Wholesale Food (39) ......... 1945Semiconductor (62) ..................... 1347Semiconductor Equip (56) ........... 1379Shoe (32) ..................................... 2154Steel (52) ....................................... 739Telecom. Equipment (44) .............. 939Telecom. Services (31) ................. 918Telecom. Utility (30) .................... 1024Thrift (90) ..................................... 1501Tobacco (86) ............................... 1993Toiletries/Cosmetics (25) ............. 1006Trucking (83) ................................. 318Water Utility (91) ......................... 1781Wireless Networking (6) ................ 588
In three parts: This is Part 1, the Summary & Index. Part 2 is Selection & Opinion. Part 3 is Ratings & Reports. Volume LXXII, No. 39.Published weekly by VALUE LINE PUBLISHING LLC, 551 Fifth Avenue, New York, NY 10176
© 2017 Value Line, Inc. All rights reserved. Factual material is obtained from sources believed to be reliable and is provided without warranties of any kind. THE PUBLISHER IS NOTRESPONSIBLE FOR ANY ERRORS OR OMISSIONS HEREIN. This publication is strictly for each subscriber’s own, non-commercial, internal use. No part of this publication may bereproduced, resold, stored or transmitted in any printed, electronic or other form, or used for generating or marketing any printed or electronic publication, service or product.
See back cover for important disclosures.
Part 1
Summary&
Index
THE ALUE LINEInvestment Survey®
File at the front of theRatings & Reports
binder. Last week’sSummary & Index
should be removed.
May 12, 2017
®
TABLE OF SUMMARY & INDEX CONTENTS Summary & IndexPage Number
SCREENS
The Median of EstimatedPRICE-EARNINGS RATIOS
of all stocks with earnings
20.126 Weeks Market Low Market High
Ago18.2
3-9-0910.3
3-1-1719.6
The Median of EstimatedDIVIDEND YIELDS
(next 12 months) of all dividendpaying stocks under review
2.0%26 Weeks Market Low Market High
Ago2.3%
3-9-094.0%
3-1-172.0%
The Estimated Median PriceAPPRECIATION POTENTIALof all 1700 stocks in the Value Line
universe in the hypothesizedeconomic environment 3 to 5 years hence
35%26 Weeks Market Low Market High
Ago45%
3-9-09185%
3-1-1735%
ANALYSES OF INDUSTRIES IN ALPHABETICAL ORDER WITH PAGE NUMBERNumeral in parenthesis after the industry is rank for probable performance (next 12 months).
*Reviewed in this week’s issue.
PAGE PAGE PAGE PAGE
A C
B

How to Read a Value Line Report 2
Beginning on page 2, the Summary & Index also includes an alphabetical listing of all stocks in the publication with references to their location in Part 3, Ratings & Reports. The page number is shown in the right hand corner of each report. The index is updated each week to provide the most current data on all companies included in The Value Line Investment Survey.
The far left column of the Summary & Index may include another page number. This refers to recent Supplementary Reports, if any, which are included on the back pages of Ratings & Reports. If two stars (HH) appear in that column, one Supplementary Report is included in the current Issue.
There are many columns in the Summary & Index with more information on each of the approximately 1,700 stocks we cover.
There is also a wealth of information in the stock screens toward the back of the Summary & Index, beginning on page 24.
These screens are a good starting point for anyone seeking investment ideas or help in forming a strategy. The screens are also useful for investors looking for a list of stocks relevant to their specific strategies.
Part 2—Selection & Opinion
Selection & Opinion (S&O) contains Value Line’s weekly economic and stock market commentary and investment ideas, along with one or more pages of research highlight-ing specific stocks or industries, and a variety of pertinent economic and stock market statistics. It also includes four model stock portfolios (Stocks with Above-Average Year-Ahead Price Potential, Stocks for Income and Potential Price Appreciation, Stocks with Long-Term Price- Growth Potential, and Stocks with Above-Average Dividend Yields). The Selection & Opinion provides valuable investment ideas and a good understanding of Value Line’s outlook for the stock market and economy. In addition, Value Line posts market commentary at least twice each business day at www.valueline.com.
Part 3—Ratings & Reports
Ratings & Reports is the core of The Value Line Investment Survey with one-page reports on approximately 1,700 companies and one-page reports on approximately 100 industries. The company reports contain our proprietary ranks, our 3- to 5-year price forecast for the stock, income and balance sheet data, up to 17 years of historical data, and analyst commentaries. Our reports also contain stock price charts and graphs; quarterly sales, earnings, and divi-dend information; and a variety of other very useful data. Each page in this section is updated every 13 weeks. When important news occurs during these 13 week intervals, a Supplementary Report (appearing in the back section of Ratings & Reports) is published. If there is a Supplementary Report, its location will be shown in the Summary & Index.
Every week subscribers receive a new Issue of Ratings & Reports containing approximately 130 company reports grouped by industry, and a smaller number of industry reports. The industry reports precede the reports on the companies in that same industry. Over the course of three months, revised reports on all approximately 1,700 com-panies and nearly 100 industries are issued.
Ratings & Reports
THE VALUE LINEInvestment Survey®
Part 3
Ratings&
Reports
PAGE PAGE
© 2017 Value Line, Inc. All rights reserved. Factual material is obtained from sources believed to be reliable and is provided without warranties of any kind. THE PUBLISHER IS NOTRESPONSIBLE FOR ANY ERRORS OR OMISSIONS HEREIN. This publication is strictly for each subscriber’s own, non-commercial, internal use. No part of this publication may bereproduced, resold, stored or transmitted in any printed, electronic or other form, or used for generating or marketing any printed or electronic publication, service or product.See back cover for important disclosures.
BANK INDUSTRY ............................... 2501Ally Financial ................................. 2502BB&T Corp. .................................... 2503BancorpSouth, Inc. ......................... 2504Bank of America Corp. ................... 2505Bank of Hawaii Corp. ..................... 2506Bank of Montreal ............................ 2507Bank of New York Mellon .............. 2508Bank of Nova Scotia ....................... 2509
★★ Canadian Imperial Bk. Of Comm. . 2510Citigroup Inc. ................................... 2511Citizens Financial Group ............... 2512Cullen/Frost Bankers Inc. .............. 2513East West Bancorp ......................... 2514First Commonwealth Fin’l Corp. ... 2515First Republic Bank ....................... 2516HSBC Holdings plc (ADR) ............. 2517JPMorgan Chase & Co. .................. 2518KeyCorp .......................................... 2519M&T Bank Corp. ............................ 2520National Bank of Canada ............... 2521PNC Financial Services Group ...... 2522Popular, Inc. .................................... 2523Regions Financial Corp. ................. 2524Royal Bank of Canada .................... 2525Signature Bank .............................. 2526State Street Corp. .......................... 2527SunTrust Banks, Inc. ..................... 2528Synovus Financial Corp. ................ 2529
★ Toronto-Dominion Bank ................. 2530Webster Financial Corp. ................ 2531Wells Fargo & Co. ........................... 2532Zions Bancorporation ..................... 2533
FINANCIAL SERVICES(DIVERSIFIED) INDUSTRY ............ 2534★★ AerCap Holdings N.V. .................... 2535
Affiliated Managers Group ............ 2536Aircastle Ltd. .................................. 2537
★★ AllianceBernstein Holding ............. 2538American Express Co. .................... 2539American International Group ...... 2540Ameriprise Financial ..................... 2541Aon plc ............................................ 2542Assurant, Inc. ................................. 2543BlackRock, Inc. ............................... 2544Block (H&R), Inc. ........................... 2545Brown & Brown, Inc. ...................... 2546CIT Group ....................................... 2547Capital One Financial .................... 2548Crawford & Co. ‘B’ .......................... 2549Discover Financial Services ........... 2550Eaton Vance Corp. .......................... 2551EZCORP, Inc. .................................. 2552
★ Federated Investors, Inc. ............... 2553★★ Fidelity National Financial ........... 2554
Fidelity National Info. Services .... 2555First Data Corp. ............................. 2556FirstCash, Inc. ................................ 2557FleetCor Technologies, Inc. ............ 2558
★ Franklin Resources ........................ 2559Gallagher (Arthur J.) & Co. ........... 2560Global Payments Inc. ..................... 2561Hartford Financial Services .......... 2562
★ Invesco Ltd. .................................... 2563Janus Capital Group Inc. ............... 2564Kemper Corporation ...................... 2565
★ Lazard Ltd ...................................... 2566Legg Mason Inc. ............................. 2567
★ Loews Corp. .................................... 2568★ MGIC Investment .......................... 2569
Marsh & McLennan Cos., Inc. ....... 2570MasterCard Inc. ............................. 2571Navient Corporation ...................... 2572PayPal Holdings ............................. 2573
★ Price (T. Rowe) Group .................... 2574Principal Financial Group ............. 2575SLM Corp. ....................................... 2576Sun Life Financial .......................... 2577Synchrony Financial ...................... 2578Total System Services .................... 2579Vantiv, Inc. ...................................... 2580Visa Inc. .......................................... 2581Voya Financial ................................ 2582Western Union ................................ 2583WEX Inc. ......................................... 2584Willis Towers Watson PLC ............. 2585
COMPUTER SOFTWAREINDUSTRY ........................................... 2586
Adobe Systems, Inc. ....................... 2587ANSYS, Inc. .................................... 2588Autodesk, Inc. ................................. 2589
★ CA, Inc. ........................................... 2590Cadence Design Systems ............... 2591Citrix Systems, Inc. ........................ 2592
★★ FireEye, Inc. ................................... 2593Fortinet, Inc. ................................... 2594Intuit Inc. ........................................ 2595Microsoft Corp. ............................... 2596Nuance Communications, Inc. ....... 2597
★ Oracle Corp. .................................... 2598PTC Inc. .......................................... 2599Palo Alto Networks ........................ 2600Red Hat, Inc. ................................... 2601SAP SE ............................................ 2602
★ SS&C Technologies ......................... 2603Symantec Corp. .............................. 2604
★ Synopsys, Inc. ................................. 2605Teradata Corporation ..................... 2606VMware ........................................... 2607
IT SERVICESINDUSTRY ........................................... 2608★★ ACI Worldwide ............................... 2609
Accenture plc .................................. 2610Amdocs Ltd. .....................................2611Automatic Data Processing, Inc. ... 2612CACI Int’l, Inc. ............................... 2613CDW Corp. ...................................... 2614CSG Systems International, Inc. .. 2615CSRA Inc. ........................................ 2616Cognizant Tech. Solutions Corp. ... 2617DST Systems, Inc. .......................... 2618DXC Technology ............................. 2619EPAM Systems ............................... 2620Fair Isaac Corp. .............................. 2621Fiserv, Inc. ...................................... 2622Henry (Jack) & Associates, Inc. ..... 2623Infosys Ltd. (ADR) ......................... 2624Manhattan Associates, Inc. ............ 2625ManTech Int’l .................................. 2626Paychex, Inc. ................................... 2627SEI Investments Co. ...................... 2628
★★★★★★★★★★ Rank 1 (Highest) for Timeliness.★★★★★ Rank 2 (Above Average).
In three parts: Part 1 is the Summary & Index. Part 2 is Selection & Opinion. This is Part 3, Ratings & Reports. Volume LXXII, No. 39
Published weekly by VALUE LINE PUBLISHING LLC, 551 Fifth Avenue, New York, NY 10176.
ESPECIALLY NOTEWORTHY:
ISSUE 13Pages 2500-2674
File in the binder in order ofissue number, removing
previous issue bearingthe same number.
May 12, 2017www.valueline.com
ServiceNow, Inc. ............................. 2629Tyler Technologies .......................... 2630
INTERNET INDUSTRY ..................... 2631Alibaba Group Holding Ltd. .......... 2632Alphabet Inc. .................................. 2633
★ Amazon.com, Inc. ........................... 2634★ Baidu, Inc. ....................................... 2635
Ctrip.com Int’l ................................ 2636eBay Inc. ......................................... 2637Expedia, Inc. ................................... 2638Facebook, Inc. ................................. 2639
★ Groupon, Inc. .................................. 2640IAC/InterActiveCorp. ..................... 2641Match Group, Inc. ........................... 2642Netflix, Inc. ..................................... 26431-800-FLOWERS.COM, Inc. .......... 2644
★ Overstock.com ................................ 2645Pandora Media, Inc. ....................... 2646Priceline Group (The) ..................... 2647Snap Inc. ......................................... 2648Sohu.com, Inc. ................................ 2649TripAdvisor Inc. .............................. 2650
★ Twitter, Inc. .................................... 2651VeriSign, Inc. .................................. 2652XO Group Inc. ................................. 2653Yahoo! Inc. ....................................... 2654Yelp, Inc. ......................................... 2655Zillow Group ................................... 2656
PUBLIC/PRIVATE EQUITYINDUSTRY ........................................... 2657★★ Apollo Global Management ........... 2658
Apollo Investment Corp. ................ 2659Blackstone Group ........................... 2660Fortress Investment Group LLC ... 2661Gladstone Capital Corp. ................ 2662KKR & Co. L.P. ............................... 2663
SUPPLEMENTARY REPORTS ........ 2674
Snap Inc., the designer of the popularSnapchat camera application, makesits debut this week on page 2648 of theInternet Industry.
Oracle is benefiting from growth at itscloud services businesses, which offerspromise for improved earnings pershare in upcoming quarters. Turn topage 2598 for more.
The latest leg up in the rally on WallStreet has been driven by technologystocks, such as Amazon.com, whichcontinues to prove the naysayers wrong.We size up the shares of the online re-tailer on page 2634.

How to Read a Value Line Report 3
II: PLANNING AN INVESTMENT STRATEGY
When planning an investment strategy, it is important to consider a number of factors, including such aspects as your age, current financial situation, and risk tolerance. Of course, there are myriad other considerations, and our tools will help investors make well informed decisions when picking securities.
We have created a guide called Planning an Investment Strategy that you may wish to read before taking any port-folio action. As a quick summary, you should diversify your portfolio both across asset classes (e.g., stocks, bonds, and foreign securities) and within asset classes (i.e., owning a variety of stocks and bonds).
In addition, you do not have to manage every portion of your portfolio. Instead, you might hire someone else to handle the components that you do not have the desire or experience to oversee. For example, you could buy a diversified fixed-income mutual fund for the bond portion of your portfolio, while maintaining a collection of stocks yourself. The right mix of “outsourcing” and personal direc-tion is an individual decision, but in the end you should create a portfolio that offers good returns at a level of risk you can tolerate.
Again, we encourage you to take the time to read through the Planning an Investment Strategy guide so that you can start your portfolio on a solid foundation.
III: CREATING A LIST OF STOCKS FOR FURTHER RESEARCH
Once you have decided on your portfolio approach, you will begin selecting securities. There are many ways to use The Value Line Investment Survey to find the equities most appropriate for your goals. We include a number of stock screens in the back of each Summary & Index to assist our readers in narrowing the universe of stocks for further consideration.
The screens are updated weekly and cover a broad range of investment options, including Conservative Stocks, Highest Yielding Stocks, and Stocks with Highest 3- to 5-Year Ap-preciation Potential. A description of the screens is provided
if the title of a screen is not self-explanatory. There are, of course, many more screens than the ones listed here, which are available in the back of the Summary & Index. Regard-less, this approach will provide you with a more focused and shorter list of companies to research.
For those who want more advice than a static screen, we have also created four model portfolios: Portfolio I (Stocks with Above-Average Year-Ahead Price Potential), Portfolio II (Stocks for Income and Potential Price Appreciation), Portfolio III (Stocks with Long-Term Price Growth Poten-tial), and Portfolio IV (Stocks with Above-Average Dividend Yields). These portfolios are overseen by Value Line analysts and are updated weekly in Selection & Opinion. A fifth model portfolio (The Value Line $5–$15 Portfolio) is also provided via weekly email. These portfolios offer another convenient starting point for selecting stocks for inclusion in your portfolio.
On an ongoing basis, we provide stock screens and Stock Highlights in Selection & Opinion. The screens go beyond those included weekly in the Summary & Index and often provide a different or unique investment approach. The Stock Highlights offer a more in-depth review of compa-nies that we believe merit a second look. These features are critical in providing new and interesting investment ideas down the road.
IV: RESEARCHING A STOCK USING THE VALUE LINE PAGE
A sample Value Line report is included at the back of this guide. The numbers below reference back to the sample page.
To start studying a stock, we suggest that you concentrate on various features found on every company page of Rat-ings & Reports. Begin by using the Timeliness™, Safety™ and Technical ranks that appear in the upper left corner of each page (item 1). Next, look at the analyst’s commentary in the bottom half of each report (item 13). Then review our various forecasts for financial data. Estimated financial data is shown on the right side (bold italic print) of the Statistical Array (item 12). Growth rates are in the Annual Rates box (item 17). A stock’s Target Price Range is on the right-hand side of the graph (item 10), and 3- to 5-year stock price Projections are in the projections box (item 19).

How to Read a Value Line Report 4
Finally, review the historical financial data appearing in the left side of the Statistical Array (item18). Illustrations and more details follow.
Value Line Ranks
(see item 1 on the sample page)
Timeliness
The Timeliness rank is Val-ue Line’s projection of the expected price performance of a stock for the coming six to 12 months relative to our approximately 1,700 stock
universe. Stocks ranked 1 (Highest) or 2 (Above Average) are likely to outperform the Value Line universe over time. Stocks ranked 3 are likely to be average performers. And those ranked 4 (Below Average) or 5 (Lowest) are expected to underperform.
At any one time, there are 100 stocks ranked 1; 300 ranked 2; approximately 900 ranked 3; 300 ranked 4; and 100 ranked 5.
Safety
The Safety rank is a measure of the total risk of one stock compared to all others in our approximately 1,700 stock universe. As with the Timeliness rank, Value Line ranks each stock from 1 (Highest) to 5 (Lowest). However, unlike the Timeliness rank, the number of stocks in each category from 1 to 5 may vary. The Safety rank is derived from two measurements (weighted equally) found in the Ratings box, on the lower right hand corner of each page (item 14): a Company’s Financial Strength and a Stock’s Price Stability. Financial Strength is a measure of a com-pany’s financial condition, and is reported on a scale of A++ (Highest) to C (Lowest). The largest companies with the strongest balance sheets often earn the highest scores. Price Stability is based on a ranking of the standard devia-tion (a measure of volatility) of weekly percent changes in the stock price over the last five years, and is reported on a scale of 100 (Highest) to 5 (Lowest) in increments of 5. Generally speaking, stocks with Safety ranks of 1 or 2 are most suitable for conservative investors.
A stock’s Price Growth Persistence and a company’s Earnings Predictability are also included in the Ratings box. They do not factor into the Safety rank, but are useful statistics, nonetheless. Price Growth Persistence is a measure of the consistency of relative stock price growth over the past 10 years. Earnings Predictability is a measure of the reliability of an earnings forecast.
Technical
The Technical rank is primarily a predictor of a stock’s short term (three to six months) relative price change. It is based on a proprietary model which examines 10 relative price trends for a particular stock over different periods in the past year. It also takes into account the price volatility of each stock. The Technical rank ranges from 1 (Highest) to 5 (Lowest) as well. At any one time, about 100 stocks are ranked 1; 300 ranked 2; 900 ranked 3; 300 ranked 4; and 100 ranked 5.
Beta
Beta is a measure of the volatility of a stock relative to the overall stock market and is calculated by Value Line. A Beta of 1.00 suggests that a stock will move up and down roughly in lock-step with the market, so that a 3% increase or fall in the broader market would likely be accompanied by a similar percentage move in the stock. A Beta higher than 1.00 means a stock tends to be more volatile than the market, while a Beta lower than 1.00 suggests the stock’s price fluctuations will be more muted in relationship to the broader market.
Industry Timeliness
Value Line also publishes ranks which show the expected performance of each industry, relative to the other. These ranks are updated weekly and published on the front cover and on page 24 of the Summary & Index. They also appear at the top of each Industry Report in Ratings & Reports.
Sample Ranks Box
Sample Financial/Stock Price Data

How to Read a Value Line Report 5
Analyst’s Commentary
Many readers think our commentary (item 13) is the most important section of the page. In the commentary, the analyst discusses his/her expectations for the company, and individual stock, over the near and long term. There are times when the raw numbers don’t tell the full story. The analyst uses the commentary to explain the forecast. The commentary is also particularly useful when a trend is shifting, or a change is about to occur. As an example, a stock may have a below average Timeliness rank but the analyst thinks earnings could turn around in the future. In this case, the analyst may use this section to explain why he/she thinks conditions are likely to get better, thus giving the subscriber more insight into what is happening and why.
Value Line Financial Data
The Statistical Array in the center of the report (where most of the numbers are), Value Line provides both financial projections (item 12) and historical data (item 18).
Financial Estimates
Our analysts carefully review each company’s past perfor-mance, then focus on market dynamics and industry trends in their analysis. Many will derive the numbers in the Array (item 12) and Quarterly Projections (item 16) from carefully curated data maintained for each company stock. Forward-looking estimates are presented in bold italics.
Historical Financial Data
Many readers rely on the data in the Statistical Array (item 18) for their own analysis. They, in particular, use the historical data to evaluate how a company has performed over the long term. It’s worth pointing out that while all of the figures are important, readers may focus primarily on certain data depending on their investment goals.
The numbers are very helpful in identifying trends. For example, a review of sales figures is useful in estimating the amount of revenue a company will bring in. The operating or net profit margins show how sales filter to the bottom line (earnings). Many readers also check the percentages near the bottom to see if the Return on Total Capital or the Return on Shareholders’ Equity have been rising, falling or remaining about the same.
Annual Rates Of Change
The Annual Rates box (item 17) shows the compound annual growth percentages for sales, cash flow, and other items for the past 5 and 10 years and also Value Line’s projections of growth for each item for the coming 3 to 5 years. These numbers can also indicate important company trends. (Specific estimates for various data items for three to five years in the future can be found in bold italicized type in the far right hand column of the Statistical Array.)
Sample Rates Box
Sample Analyst’s Commentary (Also see item 13 on the sample page)
Sample Statistical Array

How to Read a Value Line Report 6
Target Price Range and 3- to 5-year Projections
In the upper right-hand section of our Price chart/graph is the 3- to 5-year Target Price Range (item 10). The range is based on our earnings projection for that period, multiplied by the estimated price/earnings ratio in the Statistical Array. The width of the high-low range depends on the stock’s Safety rank. A stock with a high Safety rank has a narrower range, one with a low rank, a wider one.
In the left hand column of each report, we include our 3- to 5-year Target Price Range (item 19) projections. There you can see the potential high and low average prices we forecast, the percentage price changes we project, and the expected compound annual total returns (price apprecia-tion plus dividend growth). To make these calculations, analysts compare the expected prices for the next three to five years (as shown in the Target Price Range and Projec-tions box) with the recent quotation shown at the top of the report (item 5).
Investors whose primary goal is long-term price apprecia-tion should study the 3- to 5-year projections carefully and choose stocks with above-average capital gains potential. For comparative purposes, you can find the Estimated Median Price Appreciation Potential for all approximately 1,700 stocks on the front page of the Summary & Index.
V: EXAMINING A VALUE LINE PAGE IN MORE DETAIL
In the following section, we are going to examine a Value Line page, with the objectives of interpreting the array of statistical data presented and weighing the data and the ac-companying comment against your needs. We have chosen a report on The Walt Disney Company, a multinational mass-media and entertainment conglomerate and member of the Dow Jones Industrial Average.
Putting Data in Perspective
Looking at the top of the page, we can see that Disney’s stock price in May 2017 was $115.18 a share (item 5 on the sample page). By itself, the stock price means very little. In the line below the price, annual high and low prices for each year from 2006 through 2017 are indicated. Below the high and low annual prices is a price chart (graph) that shows monthly price ranges for essentially the same period, along with other useful information that we will discuss below.
At the current quotation, is the stock undervalued, over-valued or fairly valued? The fact that the “cash flow” line is below the price of the stock indicates that it appears to be slightly overvalued.
Price-Earnings Ratio — This is probably the most widely used measure of stock valuation. Value Line shows a variety of P/E ratios on every company page, as discussed below:
The P/E ratio on the very top of the Value Line page (item 6) is calculated by dividing the recent price of the stock by its 12-month earnings (including one quarter of actual earnings plus three quarters of estimated earnings).
The Relative P/E ratio (item 8) compares the P/E of one stock with the median of estimated P/E ratios of all stocks under Value Line review. As such, a relative P/E of more than 1 indicates that a stock’s P/E ratio is currently higher than that of the Value Line universe.
The Trailing P/E ratio (item 7) is calculated by dividing the recent stock price by the past 12 months of actual (reported) earnings. This figure is often reported in newspapers and financial web sites.
The Median P/E ratio (item 7) is the average annual P/E ratio of a stock over the past 10 years, with certain statistical adjustments made for unusually low or high ratios.
The Average Annual P/E ratio (items 12 and 18) is cal-culated by dividing the average price for each year by the actual reported earnings for the same year and is shown in the Statistical Array.
The Relative (Annual) P/E ratio (items 12 and 18) is calculated by dividing the Average Annual P/E of a stock with the Average Annual P/E of all stocks under Value Line review in the same year.
Sample Target Price Range

How to Read a Value Line Report 7
To gauge the significance of the stock’s recent value, the reader should look at the price in relation to a variety of data. As far as P/Es are concerned, the current P/E ratio and relative P/E ratio for Disney’s stock, are below those of most stocks in the Value Line universe.
Low P/E ratios may mean that the stock is underpriced, unless there are factors indicating that there will be a sig-nificant decline in the company’s fundamentals. Is this the case with Disney? Probably not, since management has been very vigilant in its efforts to maximize returns from its busi-nesses, and the Value Line analyst is expecting continued profit growth over the next three to five years. Disney’s relative P/E ratio of 0.97 (item 8), a lower valuation than found in the average stock followed by Value Line, likely reflects the fact that the company’s upward earnings trend over the past 15 years has recently moderated.
The Dividend Yield (item 9) shows the expected return from cash dividends on the stock over the next 12 months, as a percentage of the recent price. Disney’s yield of 1.4% is below the median of all dividend-paying stocks in the Value Line universe. (The median is shown each week on the cover of the Summary & Index section.) We also see that the company has changed its dividend policy and now pays dividends semi-annually. Value Line’s analyst thinks that Disney stock dividends will increase over the next ten years. Many investors view regular increases in a dividend very positively.
The Price Chart
Next, look at Disney’s price chart (or graph) at the top of the report (item 11). The first thing one should note is the price history, shown by the small vertical bars in the center of the graph, which show the high and low monthly prices for the stock (adjusted for any subsequent stock splits or dividends). Looking at the bars, you can see that the stock price climbed to new highs in 2015, gave back some of these gains in 2016, but has gained ground since.
Now review the Cash Flow line, the solid line running from 2005 through the middle of 2016 (more fully described below). The dashed line from mid-2016 to mid-2018, which is an extension of the Cash Flow line, is Value Line’s projection of the line for those years. For most of the past
12 years, Disney’s stock has traded within reach of the Cash Flow line.
Finally, note the Relative Price Strength line (item 4), the faint small dotted line, toward the bottom of the chart. This shows the relative performance of Disney stock versus the entire universe of Value Line stocks; when the Relative Price Strength line is rising, it means a stock is outperforming the universe. When it is falling, a stock is lagging the Value Line universe.
At the very bottom of the chart, we show monthly trading volume (item 11) as a percentage of total shares outstand-ing. The Legends box (item 2) in the upper left of the price chart contains, among other things, information on the cash flow multiple, a record of stock splits, and whether or not there are options traded.
The Target Price Range (item 10) in the upper right cor-ner of the price chart indicates the Value Line forecast for the stock’s price range over the 3- to 5-year period. This box should be viewed in conjunction with the Projections box (item 19) near the top left-hand corner of the page, which also gives our 3- to 5-year projections. For Disney, we expect the average price to hover between 110 and 135, which would be between -5% and 15% above the level in May 2017.
Just above the Projections box is a section containing the Value Line Timeliness, Safety, and Technical ranks, plus a Beta calculation (item 1). Disney’s Beta of 1.00 reveals that this stock is likely to move in unison with the typical stock in the broader market. If you are looking for stability, a stock like Disney, with an average Beta, is a good option.
The ‘‘Cash Flow’’ Line
The price chart at the top of the Disney page contains, among other things, a monthly price history for the stock (the vertical bars) overlaid by a solid line that we call the “cash flow” line (sometimes also called the “Value Line”)(item 3). To plot the line, we multiply cash flow per share (net income plus depreciation and amortization less preferred dividends divided by the number of shares outstanding at the end of the year) by a number (multiple) determined by our analyst — the multiple is noted in our graph legend (item 2). The goal is to create a line that closely matches the stock price history and will ultimately extend to our

How to Read a Value Line Report 8
projected 3- to 5-year Target Price Range. In the case of Disney, the “cash flow” multiple is now 12.0. (The multiple can, and often does, change over time.) Stocks tend to trade at or near their “Cash Flow” line.
Historical Results and Estimates
When available, our historical array includes per-share data dating back up to 17 years. The historical data (item 18) appear on the left side and are presented in regular type. We also project statistical data (item 12) for the current fiscal year, next fiscal year, as well as three to five years into the future. These projections are presented in bold italics.
Highlights from the Statistical Array (items 12 and 18):
Revenues per share (first line), or how much revenue the company generated from its operations, divided by its share count.
Cash flow per share (second line), as commonly used by analysts, is the sum of reported earnings plus depreciation, less any preferred dividends, calculated on a per-share basis. It is an indicator of a company’s internal cash-generating ability—the amount of cash it earns to expand or replace plant and equipment, to provide working capital, to pay dividends, or to repurchase stock. Disney’s cash flow per share has almost quadrupled since 2001.
Earnings per share (third line) are shown by Value Line as they were reported to stockholders, excluding nonrecurring items and adjusted for any subsequent stock splits or stock dividends. Value Line will usually use diluted earnings per share. This metric includes dilution (stemming from options or warrants, etc.) rather than relying on the weighted aver-age of outstanding shares. Details, including nonrecurring items excluded from our earnings presentation are included in the footnotes section (item 15).
Disney’s, earnings per share increased steadily between 2002 and 2016.
Dividends Declared per share (fourth line). Directors of growth-oriented companies often prefer to pay small or “token” dividends, or none at all, so they can reinvest earnings in the business. Disney paid 25% of its earnings in dividends in 2016 and invested the remainder in the business; and the percentage is likely to increase slightly
to 28% over the next few years. The larger capitalization stocks followed by Value Line typically pay out 25%-30% of their net profits.
Capital Spending per share (fifth line) is the amount that a company spends on new plants and equipment, divided by its shares outstanding including funds used for acquisi-tions of other companies which most analysts do not use in their projected budgets.
Book Value per share (sixth line) is common shareholders’ equity determined on a per-share basis. It includes both tangible assets, like plant and receivables and inventories, as well as intangibles, like the value of patents or brand names, known as ‘‘goodwill.’’ Any significant intangibles will normally be indicated in a footnote (item 15). If all assets could be liquidated at the value stated on the com-pany’s books, all liabilities such as accounts payable, taxes, and long-term debt paid, and all preferred stockholders compensated, the book value is what would be left for the common stockholders.
The number of Common Shares Outstanding (seventh line) is also listed in the Statistical Array. Sometimes net income rises, but earnings per share do not, because the number of shares outstanding has increased. This may happen because a company is issuing stock to pay for acquisitions or to fund internal growth. As a result, sales and profits may soar, while per-share sales and earnings lag. On the other hand, when cash-rich companies buy their own shares, earnings per share can rise even if net income is stable, or decreasing.
The Average Annual P/E Ratio (eighth line) shows Disney’s average annual P/E was at unusually high levels in 2001 and 2002 when entertainment stocks were in favor; it has narrowed considerably over the past 13 years.
The Relative P/E Ratio (ninth line) shows how the stock’s price-earnings ratio relates to those of all stocks in the Value Line universe. Disney’s relative P/E of 0.97 in May 2017 was below that of the typical stock in the Value Line universe. The Value Line analyst thinks it will be average in the 2020–2022 period.
The Average Annual Dividend Yield (10th line) is of spe-cial interest to income-oriented investors, many of whom are more concerned with a stock’s yield, rather than its
How to Read a Value Line Report 9
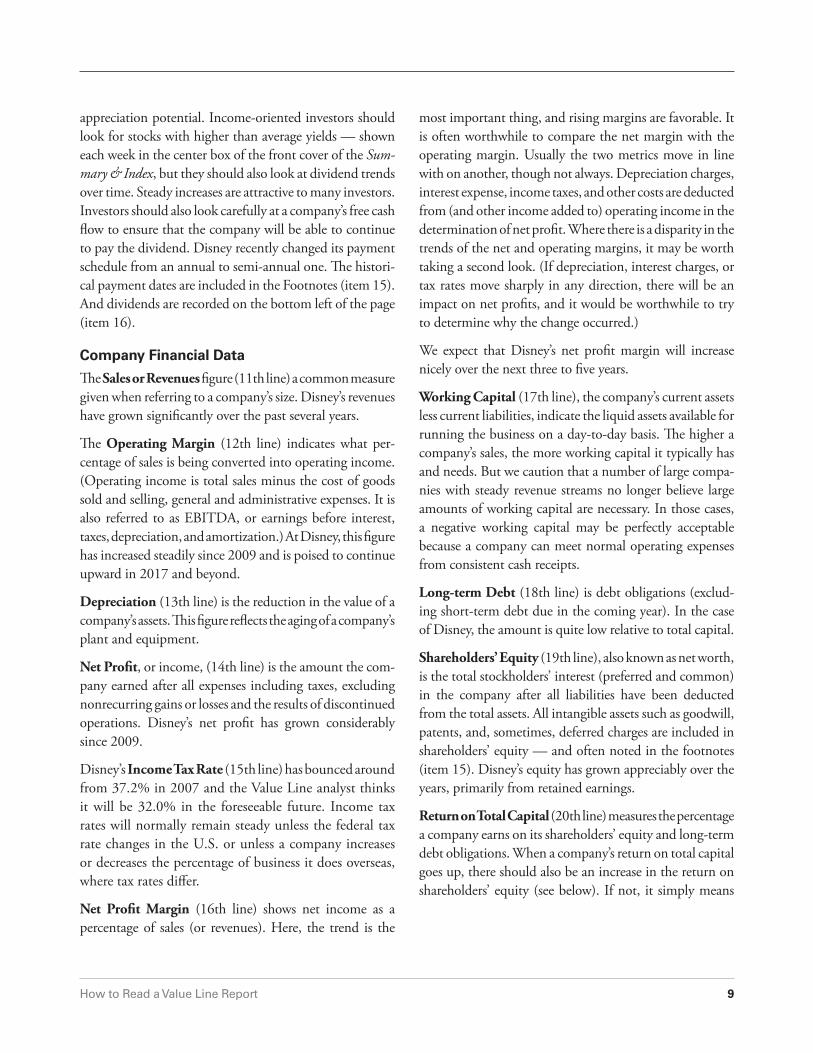
appreciation potential. Income-oriented investors should look for stocks with higher than average yields — shown each week in the center box of the front cover of the Sum-mary & Index, but they should also look at dividend trends over time. Steady increases are attractive to many investors. Investors should also look carefully at a company’s free cash flow to ensure that the company will be able to continue to pay the dividend. Disney recently changed its payment schedule from an annual to semi-annual one. The histori-cal payment dates are included in the Footnotes (item 15). And dividends are recorded on the bottom left of the page (item 16).
Company Financial Data
The Sales or Revenues figure (11th line) a common measure given when referring to a company’s size. Disney’s revenues have grown significantly over the past several years.
The Operating Margin (12th line) indicates what per-centage of sales is being converted into operating income. (Operating income is total sales minus the cost of goods sold and selling, general and administrative expenses. It is also referred to as EBITDA, or earnings before interest, taxes, depreciation, and amortization.) At Disney, this figure has increased steadily since 2009 and is poised to continue upward in 2017 and beyond.
Depreciation (13th line) is the reduction in the value of a company’s assets. This figure reflects the aging of a company’s plant and equipment.
Net Profit, or income, (14th line) is the amount the com-pany earned after all expenses including taxes, excluding nonrecurring gains or losses and the results of discontinued operations. Disney’s net profit has grown considerably since 2009.
Disney’s Income Tax Rate (15th line) has bounced around from 37.2% in 2007 and the Value Line analyst thinks it will be 32.0% in the foreseeable future. Income tax rates will normally remain steady unless the federal tax rate changes in the U.S. or unless a company increases or decreases the percentage of business it does overseas, where tax rates differ.
Net Profit Margin (16th line) shows net income as a percentage of sales (or revenues). Here, the trend is the
most important thing, and rising margins are favorable. It is often worthwhile to compare the net margin with the operating margin. Usually the two metrics move in line with on another, though not always. Depreciation charges, interest expense, income taxes, and other costs are deducted from (and other income added to) operating income in the determination of net profit. Where there is a disparity in the trends of the net and operating margins, it may be worth taking a second look. (If depreciation, interest charges, or tax rates move sharply in any direction, there will be an impact on net profits, and it would be worthwhile to try to determine why the change occurred.)
We expect that Disney’s net profit margin will increase nicely over the next three to five years.
Working Capital (17th line), the company’s current assets less current liabilities, indicate the liquid assets available for running the business on a day-to-day basis. The higher a company’s sales, the more working capital it typically has and needs. But we caution that a number of large compa-nies with steady revenue streams no longer believe large amounts of working capital are necessary. In those cases, a negative working capital may be perfectly acceptable because a company can meet normal operating expenses from consistent cash receipts.
Long-term Debt (18th line) is debt obligations (exclud-ing short-term debt due in the coming year). In the case of Disney, the amount is quite low relative to total capital.
Shareholders’ Equity (19th line), also known as net worth, is the total stockholders’ interest (preferred and common) in the company after all liabilities have been deducted from the total assets. All intangible assets such as goodwill, patents, and, sometimes, deferred charges are included in shareholders’ equity — and often noted in the footnotes (item 15). Disney’s equity has grown appreciably over the years, primarily from retained earnings.
Return on Total Capital (20th line) measures the percentage a company earns on its shareholders’ equity and long-term debt obligations. When a company’s return on total capital goes up, there should also be an increase in the return on shareholders’ equity (see below). If not, it simply means

How to Read a Value Line Report 10
that the company is borrowing more and paying interest, but not earning more for the stockholders on their equity in the company’s assets. Unless a company can earn more than the interest cost of its debt over time, the risk of bor-rowing is not worthwhile.
Return on Shareholders’ Equity (21st line) reveals how much has been earned (in percentage terms) every year for the stockholders (common and preferred). Higher figures are usually desirable, often indicating greater productivity and efficiency. Disney’s percent earned on net worth hit a lull in 2009, but has since grown steadily except for a dip in 2013.
Trends in both this ratio and the return on total capital—two key gauges of corporate performance—say a great deal about the skill of management.
Retained to Common Equity (22nd line) also known as the ‘‘plowback ratio,’’ is net income less all dividends (common and preferred), divided by common shareholders’ equity and is expressed as a percentage. It measures the extent to which a company has internally generated resources to invest for future growth. A high plowback ratio and rapidly growing book value are positive investment characteristics.
All Dividends to Net Profit, or ‘‘payout ratio,’’ (23rd line) measures the proportion of a company’s profits that is distributed as dividends to all shareholders—both com-mon and preferred. Young, fast-growing companies often reinvest most of their profits internally. Mature companies usually pay out a large share of earnings. Disney paid out 25% of its profits in the form of cash dividends in fiscal 2016. By way of comparison, the typical large-cap com-pany in the Value Line universe usually pays out about 25%-30% of its profits in dividends.

How to Read a Value Line Report 11
200160
1008060504030
20
Percentsharestraded
302010
Target Price Range2020 2021 2022
DISNEY (WALT) NYSE-DIS 115.18 19.5 20.816.0 0.97 1.4%
TIMELINESS 3 Lowered 3/11/16
SAFETY 1 Raised 2/13/09
TECHNICAL 3 Raised 4/21/17BETA 1.00 (1.00 = Market)
2020-22 PROJECTIONSAnnʼl Total
Price Gain ReturnHigh 135 (+15%) 6%Low 110 (-5%) 1%Insider Decisions
J J A S O N D J Fto Buy 0 0 0 0 0 0 0 0 0Options 0 10 1 0 10 1 7 15 3to Sell 0 0 0 0 0 3 2 1 3Institutional Decisions
2Q2016 3Q2016 4Q2016to Buy 830 828 915to Sell 783 795 811Hldʼs(000) 938707 909837 962026
High: 34.9 36.8 35.0 32.8 38.0 44.3 53.4 76.5 95.9 122.1 106.8 115.5Low: 23.8 30.7 18.6 15.1 28.7 28.2 37.9 50.2 69.9 90.0 86.3 105.2
% TOT. RETURN 3/17THIS VL ARITH.*
STOCK INDEX1 yr. 15.9 20.23 yr. 47.3 22.05 yr. 176.9 78.0
CAPITAL STRUCTURE as of 12/31/16Total Debt $20490 mill. Due in 5 Yrs $11275 mill.LT Debt $14792 mill. LT Interest $600 mill.(Total interest coverage: NMF)
(24% of Capʼl)Leases, Uncapitalized Annual rentals 477.0 mill.Pension Assets-10/16 $10.41 bill.
Oblig. $14.48 bill.
Pfd Stock NoneCommon Stock 1,581,248,242 shs.as of 2/1/17
MARKET CAP: $182 billion (Large Cap)CURRENT POSITION 2015 2016 12/31/16
($MILL.)Cash Assets 4269 4610 3736Receivables 8019 9065 9878Inventory (Avg Cst) 1571 1390 1299Other 2899 1901 1752Current Assets 16758 16966 16665Accts Payable 7844 9130 9979Debt Due 4563 3687 5698Other 3927 4025 3640Current Liab. 16334 16842 19317ANNUAL RATES Past Past Estʼd ʼ14-ʼ16of change (per sh) 10 Yrs. 5 Yrs. to ʼ20-ʼ22Revenues 7.5% 9.0% 4.0%ʻʻCash Flowʼʼ 12.5% 15.5% 6.0%Earnings 14.0% 18.5% 7.5%Dividends 19.0% 30.0% 7.5%Book Value 7.0% 6.5% 7.0%FiscalYearEnds
FullFiscalYear
QUARTERLY REVENUES ($ mill.) A
Dec.Per Mar.Per Jun.Per Sep.Per2014 12309 11649 12466 12389 488132015 13391 12461 13101 13512 524652016 15244 12969 14277 13142 556322017 14784 13436 14750 14030 570002018 15000 14575 14850 14675 59100FiscalYearEnds
FullFiscalYear
EARNINGS PER SHARE A B
Dec.Per Mar.Per Jun.Per Sep.Per2014 1.03 1.08 1.28 .87 4.262015 1.27 1.23 1.45 .95 4.902016 1.73 1.30 1.59 1.10 5.732017 1.55 1.40 1.70 1.25 5.902018 1.75 1.45 1.75 1.40 6.35Cal- Full
endar YearQUARTERLY DIVIDENDS PAID C
Mar.Per Jun.Per Sep.Per Dec.Per2013 - - - - - - - - - -2014 .86 - - - - - - .862015 1.15 - - .66 - - 1.812016 .71 - - .71 - - 1.422017 .78
2001 2002 2003 2004 2005 2006 2007 2008 2009 2010 2011 2012 2013 201412.52 12.40 13.23 15.05 15.91 16.61 18.10 20.76 19.88 20.07 23.21 23.49 25.02 28.71
1.89 1.06 1.19 1.70 2.03 2.32 2.81 3.28 2.77 3.03 3.79 4.26 4.63 5.76.98 .55 .66 1.09 1.31 1.61 1.92 2.26 1.82 2.07 2.54 3.13 3.38 4.26.21 .21 .21 .21 .24 .27 .31 .35 .35 .35 .40 .60 .75 .86.89 .53 .51 .70 .91 .63 .80 .87 .96 1.11 2.02 2.10 1.55 1.95
11.23 11.48 11.63 12.77 13.06 15.42 15.67 17.73 18.55 19.78 21.22 22.09 25.24 26.452019.0 2042.0 2045.0 2043.0 2007.2 2064.0 1962.2 1822.9 1818.3 1896.9 1762.2 1800.0 1800.0 1700.0
30.4 37.2 28.0 21.8 20.4 17.1 17.8 14.2 12.5 15.7 15.1 13.6 17.1 18.61.56 2.03 1.60 1.15 1.09 .92 .94 .85 .83 1.00 .95 .87 .96 .98.7% 1.0% 1.1% .9% .9% 1.0% .9% 1.1% 1.5% 1.1% 1.0% 1.4% 1.3% 1.1%
35510 37843 36149 38063 40893 42278 45041 4881323.3% 23.7% 20.3% 22.2% 23.5% 25.7% 25.8% 28.3%1491.0 1582.0 1631.0 1713.0 1841.0 1987.0 2192.0 2288.04014.0 4405.0 3408.0 4035.0 4839.0 5682.0 6136.0 7501.037.2% 36.6% 36.1% 35.1% 34.5% 33.3% 31.0% 34.6%11.3% 11.6% 9.4% 10.6% 11.8% 13.4% 13.6% 15.4%d77.0 75.0 2955.0 1225.0 1669.0 896.0 2405.0 1884.0
11892 11110 11495 10130 10922 10697 12776 1267630753 32323 33734 37519 37385 39759 45429 4495810.0% 10.8% 8.1% 8.9% 10.4% 11.6% 10.8% 13.0%13.1% 13.6% 10.1% 10.8% 12.9% 14.3% 13.5% 16.7%11.0% 11.6% 8.2% 9.0% 10.9% 11.6% 10.6% 13.3%
16% 15% 19% 16% 16% 19% 22% 20%
2015 2016 2017 2018 © VALUE LINE PUB. LLC 20-2232.79 34.77 36.20 37.65 Revenues per sh A 40.506.71 7.45 7.90 8.25 ʻʻCash Flowʼʼ per sh 9.404.90 5.73 5.90 6.35 Earnings per sh A B 7.601.81 1.42 1.56 1.72 Divʼds Declʼd per sh C 2.102.67 2.98 3.00 3.00 Capʼl Spending per sh 3.00
27.83 27.04 28.35 30.80 Book Value per sh D 41.251600.0 1600.0 1575.0 1570.0 Common Shs Outstʼg E 1550.0
20.9 17.7 Bold figures areValue Lineestimates
Avg Annʼl P/E Ratio 16.01.05 .93 Relative P/E Ratio 1.00
1.8% 1.4% Avg Annʼl Divʼd Yield 1.7%52465 55632 57000 59100 Revenues ($mill) A 6275029.7% 30.4% 31.5% 32.0% Operating Margin 33.0%2354.0 2527.0 2600 2625 Depreciation ($mill) 28008382.0 9391.0 9840 10365 Net Profit ($mill) 1178036.2% 34.2% 32.0% 32.0% Income Tax Rate 32.0%16.0% 16.9% 16.9% 17.6% Net Profit Margin 18.8%424.0 124.0 124 175 Working Capʼl ($mill) 585
12773 16483 16000 16000 Long-Term Debt ($mill) 1600044525 43265 44640 48350 Shr. Equity ($mill) 6395014.7% 15.9% 16.0% 15.0% Return on Total Capʼl 12.5%18.8% 21.7% 22.0% 21.5% Return on Shr. Equity 18.5%11.9% 16.4% 16.5% 16.0% Retained to Com Eq 13.5%
37% 25% 25% 26% All Divʼds to Net Prof 28%
Companyʼs Financial Strength A++Stockʼs Price Stability 90Price Growth Persistence 100Earnings Predictability 100
(A) Fiscal year ends Saturday closest to Sept.30th. Fiscal 2009 contained 53 weeks.(B) Dil. egs. Excl. nonrecurring gains/(losses):ʼ01, ($1.00); ʼ02, 8¢; ʼ03, (4¢); ʼ04, 4¢; ʼ05, (9¢);
ʼ06, 3¢; ʼ07, 32¢; ʼ08, 2¢; ʼ09, 6¢; ʼ10, (4¢); ʼ11,(2¢). Excl. disc. ops.: ʼ07, 1¢. Next egs. reportdue early May.(C) Divʼds hist. paid in mid-Jan. Two divʼds
paid in calendar 2012. Initiated semi-annualdividend in July ʼ15.(D) Incl. intang., in fiscal ʼ16: $34.8 bill.,$21.75/sh. (E) In millions.
BUSINESS: The Walt Disney Company operates Media Networks,incl. ABC and ESPN (43% of ʼ16 revs.); Parks and Resorts: Dis-neyland, Walt Disney World (Magic Kingdom, Epcot, HollywoodStudios, Animal Kingdom), and a cruise line (30%); Studio Enter-tainment (17%); Consumer Products and Interactive Media (10%).Earns Tokyo Disneyland royalties. Manages Disneyland Paris and
Hong Kong Disneyland. Acq. Pixar, 5/06; Marvel, 12/09; Lucas-Films, 12/12. Div. ABC Radio, 6/07. ʼ16 depr. rate: 4.7%. Employs195,000. Off. and dir., less than 1% of common stock; Vanguard,5.5% (1/17 proxy). Chairman/CEO: Robert A. Iger. Inc.: DE. Ad-dress: 500 S. Buena Vista St., Burbank, CA 91521-7320. Tele-phone: 818-560-1000. Internet: www.thewaltdisneycompany.com.
Will The Walt Disney Company’sgrowth begin to moderate this year?The media conglomerate got off to a slug-gish start in fiscal 2017 (year ended Sep-tember 30th). In fact, the company experi-enced softness in all of its categories, savefor its Parks & Resorts segment. In all,share earnings decreased 10%, to $1.55,for the December period, on a 3% revenuedecline. That said, some of the soft com-parisons may be due to the tremendousgains Disney experienced in the year-agoperiod, spurred by the box office success ofStar Wars Episode VII. And we imaginethe tailwinds from the Jedi franchise andFrozen merchandising will continue tosubside, but the reboot of Beauty and theBeast, and a strong summer movie slatemay offset some of that decline in the backhalf of the year. Even so, we look for thetop and bottom lines to eke out 2%-3%gains for fiscal 2017. On the other hand,we think the pace will pick up again nextyear, and share net will climb 5%-10%, ona 3%-5% revenue advance.The company is strategically invest-ing in its business. Indeed, Disney hasbeen bolstering its core brands and con-
tent. Over the last few years, the companyhas expanded its Parks & Resorts seg-ment, opening Shanghai Disney, and willlikely further expand its international anddomestic theme parks in the comingmonths. Too, we imagine the company willfocus on technological innovation, espe-cially to support its Media Networks divi-sion. Disney plans to launch a new ESPNstreaming service, with the help of itsBAMTech partnership, and we would notbe surprised if the company concentratedon strengthening its mobile capabilities ormultiplatform opportunities to capturecord-cutting viewers. Meanwhile, theboard will likely also use funds to improveshareholder returns through stock repur-chases and dividends.These quality shares are fairly valuedat this juncture. Although DIS stock hastrended up nicely over the past fewmonths, it is ranked to perform in tandemwith the broader market averages in theyear ahead. Furthermore, much of thegood news we anticipate from the maturecompany out to 2020-2022 is alreadybaked into the recent quotation.Orly Seidman May 5, 2017
LEGENDS12.0 x ″Cash Flow″ p sh. . . . Relative Price Strength
Options: YesShaded area indicates recession
© 2017 Value Line, Inc. All rights reserved. Factual material is obtained from sources believed to be reliable and is provided without warranties of any kind.THE PUBLISHER IS NOT RESPONSIBLE FOR ANY ERRORS OR OMISSIONS HEREIN. This publication is strictly for subscriber’s own, non-commercial, internal use. No partof it may be reproduced, resold, stored or transmitted in any printed, electronic or other form, or used for generating or marketing any printed or electronic publication, service or product.
To subscribe call 1-800-VALUELINE
RECENTPRICE
P/ERATIO
RELATIVEP/E RATIO
DIVʼDYLD( )Trailing:
Median:VALUELINE
SAMPLE RESEARCH REPORT
1 2 3 4 5 6 7 8 9
10
11
12
13
14
19
17
15
18
16
How to Read a Value Line Report 12
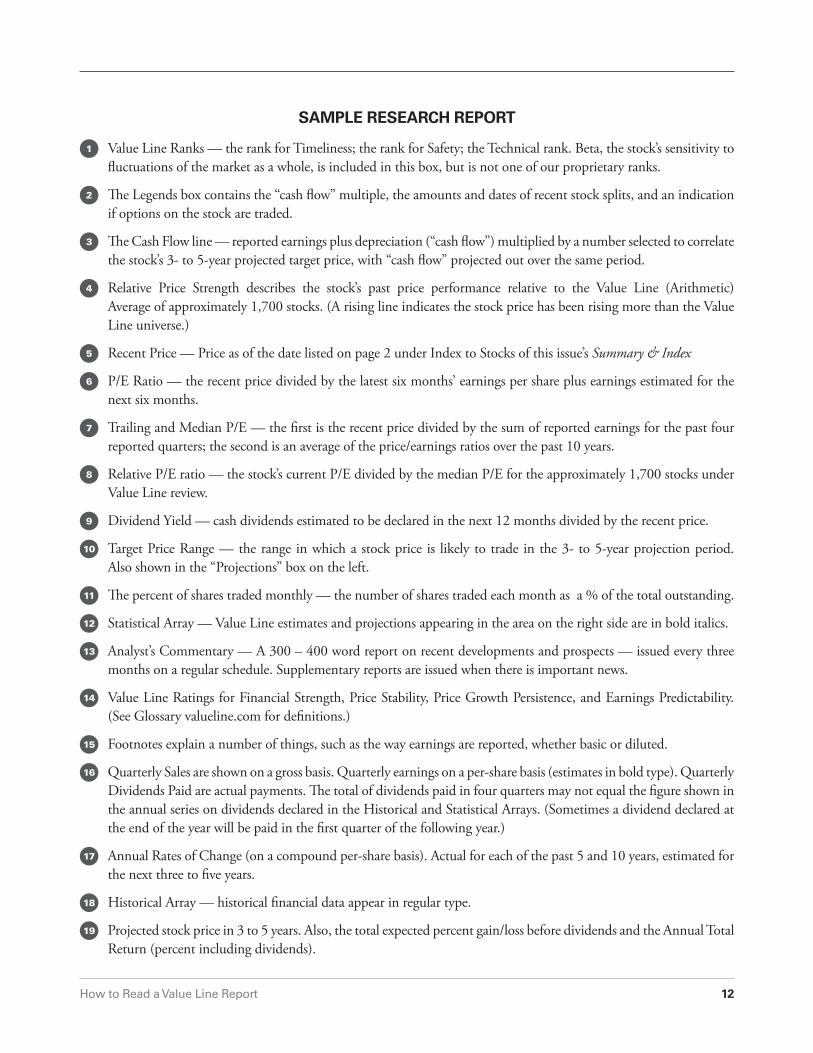
SAMPLE RESEARCH REPORT
1 Value Line Ranks — the rank for Timeliness; the rank for Safety; the Technical rank. Beta, the stock’s sensitivity to fluctuations of the market as a whole, is included in this box, but is not one of our proprietary ranks.
2 The Legends box contains the “cash flow” multiple, the amounts and dates of recent stock splits, and an indication if options on the stock are traded.
3 The Cash Flow line — reported earnings plus depreciation (“cash flow”) multiplied by a number selected to correlate the stock’s 3- to 5-year projected target price, with “cash flow” projected out over the same period.
4 Relative Price Strength describes the stock’s past price performance relative to the Value Line (Arithmetic) Average of approximately 1,700 stocks. (A rising line indicates the stock price has been rising more than the Value Line universe.)
5 Recent Price — Price as of the date listed on page 2 under Index to Stocks of this issue’s Summary & Index
6 P/E Ratio — the recent price divided by the latest six months’ earnings per share plus earnings estimated for the next six months.
7 Trailing and Median P/E — the first is the recent price divided by the sum of reported earnings for the past four reported quarters; the second is an average of the price/earnings ratios over the past 10 years.
8 Relative P/E ratio — the stock’s current P/E divided by the median P/E for the approximately 1,700 stocks under Value Line review.
9 Dividend Yield — cash dividends estimated to be declared in the next 12 months divided by the recent price.
10 Target Price Range — the range in which a stock price is likely to trade in the 3- to 5-year projection period. Also shown in the “Projections” box on the left.
11 The percent of shares traded monthly — the number of shares traded each month as a % of the total outstanding.
12 Statistical Array — Value Line estimates and projections appearing in the area on the right side are in bold italics.
13 Analyst’s Commentary — A 300 – 400 word report on recent developments and prospects — issued every three months on a regular schedule. Supplementary reports are issued when there is important news.
14 Value Line Ratings for Financial Strength, Price Stability, Price Growth Persistence, and Earnings Predictability. (See Glossary valueline.com for definitions.)
15 Footnotes explain a number of things, such as the way earnings are reported, whether basic or diluted.
16 Quarterly Sales are shown on a gross basis. Quarterly earnings on a per-share basis (estimates in bold type). Quarterly Dividends Paid are actual payments. The total of dividends paid in four quarters may not equal the figure shown in the annual series on dividends declared in the Historical and Statistical Arrays. (Sometimes a dividend declared at the end of the year will be paid in the first quarter of the following year.)
17 Annual Rates of Change (on a compound per-share basis). Actual for each of the past 5 and 10 years, estimated for the next three to five years.
18 Historical Array — historical financial data appear in regular type.
19 Projected stock price in 3 to 5 years. Also, the total expected percent gain/loss before dividends and the Annual Total Return (percent including dividends).

www.valueline.com www.valuelinepro.com 1-800-VALUELINE (1-800-825-8354)
Value Line Publishing LLC 551 Fifth Avenue New York, NY 10176 [email protected]
1A-2-3