how to handle boil-off gases from lng trucks - …844798/fulltext02.pdf · how to handle boil-off...
TRANSCRIPT
How to Handle Boil-off Gases from LNG Trucks
Master thesis project LIU-IEI-TEK-A--15/02235—SE
Linda Gunnarsson Erik Helander
2015-06-04
Machine Design
Department of Management and Engineering
Linköping University
(Scania CV AB, 2015b)


PAGE | I
Abstract
This master thesis project aims to investigate the circumstances of boil-off for heavy vehicle transports
using LNG, Liquefied Natural Gas, as fuel and to suggest possible ways of handling these gases
otherwise released into the atmosphere. LNG is natural gas that is cooled below its vaporisation point,
turning it into liquid phase which is a much more dense way of storing and transporting the fuel. Trucks
running on LNG store their fuel in super insulated tanks, but some heat are transferred into the fuel
anyway, causing it to vaporise at a slow but steady rate. During operations of these trucks, this
vaporised gas is consumed and the pressure is kept at a consistent level of 10 bar. Once the truck is
turned off, consumption stops and the pressure starts to increase. After a period of standstill, normally
several days, the pressure within the tank has increased to 16 bar when a valve opens to release gas
from the tank. This gas is called boil-off. This is a safety feature, causing the pressure not to increase
above this point. While natural gas, mostly containing methane, is released, fuel is lost and an
environmentally unfriendly substance is let out into the atmosphere. This has to be avoided to improve
the environmental aspects of using LNG as a fuel for trucks. The release of boil-off gases will most likely
be restricted through regulations, yet to come. This project began with an investigation regarding how
much gas being released and during what scenarios of the lifecycle of a truck this might occur. Since
the release of boil-off gases rarely should happen during regular use of these trucks, but a system
handling these gases should work at any time and place, a cheap and lightweight unit are to be fitted
to these trucks. Equipment already fitted to the truck should be used as much as possible, keeping
additional costs and weight low. The development phase of this project analysed what criteria being
important to the equipment, generated ideas how to utilise the resource and finally researched
technologies possible to use or implement for the criteria to be fulfilled. The most resource efficient
way of handling these boil-off gases, is to re-liquefy it and transferring it back to the usual LNG tank on
the vehicle. The second best option is to consume the gas, making the emissions less environmentally
unfriendly. While consuming the gas, as much as possible of its energy should be utilised, transformed
into electricity and heat. Electricity is the most valuable of these two, charging the batteries on the
truck, decreasing the fuel consumption while running and increasing the lifespan of the batteries. The
most efficient way of managing the heat generated is to distribute it to the coolant system on the truck,
providing it to the engine and several other components. Distributing the energy is also a matter of
safety, as very hot areas otherwise might cause risks of fire. The most simple concept, furthermore
easiest to implement in the near future, is to use a burner similar to the auxiliary diesel heaters fitted
to some trucks today. This consumes fuel, generating heat to the coolant system. An additional cooler
is needed, to cool excess heat from the system keeping the temperatures to a certain level. Using this
system for an extensive period of time needs an external power supply, since no electricity is generated
from consuming the gas. Other technologies that could be used in the future, also generating electricity,
is thermoelectric generators and solid oxide fuel cells. These are technologies now being further
developed and adapted to be fitted to vehicles. These technologies are especially interesting for
handling BOG when they are implemented to these trucks for use within other systems as well, for
instance utilisation of the heat within exhaust gases. However, a small scale re-liquefaction unit
mounted to the truck is seen as the most resource efficient solution, making it possible to keep using
the gas for its intended purpose of propelling the trucks forward. This already existing technology has
to be made more compact, adapted to the use on a truck.

PAGE | III
Acknowledgements
This report is a result of a thesis work for the degree Master of Science – Mechanical Engineering at
the department Machine Design at Linköping University. The assignment is carried out upon request
from, and in cooperation with Scania CV AB. The thesis work has been performed during the entire
semester, from January to June, 2015.
First of all, we would like to thank our supervisor at Scania – Sara Johansson. Thank you for your help,
your enthusiasm and guidance during the full extent of the project. We would also like to thank Jenny
Svensson, Andreas Forsell and Marie Thenander within the team working with gas trucks at RSM, for
all helpful discussions. Also, a big thanks to all persons we have been in contact with, within and outside
Scania, interviewing or having discussions with during this project.
At Linköping University we especially would like to thank our supervisor Micael Derelöv and examiner
Simon Shütte for your guidance during this as well as previous projects. Thanks as well to our
opponents Erik Karlsson and Petter Jakobsson for your opinions.
Södertälje, May 2015
Linda Gunnarsson and Erik Helander

PAGE | V
Table of Contents
1 Introduction ..................................................................................................................................... 1
1.1 Background .............................................................................................................................. 1
1.2 Purpose .................................................................................................................................... 2
1.3 Goal ......................................................................................................................................... 2
1.4 Delimitations ........................................................................................................................... 3
1.5 Report Structure ...................................................................................................................... 3
2 Method ............................................................................................................................................ 5
2.1 Process Flowchart .................................................................................................................... 5
2.2 Subject of Study ....................................................................................................................... 5
2.3 Method for Collection of Theory ............................................................................................. 6
2.4 Method for Collection of Empirics .......................................................................................... 6
2.5 Demand Specifications ............................................................................................................ 7
2.6 Function Analysis ..................................................................................................................... 9
2.7 Concept Generation .............................................................................................................. 11
2.8 Concept Evaluation ................................................................................................................ 12
3 Frame of Reference ....................................................................................................................... 15
3.1 Natural Gas ............................................................................................................................ 15
3.2 Biogas .................................................................................................................................... 18
3.3 Infrastructure for Gas ............................................................................................................ 18
3.4 Greenhouse Gases ................................................................................................................. 19
4 Product Description ....................................................................................................................... 21
4.1 Market ................................................................................................................................... 21
4.2 Application Truck ................................................................................................................... 23
4.3 Environmental Aspects Using LNG ........................................................................................ 27
4.4 Regulations by Law ................................................................................................................ 28
4.5 Fuel Prices .............................................................................................................................. 29
5 Investigating Boil-off ..................................................................................................................... 31
5.1 Scenarios of Boil-off .............................................................................................................. 31
5.2 Amount of Boil-off ................................................................................................................. 35
5.3 Environmental Effects of Boil-off .......................................................................................... 35
5.4 Economic Aspects .................................................................................................................. 36
6 Demand Specifications .................................................................................................................. 37
6.1 Customers .............................................................................................................................. 37
6.2 House of Quality .................................................................................................................... 38
6.3 List of Engineering Specifications .......................................................................................... 38
7 Function Analysis ........................................................................................................................... 39
7.1 Black Box................................................................................................................................ 39
PAGE | VI
7.2 Technical Principles ............................................................................................................... 39
7.3 Transformation Systems ........................................................................................................ 40
7.4 Sub-functions ......................................................................................................................... 47
8 Concept Generation ...................................................................................................................... 49
8.1 Control of Steady Flow .......................................................................................................... 49
8.2 Connection to External Equipment ....................................................................................... 50
8.3 Presently Feasible Solutions .................................................................................................. 50
8.4 Future Solutions .................................................................................................................... 52
9 Concept Evaluation ........................................................................................................................ 55
9.1 Engineering Specifications ..................................................................................................... 55
9.2 Pros, Cons, Opportunities and Challenges ............................................................................ 56
9.3 Elimination Matrix ................................................................................................................. 58
9.4 Concept Scoring ..................................................................................................................... 58
9.5 Concept Decision ................................................................................................................... 58
10 Discussion ...................................................................................................................................... 59
10.1 Method .................................................................................................................................. 59
10.2 Investigating Boil-off ............................................................................................................. 62
10.3 Results ................................................................................................................................... 64
10.4 Engineering Ethics ................................................................................................................. 68
11 Conclusion and Recommendations ............................................................................................... 69
11.1 Conclusion ............................................................................................................................. 69
11.2 Concept Recommendation .................................................................................................... 71
11.3 Future Studies ....................................................................................................................... 71
References ............................................................................................................................................. 73
Index ...................................................................................................................................................... 77
Appendix I – House of Quality ............................................................................................................... 79
Appendix II – Creating Ideas .................................................................................................................. 81
Appendix III – Functions-means-tree .................................................................................................... 85
Appendix IV – Evaluation of Engineering Specifications ....................................................................... 87
Appendix V – Concept Scoring .............................................................................................................. 89

PAGE | VII
Abbreviations
BOG Boil-off Gas
CBG Compressed Biogas
CNG Compressed Natural Gas
CO2,eq Carbon dioxide equivalents, the unit for GWP
FFU Fit For Use – additional assembly work made after final assembly line
GHG Greenhouse Gases
GWP Global Warming Potentials
HoQ House of Quality
LiU Linköping University
LBG Liquefied Biogas
LCNG Units, for instance filling stations, built to handle gas in both liquefied and
compressed phase
LNG Liquefied Natural Gas
LNG-SSL The natural gas is withdrawn from the national pipeline system and liquefied locally
at a service station by a Small-Scale Liquefaction plant
LNG-TER The natural gas is liquefied at a large scale plant and obtained directly from the
regasification or shipping Terminal and transported as LNG to the local filling station
RSM Scania department for Design and Predevelopment – Customized Truck
Development
SOFC Solid Oxide Fuel Cell
SWOT Strengths, Weaknesses, Opportunities, Threats
TE Thermo Electric
TEG Thermo Electric Generator


INTRODUCTION 04 JUNE 2015
PAGE | 1
1 Introduction The introduction describes the background, purpose, goal and delimitations of the project as well as
the structure of the report.
1.1 Background The sector for heavy vehicle transports are constantly in search for ways to bring more profit and to
compete among others for customers and to transport their goods. Truck manufacturers also have to
adapt to new regulations and enhanced requirements regarding emissions, as well as further demands
in changing from fossil fuels to renewable substitutes. Natural gas is the fossil fuel with the lowest
amount of emissions, like carbon dioxide, particles and other pollutants harmful to health and
environment (Swedish Environmental Protection Agency, 2015b). Biogas is a renewable alternative,
fully compatible to natural gas, which have been used during many years as a fuel for vehicles with
significantly lower amount of emissions (Swedish Environmental Protection Agency, 2012). The
majority of gas vehicles until today have been carrying its fuel in a compressed form, so called CNG,
Compressed Natural Gas. One limitation with CNG is the range possible to achieve on full tanks, due
to the energy stored per litre. This makes it limited to use for short distances, in local regions. Another
limit is the infrastructure, where the access to filling stations is limited due to the need of pipeline
connections to distribute the gas in an efficient way. The combination with the short range and few
filling stations make this alternative suitable only for local transports. The main segments using CNG
are city buses and refuse collection trucks.
To use gas as a fuel at longer distances the need of storing the gas in a more energy dense way is
essential. One way to solve this issue is to liquefy the gas, into so called LNG, Liquefied Natural Gas.
Depending on the pressure of the gas, which contains about 90 % methane, the vaporisation occurs at
different temperatures. At atmospheric pressure, the vaporisation occurs at
-162 °C (AGA, 2015). Once liquefied, it turns 600 times denser than natural gas at atmosphere pressure,
which makes it possible to carry three times more energy per volume than CNG at 200 bar (AGA, 2015).
The content of energy in 1 litre of diesel corresponds to 5 litres of CNG at 200 bar, and 1.7 litres of LNG
(Tunestål, et al., 2007).
LNG is kept cold in a super insulated tank, comparable with a thermos, where a vacuum is applied in-
between the inner and the outer shell as well as an insulation material. During use of the truck, the
consumption of gas and the functions of the system keep the pressure and the temperature within the
tanks down to a certain level. When the engine is turned off and the consumption terminates, the
small but constant amount of heat leaking into the tank heats the fuel and vaporisation continues. If
the truck is standstill for a long enough time, this vaporisation makes the pressure in the tank increase
up to a pressure of 16 bar where a relief valve opens and gas is ventilated into the atmosphere to
decrease the pressure in the tank. This released gas is called boil-off. Methane is a GHG, greenhouse
gas, many times worse than carbon dioxide. Hence, venting natural gas into the atmosphere has a
severe effect on global warming and loosing fuel also means losing money.
The Swedish Environmental Protection Agency (2015b) describes the release of methane into the
atmosphere as one of the big challenges in increased use of natural gas. They further describe that
these leaks of methane, might spoil the profit of using natural gas compared to other fuels all together.
This points out the importance of not releasing any gas, from an environmental point of view. These
facts, as well as indications from Scania points to the possibility of coming regulations that prohibit the
release of methane into the atmosphere. Another application where the release of flammable gases is
considered a severe danger is during transportation on ferries. This is another factor, pushing for
systems to avoid the release of methane into the ambience of the vehicles.
INTRODUCTION 04 JUNE 2015
PAGE | 2
1.2 Purpose The purpose of this project is to make the use of LNG as a fuel for trucks, more efficient and more
attractive to use both now and in the future. The situation when LNG is released into the atmosphere
is a weak spot in these systems, both regarding economic and environmental issues. This is also a
matter of fulfilling any coming regulations, prohibiting the release of methane into the atmosphere
and make it possible to use ferries for transportation of LNG trucks.
There are several stakeholders interested in this case. Truck manufacturers, trucking companies and
companies requesting transportation all have economic interests in the business. Profit is essential and
secondly they also need to maintain or improve their environmental image. This is getting an all more
important factor, which is publicly requested and where new legislations are introduced to make
improvements in the way the environment is treated. The fourth and final stakeholder is therefore the
public, whose interest in the environment is essential and also since they in the end are paying for the
products and through this they also pay for the full delivery chain costs.
Avoiding the release of boil-off gases, BOG, from LNG trucks , would be of interest for all stakeholders
mentioned above. This would make LNG as a fuel more environmentally friendly and possibly expand
the transition from oil based fuels into increased usage of gas, which is a more clean burning option.
This might also, in the long run, expand the infrastructure for gas, improve the technology and make
the transition into using biogas more feasible for the future. Since biogas is a renewable fuel and
massive amounts of organic waste are spoiled on landfills, the expansion in utilising this organic waste
would decrease the demand of fossil fuel.
1.3 Goal The goal of this project is to act as a pre-study for future projects regarding how BOG can be handled.
Within this project concepts are to be developed for utilisation or treatment of BOG that otherwise
would be released into the atmosphere, occurring when LNG is used as a fuel for trucks. Different
scenarios during the lifecycle of a truck will be investigated to understand when BOG might have to be
released. It will also be analysed what customer needs, during these events, this gas might be used to
fulfil.
This project is to result in concepts which describe functions and basic principles, possible to be
evaluated with respect to technical functionalities, economic profitability and effects on
environmental aspects. One presently feasible concept is to be recommended for Scania to develop
further and to implement on LNG trucks of today. Several future concepts and technologies will also
be recommended for Scania to further explore and implement on LNG trucks in the future.
The results of the project will be presented in a report, published trough LiU and within Scania CV AB.
1.3.1 Questions of Research To fulfil the goal of this project, questions are stated to aid the process:
1. In what situations do the release of BOG occur, during the lifecycle of trucks?
2. Which economic and environmental benefits do utilisation of BOG bring?
3. In which ways can BOG be handled, in an cost efficient and environmentally friendly way?
4. How could concepts for handling BOG from LNG trucks look like?
INTRODUCTION 04 JUNE 2015
PAGE | 3
1.4 Delimitations The project does not include:
to examine applications for boil-off for LNG in other applications than trucks
to further develop the concepts into finished solutions
to perform calculations or simulations to investigate when boil-off occur
to perform physical testing on different concepts
1.5 Report Structure Chapter 2 will present the methods for collection of theory and empirics used in this project. This
chapter also describes the methods used to develop and analyse the concepts. In chapter 3
fundamental theory about natural gas as a fuel for trucks is described. Chapter 4 presents the product
description with respect to the system on a truck, regulations by law and economic, environmental
and market aspects.
Chapter 5 describes the results generated through the investigation of when the release of BOG might
occur and the properties of the gas released, including environmental and economic aspects. Chapter
6-9 presents the result of the project by the methods described in chapter 2. The project will then be
discussed in chapter 10 with respect to the project´s methods and result. In chapter 11, the conclusions
of the project is presented as well as what concepts and technologies is recommended for Scania to
further develop and implement.

INTRODUCTION 04 JUNE 2015
PAGE | 4
METHOD 04 JUNE 2015
PAGE | 5
2 Method In this section, the methods that have been used during the project are described. Starting off with a
visual flowchart of the project, continuing with the collecting of theory and empirics. The methods used
during the development and evaluation of concepts are also described in this following section.
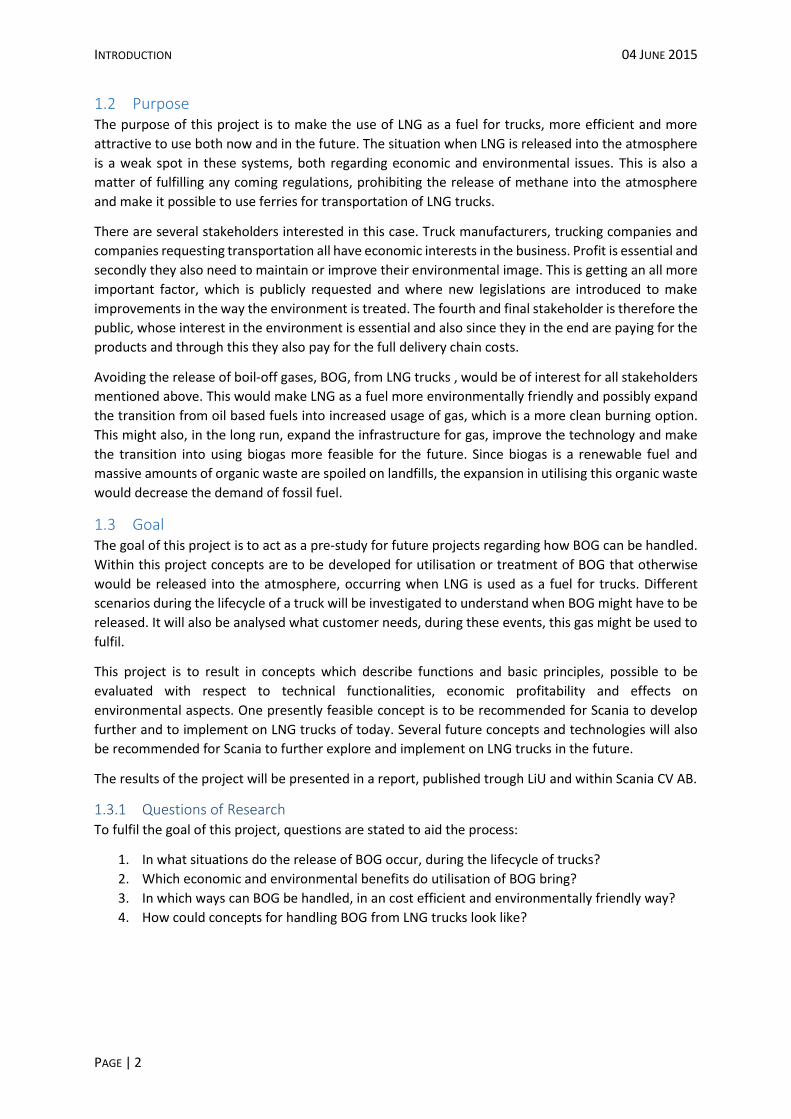
2.1 Process Flowchart The project will go through six phases, which are represented by the coloured boxed in the top of
Figure 1. Below the boxes, the main activities are stated for each phase. The bottom of the figure
shows in which parts of the report each phase is described.
Figure 1 - The process flowchart in the project.
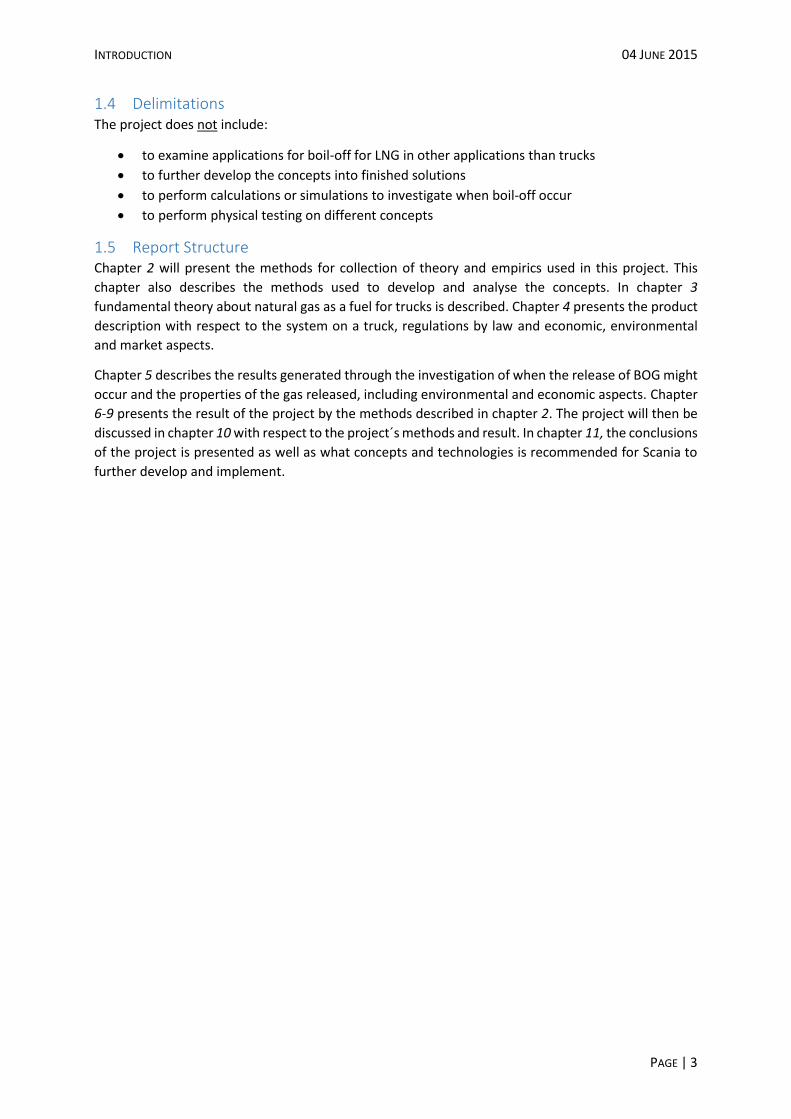
2.2 Subject of Study The areas of interest for this particular
project is stated in Figure 2 and the main
targets is the striped area in the middle.
First of all, general information about
natural- and biogas is of importance for
getting to know the properties of the
substance. Knowledge about LNG
includes e.g. how it is handled, what
properties it has and what is developed in
the area of handling boil-off until today.
General information about trucks is also
of importance, since knowing the product
and the systems are required to be able
to make changes and add new functions
to the product. Technology
benchmarking include info about
technologies possible to use for
implementing the concepts. This might
include technology already connected to
handling BOG as well as technology that
could be possible to use as inspiration to
the project.
Figure 2 - Describes the areas of theoretical and empirical interest. The marked area is where the main target, and where the project will be focused.
Natural gas &
biogas
LNG
Trucks &
truck users
Boil-off
Technology
benchmarking

METHOD 04 JUNE 2015
PAGE | 6
2.3 Method for Collection of Theory The suitable way of finding literature with theories of interest is by searching within databases for
books, articles, reports etcetera (Ejvegård, 2009; Eriksson & Wiedersheim-Paul, 2008). Ejvegård also
refers to using the reference lists from articles or other publications from scientists within the area, to
find literature of interest. To be able to validate the information from publications, it should be
confirmed by other publications if possible, but they need to be independent from each other
(Ejvegård, 2009). All sources, regardless of type, need to be critically analysed, which further is
described by Ejvegård. He further states, that the objectivity of the referred publication needs to be
analysed, regarding the truthfulness and the independence of the author. The information also needs
to be up to date and if describing a certain event or facts from a certain time, it needs to be written
close in time to the actual event. Eriksson & Wiederheim-Paul pinpoints the same factors to be able to
validate the information found in different publications.
To be able to find literature of relevance during this project, books and articles available through both
KTH Royal Institute of Technology and Linköping University are used. The database Libris is used to find
books of relevance and Scopus is the source for finding articles of interest.
2.4 Method for Collection of Empirics Ejvegård (2009) states that the questions in an interview can be more or less structured - the questions
can be handed out beforehand or just the theme of the interview. Lantz (2007) describes a structured
interview as when the interviewer asks beforehand formulated questions in a specific sequence and
the respondent answers by alternatives given beforehand. Lantz also describes that an interview can
be completely indefinite, which means that the interviewer asks an open question that the respondent
freely develop his or hers thoughts around. Further, the interviews can be between structured and
completely open.
Interviews can take place both in the empiric and the processing phase. It is important to choose
respondents carefully and plan the interview well. The interviewer has to think through what the main
goals for the interview is and which questions that really have to be asked to reach the goal of the
interview. (Ejvegård, 2009)
The interviewer should always ask the respondent if his or hers name can be published in the report
or results. When the interviewer has written down the resulting text from the interview, it is important
to send it to the respondent so that the interviewee can make corrections. It is also important to give
the interviewee the possibility to see the end results afterwards. (Ejvegård, 2009)
Björklund & Paulsson (2003) means that a well completed interview gives data that fulfils specific
requirements of usefulness:
Validity – in which extent the study measure what is referred to be measured
Reliability – in which extent the results from the study would be the same if the study
was to be repeated
Objectivity – in which extent values of interests affect the study
The target for every study should be to that each study will achieve as high validity, reliability and
objectivity as possible. Although, these requirements has to be weighed against resource efficiency.
Validity increases by using various perspectives, for instance to not have any leading questions. The
reliability increases by using control questions, where the subjects are studied one more time. By
clarifying and motivate the different choices that has been made during the study, the reader get the
opportunity to determine their standpoint towards the study results and thereby increases the
objectivity of the study. (Björklund & Paulsson, 2003)
METHOD 04 JUNE 2015
PAGE | 7
2.4.1 Implementing Interviews The following section states how the methods for interviews are implemented during this project.
Before or during planning of interviews:
Think about the question What within the subject can be answered through interviews?
Decide the theme and the base of questions for the interview
Think about the question Who might be able to answer these questions?
Make contact and ask friendly if the persons in question wish to be interviewed. Tell them
about the subject and why their information are important
During interview:
Arrive on time and be well prepared
Introduce yourself and the reason for the assignment
Start the interview with some open and simple questions
Start of from the base of questions stated beforehand and ask clarifying or follow-up questions
Create a discussion rather than just one question after another
Take notes
After interview:
Pinpoint the most important results from the interview
Send follow-up questions to the respondent, if he or she has approved to do so
Complement subjective information by literature or other interviews to verify the statements
Show the appreciation to the respondent, by sending a proper Thank you for helping us with
our task along with the resulting section of text for a read-trough and corrections by the
interviewee
Send the end result of the study to the respondents
2.5 Demand Specifications This phase is based on the customers’ needs and requirements which are gradually converted into
product specifications. The results are both which product specification that should be prioritised
during the development process and which target and limit values, for each specification, to aim for
during the project.
2.5.1 Customers and Stakeholders For most design situations, there are more than one customer. For many products the most important
customer are the consumers. The customers are every group of people that directly uses the product.
(Ullman, 2010)
Johannesson, et al. (2013) describes the stakeholders as everyone that in some way will be affected
by or have opinions about the product and its various behaviours during its lifetime. Ulrich & Eppinger
(2000) means that the stakeholders are all groups of people who are affected by the product’s success
or failure. Further, Ulrich & Eppinger continues that the list of stakeholders serves as a reminder for
the product developing team to consider the needs of everyone who will be affected by the product.
The stakeholders could be customers, service workshops, manufacturing, purchasing, marketing and
the society (Johannesson, et al., 2013).

METHOD 04 JUNE 2015
PAGE | 8
2.5.2 House of Quality The house of quality, HoQ, helps to
generate the information needed in the
design process of the product. The
purpose of a HoQ is to guarantee that
the customer needs are satisfied by the
product specifications. The result of the
HoQ is the order of which to prioritise
the customer needs, hence what to
mainly focus on during the
development process. (Ullman, 2010)
Figure 3 shows a simplified version of
HoQ. The first step when performing a
HoQ is to identify who the customers
are and in step two define the customer
needs. The third step includes ranking
the importance of every customer need,
for every specified customer, the higher importance the higher value. In step four, product
specifications are defined which all are measurable specifications that correlates to the customer
needs. It should also state if it is better to have more of the product specification, shown by , or if it
is better to have less, shown by . The fifth step is to set the correlation between the product
specifications and the customer needs. A 9 represents a strong correlation, 3 represents a medium
correlation, 1 represents a small correlation and if there is no correlation the cell is left empty. The last
step, step six, presents the normalised value for each product specification. This is made by first
multiplying the customer importance with the correlation for each specification. This will result in
calculated values of how important each specification is to each customer. These numbers are the
normalised, generating comparable values of the importance of the specifications, stated for each
customer. The purpose is to see which product specification should be prioritised during the
development of the product. (Ullman, 2010)
2.5.3 List of Engineering Specifications From the HoQ, a list of engineering specifications is obtained. A model of a table, presenting these
specifications is introduced in Table 1. In the first column the product specifications from the HoQ is
written, followed by their units in column two. In the third column the importance for the product
specification is presented by a number from one to five, where five is most important. These priorities
is based on the normalised values from the HoQ. For each product specification, an ideal value and a
limit value are presented. The ideal value represents the best result the team can aim for, and is
presented in column four. The limit value represents the value that just barely make the product
commercially viable, and is presented in column five. These values comes from calculations,
benchmarking and what is reasonable in a production point of view. To beat the competition in making
the best solution, focus should lie on the specifications most important to the customers, which is set
by the HoQ. (Ulrich & Eppinger, 2000)
Table 1 - A model for the list of engineering specifications.
Engineering specification Unit Importance Ideal value Limit value
Specification 1 Specification 2
Figure 3 - A simplified principle for House of Quality.
METHOD 04 JUNE 2015
PAGE | 9
2.6 Function Analysis The main goal with this process is to break down the main function of the system into its sub-functions,
and by what different means or principles it is possible to fulfil or handle these sub-functions. In the
end, this makes up a variety of combinations of how to, by fulfilling all the decomposed sub-functions,
solve the main function of the system. (Liedholm, 1999)
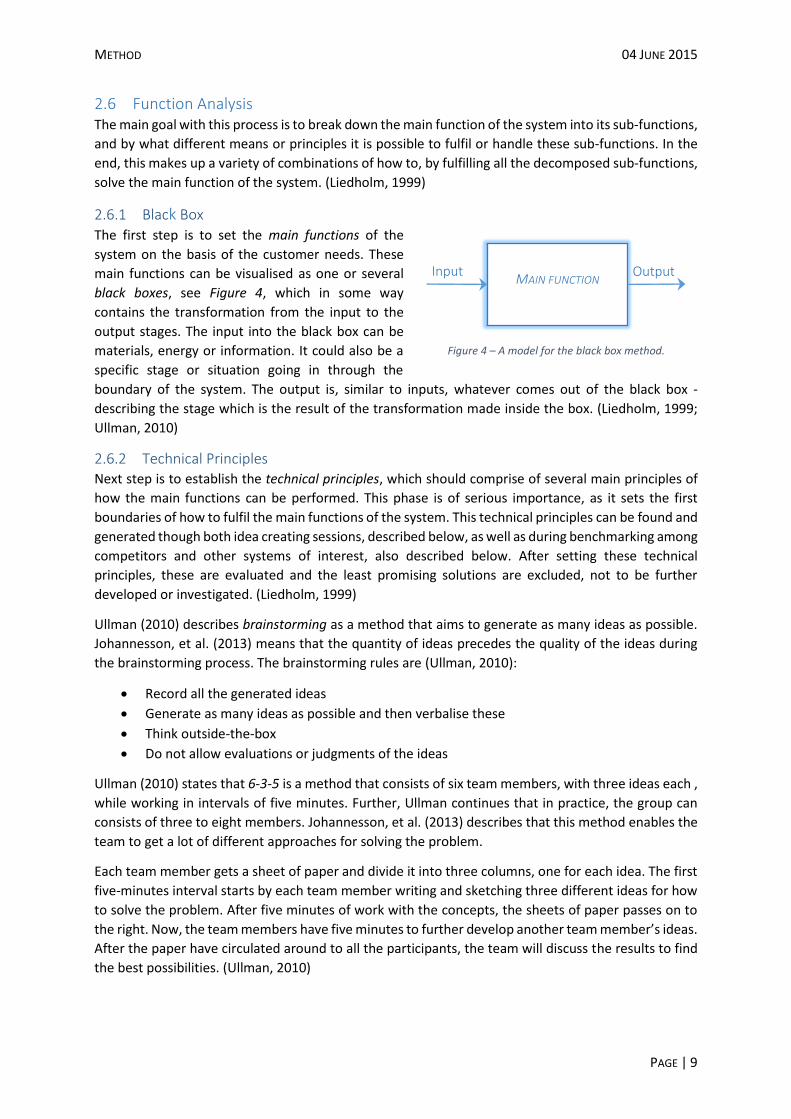
2.6.1 Black Box
The first step is to set the main functions of the
system on the basis of the customer needs. These
main functions can be visualised as one or several
black boxes, see Figure 4, which in some way
contains the transformation from the input to the
output stages. The input into the black box can be
materials, energy or information. It could also be a
specific stage or situation going in through the
boundary of the system. The output is, similar to inputs, whatever comes out of the black box -
describing the stage which is the result of the transformation made inside the box. (Liedholm, 1999;
Ullman, 2010)
2.6.2 Technical Principles Next step is to establish the technical principles, which should comprise of several main principles of
how the main functions can be performed. This phase is of serious importance, as it sets the first
boundaries of how to fulfil the main functions of the system. This technical principles can be found and
generated though both idea creating sessions, described below, as well as during benchmarking among
competitors and other systems of interest, also described below. After setting these technical
principles, these are evaluated and the least promising solutions are excluded, not to be further
developed or investigated. (Liedholm, 1999)
Ullman (2010) describes brainstorming as a method that aims to generate as many ideas as possible.
Johannesson, et al. (2013) means that the quantity of ideas precedes the quality of the ideas during
the brainstorming process. The brainstorming rules are (Ullman, 2010):
Record all the generated ideas
Generate as many ideas as possible and then verbalise these
Think outside-the-box
Do not allow evaluations or judgments of the ideas
Ullman (2010) states that 6-3-5 is a method that consists of six team members, with three ideas each ,
while working in intervals of five minutes. Further, Ullman continues that in practice, the group can
consists of three to eight members. Johannesson, et al. (2013) describes that this method enables the
team to get a lot of different approaches for solving the problem.
Each team member gets a sheet of paper and divide it into three columns, one for each idea. The first
five-minutes interval starts by each team member writing and sketching three different ideas for how
to solve the problem. After five minutes of work with the concepts, the sheets of paper passes on to
the right. Now, the team members have five minutes to further develop another team member’s ideas.
After the paper have circulated around to all the participants, the team will discuss the results to find
the best possibilities. (Ullman, 2010)
Figure 4 – A model for the black box method.
MAIN FUNCTION Input Output

METHOD 04 JUNE 2015
PAGE | 10
Six thinking hats is a method that is based on role playing among the participants. Each team member
gets a coloured “hat”, where each colour symbolises a character. Ideas are generated when the team
members have their “hats” on. The hats will enable people to be more productive, focused and
mindfully involved. (The de Bono Group, 2015)
Following characters exist within this method, corresponding to different colours (The de Bono Group,
2015):
White – information known or needed
Yellow – brightness and optimism
Black – judgment
Red – feelings, hunches and intuition
Green – creativity; the possibilities, alternatives and new ideas
Blue – manage the thinking process
Benchmarking is an analysis of competitors (Johannesson, et al., 2013). Ulrich & Eppinger (2000)
describes benchmarking as the study of existing products with functions of interest to the development
process. Benchmarking includes investigating similar products from competitors, studying literature
and patents of the area and studying products that solves similar functions in completely different
areas (Liedholm, 1999).
2.6.3 Transformation System After the technical principles of interest are set, these need to be broken down further where the
transformation system are described as several steps of transformations. The transformations describe
in more detail how the input of the black box are transformed into the output. The process is divided
into a preparation, an execution and a finishing phase covering all the transformations that need to
happen for the full technical principle to occur. These are specified in the schematic description,
demonstrated in Figure 5, where each transformation is represented by a box. These transformations
can be put in serial or in parallel and in combinations of them both. (Liedholm, 1999)
Figure 5 - A schematic description of the transformation system. (Liedholm, 1999)
Preparation Execution Finish
TRANSFORMATION SYSTEM
METHOD 04 JUNE 2015
PAGE | 11
2.6.4 Sub-functions and Solutions To continue the breaking down of the function analysis, the technical systems that effects the
transformations, described in Figure 5, are to be analysed. These are broken down into what
transformation functions that need to be implemented into the technical system for it to perform its
task. The break down continues as far as possible, into the sub-functions of the technical system -
including how the system is operated, powered, connected, supported etcetera. The final step of the
function analysis is to generate solutions or means how to solve these sub-functions. These solutions
are generated in the same way as the technical principles, by brainstorming or by other idea creating
methods.
Figure 6 - Description of a functions-means-tree. (Liedholm, 1999)
One way of presenting these final decomposed functions and the different solutions, is by a functions-
means-tree described in Figure 6. Here, all the steps from main function down to the final
decomposition of functions and solutions for each sub-function are presented. For more complex
systems, these trees tend to grow very big and are therefore hard to present on a regular size paper.
(Liedholm, 1999)
2.7 Concept Generation Concepts are generated as combinations of the means presented in the function-means-tree
generated during the function analysis. Depending on the amount of branches and means, the amount
of combinations can be huge. If so, the amount has to be limited. This can be made through ranking of
the means for each sub-function based on how well it solves the function. (Liedholm, 1999)
Another challenge while creating concepts from the means specified in the function analysis, is how to
create combinations which will work satisfyingly together. Here, knowledge about the technology is
essential rather than using a certain method. The need of understanding how each solution work and
how the combination could be put together is essential, to be able to generate suitable concepts.
(Liedholm, 1999)
The concept generation begins by choosing the most important sub-functions and solve these by
implementing the most promising compatible solutions. Secondly, the less important functions are
solved by means possible to combine into the concept. The combining of concepts starts of in the
lowest level of the functions-means-tree and works its way upwards. This makes it easy to describe
the full concept in an understandable way. Since the development process is an iterative procedure,
the combining of concept as well as coming stages in the process might generate new ideas for
functions or solutions. These are added accordingly. It is important to describe the concepts equally
Main function
Technical principles
Transformation functions
Sub-functions
Functions
Means
Solutions/
means
METHOD 04 JUNE 2015
PAGE | 12
detailed and not more detailed than makes it possible to evaluate the functions of the concepts as well
as comparing them to each other. (Liedholm, 1999)
After the concepts have been created, they are to be examined and improved which is an iterative
process. (Liedholm, 1999)
2.8 Concept Evaluation The goal of evaluating the concepts is to decide which concepts having the highest potential for
becoming a quality product, with the least amount of resources (Ullman, 2010).
2.8.1 Engineering Specifications To evaluate if the concept fulfils the engineering specifications, the ideal and the limit value in the list
of engineering specifications are used (Liedholm, 1999). If the concept fulfils a specification, i.e. is in
between the ideal and the limit value, it is symbolised by “+” in the column for the concept in Table 2.
If the concept does not fulfil the specification it is symbolised by “-“ and if more information is needed
by “?”. Table 2 - List of engineering specifications.
Engineering specification Unit Importance
Ideal value
Limit value Concept 1 Concept 2 …
Specification 1 Specification 2
During the evaluation with respect to the engineering specifications, the specifications themselves also
need to be investigated to clarify if the requirements are too strict. In case they are, they need to be
adjusted which is an ordinary part of the evaluation process (Johannesson, et al., 2013).
2.8.2 Pros, Cons, Opportunities and Challenges Johannesson, et. al. (2013) describes presenting pros and cons for each alternative as one of several
less organised methods, used by many. Ullman (2010) further describes pros and cons to be a part of
the procedure while eliminating concepts early in the evaluation process.
The presentation of pros and cons are a base of judgement during the elimination of concepts.
Liedholm (1999) describes that the list of pros and cons mostly should contain aspects regarding
properties and functions of the concepts. Liedholm further describes that opportunities and challenges
of the concepts also could be defined. This is a good way of pinpointing and presenting features of the
concepts, to distinguish them from each other. The presentation can be made in several ways, one of
which is presented in Table 3.
Table 3 – Describes the design of a matrix for presenting pros and cons.
Pros Cons Opportunities Challenges
Concept 1
Concept 2
For this specific project, several aspects of the concepts are analysed, for example: technology,
functions, production aspects, risks during development process, customers’ acceptance etc. These can
more or less be based on subjective judgements, but should be made according to as much hard facts
as possible.
METHOD 04 JUNE 2015
PAGE | 13
2.8.3 Elimination Matrix Johannesson, et al. (2013) describes that one step in the evaluation process is to eliminate poor
solutions. Criteria used during the elimination could be as follows (ibid):
Solves the main problem
Fulfils the engineering specifications
Realisable
Safe
Environmentally friendly
Fits the company´s product program
The elimination could be visualised in a matrix, exemplified by Table 4. Each concept will be evaluated
by each elimination criteria. If the concept fulfils the criteria that is symbolised by “+”, if it does not by
“-“ and if more information is needed by “?”. The result from this is summarised in a column of decision.
The concepts that is approved to pass the elimination is symbolised by “+” and those the ones denied
and eliminated is symbolised by “-“. Concepts that need more information for a decision are further
investigated or the concept might be eliminated due to lack of information. (Johannesson, et al., 2013)
Table 4 - A schematic elimination matrix.
Co
nce
pt
Cri
teri
a 1
Cri
teri
a 2
Cri
teri
a 3
Cri
teri
a 4
Cri
teri
a 5
Cri
teri
a 6
Cri
teri
a …
Comments Decision
1 2 …
2.8.4 Concept Scoring To compare concepts and with a relative high resolution differentiate them from each other, in respect
to several criterions, the concept scoring method can be used. To be able to get a decent size matrix,
there should not be more than about twelve concepts going into this process. More concepts can be
evaluated, after transposing the matrix, but more concepts will generate a longer process and also
harder to get a good overview of the results. The concept scoring process consist of the following steps
(Ulrich & Eppinger, 2000):
1. Create a concept scoring matrix, for example like the one presented as Table 5.
2. Choose concepts – have to be equally defined so that they are comparable to each other.
3. Choose the selection criteria - based on customer needs and chosen to differentiate among
the concepts.
4. Rank the importance of each selection criteria as a value between one to five, where five is
most important
5. Choose a reference concept – should be an average promising straightforward concept which
is familiar to the team. The reference points for each selection criteria are to be a three. To
ensure that the full scale are being used for each selection criteria, from one to five, medium
rated reference points should be picked for each selection criteria. This means that it does not
have to be the same reference concept for each criteria, as long as it is noted properly in the
matrix which point is the reference.

METHOD 04 JUNE 2015
PAGE | 14
6. Rate the concept in relation to the reference points:
a. 1 – Much worse than reference
b. 2 – Worse than reference
c. 3 – Same as reference
d. 4 – Better than reference
e. 5 – Much better than reference
7. Rank the concepts. The weighted score are calculated by multiplying the score by the criteria
weights. The sum of the weighted scores for each concepts gives the total score of the concept.
8. Make improvements or new combinations if new ideas come up during the evaluation process
and repeat the evaluation process.
9. Investigate the sensitivity of the evaluation process by investigating how much each value
effect the results. Some concepts might have higher uncertainty and this should be a
parameter while selecting one or more concepts.
10. Rank and select concepts
Table 5 - The principle for the concept scoring.
1 2 …
(Reference)
Customer needs Weight Rating Score Rating Score Rating Score
I II III IV …
Total score
Rank
Continue

FRAME OF REFERENCE 04 JUNE 2015
PAGE | 15
3 Frame of Reference This section describes theory about natural gas and how it could be stored and used. Biogas is also
presented, as well as infrastructure for distributing gas. Finally, information about these gases
representing greenhouse gases and what effects the release of natural and biogas into the atmosphere
have.
3.1 Natural Gas Natural gases are, in short, mixtures of hydrocarbons that origins from decomposition of organic
matter in sedimentary deposits. The gas has been formed during millions of years by heat and pressure
from the bedrock above. It consists of remains of plants and animals that have been trapped under
mud and soil, which over extensive periods of time changed into rock. Some of the organic material
changed into coal, some into oil and some into natural gas. Hence, natural gas is a fossil fuel and an
ending resource that is extracted from pockets deep in the bed rock of the earth. (Abu Bakar & Ali,
2010)
After extraction, which is described in Figure 7, the gas
needs to be purified, to make the combustion of the gas
cleaner and more environmentally acceptable. The major
parts of the purification process are the removal of
carbon dioxide, hydrogen sulfide and other sulfur
components. After the purification process the result is a
gas which consists mainly of methane gas, >70 %. The gas
also contains ethane, propane and small quantities of
other hydrocarbons and gases such as carbon dioxide.
Since natural gas is odourless and colourless, a sulfur-
containing organic compound is added. This acts as a
safety device, to be able to detect leakage in the system
by smelling the odour from the added compound. (Abu
Bakar & Ali, 2010)
One exception where odorant is not added is when the gas is stored and used in its liquefied phase,
which is described further in section 3.1.4.
3.1.1 Usages of Natural Gas Natural gas has been used for several hundreds of years in different applications and areas. It has been
used historically in many applications, including lighting up the streets and heating our homes.
Nowadays, in the developing countries the greatest proportion of natural gas is used within the
residential sector followed by the industrial, power generating and commercial sectors. In commercial
buildings like office buildings, schools, hotels and restaurants it is mainly used for space heating,
lighting, water heating and cooling. It is also a very popular choice for using in cooking facilities. (Abu
Bakar & Ali, 2010)
Gas as fuel is now getting increasingly popular in applications for vehicles, mostly heavy transports,
cars and transports at sea. Primarily, the transition towards increasing use of gas propelled vehicles
comes from the benefits of less emissions and also the goal of decreasing the usage of oil. (Tunestål,
et al., 2007)
Figure 7 - Fossil fuel buried deep in the ground. (geology.com, 2015)
FRAME OF REFERENCE 04 JUNE 2015
PAGE | 16
3.1.2 Important Properties Wobbe index is a measurement of the heat input for a specific gas added to a process (Oliver & Khaled,
2010). This makes an important criterion for the possibility of changing between gases in industrial
applications, like for example engines or boilers (ibid). This is a calorific index, based on volume, at
specific reference conditions (SS-EN ISO 15403-1:2008, 2008). The wobbe index for natural gas used in
industrial applications varies typically between 37.8 to 56.5 MJ/m3 (ibid). During the period from May
2014 until March 2015, the gas company AGA had an average wobbe index of 46.65 MJ/m3 in their
LNG terminal in Nynäshamn, Sweden (Eriksson, 2015b). During this period it only varied from 46.46
MJ/m3 to 46.78 MJ/m3, but it could change more in the future depending on the quality of the LNG
delivered by the suppliers (ibid).
Knock rating describes the ability of a fuel to resist auto-ignition, also known as combustion knock.
Methane gas has high knock resistance, while heavier hydrocarbons lower the knock resistance of the
fuel. Hence, a criterion known as methane number has been introduced as a measure of the quality of
the gas. For liquid fuels, the octane number is used to measure knocking tendency. These are graded
in relation to a reference fuel and put in a scale between 0 and 100. This method does not suite natural
gas since it has an octane number above 100 by today’s standards, typically in the range of 115 to 135.
(SS-EN ISO 15403-1:2008, 2008)
Since gas has a higher resistance to knock than petrol, it is possible to increase the compression ratio
in the engine to make it more efficient (Tunestål, et al., 2007).
Flammable gases has certain mixtures with combustible air when it actually is flammable, called
inflammability limits. The lower inflammability corresponds to the lean mixture situation. While below
this limit, there is not enough fuel to reach minimum ignition energy. The upper limit, corresponding
to rich mixture, applies when there is not enough air mixed with the fuel for the combustion to take
place. For methane the inflammability range is 5-15 % methane to air. (Sàez, 2010)
The ignition temperature describes at what temperature the gas auto-ignites. There are different data
about the ignition temperature depending on the source of the information. This is due to that the
ignition temperature is pressure-dependent and which method being used during the tests. (Tunestål,
et al., 2007)
The ignition temperatures are for diesel 210 °C and for petrol 246-280 °C (Engineering Toolbox, 2015).
The ignition temperature for methane is 580 °C (ibid). This means that the risk for self-ignition at an
accident or leakage is much lower while using gas, compared to petrol or diesel.
AGA has measured the density of their LNG to have an average, during the period May 2014 to March
2015, of about 0.76 kg/m3 (Eriksson, 2015b). Air has a density at about 1.20 kg/m3 (Nordling &
Österman, 2006). This means that methane is lighter than air and therefore rises to the sky when
released.
3.1.3 CNG CNG is used in many applications and can be obtained straight from the distribution system of natural
gas, by compressing the gas to about 200 bar. This is used in cars as well as heavy vehicles and are
stored in pressure tanks. To obtain the same range as one litre of diesel, the amount of CNG at 200 bar
used is about five litres. (Tunestål, et al., 2007)
To compress the gas from 10 to 200 bar it takes about 0.2 kWh/kg. (Eriksson, 2015)

FRAME OF REFERENCE 04 JUNE 2015
PAGE | 17
3.1.4 LNG To be able to store more energy per
volume the natural gas can be
liquefied, called LNG. The methane
is cooled below the vaporization
point, which depends on the
surrounding pressure, see Figure 8.
In atmospheric pressure, this
temperatures is -162 °C (AGA,
2015). Since natural gas consists
mainly of methane, this numbers
are accurate even for natural gas
(Udaeta, et al., 2010). Heavier
hydrocarbons vaporizes at higher
temperatures (Näslund red., 2006).
While in liquefied phase, the
natural gas reduces to 1/600 of the
volume compared to atmospheric
pressure at 0 °C (Udaeta, et al.,
2010).
There is a need for 0.15 kWh/kg to
liquefy and 0.10 kWh/kg to cool
down natural gas to LNG (Eriksson,
2015).
The state of which the natural gas is
cooled down to, taking the shape of LNG are referred to as cryogenic state. Cryogenics is the study of
materials at very low temperatures. To transform natural gas into cryogenic phase some substances
needs to be fully removed to prevent solid ice from forming, which might obstruct the system. These
substances are for example carbon dioxide and water. Also, no odour detection substance is added to
LNG, since it would separate during liquefaction. (Näslund red., 2006)
There are two different types of LNG, depending on where the liquefaction is made. If the gas is
liquefied at a large scale plant and obtained directly from the regasification- or shipping terminal and
transported as LNG to the local filling station, it is called LNG-TER. If the gas is withdrawn from the
national pipeline system and liquefied locally at a service station by means of a small-scale plant, it is
called LNG-SSL. The difference lies within the energy needed for the liquefaction process and the mean
of transport. The LNG turns out the same, but the costs and effects on the environment differs.
(Arteconi, et al., 2009)
To be able to store cryogenic LNG, special tanks are required. These are super-insulated, which means
that vacuum are used in between two separated shells, the inner tank holding the liquid and the outer
tank holding the vacuum. Even though the tanks are well insulated, small amounts of heat is still
transmitted into the cryogenic fuel. This means that some LNG, more or less, constantly vaporises. This
reaction is called boil-off. If no LNG is withdrawn from a certain tank, during longer periods of time,
the pressure within the tank increases and the boil-off gases, BOG, has to be vented out from the tank.
This occurs throughout the entire lifecycle of LNG, all the way from the storage at the liquefaction
plants, during transports and during consumption. (Tunestål, et al., 2007)
Figure 8 - The vaporization of methane depending on temperature and pressure. (L'Air Liquide, 2015)
FRAME OF REFERENCE 04 JUNE 2015
PAGE | 18
LNG-SSL has less BOG emissions than LNG-TER since the liquefaction is made closer to the LNG
consumer. During road transports of LNG, the BOG is released straight out into the atmosphere. When
LNG is transported at sea, in modern configurations, the BOG is used as fuel for the vessel and is
combusted on-board. (Arteconi, et al., 2009)
3.2 Biogas Biogas is a resource which have been used in small scale for a long time. During the energy crisis in the
1970’s, the interest in biogas as a source of energy grew within parts of the world. It uses organic waste
from e.g. farms, water treatment plants, households or restaurants, in an anaerobic digestion process.
This process, which occurs naturally in for example swamps, is controlled in an enclosed container.
This result in both gas and also an improved bio fertilizer. Depending on the processing techniques,
the gas now consists of 45-82 % methane, 15-45 % carbon dioxide and possibly some hydrogen sulfide,
ammonia and nitrogen gas. It is also usually saturated with water vapour when it comes out of the
digestion process. (Swedish Environmental Protection Agency, 2012)
The biogas has to be purified to be able to use as fuel in vehicles. The main objective with the
purification process is to increase the concentration of methane and thereby improve the quality of
the gas. This is done by removing unwanted substances within the gas, like carbon dioxide, water and
other pollutants. After this upgrade the biogas contains at least 95 % methane and can now be used
as a fuel for vehicles. It can be added and mixed into the natural gas distribution system, since it has
the same characteristics, or it can be distributed through systems of its own. Hence, compressed biogas,
CBG, is mixable with CNG and liquefied biogas, LBG, is fully compatible with LNG. (Swedish
Environmental Protection Agency, 2012)
Since biogas is a renewable fuel, the carbon within the gas is a part of the eco-system aboveground
and the burning of the fuel is regarded as carbon dioxide neutral. Hence, the amount of carbon dioxide
adding to global warming while combusting biogas is zero. This is due to that the carbon within the
organic waste, that digests into methane, has been extracted from the air by the photosynthesis
process. During the combustion of this methane gas, the carbon is returned to the atmosphere. This
makes it a part of the ongoing eco-system and the situation is back to where it started. (Swedish
Environmental Protection Agency, 2012)
3.3 Infrastructure for Gas The system for transportation of natural gas, in its usual gaseous state, usually consisting of a complex
network of pipelines. This is a very efficient and quick way of transporting gas, but there are very
expensive investments and efforts to build and adjust such networks. A different way of transporting
the gas is to transform it into LNG and to carry out the transports by ship or trucks. (Tunestål, et al.,
2007)
Due to the possibility to ship LNG at sea, it is possible to transport natural gas long distances without
building expensive pipelines. This requires terminals where the LNG is loaded and unloaded from the
vessels and where it also can be stored for longer periods of time while distribution from the terminal
continues. From these terminals, the LNG can directly be transformed into gas and distributed through
a national or regional pipeline system. It is also common to ship the LNG further using both trucks,
trains or smaller ships. This give the possibility to deliver LNG to even more local pipeline networks,
industries or filling stations for LNG vehicles. (Näslund red., 2006)
FRAME OF REFERENCE 04 JUNE 2015
PAGE | 19
Abu Bakar & Ali (2010) describes the demand for generating heat for buildings as depending on the
seasons and fluctuations in weather. For example, during winter the demand is much higher than thru
summer and gas, often used for heating, is therefore stored in large underground systems for use when
needed. Näslund red. (2006) describes this to be an area of use for LNG, where larger quantities of
energy can be stored while at liquefied state.
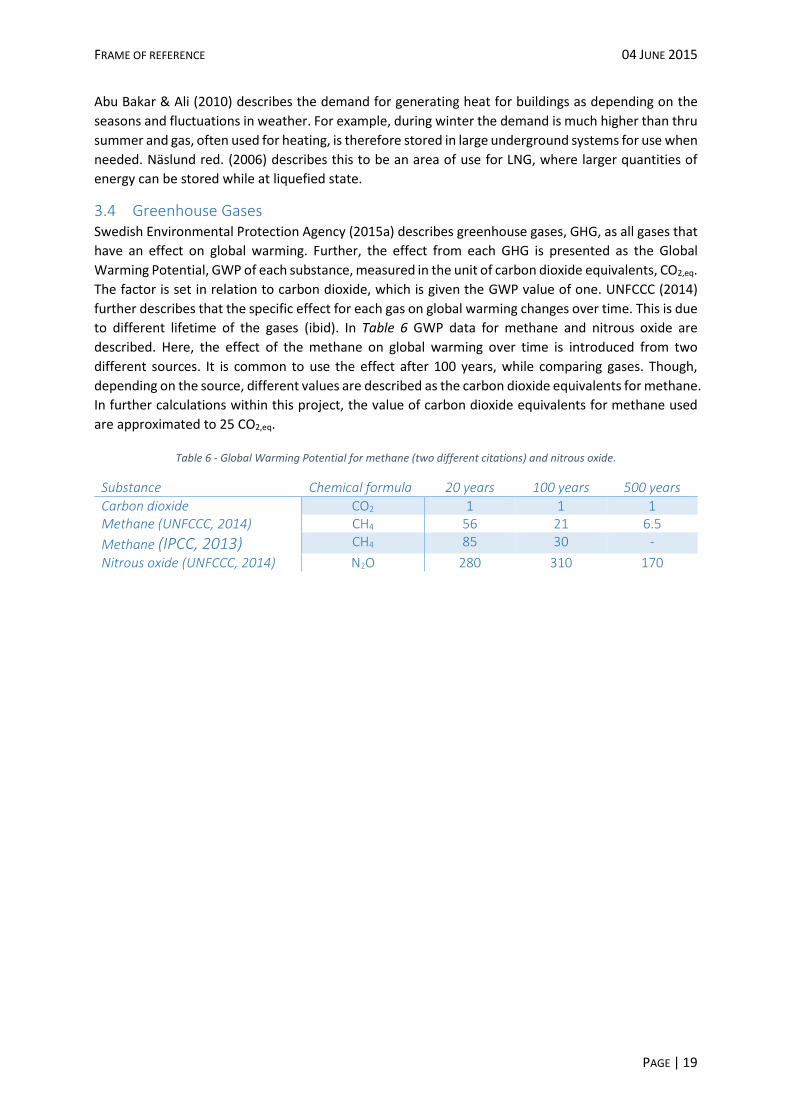
3.4 Greenhouse Gases Swedish Environmental Protection Agency (2015a) describes greenhouse gases, GHG, as all gases that
have an effect on global warming. Further, the effect from each GHG is presented as the Global
Warming Potential, GWP of each substance, measured in the unit of carbon dioxide equivalents, CO2,eq.
The factor is set in relation to carbon dioxide, which is given the GWP value of one. UNFCCC (2014)
further describes that the specific effect for each gas on global warming changes over time. This is due
to different lifetime of the gases (ibid). In Table 6 GWP data for methane and nitrous oxide are
described. Here, the effect of the methane on global warming over time is introduced from two
different sources. It is common to use the effect after 100 years, while comparing gases. Though,
depending on the source, different values are described as the carbon dioxide equivalents for methane.
In further calculations within this project, the value of carbon dioxide equivalents for methane used
are approximated to 25 CO2,eq.
Table 6 - Global Warming Potential for methane (two different citations) and nitrous oxide.
Substance Chemical formula 20 years 100 years 500 years
Carbon dioxide CO2 1 1 1 Methane (UNFCCC, 2014) CH4 56 21 6.5
Methane (IPCC, 2013) CH4 85 30 -
Nitrous oxide (UNFCCC, 2014) N2O 280 310 170

FRAME OF REFERENCE 04 JUNE 2015
PAGE | 20
PRODUCT DESCRIPTION 04 JUNE 2015
PAGE | 21
4 Product Description This section describes the market for trucks, including when LNG is a suitable option as fuel. It also
describe gas propelled trucks, aspects about using gas as a fuel for vehicles, why boil-off occur,
regulations that apply to these trucks and fuel prices.
4.1 Market Scania has divided their truck organisation into four different segments. These segments are more or
less suitable for LNG fuelled trucks, which is further described below. Possible customers using LNG is
also described below.
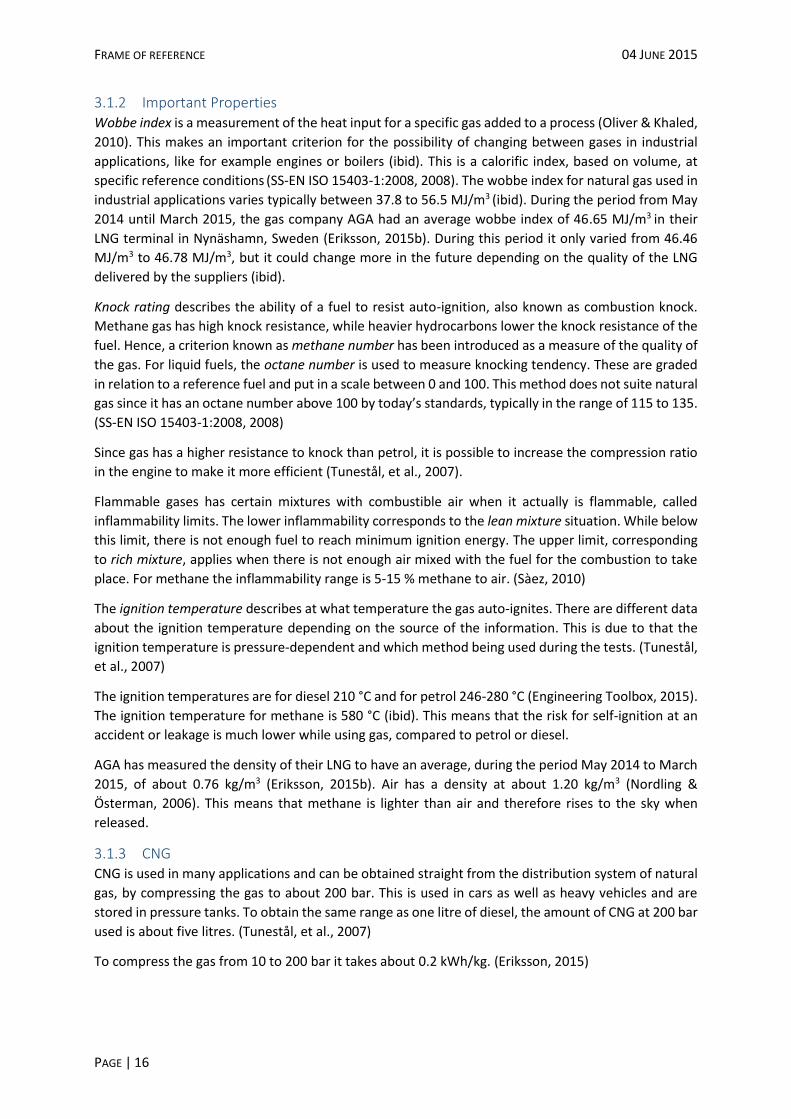
4.1.1 Market Segments The truck organisation for Scania is divided into several segments. These are distribution, long-haulage,
construction and public and special. Distribution consist of short distance transport, regional and within
cities, where goods are delivered or other needs are fulfilled. This segment contains refuse collection
trucks as well as transports of retail goods, where one example is presented in Figure 9. This is generally
a segment with high demand of alternative fuels, since additional restrictions of emissions often apply
within cities and metropolitan areas. Some alternative fuels lack range. While these fuels are used
within the distribution segment and filling stations are located at known positions, routes can be
planned to adapt to the shorter range. (Palmqvist, 2015)
Figure 9 - Distribution truck. (Scania CV AB, 2015b)
Figure 10 - Long-haulage truck.
(Scania CV AB, 2015b)
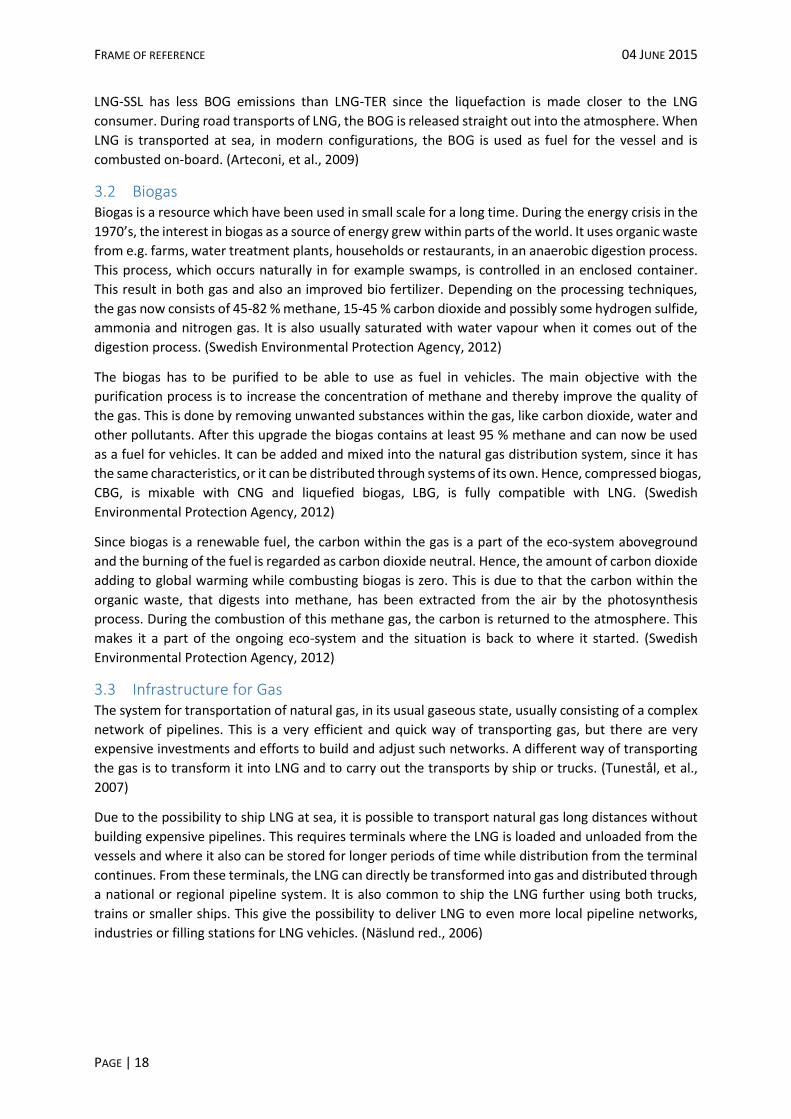
Long-haulage is the segment for longer range transports, between regions or countries, presented in
Figure 10. These are almost exclusively larger carriages where as much goods as possible are being
transported in most efficient way possible. This includes less stops compared to distribution trucks and
the range and ability to drive long distances without interruption is critical. To be able to use gas as a
fuel for long-haulage there has to be enough range between re-filling of fuel. Here, LNG plays a central
part and has to be efficient to make a good alternative to diesel for long distance transports. (Palmqvist,
2015)

PRODUCT DESCRIPTION 04 JUNE 2015
PAGE | 22
Figure 11 - Vehicle within the Construction
segment. (Scania CV AB, 2015b)
Figure 12 - Vehicle within the Public and Special segment. (Scania CV AB, 2015b)
Construction, including mining, forestry trucks, concrete pumps and tippers etcetera. These are
characterised by operating locally with low yearly mileage. One of the applications included in the
construction segment is presented in Figure 11. Both construction and public and special, which is
specialised trucks intended for usage as fire engines, airport support vehicles and military applications,
are very specialised trucks for specific customer needs. These usually sell in small volumes and are
customised to fit specific needs. One case of vehicle included in the Public and Special segment is
presented in Figure 12. (Palmqvist, 2015)
4.1.2 Possible Customers for LNG As described in section 4.1.1, the distribution segment often require alternative fuels since they often
are early adapters to new regulations or to clients demand for use of alternative fuels. Another reason
for using gas as a fuel for distribution is the demand for off-peak deliveries, during mostly nights, which
generates a high demand for low noise emissions. This can generate new revenue streams, when
focusing on customer demand new to the industry. Here LNG would be a well suited alternative when
mileage is high and for transports over longer distances. Long-haulage is also among the main targets
for LNG, since it requires longer range vehicles. (Palmqvist, 2015)
Stojanovic (2015) confirms that LNG trucks are especially requested within the segments light long-
haulage (up to 40 tons) and distribution. Milione (2015) indicates that the distribution between these
segments are 60-70 % light long-haulage, 25-30 % local distribution and 0-15 % is regional distribution.
Stojanovic (2015) describes that the customers who are interested in LNG often are on long time
contracts with their outsourcer, to minimise the risk of being unoccupied. Further, the knowledge of
boil-off among truck companies interested in LNG is well spread, and the risk of standing still for longer
periods of time is usually avoided.
It is important to have a mature market to achieve acceptance of new technology. A more mature
market usually have better infrastructure and logistic flows, i.e. less crowded roads, which gives more
possibilities regarding new and more expensive technologies. These more expensive trucks has to be
able to give return to their investments by a higher rate of use. Hence, a mature market with good
infrastructure provides higher rate of use and a higher profit. Regarding LNG, the time the carriage is
standstill effects the boil-off. This could be an important factor, that LNG could have larger promises
for success in countries with less standstill due to traffic and other logistical issues. (Palmqvist, 2015)

PRODUCT DESCRIPTION 04 JUNE 2015
PAGE | 23
The biggest limitation for Scania LNG trucks is that the engine power is pretty low, which usually also
is the case among competitors. In most parts of Europe, the maximum weight allowed for trucks is 40
tons, which is also the case in many other countries in the world. There are some exceptions, like
Sweden and Finland where even heavier vehicles are allowed. During easy conditions, these small gas
engines can manage 40 tons, but in hilly circumstances the need of more powerful engines is severe.
This generates an increasing demand in more powerful engines running on gas, which would make
LNG an option for heavy long-haulage as well. Since the Otto engine from Scania is comparable to the
diesel option regarding torque, LNG is regarded as a well suited alternative which will facilitate the
product development process. (Milione, 2015)
Milione (2015) says that at the moment, there is a high demand of LNG truck. Stojanovic (2015)
continues to describe that the most important feature for competition is price. This is confirmed by
Milione, who explains that very few transportation companies put high priority to sustainable
improvements if it lacks economical profit. This means, since LNG is a competitive alternative to diesel
regarding costs, that it makes a good alternative for the transportation companies to use. Milione
further describes that it usually is the outsourcer, who order the transport of goods, which require
more environmentally friendly services. LNG is a good alternative fuel, with less emissions, that by
today’s prices is cheaper than other fuels. Furthermore Stojanovic (2015) explains that the fuel cost
during a truck’s lifecycle is 70 % and that the selection of fuel therefore is of big interest to the
transportation sector.
4.2 Application Truck An advantage in using natural gas is that it has a higher octane number than petrol, which typically is
between 95 and 98 (Tunestål, et al., 2007). In section 3.1.2, it is stated that methane have its octane
number typically in the range of 115 to 135. Tunestål, et al. (2007) describes that the higher octane
number the more efficient fuel, since higher compression can be used without risk of knocking.
The gas engine used by Scania is a single-fuel Otto engine which has the efficiency of about 40 %. This
is to compare with petrol fuelled Otto engines whose efficiency is about 37 %. Diesel engines usually
have an even higher efficiency of about 42 %, since it uses an even higher compression ration than gas
engines. (Fritzson, 2015)
LNG is more energy dense than CNG, i.e. LNG is more
suited for vehicles used at longer range (Arteconi, et al.,
2009). Tunestål, et al (2007) means that long-haulage
vehicles must carry a large amount of fuel, which they
do not get from CNG. Tunestål, et al. further describes
that 1 litre of diesel corresponds of 5 litre of CNG at 200
bar, for the same amount of energy. LNG on the other
hand, as described in chapter 3.1.3 and 3.1.4, is three
times more energy dense than CNG. This means that 5
litre of CNG, i.e. 1 litre of diesel, corresponds to 1.7 litre
of LNG, see Figure 13.
Figure 13 - Comparison of volume that contains the same amount of energy, between CNG, LNG and diesel.

PRODUCT DESCRIPTION 04 JUNE 2015
PAGE | 24
4.2.1 CNG System Figure 14 shows a schematic picture of the
CNG gas preparation components of a
Scania truck, the so called gas panel. The gas
is stored in several pressure tanks made by
steel, composites materials or a mix of steel
and composites. The pressurised gas flows
from the tanks and enters the panel trough
a manual shut-off valve. This manual valve is
used to shut off the gas supply while service
is being made on the system. Secondly, the
gas flows through a high pressure filter after
which the pressure is reduced in the
pressure regulator to the correct pressure of
about 10 bar, requested by the engine. The
gas then flows through the low pressure
filter where additional oil and debris are separated from the gas. After finally passing through the shut-
off solenoid, which opens and closes when the engine is turned on and off, the gas continues towards
the engine. (Anton, 2015a)
4.2.2 LNG System The LNG fuel tank is a cryogenic container, i.e. the
tank stores the natural gas fuel as a highly
refrigerated liquid at low pressure (Chart, 2015).
The tank has to be extremely well insulated, since
no active cooling is being used (ibid). The concept
of this type of tank is shown in Figure 15.
To achieve the insulation necessary, the inner LNG
vessel is wrapped in multiple layers of insulation,
consisting of fibre insulation and a radiation
shield. This inner tank is then enclosed by an outer
shell, where a vacuum is applied in between these
two vessels of close to 0 bar. The inner and outer
vessels are both made of stainless steel. This setup
creates a tank that, while 80 % full, should only
increase 1 bar a day due to boil-off while no fuel is
consumed. (Kern, 2015)
To prevent from overfilling and give room for a certain amount of vapour while boil-off occurs after
filling if the truck is not operating for an extended period, an ullage tank is mounted inside the tank,
as presented in Figure 16. This occupies 10 % of the total tank volume and has a small hole in the lower
section where fuel can escape into the ullage space. While filling the tanks, due to the small hole, the
ullage tanks only gain a small amount of LNG before the filling finishes. This ensures a volume of vapour
space inside the tank. While the liquid LNG warms, generating both expansion and vaporisation, this
ullage tank ensure a space where the gas can pressurise and venting of boil-off can be avoided directly
after filling. This function is necessary to minimise the release of BOG while the tank is full or if the
truck is not operating for an extended period, and hence fulfilling the regulations described in section
4.4. (Kern, 2015)
Figure 14 - The gas panel on Scania trucks. (Anton, 2015a)
Figure 15 - The principle of the LNG fuel tank. (Chart, 2015)
Outer
Vacuum
Jacket
Evacuation
Port Inner Vessel
Super
Insulation
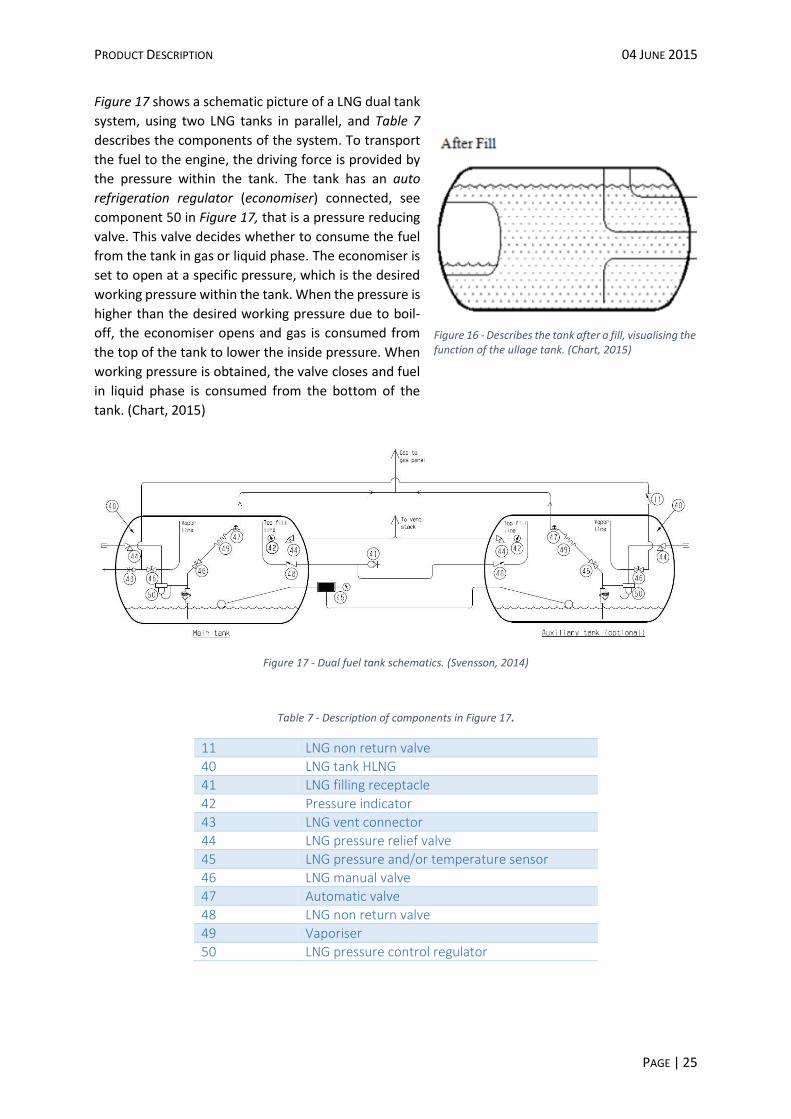
PRODUCT DESCRIPTION 04 JUNE 2015
PAGE | 25
Figure 17 shows a schematic picture of a LNG dual tank
system, using two LNG tanks in parallel, and Table 7
describes the components of the system. To transport
the fuel to the engine, the driving force is provided by
the pressure within the tank. The tank has an auto
refrigeration regulator (economiser) connected, see
component 50 in Figure 17, that is a pressure reducing
valve. This valve decides whether to consume the fuel
from the tank in gas or liquid phase. The economiser is
set to open at a specific pressure, which is the desired
working pressure within the tank. When the pressure is
higher than the desired working pressure due to boil-
off, the economiser opens and gas is consumed from
the top of the tank to lower the inside pressure. When
working pressure is obtained, the valve closes and fuel
in liquid phase is consumed from the bottom of the
tank. (Chart, 2015)
Figure 17 - Dual fuel tank schematics. (Svensson, 2014)
Table 7 - Description of components in Figure 17.
11 LNG non return valve
40 LNG tank HLNG
41 LNG filling receptacle
42 Pressure indicator
43 LNG vent connector
44 LNG pressure relief valve
45 LNG pressure and/or temperature sensor
46 LNG manual valve
47 Automatic valve
48 LNG non return valve
49 Vaporiser
50 LNG pressure control regulator
Figure 16 - Describes the tank after a fill, visualising the function of the ullage tank. (Chart, 2015)
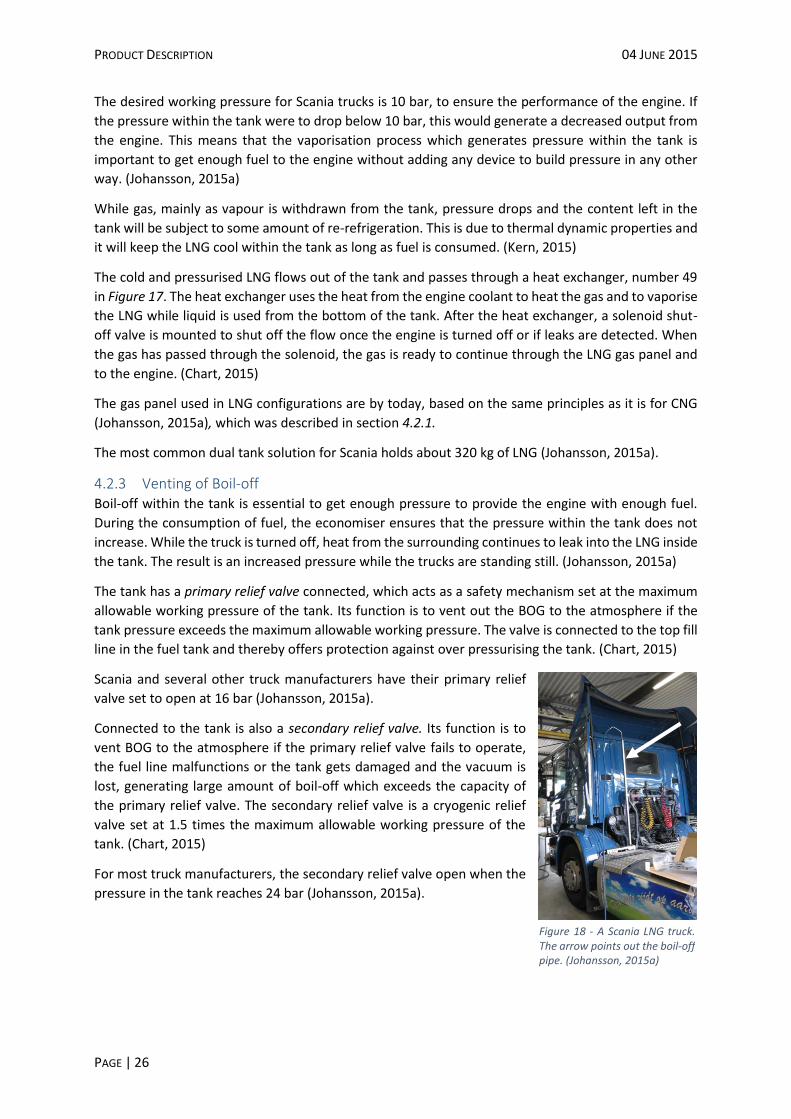
PRODUCT DESCRIPTION 04 JUNE 2015
PAGE | 26
The desired working pressure for Scania trucks is 10 bar, to ensure the performance of the engine. If
the pressure within the tank were to drop below 10 bar, this would generate a decreased output from
the engine. This means that the vaporisation process which generates pressure within the tank is
important to get enough fuel to the engine without adding any device to build pressure in any other
way. (Johansson, 2015a)
While gas, mainly as vapour is withdrawn from the tank, pressure drops and the content left in the
tank will be subject to some amount of re-refrigeration. This is due to thermal dynamic properties and
it will keep the LNG cool within the tank as long as fuel is consumed. (Kern, 2015)
The cold and pressurised LNG flows out of the tank and passes through a heat exchanger, number 49
in Figure 17. The heat exchanger uses the heat from the engine coolant to heat the gas and to vaporise
the LNG while liquid is used from the bottom of the tank. After the heat exchanger, a solenoid shut-
off valve is mounted to shut off the flow once the engine is turned off or if leaks are detected. When
the gas has passed through the solenoid, the gas is ready to continue through the LNG gas panel and
to the engine. (Chart, 2015)
The gas panel used in LNG configurations are by today, based on the same principles as it is for CNG
(Johansson, 2015a), which was described in section 4.2.1.
The most common dual tank solution for Scania holds about 320 kg of LNG (Johansson, 2015a).
4.2.3 Venting of Boil-off Boil-off within the tank is essential to get enough pressure to provide the engine with enough fuel.
During the consumption of fuel, the economiser ensures that the pressure within the tank does not
increase. While the truck is turned off, heat from the surrounding continues to leak into the LNG inside
the tank. The result is an increased pressure while the trucks are standing still. (Johansson, 2015a)
The tank has a primary relief valve connected, which acts as a safety mechanism set at the maximum
allowable working pressure of the tank. Its function is to vent out the BOG to the atmosphere if the
tank pressure exceeds the maximum allowable working pressure. The valve is connected to the top fill
line in the fuel tank and thereby offers protection against over pressurising the tank. (Chart, 2015)
Scania and several other truck manufacturers have their primary relief
valve set to open at 16 bar (Johansson, 2015a).
Connected to the tank is also a secondary relief valve. Its function is to
vent BOG to the atmosphere if the primary relief valve fails to operate,
the fuel line malfunctions or the tank gets damaged and the vacuum is
lost, generating large amount of boil-off which exceeds the capacity of
the primary relief valve. The secondary relief valve is a cryogenic relief
valve set at 1.5 times the maximum allowable working pressure of the
tank. (Chart, 2015)
For most truck manufacturers, the secondary relief valve open when the
pressure in the tank reaches 24 bar (Johansson, 2015a).
Figure 18 - A Scania LNG truck. The arrow points out the boil-off pipe. (Johansson, 2015a)

PRODUCT DESCRIPTION 04 JUNE 2015
PAGE | 27
During long enough standstill, the pressure within the tank
will increase and reach 16 bar (Johansson, 2015a). At this
point the primary relief valve will open and the BOG will be
vented out into the atmosphere (ibid). Figure 18 shows a
Scania LNG truck where the vertical pipe releases the BOG
behind the cab. Figure 19 shows a principle for the boil-off
emission on trucks today.
4.3 Environmental Aspects Using LNG One aspect of using trucks running on gas is the noise. Especially in bigger cities noise from traffic is
perceived as disturbing. Gas fuelled vehicles is more quiet than diesel and petrol fuelled vehicles.
Hence, gas fuelled vehicles can decrease the traffic noise and therefore enable night time deliveries in
bigger cities generating less traffic during the days. (Tunestål, et al., 2007; Johansson, 2015a)
Figure 20 shows the total amount of lifecycle
emissions for diesel, LNG-TER and LNG-SSL when
used in a diesel pilot engine. The darker grey in the
bottom of the stacks represents the well-to-tank
emissions, i.e. emissions from the fuels path from
extraction to the fuel tank of the vehicle, and the
lighter grey represents the tank-to-wheel emissions.
Table 8 describes the lifecycle emissions for diesel,
LNG-TER and LNG-SSL for diesel pilot engines as well.
The table shows more exact where in the fuels
lifecycle the difference in emissions occurs. LNG-TER
has 10 % less GHG emissions than diesel. By only
comparing the combustion in the engine, the difference is 14 %. LNG-SSL on the other hand, is
comparable with diesel when it comes to GHG emissions. The critical phase for LNG in GHG emissions
is well-to-tank. LNG has less carbon dioxide emissions than diesel, but has more methane and nitrous
oxide emissions. Since reduction of carbon dioxide is significantly larger than the increase of methane
and nitrogen oxide, the total global improvement at the tailpipe is -13 % CO2,eq while using natural gas
in diesel pilot engines. (Arteconi, et al., 2009)
Table 8 - The lifecycle emissions measured in kg CO2,eq/kmtruck. (Arteconi, et al., 2009)
Production Distribution Combustion Diesel pilot Total emission
Diesel 0.2003 0.0208 1.6353 - 1.8563 LNG-TER 0.1600 0.0879 1.4013 0.0150 1.6642 LNG-SSL 0.3887 0.0006 1.4013 0.0150 1.8055
Améen (2015) states that when LNG is burned in an Otto engine, where no diesel pilot is needed, the
reduction of carbon dioxide emissions is about 15-20 % compared to a regular diesel engine. This
figures is about equal to the combustion figures stated in Table 8 and figures from the Environmental
Product Declaration Calculator on the Scania CV AB website (2015a). The total amount of carbon
dioxide emissions for a diesel powered truck is 0.95 kg/km1 and 0.83 kg/km2 for a natural gas powered
truck (Scania CV AB, 2015a). If LBG is used, the reduction of carbon dioxide emissions is about 90 %
compared to diesel. (Améen, 2015).
1 Engine: DC9 113, 280 hp – Euro 6 2 Engine: OC09 101, 280 hp – Euro 6
Figure 19 - Principle for the boil-off emission on a truck.
Figure 20 -The total lifecycle emissions measured in kg CO2,eq/kmtruck. (Arteconi, et al., 2009)
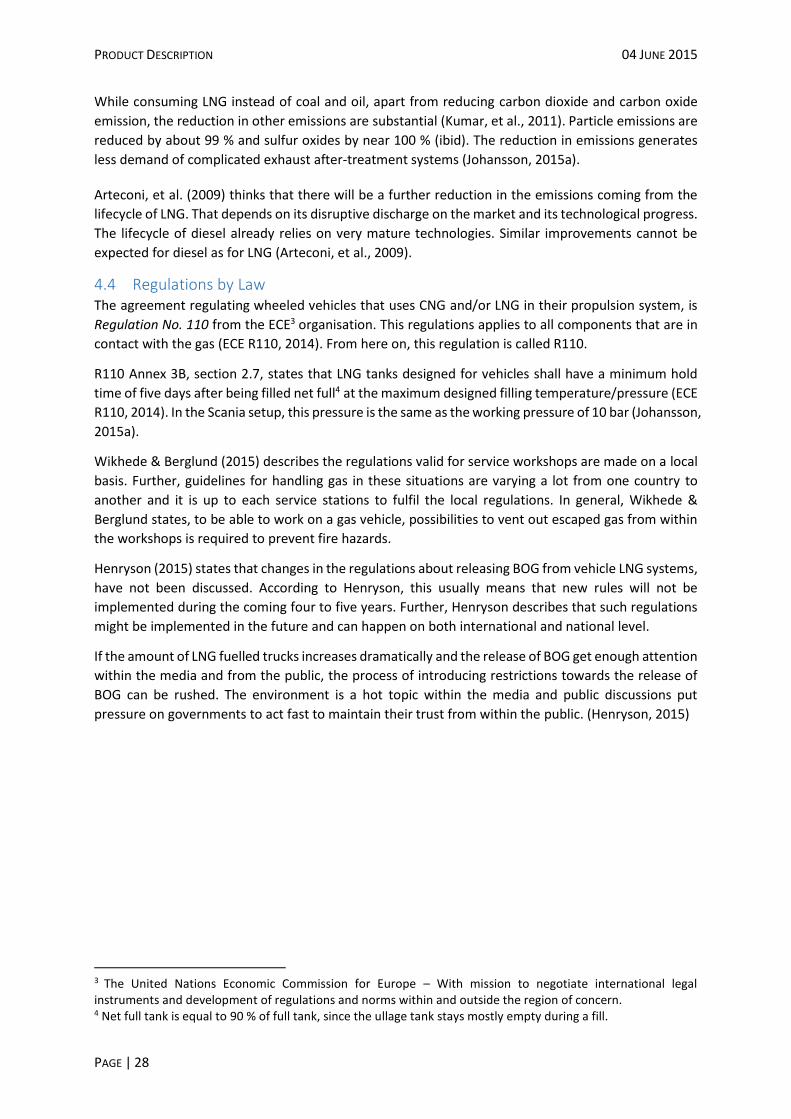
PRODUCT DESCRIPTION 04 JUNE 2015
PAGE | 28
While consuming LNG instead of coal and oil, apart from reducing carbon dioxide and carbon oxide
emission, the reduction in other emissions are substantial (Kumar, et al., 2011). Particle emissions are
reduced by about 99 % and sulfur oxides by near 100 % (ibid). The reduction in emissions generates
less demand of complicated exhaust after-treatment systems (Johansson, 2015a).
Arteconi, et al. (2009) thinks that there will be a further reduction in the emissions coming from the
lifecycle of LNG. That depends on its disruptive discharge on the market and its technological progress.
The lifecycle of diesel already relies on very mature technologies. Similar improvements cannot be
expected for diesel as for LNG (Arteconi, et al., 2009).
4.4 Regulations by Law The agreement regulating wheeled vehicles that uses CNG and/or LNG in their propulsion system, is
Regulation No. 110 from the ECE3 organisation. This regulations applies to all components that are in
contact with the gas (ECE R110, 2014). From here on, this regulation is called R110.
R110 Annex 3B, section 2.7, states that LNG tanks designed for vehicles shall have a minimum hold
time of five days after being filled net full4 at the maximum designed filling temperature/pressure (ECE
R110, 2014). In the Scania setup, this pressure is the same as the working pressure of 10 bar (Johansson,
2015a).
Wikhede & Berglund (2015) describes the regulations valid for service workshops are made on a local
basis. Further, guidelines for handling gas in these situations are varying a lot from one country to
another and it is up to each service stations to fulfil the local regulations. In general, Wikhede &
Berglund states, to be able to work on a gas vehicle, possibilities to vent out escaped gas from within
the workshops is required to prevent fire hazards.
Henryson (2015) states that changes in the regulations about releasing BOG from vehicle LNG systems,
have not been discussed. According to Henryson, this usually means that new rules will not be
implemented during the coming four to five years. Further, Henryson describes that such regulations
might be implemented in the future and can happen on both international and national level.
If the amount of LNG fuelled trucks increases dramatically and the release of BOG get enough attention
within the media and from the public, the process of introducing restrictions towards the release of
BOG can be rushed. The environment is a hot topic within the media and public discussions put
pressure on governments to act fast to maintain their trust from within the public. (Henryson, 2015)
3 The United Nations Economic Commission for Europe – With mission to negotiate international legal instruments and development of regulations and norms within and outside the region of concern. 4 Net full tank is equal to 90 % of full tank, since the ullage tank stays mostly empty during a fill.
PRODUCT DESCRIPTION 04 JUNE 2015
PAGE | 29
4.4.1 Shipping Trucks at Sea Hörnquist (2015) describes that it is not allowed to transport LNG trucks due to the risk of releasing
BOG in an enclosed cargo space on a ferry. Further, Hörnquist describes that if solutions approved by
the competent authorities would be implemented, guaranteeing that no BOG is released during the
enclosed shipment of the truck, this would allow these trucks to be transported on the ferry.
Transportstyrelsen consider the start of combustion engines in enclosed cargo spaces unsuitable. This
is due to the risk of fire from the heat generated and the contamination of the air from the emissions
within the exhaust. Passengers are not allowed to visit the cargo space during the trip. Trucks with a
refrigeration unit driven by a separate generator normally have to be transported on open deck, but
in a few cases it is okay to transport these enclosed as well. (Hörnquist, 2015)
Hörnquist (2015) describes that the possibility of running a burner to consume the flammable gases in
an enclosed cargo space has to be investigated. He further describes that if the process is well
controlled and the risks are eliminated, it might be possible to allow burners in these environments.
4.5 Fuel Prices As for now, CNG and LNG fuel prices are closely related and can be approximated to be equal to each
other (Milione, 2015).
An average of the fuel prices for within the European Union, where most figures are dated to
September 2014, is about 1.14 €/kg for CNG. The variations in price within this region are very big,
with a minimum in Latvia at about 0.54 €/kg and with a maximum of 1.97 €/kg in Sweden. (NGVA, 2014)
With the system described in section 4.2.2, the total fuel cost of full tanks is about 365 €.

PRODUCT DESCRIPTION 04 JUNE 2015
PAGE | 30
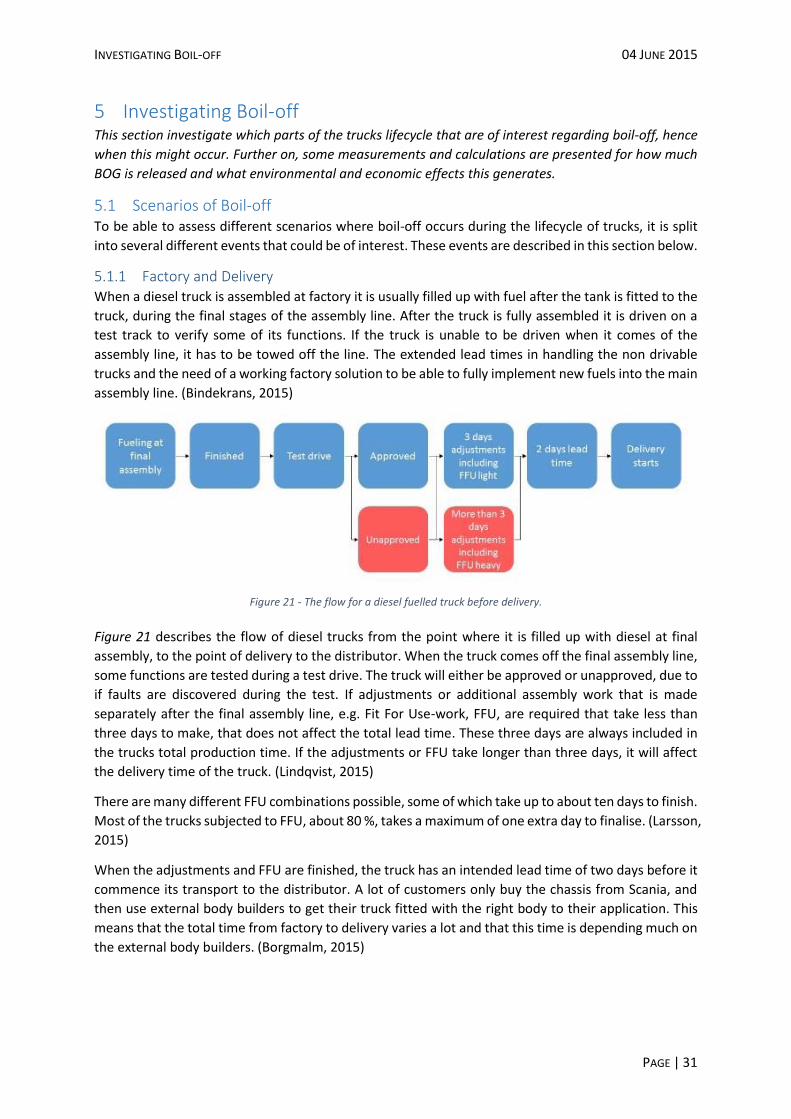
INVESTIGATING BOIL-OFF 04 JUNE 2015
PAGE | 31
5 Investigating Boil-off This section investigate which parts of the trucks lifecycle that are of interest regarding boil-off, hence
when this might occur. Further on, some measurements and calculations are presented for how much
BOG is released and what environmental and economic effects this generates.
5.1 Scenarios of Boil-off To be able to assess different scenarios where boil-off occurs during the lifecycle of trucks, it is split
into several different events that could be of interest. These events are described in this section below.
5.1.1 Factory and Delivery When a diesel truck is assembled at factory it is usually filled up with fuel after the tank is fitted to the
truck, during the final stages of the assembly line. After the truck is fully assembled it is driven on a
test track to verify some of its functions. If the truck is unable to be driven when it comes of the
assembly line, it has to be towed off the line. The extended lead times in handling the non drivable
trucks and the need of a working factory solution to be able to fully implement new fuels into the main
assembly line. (Bindekrans, 2015)
Figure 21 - The flow for a diesel fuelled truck before delivery.
Figure 21 describes the flow of diesel trucks from the point where it is filled up with diesel at final
assembly, to the point of delivery to the distributor. When the truck comes off the final assembly line,
some functions are tested during a test drive. The truck will either be approved or unapproved, due to
if faults are discovered during the test. If adjustments or additional assembly work that is made
separately after the final assembly line, e.g. Fit For Use-work, FFU, are required that take less than
three days to make, that does not affect the total lead time. These three days are always included in
the trucks total production time. If the adjustments or FFU take longer than three days, it will affect
the delivery time of the truck. (Lindqvist, 2015)
There are many different FFU combinations possible, some of which take up to about ten days to finish.
Most of the trucks subjected to FFU, about 80 %, takes a maximum of one extra day to finalise. (Larsson,
2015)
When the adjustments and FFU are finished, the truck has an intended lead time of two days before it
commence its transport to the distributor. A lot of customers only buy the chassis from Scania, and
then use external body builders to get their truck fitted with the right body to their application. This
means that the total time from factory to delivery varies a lot and that this time is depending much on
the external body builders. (Borgmalm, 2015)
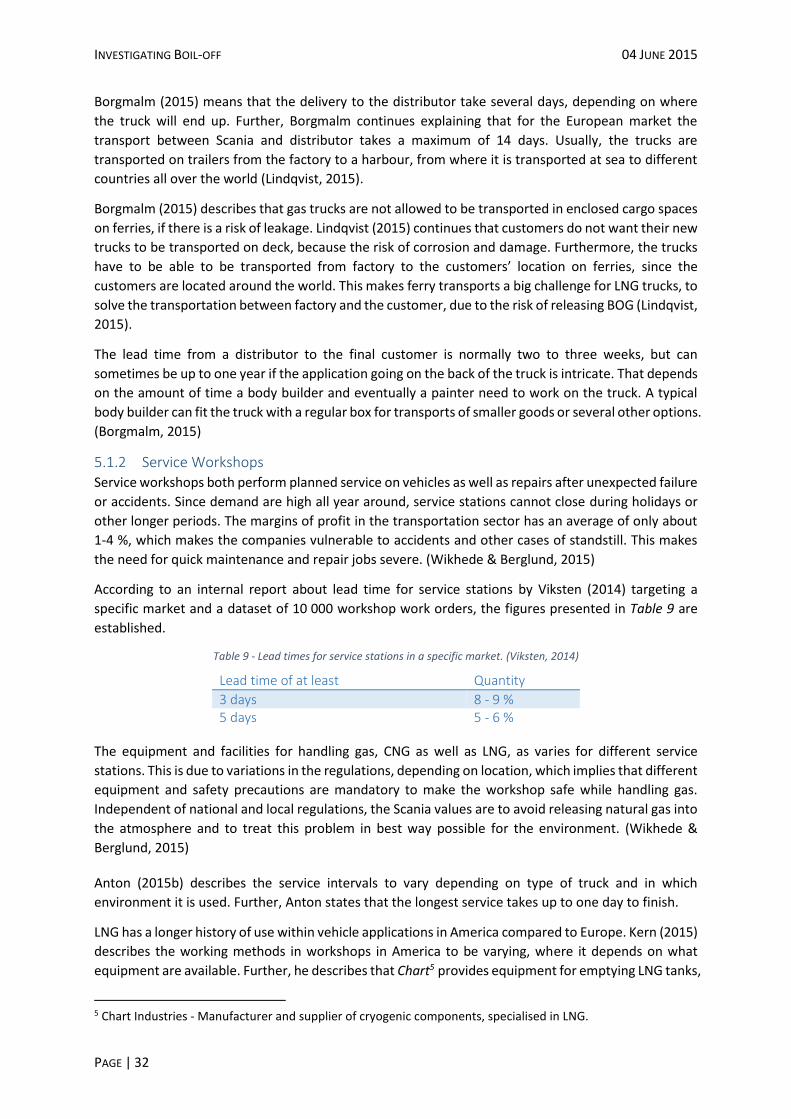
INVESTIGATING BOIL-OFF 04 JUNE 2015
PAGE | 32
Borgmalm (2015) means that the delivery to the distributor take several days, depending on where
the truck will end up. Further, Borgmalm continues explaining that for the European market the
transport between Scania and distributor takes a maximum of 14 days. Usually, the trucks are
transported on trailers from the factory to a harbour, from where it is transported at sea to different
countries all over the world (Lindqvist, 2015).
Borgmalm (2015) describes that gas trucks are not allowed to be transported in enclosed cargo spaces
on ferries, if there is a risk of leakage. Lindqvist (2015) continues that customers do not want their new
trucks to be transported on deck, because the risk of corrosion and damage. Furthermore, the trucks
have to be able to be transported from factory to the customers’ location on ferries, since the
customers are located around the world. This makes ferry transports a big challenge for LNG trucks, to
solve the transportation between factory and the customer, due to the risk of releasing BOG (Lindqvist,
2015).
The lead time from a distributor to the final customer is normally two to three weeks, but can
sometimes be up to one year if the application going on the back of the truck is intricate. That depends
on the amount of time a body builder and eventually a painter need to work on the truck. A typical
body builder can fit the truck with a regular box for transports of smaller goods or several other options.
(Borgmalm, 2015)
5.1.2 Service Workshops Service workshops both perform planned service on vehicles as well as repairs after unexpected failure
or accidents. Since demand are high all year around, service stations cannot close during holidays or
other longer periods. The margins of profit in the transportation sector has an average of only about
1-4 %, which makes the companies vulnerable to accidents and other cases of standstill. This makes
the need for quick maintenance and repair jobs severe. (Wikhede & Berglund, 2015)
According to an internal report about lead time for service stations by Viksten (2014) targeting a
specific market and a dataset of 10 000 workshop work orders, the figures presented in Table 9 are
established.
Table 9 - Lead times for service stations in a specific market. (Viksten, 2014)
Lead time of at least Quantity
3 days 8 - 9 % 5 days 5 - 6 %
The equipment and facilities for handling gas, CNG as well as LNG, as varies for different service
stations. This is due to variations in the regulations, depending on location, which implies that different
equipment and safety precautions are mandatory to make the workshop safe while handling gas.
Independent of national and local regulations, the Scania values are to avoid releasing natural gas into
the atmosphere and to treat this problem in best way possible for the environment. (Wikhede &
Berglund, 2015)
Anton (2015b) describes the service intervals to vary depending on type of truck and in which
environment it is used. Further, Anton states that the longest service takes up to one day to finish.
LNG has a longer history of use within vehicle applications in America compared to Europe. Kern (2015)
describes the working methods in workshops in America to be varying, where it depends on what
equipment are available. Further, he describes that Chart5 provides equipment for emptying LNG tanks,
5 Chart Industries - Manufacturer and supplier of cryogenic components, specialised in LNG.
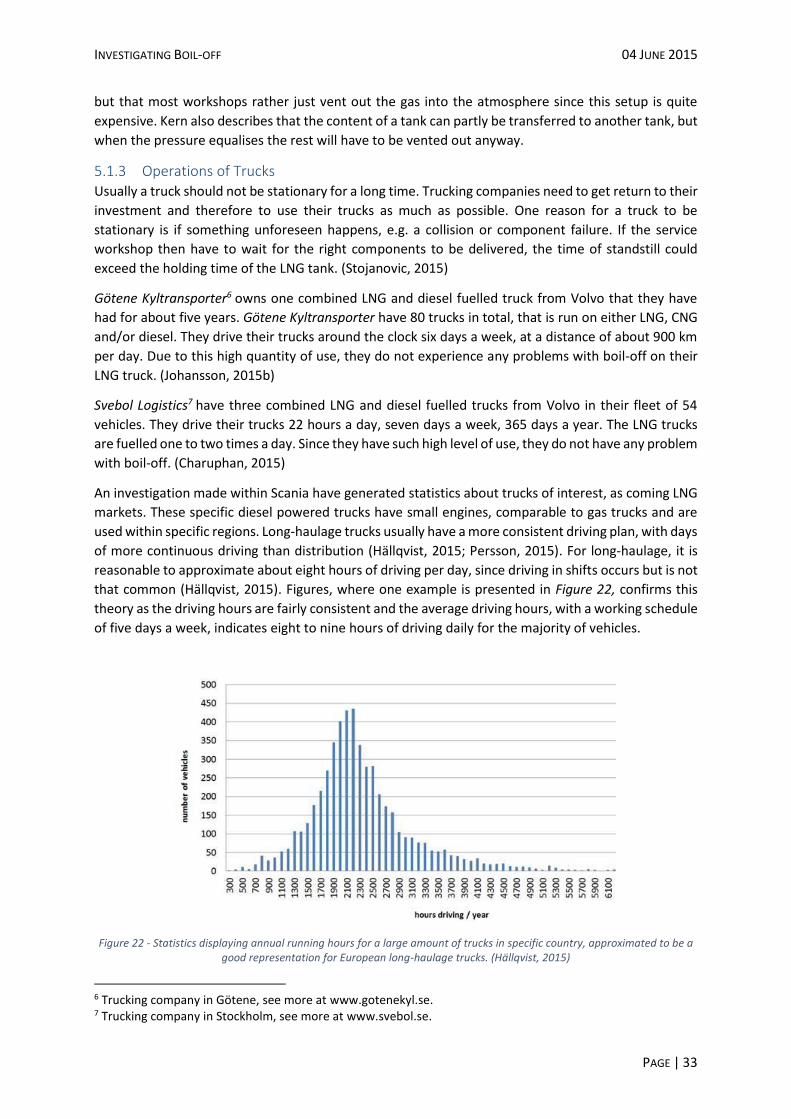
INVESTIGATING BOIL-OFF 04 JUNE 2015
PAGE | 33
but that most workshops rather just vent out the gas into the atmosphere since this setup is quite
expensive. Kern also describes that the content of a tank can partly be transferred to another tank, but
when the pressure equalises the rest will have to be vented out anyway.
5.1.3 Operations of Trucks Usually a truck should not be stationary for a long time. Trucking companies need to get return to their
investment and therefore to use their trucks as much as possible. One reason for a truck to be
stationary is if something unforeseen happens, e.g. a collision or component failure. If the service
workshop then have to wait for the right components to be delivered, the time of standstill could
exceed the holding time of the LNG tank. (Stojanovic, 2015)
Götene Kyltransporter6 owns one combined LNG and diesel fuelled truck from Volvo that they have
had for about five years. Götene Kyltransporter have 80 trucks in total, that is run on either LNG, CNG
and/or diesel. They drive their trucks around the clock six days a week, at a distance of about 900 km
per day. Due to this high quantity of use, they do not experience any problems with boil-off on their
LNG truck. (Johansson, 2015b)
Svebol Logistics7 have three combined LNG and diesel fuelled trucks from Volvo in their fleet of 54
vehicles. They drive their trucks 22 hours a day, seven days a week, 365 days a year. The LNG trucks
are fuelled one to two times a day. Since they have such high level of use, they do not have any problem
with boil-off. (Charuphan, 2015)
An investigation made within Scania have generated statistics about trucks of interest, as coming LNG
markets. These specific diesel powered trucks have small engines, comparable to gas trucks and are
used within specific regions. Long-haulage trucks usually have a more consistent driving plan, with days
of more continuous driving than distribution (Hällqvist, 2015; Persson, 2015). For long-haulage, it is
reasonable to approximate about eight hours of driving per day, since driving in shifts occurs but is not
that common (Hällqvist, 2015). Figures, where one example is presented in Figure 22, confirms this
theory as the driving hours are fairly consistent and the average driving hours, with a working schedule
of five days a week, indicates eight to nine hours of driving daily for the majority of vehicles.
Figure 22 - Statistics displaying annual running hours for a large amount of trucks in specific country, approximated to be a good representation for European long-haulage trucks. (Hällqvist, 2015)
6 Trucking company in Götene, see more at www.gotenekyl.se. 7 Trucking company in Stockholm, see more at www.svebol.se.

INVESTIGATING BOIL-OFF 04 JUNE 2015
PAGE | 34
For distribution, the driving schedule is different from long-haulage. This usually include more stops
for loading and unloading of goods, which decreases the number of running hours per day (Persson,
2015; Tilly, 2015). Figures from the investigation states the average amount of driving hours to about
six hours of driving, calculated based on an approximated schedule of five days per week. It is common
to have four to six days of work each week, but five is still the most common working plan (Persson,
2015). The study shows larger variations in driving hours for the distribution segment than the long-
haulage segment. However, within distribution it is more likely to have variations due to the amount
of driving hours per day rather than fewer days of driving all together (Persson, 2015; Tilly, 2015). Also,
the amount of running hours vary a lot depending on what application being used and within what
company.
Even at the lowest amount of average driving hours recorded for long-haulage in this study, the
amount of extra days of standstill would only differ about three days from average per month. This
could, in combination with a regular weekend of standstill, generate venting of BOG. Though, this does
not seem to be a fully consistent pattern, since the same deviations are not recurrent for all summer
periods. It is reasonable to have variations during periods of holidays, but usually, a lot of transports
have to continue since the demand of deliveries in some industrial sectors is more or less consistent
(Tilly, 2015). Many transportation companies employ temporary personnel during vacations to keep
the business running (ibid).The amount of vacations also vary a lot depending on the market, country,
etcetera (Persson, 2015). Figures show large variations in how companies handle vacations, where
some have much less running hours and others are not affected. These strategies might be a factor
while choosing to buy LNG trucks or not, effecting how much boil-off might be generated and how this
could be avoided.
The fact that LNG trucks are more expensive to buy than diesel trucks and that these trucks therefore
need to run more to get return to the investment, indicates the importance for transportation
companies to run these trucks as much as possible (Persson, 2015). Transportation companies with
few running hours due to specific applications or low amount of requests, will not be customers of
interest concerning LNG (Persson, 2015). This is an important aspect, that LNG trucks will be bought
by specific customers that run their trucks a lot and that boil-off is a feature that will be known to
customers. Vacations and other planned standstill can be scheduled so that LNG trucks are effected as
little as possible and so that the amount of fuel that could generate boil-off is as low as possible. It is
important to keep informing customers about boil-off though, since this might be less well known
when LNG gets more mainstream (Persson, 2015).
Companies buying LNG trucks today usually have long term contracts. Boil-off is a known feature these
companies and it is important not be stationary for long periods due to lack of delivering orders. This
is an important aspect from a selling point, to keep selling LNG trucks to customers that uses their
trucks in high enough rate for boil-off not to occur. (Milione, 2015; Stojanovic, 2015)
In the American market, where LNG is much more used than in Europe, the boil-off is not seen as a big
problem from the users’ perspective. The trucks are meant to be used on a regular basis, hence boil-
off usually do not occur. (Kern, 2015)
5.1.4 Transport of Vehicle on Ferry In section 5.1.1 it is mentioned that new trucks are partly transported from the factory to the
distributor by ferry most of the times. Transports by ferry are also occurring during the regular use of
the truck. Section 4.4.1 describes the restrictions in transporting LNG trucks with risk of releasing BOG
in an enclosed cargo space on a ferry. This is therefore a definite scenario of interest, as well as other
similar situations where risk of boil-off within an enclosed space could generate an explosive
environment.

INVESTIGATING BOIL-OFF 04 JUNE 2015
PAGE | 35
5.2 Amount of Boil-off A simple test performed by Scania showed that an average of about 2-4 % of the gas within the tank is
released per day, once the release of BOG starts after approximately five days.
With the tank volume of 320 kg, as described in section 4.2.2, 3 % would correspond to about 10 kg of
released BOG every day, once the release of BOG starts. With the average wobbe index measured at
the AGA LNG terminal in Nynäshamn, presented in section 3.1.2, these 10 kg of BOG corresponds to
about 160 kWh/day. This means that over time, the released output effect is about 6-7 kW. There is
several approximations made to this calculation, for instance a more or less constant boil-off rate
independent of the amount of LNG in the tanks.
5.3 Environmental Effects of Boil-off The effect on global warming and how far a truck could run with emissions corresponding to one day,
10 kg, of released BOG is presented in Table 10. Also presented in Table 10 are figures for the release
of a full tank system of 320 kg.
Table 10 - Describes how far a truck could run for the emissions to correspond to one day of released BOG, as well as for a full tank system of 320 kg.
Corresponding amount of CO2,eq per day 250 kg CO2,eq / day Corresponding distance to drive for a diesel truck to
achieve same amount of CO2,eq emissions 263 km
Corresponding distance to drive for a gas truck to achieve same amount of CO2,eq emissions
301 km
Corresponding amount of CO2,eq, full tank (320 kg) 8000 kg CO2,eq Corresponding distance to drive for a diesel truck to
achieve same amount of CO2,eq emissions 8421 km
Corresponding distance to drive for a gas truck to achieve same amount of CO2,eq emissions
9639 km
BOG was burned, corresponding amount of CO2
per day 10 kg CO2 / day
Corresponding distance to drive for a truck to achieve same amount of CO2,eq emissions
11 – 12 km
This figures show that for the same amount of CO2,eq as released during one day of releasing BOG, from
one truck, this could instead drive about 260-300 km with the same amount of carbon dioxide released.
If this BOG were burned instead, this would correspond to about 25 times less, hence 11-12 km. This
show the severe impact of releasing BOG into the atmosphere, compared to flaring it and releasing
the combustion emissions. It also points out how crucial it is not to release large amounts, exemplified
by the release of a full tank system on a truck. This would correspond to about 8400-9600 km of driving,
which resemble approximately several days regular operations.

INVESTIGATING BOIL-OFF 04 JUNE 2015
PAGE | 36
5.4 Economic Aspects With the amount of released gas corresponding to about 10 kg/day, as presented in section 4.2.3, this
equals to a loss of fuel of about 11 € daily.
5.4.1 Pay-off Time As mentioned in section 4.5, the latest accessible average price for LNG within Europe is 1.14 €/kg. A
Scania LNG truck8 consumes 0.32 kg/km (Scania CV AB, 2015a). This means that the fuel for an LNG
truck costs about 0.36 €/km.
This could be comparable to a diesel truck, where the average price in the European Union is 1.38 €/l
(NGVA, 2014). A Scania diesel truck9 consumes about 0.35 l/km (Scania CV AB, 2015a). This entails that
fuel for diesel trucks costs 0.48 €/km.
The purchasing price for a LNG truck is in general more expensive than a diesel truck. The difference
in the purchasing price usually pays-off, since the fuel LNG is cheaper than the fuel diesel.
A increased purchasing price for a LNG truck, where a solution for handling of BOG are included, means
that the pay-off time for buying a LNG truck versus a diesel truck gets longer. The extra pay-off time
are presented in distance in Figure 23. On the x-axis in the same figure, some examples on the
purchasing price are presented.
Figure 23 - The pay-off distance needed to give return to the additional increase in purchasing price, generated by equipment for handling BOG
8 Engine: OC09 101, 280 hp – Euro 6 9 Engine: DC9 113, 280 hp – Euro 6
050
100150200250300350400450500
10
0
30
0
50
0
70
0
90
0
11
00
13
00
15
00
17
00
19
00
21
00
23
00
25
00
27
00
29
00
31
00
33
00
35
00
37
00
39
00
DIS
TAN
CE
[KM
]
PURCHASING PRICE [€]
PAY-OFF DISTANCE

DEMAND SPECIFICATION 04 JUNE 2015
PAGE | 37
6 Demand Specifications This section presents the result from the demand specification phase. This includes the identifying of
customers and stakeholders, the HoQ to state the customer demands and generate product
specifications of interest, and finally the list of engineering specifications.
6.1 Customers The customers are the ones that uses the truck during its lifetime, and therefore risks to release BOG.
Factory and delivery reflect the part of the trucks life time from the point where it is fuelled at the final
assembly line to the point where it is delivered to the final customer. Here, the effect of releasing gas
during these stages are taken into account. This excludes the aspects of ferry transports which is
treated as a customer of its own, but fully includes the aspects of time from factory to final delivery.
Service workshop reflect when a truck is in need for repair or service and how release of gas will effect
this stage. This reflect handling and repairing the equipment as well as the significance and aspects of
releasing BOG.
The regular use during operations of the truck is reflected within the Operations category, excluding
the sections treated above and below.
Ferry transports is especially important since regulations may apply and restrictions come into play
when LNG vehicles are to be transported on board a ferry, due to risk involved in releasing flammable
gases in enclosed spaces. This reflects both ferry transports during delivery from factory, as well as
ferry transports during the regular use of the trucks.
6.1.1 Stakeholders Interest in Paying for Solutions Depending on solution the price tag varies as well as the output from the solution. Each solution are
to be paid, but depending on which customer scenario, described above, the will of paying and what
is given in return varies.
During Factory and delivery, Scania has the interest of fulfilling regulations as well as not losing money
in fuel going to waste. This might also be a question about the image of the company.
During a visit to the Service workshop it is mainly Scania that want to fulfil local and national regulations,
but this is also a service that is financed by the trucking companies. Here, during visits to any Scania
workshop, Scania has the interest in maintaining and improving its image towards the public that is
becoming more and more focused on the environment.
Solutions aiming to avoid BOG during the regular use of the truck are of interest for both Scania, the
transportation companies, the company requesting the transport and the community. Regulations
need to be fulfilled, as by which the community puts pressure on the companies to improve regarding
environmental issues. The transportation company does not want to lose any fuel, nor change how
they use their truck due to properties of the fuel. In addition, both the transportation companies and
mainly the company requesting the transport have their image to focus on, due to the request from
the community in more environmentally friendly transports.
Ferry transports and during similar situations where releasing any gas is to be avoided, Scania is
interested in the possibility to ship their trucks during delivery from factory. Transportation companies
as well as the company ordering the transport also have the interest in the possibility to use ferries, to
avoid additional time and costs during the shipments and to be compatible to alternative
transportation methods.

DEMAND SPECIFICATION 04 JUNE 2015
PAGE | 38
In the end, it is always the end-customer that pays for the transport of goods. The fact that few seem
to have the will of paying for a solution handling BOG, indicates that development should aim for a
solution that fulfils future regulations in the cheapest way as possible. Therefore, the customer
scenarios of operations and ferry transports are seen as more important than factory and delivery and
service workshops.
6.2 House of Quality The customer needs and product specifications are stated within the project, with respect to the
information found during the research and investigation presented in chapter 4 and 5. The importance
of each customer need and relation between customer needs and each specification are also stated
within the project.
The House of Quality, HoQ, made in this project is presented in Appendix I – House of Quality.
This HoQ shows that the two most important specifications for most actors during the use phase of
the truck are Amount of released BOG and Taking care of a certain share of the gas from the tank.
6.3 List of Engineering Specifications The HoQ has resulted in some engineering specifications, each with an ideal and a limit value,
presented in Table 11.
Table 11 – List of Engineering specifications.
Engineering specification Unit Importance Ideal value Limit value
Total equipment volume m3 2 0 0.05
Weight kg 1 0 40
Amount of manual operations pcs 2 0 5
Amount of materials pcs 2 0 20
Amount of released BOG kg 5 0 0
Efficiency (electricity & heat) % 3 100 50
Taking care of a certain share of the tank
% 5 100 100
Life span km 4 >1.2·107 >0.6·107
Amount of released combustion emissions
kg 4 0 Euro6 regulations10
Amount of components pcs 5 0 100
Maximum number of steps to reach the deepest located component
pcs 1 0 25
Amount of release valves/safety related devices
pcs 3 2 2
Selling price to customer € 4 500 3000
Amount of fasteners pcs 1 0 20
Amount of precious material pcs 3 0 1
10 Euro 6 regulations is the current European emission standard
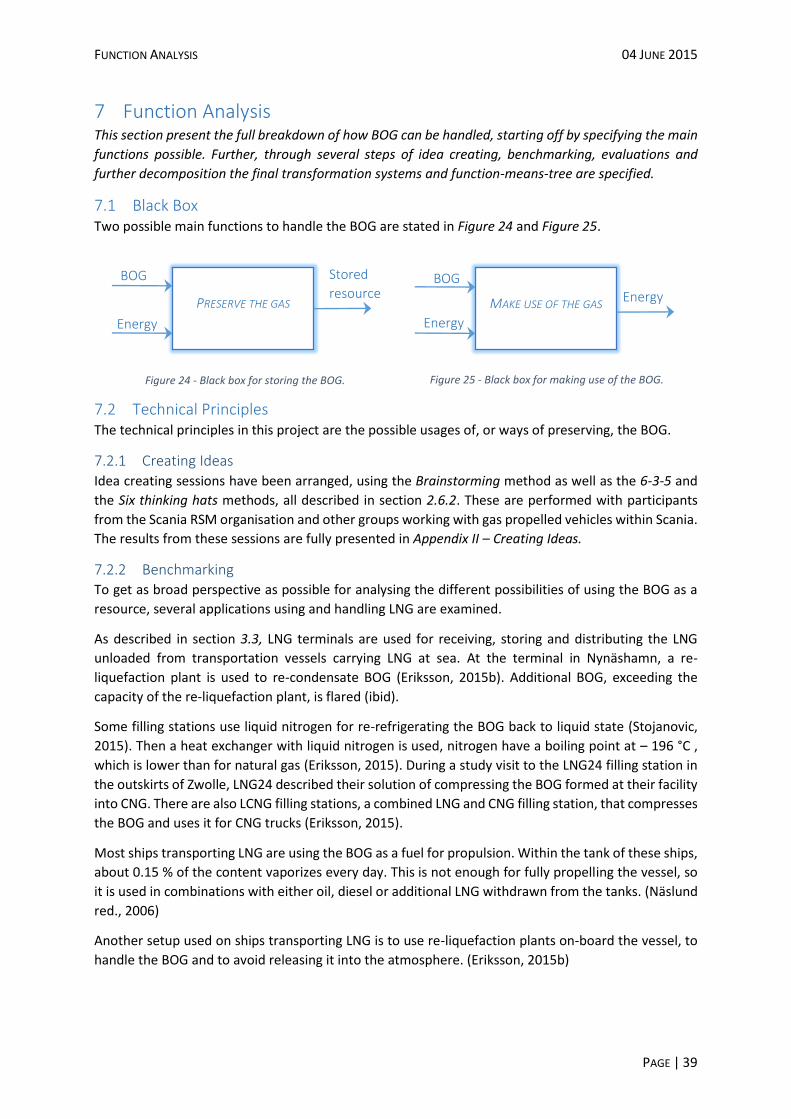
FUNCTION ANALYSIS 04 JUNE 2015
PAGE | 39
7 Function Analysis This section present the full breakdown of how BOG can be handled, starting off by specifying the main
functions possible. Further, through several steps of idea creating, benchmarking, evaluations and
further decomposition the final transformation systems and function-means-tree are specified.
7.1 Black Box Two possible main functions to handle the BOG are stated in Figure 24 and Figure 25.
Figure 24 - Black box for storing the BOG.
Figure 25 - Black box for making use of the BOG.
7.2 Technical Principles The technical principles in this project are the possible usages of, or ways of preserving, the BOG.
7.2.1 Creating Ideas Idea creating sessions have been arranged, using the Brainstorming method as well as the 6-3-5 and
the Six thinking hats methods, all described in section 2.6.2. These are performed with participants
from the Scania RSM organisation and other groups working with gas propelled vehicles within Scania.
The results from these sessions are fully presented in Appendix II – Creating Ideas.
7.2.2 Benchmarking To get as broad perspective as possible for analysing the different possibilities of using the BOG as a
resource, several applications using and handling LNG are examined.
As described in section 3.3, LNG terminals are used for receiving, storing and distributing the LNG
unloaded from transportation vessels carrying LNG at sea. At the terminal in Nynäshamn, a re-
liquefaction plant is used to re-condensate BOG (Eriksson, 2015b). Additional BOG, exceeding the
capacity of the re-liquefaction plant, is flared (ibid).
Some filling stations use liquid nitrogen for re-refrigerating the BOG back to liquid state (Stojanovic,
2015). Then a heat exchanger with liquid nitrogen is used, nitrogen have a boiling point at – 196 °C ,
which is lower than for natural gas (Eriksson, 2015). During a study visit to the LNG24 filling station in
the outskirts of Zwolle, LNG24 described their solution of compressing the BOG formed at their facility
into CNG. There are also LCNG filling stations, a combined LNG and CNG filling station, that compresses
the BOG and uses it for CNG trucks (Eriksson, 2015).
Most ships transporting LNG are using the BOG as a fuel for propulsion. Within the tank of these ships,
about 0.15 % of the content vaporizes every day. This is not enough for fully propelling the vessel, so
it is used in combinations with either oil, diesel or additional LNG withdrawn from the tanks. (Näslund
red., 2006)
Another setup used on ships transporting LNG is to use re-liquefaction plants on-board the vessel, to
handle the BOG and to avoid releasing it into the atmosphere. (Eriksson, 2015b)
PRESERVE THE GAS
Energy
Stored
resource BOG
MAKE USE OF THE GAS
Energy
Energy
BOG
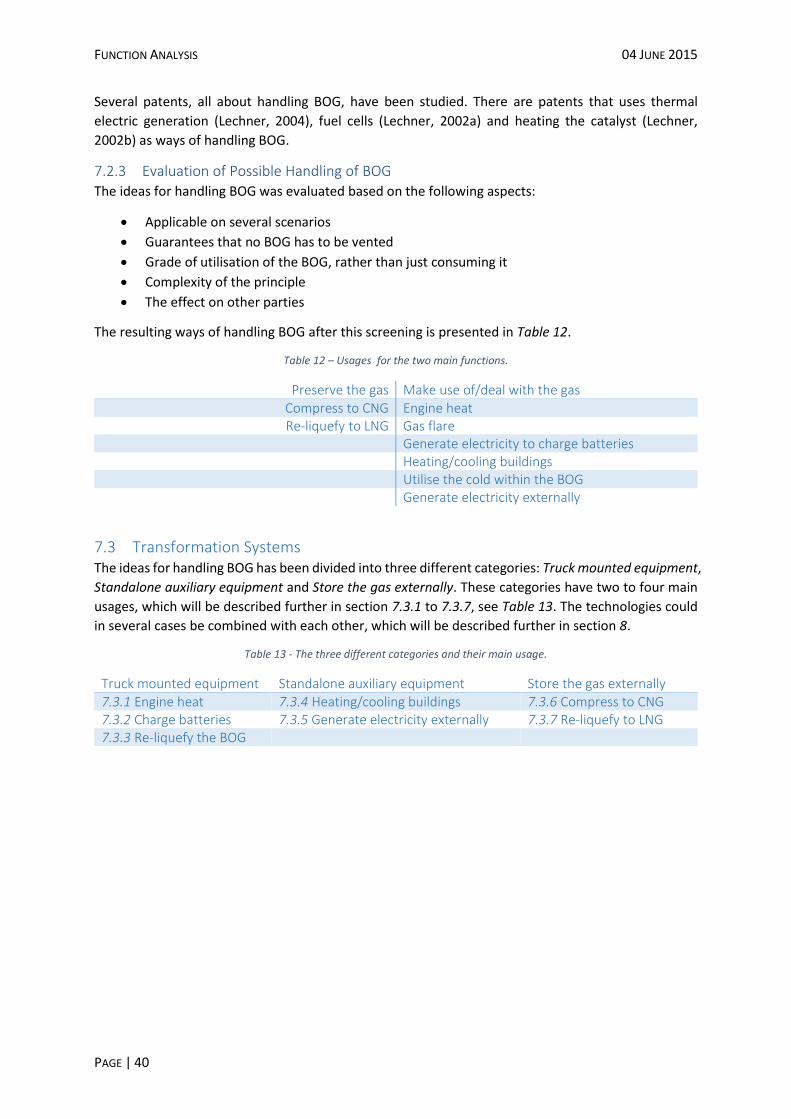
FUNCTION ANALYSIS 04 JUNE 2015
PAGE | 40
Several patents, all about handling BOG, have been studied. There are patents that uses thermal
electric generation (Lechner, 2004), fuel cells (Lechner, 2002a) and heating the catalyst (Lechner,
2002b) as ways of handling BOG.
7.2.3 Evaluation of Possible Handling of BOG The ideas for handling BOG was evaluated based on the following aspects:
Applicable on several scenarios
Guarantees that no BOG has to be vented
Grade of utilisation of the BOG, rather than just consuming it
Complexity of the principle
The effect on other parties
The resulting ways of handling BOG after this screening is presented in Table 12.
Table 12 – Usages for the two main functions.
Preserve the gas Make use of/deal with the gas Compress to CNG Engine heat Re-liquefy to LNG Gas flare
Generate electricity to charge batteries Heating/cooling buildings Utilise the cold within the BOG Generate electricity externally
7.3 Transformation Systems The ideas for handling BOG has been divided into three different categories: Truck mounted equipment,
Standalone auxiliary equipment and Store the gas externally. These categories have two to four main
usages, which will be described further in section 7.3.1 to 7.3.7, see Table 13. The technologies could
in several cases be combined with each other, which will be described further in section 8.
Table 13 - The three different categories and their main usage.
Truck mounted equipment Standalone auxiliary equipment Store the gas externally 7.3.1 Engine heat 7.3.4 Heating/cooling buildings 7.3.6 Compress to CNG 7.3.2 Charge batteries 7.3.5 Generate electricity externally 7.3.7 Re-liquefy to LNG 7.3.3 Re-liquefy the BOG
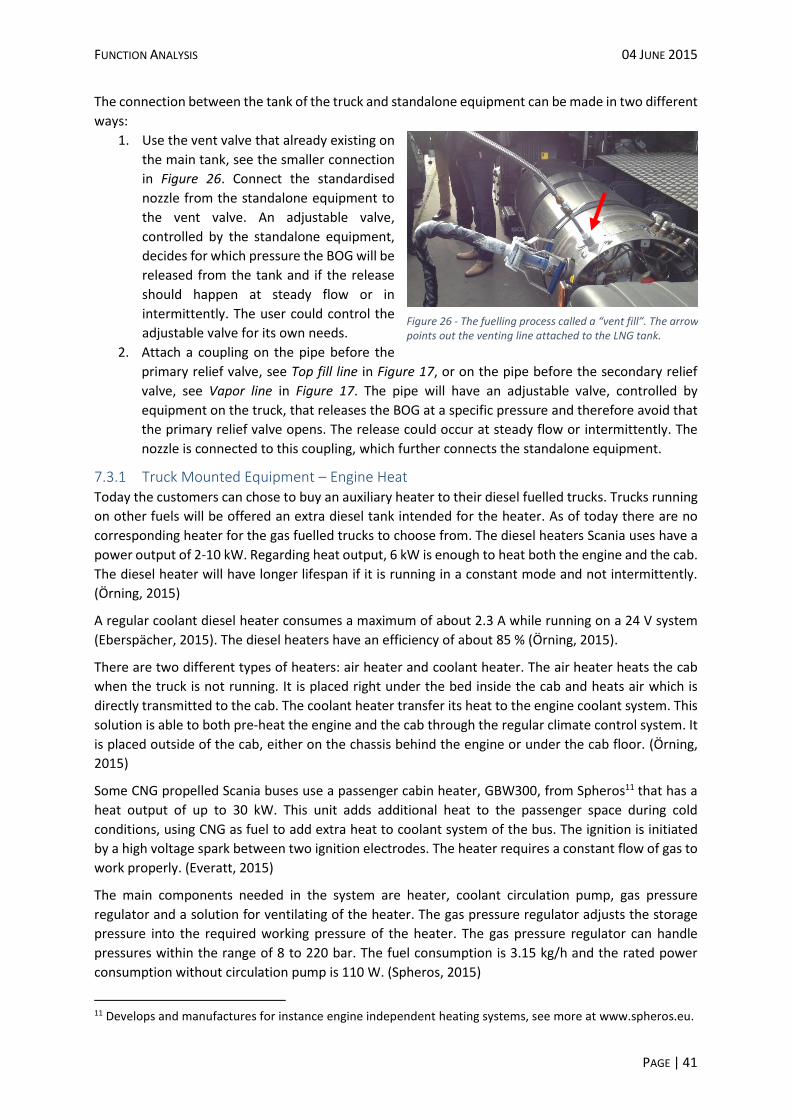
FUNCTION ANALYSIS 04 JUNE 2015
PAGE | 41
The connection between the tank of the truck and standalone equipment can be made in two different
ways:
1. Use the vent valve that already existing on
the main tank, see the smaller connection
in Figure 26. Connect the standardised
nozzle from the standalone equipment to
the vent valve. An adjustable valve,
controlled by the standalone equipment,
decides for which pressure the BOG will be
released from the tank and if the release
should happen at steady flow or in
intermittently. The user could control the
adjustable valve for its own needs.
2. Attach a coupling on the pipe before the
primary relief valve, see Top fill line in Figure 17, or on the pipe before the secondary relief
valve, see Vapor line in Figure 17. The pipe will have an adjustable valve, controlled by
equipment on the truck, that releases the BOG at a specific pressure and therefore avoid that
the primary relief valve opens. The release could occur at steady flow or intermittently. The
nozzle is connected to this coupling, which further connects the standalone equipment.
7.3.1 Truck Mounted Equipment – Engine Heat Today the customers can chose to buy an auxiliary heater to their diesel fuelled trucks. Trucks running
on other fuels will be offered an extra diesel tank intended for the heater. As of today there are no
corresponding heater for the gas fuelled trucks to choose from. The diesel heaters Scania uses have a
power output of 2-10 kW. Regarding heat output, 6 kW is enough to heat both the engine and the cab.
The diesel heater will have longer lifespan if it is running in a constant mode and not intermittently.
(Örning, 2015)
A regular coolant diesel heater consumes a maximum of about 2.3 A while running on a 24 V system
(Eberspächer, 2015). The diesel heaters have an efficiency of about 85 % (Örning, 2015).
There are two different types of heaters: air heater and coolant heater. The air heater heats the cab
when the truck is not running. It is placed right under the bed inside the cab and heats air which is
directly transmitted to the cab. The coolant heater transfer its heat to the engine coolant system. This
solution is able to both pre-heat the engine and the cab through the regular climate control system. It
is placed outside of the cab, either on the chassis behind the engine or under the cab floor. (Örning,
2015)
Some CNG propelled Scania buses use a passenger cabin heater, GBW300, from Spheros11 that has a
heat output of up to 30 kW. This unit adds additional heat to the passenger space during cold
conditions, using CNG as fuel to add extra heat to coolant system of the bus. The ignition is initiated
by a high voltage spark between two ignition electrodes. The heater requires a constant flow of gas to
work properly. (Everatt, 2015)
The main components needed in the system are heater, coolant circulation pump, gas pressure
regulator and a solution for ventilating of the heater. The gas pressure regulator adjusts the storage
pressure into the required working pressure of the heater. The gas pressure regulator can handle
pressures within the range of 8 to 220 bar. The fuel consumption is 3.15 kg/h and the rated power
consumption without circulation pump is 110 W. (Spheros, 2015)
11 Develops and manufactures for instance engine independent heating systems, see more at www.spheros.eu.
Figure 26 - The fuelling process called a “vent fill”. The arrow points out the venting line attached to the LNG tank.
FUNCTION ANALYSIS 04 JUNE 2015
PAGE | 42
Figure 27 - The transformation system for engine heat.
Figure 27 shows the transformation system for converting the BOG into engine heat. The flow starts
when the constant gas flow and the regulation of the flow begins. After this, the energy within the
BOG is utilised as heat and transmitted to the engine by the coolant system.
7.3.2 Truck Mounted Equipment – Charge Batteries There are several ways of utilising the gas and turning it into electric power to charge the batteries on
the truck. Scania trucks have a 24 V electrical system and since there is lot of components consuming
electricity on the truck, these are usually a demand of re-charging these batteries. This would be a
good option, both in increasing the lifespan of the batteries and also since the batteries are an energy
storage possibility already fitted to the trucks. This would generate less of a demand of charging the
batteries while driving, which leads to lower fuel consumption. Generally, the generator is responsible
for about 1 % of the fuel consumption of the truck (Dellrud, 2015). There are at least four different
ways of producing electricity from the BOG, which are:
Thermal electricity generation
Fuel cell
Steam (Rankine) cycle
Combustion engine connected to a generator
Thermal electricity generation, TEG, is a technology under evaluation for vehicle applications. The
technology is based on the knowledge that a conductive material exposed to an unevenly distributed
heat will form an internal voltage difference. No moving parts are needed. This technology has been
further developed, now using a number of semiconductors which have one side subjected to heat and
the other cooled. The goal is to have the temperature difference, ΔT, as high as possible to get as high
efficiency and/or power output as possible. This means that the heat transfer through the Thermo
Electric, TE, material is essential as well as the temperatures of the two medias. The primary target for
the vehicle industry is to utilise the heat from the exhaust, to generate electricity for on-board needs
and to be used for propulsion (hybrids), which will decrease the fuel consumption. The TE-elements
and the heat exchangers, usually attached to the exhaust system of the vehicle, are rather heavy and
the efficiency of the transformation is today low. New more efficient TE-materials are being developed
at laboratories, but are not yet available commercially. (Dellrud, 2015)
If a purpose built generator was used and heat could be generated directly from a flare burning the
BOG, the TE-module efficiency might be up to 9% (GMZ Energy, 2012).

FUNCTION ANALYSIS 04 JUNE 2015
PAGE | 43
Fuel cells are devices which generates electric energy and heat from gaseous fuels by an
electrochemical combustion. The Solid Oxide Fuel Cell, SOFC, reforms natural gas into several other
gases including hydrogen, which the fuel cell use as fuel. This reformation can be made in an external
unit or internally, direct or indirect, in the fuel cell. This type of fuel cell has a high working temperature
of about 600-1000 °C. This is necessary for the reformation as well as the reaction with the solid oxide
catalyst to occur. It is therefore necessary to cool the surroundings of the fuel cell if mounted on a
vehicle, to reduce the risk of fire. A fuel cell has no moving parts, but can be sensitive to variations in
the fuel. It has a high possible electrical efficiency of over 70 %, especially in systems where the heat
is utilised in combined heat and power systems as well. In transportation applications it might have an
overall efficiency of about 50 % and be able to generate effect per stack weight of approximately
1kW/kg. It is still a quite expensive technology, but might be a good alternative for future solutions for
utilising BOG. (Choudhury, et al., 2013)
A steam power plant is a quite basic technology with a long history. Cengel, et al. (2008) describes that
it has a quite high efficiency, up to about 60 % for large scale plants, especially when both electric
power and heat are utilised. Further, they describe that a steam power plant contains a boiler, a
turbine connected to a generator, a circulation pump and a condenser. These are all quite simple parts
which could be made quite compact, by robust parts that can withstand the vibrations of the truck.
Though, it has to be further investigated how compact such a solution can be and at what price.
A separate combustion engine connected to a generator is a solution that already exists and some
trucks, mostly in the US, are fitted with. This is usually to generate electricity and to power an air
conditioning unit while the truck is turned off and the driver uses the cabs living facilities. This is a quite
heavy solution, which for the only purpose of utilising the BOG is too heavy to mount to the truck
permanently. Though, in combination with the need of getting power and air condition while standstill,
this could be a solution that could handle BOG if already fitted to the truck. Finally, the main engine of
the truck could be used to burn the BOG using an automatic start-stop function. The engine would use
electricity during the start-up sequence, but generate electricity while running. It would also generate
heat. Only the start-stop function would have to be added to the system as it is today.
Figure 28 - The transformation system for charge the batteries.
This transformation system is presented in Figure 28. This describe the initial regulation of flow, which
is needed to provide the equipment with a steady flow of gas, rather than shorter peaks of release.
This gas is then converted through combustion or chemical reaction into electricity. The system is
cooled and the electricity is converted to fit the needs of the battery and other consumers, if necessary.

FUNCTION ANALYSIS 04 JUNE 2015
PAGE | 44
7.3.3 Truck Mounted Equipment – Re-liquefy the BOG The re-liquefaction devices that exists today are large and heavy and would probably not fit on a truck.
This concept have a huge potential to get smaller and lighter.
There is a need of 0.15 kWh/kg to re-liquefy BOG back into LNG when the BOG still is cold (Eriksson,
2015). This means that the BOG could be re-liquefied 113 times, before the same amount of energy
that the BOG contains is used for the liquefaction process.
Figure 29 - The transformation system for re-liquefy the BOG that is mounted on the truck.
Figure 29 shows the transformation system for re-liquefying the BOG with a device mounted on the
truck. The process starts by coupling the truck to an energy source and then just letting the gas flow
begin. The gas is then re-liquefied in a device that compresses and cools it in a series of stages. The
technology of re-liquefaction is further described in section 7.3.7. Once re-liquefied, the LNG is
returned to the LNG tank on the truck.
7.3.4 Standalone Auxiliary Equipment – Heating/cooling Equipment of different technical advancements could make use of the BOG for heating or cooling, for
example buildings, which is described in Figure 30. Here, the standalone equipment is first connected
to the truck. When the flow of gas occur, this unit is turned on to extract heat and/or cold which is
transferred to the ambience.
Figure 30 - The transformation system for heating/cooling externally.
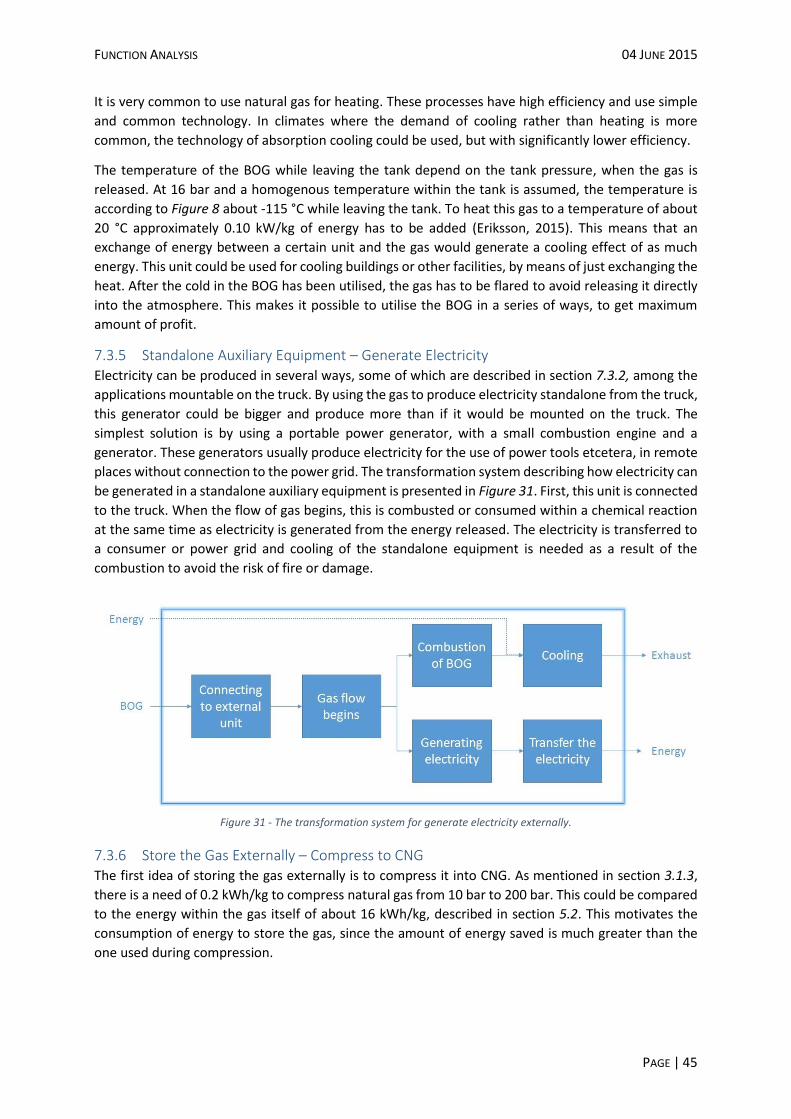
FUNCTION ANALYSIS 04 JUNE 2015
PAGE | 45
It is very common to use natural gas for heating. These processes have high efficiency and use simple
and common technology. In climates where the demand of cooling rather than heating is more
common, the technology of absorption cooling could be used, but with significantly lower efficiency.
The temperature of the BOG while leaving the tank depend on the tank pressure, when the gas is
released. At 16 bar and a homogenous temperature within the tank is assumed, the temperature is
according to Figure 8 about -115 °C while leaving the tank. To heat this gas to a temperature of about
20 °C approximately 0.10 kW/kg of energy has to be added (Eriksson, 2015). This means that an
exchange of energy between a certain unit and the gas would generate a cooling effect of as much
energy. This unit could be used for cooling buildings or other facilities, by means of just exchanging the
heat. After the cold in the BOG has been utilised, the gas has to be flared to avoid releasing it directly
into the atmosphere. This makes it possible to utilise the BOG in a series of ways, to get maximum
amount of profit.
7.3.5 Standalone Auxiliary Equipment – Generate Electricity Electricity can be produced in several ways, some of which are described in section 7.3.2, among the
applications mountable on the truck. By using the gas to produce electricity standalone from the truck,
this generator could be bigger and produce more than if it would be mounted on the truck. The
simplest solution is by using a portable power generator, with a small combustion engine and a
generator. These generators usually produce electricity for the use of power tools etcetera, in remote
places without connection to the power grid. The transformation system describing how electricity can
be generated in a standalone auxiliary equipment is presented in Figure 31. First, this unit is connected
to the truck. When the flow of gas begins, this is combusted or consumed within a chemical reaction
at the same time as electricity is generated from the energy released. The electricity is transferred to
a consumer or power grid and cooling of the standalone equipment is needed as a result of the
combustion to avoid the risk of fire or damage.
Figure 31 - The transformation system for generate electricity externally.
7.3.6 Store the Gas Externally – Compress to CNG The first idea of storing the gas externally is to compress it into CNG. As mentioned in section 3.1.3,
there is a need of 0.2 kWh/kg to compress natural gas from 10 bar to 200 bar. This could be compared
to the energy within the gas itself of about 16 kWh/kg, described in section 5.2. This motivates the
consumption of energy to store the gas, since the amount of energy saved is much greater than the
one used during compression.
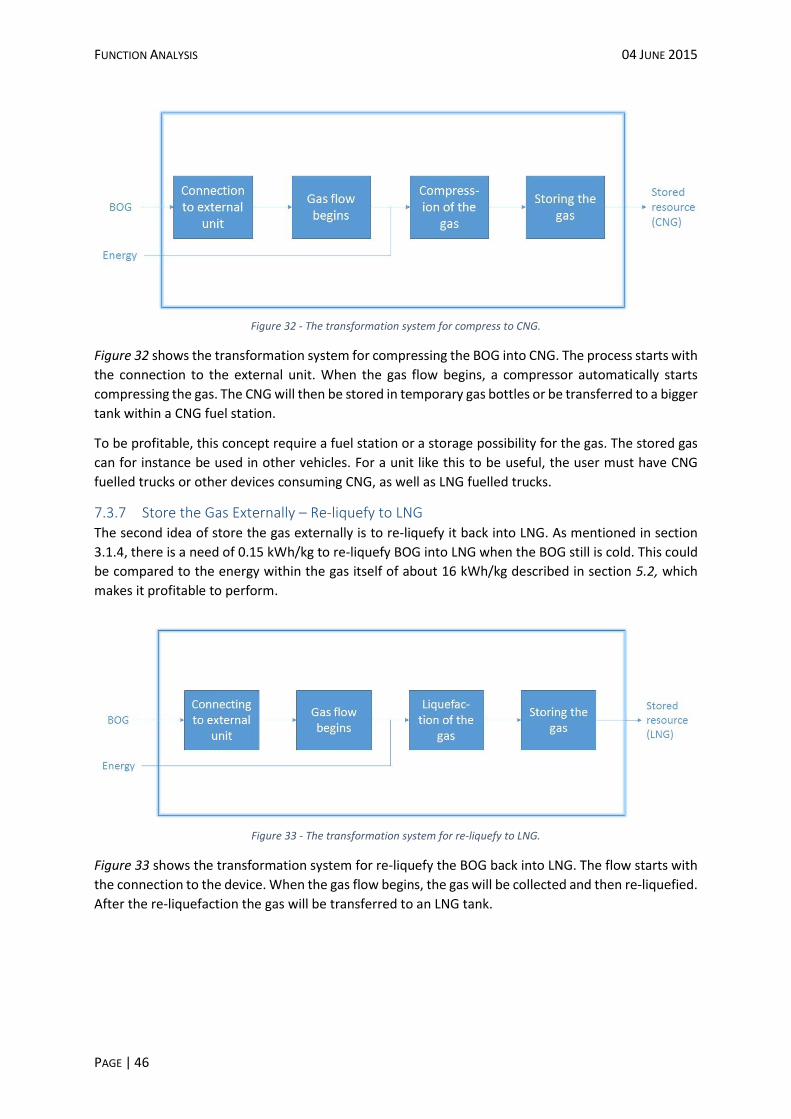
FUNCTION ANALYSIS 04 JUNE 2015
PAGE | 46
Figure 32 - The transformation system for compress to CNG.
Figure 32 shows the transformation system for compressing the BOG into CNG. The process starts with
the connection to the external unit. When the gas flow begins, a compressor automatically starts
compressing the gas. The CNG will then be stored in temporary gas bottles or be transferred to a bigger
tank within a CNG fuel station.
To be profitable, this concept require a fuel station or a storage possibility for the gas. The stored gas
can for instance be used in other vehicles. For a unit like this to be useful, the user must have CNG
fuelled trucks or other devices consuming CNG, as well as LNG fuelled trucks.
7.3.7 Store the Gas Externally – Re-liquefy to LNG The second idea of store the gas externally is to re-liquefy it back into LNG. As mentioned in section
3.1.4, there is a need of 0.15 kWh/kg to re-liquefy BOG into LNG when the BOG still is cold. This could
be compared to the energy within the gas itself of about 16 kWh/kg described in section 5.2, which
makes it profitable to perform.
Figure 33 - The transformation system for re-liquefy to LNG.
Figure 33 shows the transformation system for re-liquefy the BOG back into LNG. The flow starts with
the connection to the device. When the gas flow begins, the gas will be collected and then re-liquefied.
After the re-liquefaction the gas will be transferred to an LNG tank.

FUNCTION ANALYSIS 04 JUNE 2015
PAGE | 47
The re-liquefaction can either be made
in an re-liquefaction plant, by collapsing
or by cooling it by any other media, for
instance liquid nitrogen.
An ordinary liquefaction plant will
compress (C) and cool down
(Intercooler) the gas in three steps, see
Figure 34. This process will need fewer
stages to re-liquefy the already cold
BOG, rather than liquefying regular
natural gas. The same principle can still
be used though.
When gas bubbles is formed in or added to a liquid as methane, does a reaction occurs. The gas bubbles
is transformed into liquid, due to the difference in the temperature between them and the liquid. This
occurrence is called collapse. (Henghlein, 1984)
The collapse occurrence can be used in two different ways to cool
down the BOG. Either by “showering” LNG from the top of a tank
with methane gas in gas phase, to get the methane gas to shift
into liquid phase. The other way is to transport methane gas in gas
phase and releasing it into the bottom of a tank with LNG in liquid
phase. The methane gas bubble then floats up through the LNG,
cools down and finally condensates, shifting into liquid phase.
(Thenander, 2015)
The BOG can also be cooled down in a heat exchanger, by for
instance liquid nitrogen, see Figure 35. Liquid nitrogen has a
temperature of -196 °C and can afterwards be released into the
atmosphere, since nitrogen is the most common substance in air
(Eriksson, 2015).
7.4 Sub-functions No matter what solution is recommended to take care of the BOG for trucks, it has to be able to
guarantee that no BOG is vented directly into the atmosphere. This means that some device or solution
has to be mounted on the truck, to fulfil coming regulations as well as be possible to transport on
ferries. Due to this, focus will from this point be on truck mounted equipment only. These
transformations are generating heat to transfer to the engine, charge batteries and to re-liquefy on-
board the truck.
Since regular use of trucks consists of low enough standstill for this not to occur, the demand from the
transportation companies are estimated to be limited. Focus for the truck-mounted equipment should
therefore be on low weight, not to increase fuel consumption or loading capacities and also to keep
the price tag low.
The final functions-means-tree for truck mounted equipment are presented in Appendix III – Functions-
means-tree, where the full breakdown generated from this function analysis is presented.
Figure 34 - An ordinary liquefaction plant. (Eriksson, 2015)
Figure 35 - A heat exchanger with liquid nitrogen. (Eriksson, 2015)

FUNCTION ANALYSIS 04 JUNE 2015
PAGE | 48

CONCEPT GENERATION 04 JUNE 2015
PAGE | 49
8 Concept Generation From the final stage of the function analysis, all possible solutions are combined into concepts for truck
mounted equipment. These concepts are divided into two categories: Presently Feasible Solutions and
Future Solutions, described in this coming sections. Initially in this chapter, the Control of Steady Flow
and Connection to External Equipment are described. These are ways of controlling the flow of BOG
from the tank and how external equipment could be connected to the truck.
8.1 Control of Steady Flow To get the flow as even as possible, without any additional storage of BOG, the flow could be regulated
so that it matches the boil-off occurring within the tank at any moment. If the tank pressure were
digitally monitored and the flow of BOG out from the tank adjustable, the tank pressure could be held
at a constant pressure by a regulatory unit. More knowledge and control could possibly generate more
advanced algorithms for venting the tank. The amount of boil-off occurring within the tank during
standstill should in short term have very small variations and hence so should the flow of BOG out from
the tank if this where to be controlled.
This solution should be fitted to the tanks so that it is in constant contact with the vapour content of
the tanks, without being affected by any manual valves that lead to manual operational steps during
use of the system. Hence, this should be a separate unit not effected by the relief valves fitted to the
tank today. This to avoid any troubles with regulations. There are two possible connection points per
tank, described in Figure 36.
Figure 36 - Shows the tank system in a Chart configuration. The red arrows describe where additional fittings are to be fitted to withdraw BOG in a controlled manner. (Svensson, 2014)
A regulator that evens out the flow of BOG lead to smaller peaks within the release, resulting in that
the components handling BOG would require a lower maximum capacity. The flow have to be adjusted
to the minimum fuel consumptions for the consuming components to function properly. A burner for
example might need a minimum fuel supplied for it to stay burning. If the boil-off within the tank is
smaller than the minimum required flow of the consuming components, the regulator might be set to
even out the flow as much as possible. This to get as long lasting working phases as possible.
While using a SOFC for example, this can have a start-up time of several minutes (Choudhury, et al.,
2013). This require an even flow of fuel, during a long period of time, to be an efficient alternative. This
also include thermal electric generating devices, which need to reach its working temperatures to
generate electricity properly.

CONCEPT GENERATION 04 JUNE 2015
PAGE | 50
8.2 Connection to External Equipment Since focus during the continuation of this project will be on truck mounted equipment, this section
might be treated as auxiliary equipment. It is though a very important possibility to consume or store
the gas externally, as a complement to the truck mounted equipment. To make this possible, truck
companies must fit their product with the possibility to connect the system to these standalone
equipment.
The primary benefit in standalone equipment is that these do not have to be carried around. The
standalone auxiliary equipment can therefore be both bigger and heavier without interrupting with
loading capacity and fuel consumption. There is also a benefit in that this equipment can be used on
several different trucks, both individually and several at the time. Since the trucks only vent after being
stationary for several days, it can be assumed that a majority of these events occur at the facilities of
the transportation companies rather than at random places at the side of the road. This means that
the transportation company can have, in case of regular standstill among their trucks, auxiliary
equipment at their facility for taking care of the BOG.
Depending on what direction this might take regarding the standalone equipment used, there is two
different connection possibilities. The first is the vent connection already fitted to the tanks. This is a
standardised connection, shown as component 43 in Figure 36. Connecting to the vent coupling opens
up an unregulated flow, which therefore needs controlling by the standalone equipment. For
applications where this is possible and where the truck drivers are trusted in remembering to open the
manual valve, component 46 in Figure 36, this is an excellent choice since the standardised fitting
already are mounted on trucks today.
If there is a need of controlling the flow of BOG to the external equipment from the truck itself, this
has to be made by means of fitting an extra connection to the system. This regulation has to be a part
of the system controlling the flow for the truck mounted equipment, where the user after the flow
regulation unit can choose to use the truck mounted or the standalone equipment to consume or store
the BOG, as described by Figure 37.
8.3 Presently Feasible Solutions Four concepts have been generated which contain technologies that are believed to be possible to
implement with the technical means available today. These concepts could therefore be developed
further from today’s technology level and be implemented in the nearest future.
8.3.1 Concept 1, Gas Burner Heat the Engine Coolant This concept will heat the engine coolant, to heat the engine. Figure 38 describe this concept. A
regulator will control the flow from the fuel tank, so it is constant when the releasing of BOG has
started. The BOG will be transferred to the heater located, similar to diesel fuelled trucks, on the
chassis behind the engine.
Figure 37 - The system for the connection to external equipment.

CONCEPT GENERATION 04 JUNE 2015
PAGE | 51
When the gas has been burned in the heater, the heat will be transferred to the engine coolant and
the exhaust gases released into the atmosphere. The coolant will heat the engine and other
components within the coolant system to its working temperature.
Simulation have been made to see how much the engine block of about 650 kg radiates to its ambience
during standstill, i.e. without the convection occurring due to the rotating fan of the engine and/or
movement of the truck. This simulation is based on radiation of about 50 W/K, which refers to the
temperature difference between the engine and the ambient engine compartment. A case where the
ambient temperature is quite highly set to 30 °C and where the engine temperature is approximated
to about 80 °C, generates a heat transfer of about 2.5 kW. The simulation further show the
temperature increase of the coolant, while 7 kW of heat is added to the system, of about 1.0 K/min.
This gives a possible running time of about 50 minutes for the burner before the coolant temperature
has increased to the maximum temperature of 80 °C, while the initial temperature is equal to the
ambient temperature of 30 °C. This simulation indicate that the system will need an extra cooler with
an electric fan, for the burner to be able to run continuously without overheating any components.
(Kylefors, 2015)
The cooler added to this system, with its electric fan, will need a power supply. This might be able to
run on battery power for a while, but in the long run an external power supply is needed.
8.3.2 Concept 2, Gas Burner Heat the Catalyst The catalyst need to be hot to be able work and reduce the emissions within the exhaust gases from
the truck while running. This concept will have a heater inside or in close connection to the catalyst to
heat it up before the truck is started. The transfer of heat would be through air, heated by the burner
which then heats the inside of the catalyst. This would generate a faster start-up of the catalyst, where
the reactions inside it can be initiated faster after cold starts. A regulator will control the flow from the
fuel tank, see Figure 39, so it is constant when the releasing of BOG has started.
Figure 38 - The system for gas burner heating the engine coolant.
Figure 39 - The system for gas burner heating the catalyst.
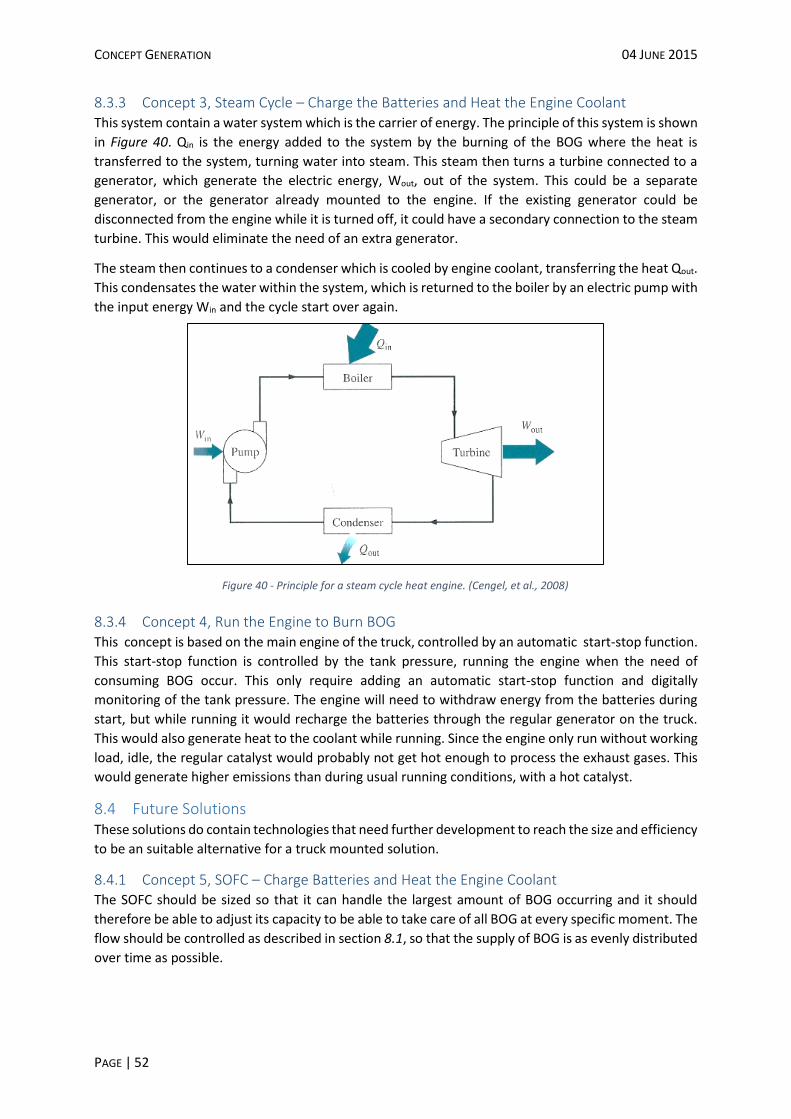
CONCEPT GENERATION 04 JUNE 2015
PAGE | 52
8.3.3 Concept 3, Steam Cycle – Charge the Batteries and Heat the Engine Coolant This system contain a water system which is the carrier of energy. The principle of this system is shown
in Figure 40. Qin is the energy added to the system by the burning of the BOG where the heat is
transferred to the system, turning water into steam. This steam then turns a turbine connected to a
generator, which generate the electric energy, Wout, out of the system. This could be a separate
generator, or the generator already mounted to the engine. If the existing generator could be
disconnected from the engine while it is turned off, it could have a secondary connection to the steam
turbine. This would eliminate the need of an extra generator.
The steam then continues to a condenser which is cooled by engine coolant, transferring the heat Qout.
This condensates the water within the system, which is returned to the boiler by an electric pump with
the input energy Win and the cycle start over again.
8.3.4 Concept 4, Run the Engine to Burn BOG This concept is based on the main engine of the truck, controlled by an automatic start-stop function.
This start-stop function is controlled by the tank pressure, running the engine when the need of
consuming BOG occur. This only require adding an automatic start-stop function and digitally
monitoring of the tank pressure. The engine will need to withdraw energy from the batteries during
start, but while running it would recharge the batteries through the regular generator on the truck.
This would also generate heat to the coolant while running. Since the engine only run without working
load, idle, the regular catalyst would probably not get hot enough to process the exhaust gases. This
would generate higher emissions than during usual running conditions, with a hot catalyst.
8.4 Future Solutions These solutions do contain technologies that need further development to reach the size and efficiency
to be an suitable alternative for a truck mounted solution.
8.4.1 Concept 5, SOFC – Charge Batteries and Heat the Engine Coolant The SOFC should be sized so that it can handle the largest amount of BOG occurring and it should
therefore be able to adjust its capacity to be able to take care of all BOG at every specific moment. The
flow should be controlled as described in section 8.1, so that the supply of BOG is as evenly distributed
over time as possible.
Figure 40 - Principle for a steam cycle heat engine. (Cengel, et al., 2008)

CONCEPT GENERATION 04 JUNE 2015
PAGE | 53
Since the SOFC has a very high working temperature, this system has to have a cooled container so
that the risk in having very hot parts generating fire hazards on the truck is reduced. This concept
therefore contain a capsule which is cooled by engine coolant, circulated by an electric pump, much
like the heat exchange from a burner described in section 8.3.1. The exhaust gases also have to be
cooled by engine coolant in an heat exchanging process, since they also are very hot. This gives a
combined system where both electricity and heat are generated, to make the most out of the BOG.
The electric power that the SOFC generates are then converted and transferred to recharge the
batteries on the truck, making the lifespan of the batteries longer and reducing the demand of
recharging while driving. This system is described in Figure 41. The gas flow is regulated and power the
SOFC. Engine coolant circulate to cool the equipment as well as the exhausts, powered by an electric
circulation pump. This system might also be fitted with an additional cooler with an electric fan, to
ensure that the SOFC can run continuously without the coolant getting to warm. The electric power
from the SOFC is converted after which it is powering the electric consumers as well as charging the
batteries.
8.4.2 Concept 6, SOFC – Charge Batteries and Heat the Catalyst This solution is much like the previous, described in section 8.4.1, where a SOFC is generating both
electric power and heat. The difference in this case is that the SOFC is adapted to be cooled by air,
which in turn runs through the catalyst. This SOFC can be located strategically, to be able to heat the
catalyst as much as possible. This process is described in Figure 42, in comparison to previous concept,
including an electric powered fan which cools the SOFC by air, which joins the exhaust gases from the
SOFC into the catalyst.
Figure 41 - The system for SOFC – charge the batteries and heating the engine coolant.
Figure 42 - The system for SOFC – charge the batteries and heat the catalyst.

CONCEPT GENERATION 04 JUNE 2015
PAGE | 54
8.4.3 Concept 7, Thermal Electric Generation – Charge Batteries and Heat the Engine
Coolant This concept is described in Figure 43.This concept consumes the BOG with a burner, much like the
one in section 8.3.1. In-between the burner and the coolant is a thermal electric generator, TEG. One
side of the TEG is subjected to severe heat from the burner and the other side is cooled by engine
coolant, circulated by an electric pump. This would generate a high ΔT, giving the TEG good possibilities
of as high efficiency as possible.
Even though the TEG’s efficiency is low, maybe just one percent, this would give the TEG an electric
power out of about 60 W while the BOG contain 7 kW and with a burner efficiency of about 85 %. This
would be enough to run the circulation pump, as well as recharge the batteries, even though very
slowly.
8.4.4 Concept 8, Re-liquefy the BOG on the Truck This concept is about compressing and cooling the BOG in
several stages, generating a high pressure gas with
temperature of close to room temperature. The pressure
are then dropped, decreasing the temperature of the gas
instantly, getting it to liquefy. The re-liquefied LNG are
then transferred back into the regular tank. The system,
although very simplified, looks like the one in Figure 44.
The process in the re-liquefaction device will need energy
to work. The user have to connect the truck to a source
for electricity to get the energy needed. If the truck is not
connected to a charging station while the release of BOG
occurs, the electricity will be taken from the trucks
battery. This would only last during a certain period of
time though, before they run flat on power.
To cool the BOG in the re-liquefaction process, the engine coolant could be used. The engine coolant
will have ambient temperature when the truck have been standing still for a longer time. Hence, this
is colder than during operations of the truck which is good since the goal is to cool the BOG as much
as possible. The engine coolant will need an electric pump for circulation during the process.
Figure 43 - The system for thermal electric generation - charge the batteries and heat engine coolant.
Figure 44 - The system for re-liquefy the BOG on the truck.

CONCEPT EVALUATION 04 JUNE 2015
PAGE | 55
9 Concept Evaluation The following section describes the evaluation of the concepts generated in the previous chapter. This
is done by first evaluating the concepts in relation to the engineering specifications. Pros, cons,
opportunities and challenges are then presented for each concepts. Further, an elimination matrix is
established to reduce the amount of concepts. Finally, concept scoring are used to compare the
remaining concepts, as a base of decision for what concept to recommend.
9.1 Engineering Specifications The presently feasible concepts and the future solutions are evaluated with respect to the list of
engineering specification separately. These are presented in Table 19 and Table 20 in Appendix IV –
Evaluation of Engineering Specifications.
Concepts 1 and 2 fulfils the engineering specifications well, with the exception of a few specifications
where not enough information has been available. The third concept include too many uncertainties
to really tell if this is possible or not. Concept 4 do not fulfil all engineering specification.
Several of the engineering specifications for concept 5-8 are not available and these therefore requires
more investigating to become complete concepts. A few specifications do not fulfil the requirement as
for today, but they might be able to improve in the future, fulfilling all requirements after further
development.
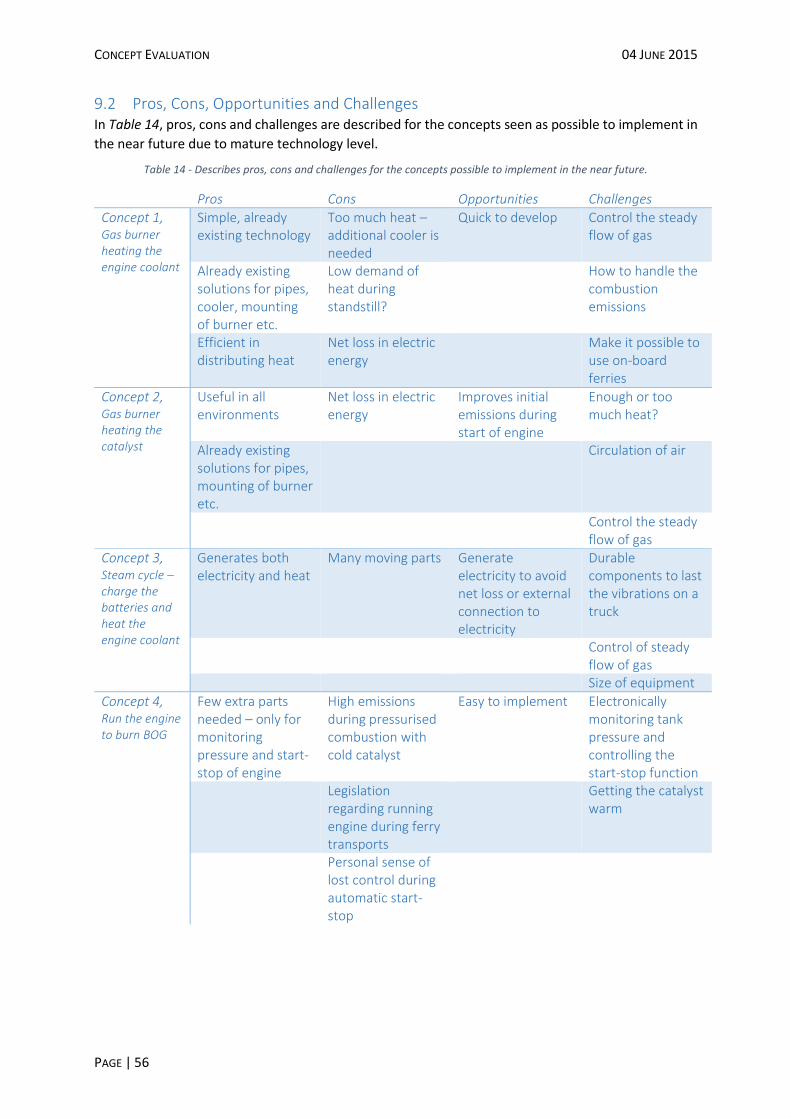
CONCEPT EVALUATION 04 JUNE 2015
PAGE | 56
9.2 Pros, Cons, Opportunities and Challenges In Table 14, pros, cons and challenges are described for the concepts seen as possible to implement in
the near future due to mature technology level.
Table 14 - Describes pros, cons and challenges for the concepts possible to implement in the near future.
Pros Cons Opportunities Challenges
Concept 1, Gas burner heating the engine coolant
Simple, already existing technology
Too much heat – additional cooler is needed
Quick to develop Control the steady flow of gas
Already existing solutions for pipes, cooler, mounting of burner etc.
Low demand of heat during standstill?
How to handle the combustion emissions
Efficient in distributing heat
Net loss in electric energy
Make it possible to use on-board ferries
Concept 2, Gas burner heating the catalyst
Useful in all environments
Net loss in electric energy
Improves initial emissions during start of engine
Enough or too much heat?
Already existing solutions for pipes, mounting of burner etc.
Circulation of air
Control the steady flow of gas
Concept 3, Steam cycle – charge the batteries and heat the engine coolant
Generates both electricity and heat
Many moving parts Generate electricity to avoid net loss or external connection to electricity
Durable components to last the vibrations on a truck
Control of steady flow of gas
Size of equipment
Concept 4, Run the engine to burn BOG
Few extra parts needed – only for monitoring pressure and start-stop of engine
High emissions during pressurised combustion with cold catalyst
Easy to implement Electronically monitoring tank pressure and controlling the start-stop function
Legislation regarding running engine during ferry transports
Getting the catalyst warm
Personal sense of lost control during automatic start-stop

CONCEPT EVALUATION 04 JUNE 2015
PAGE | 57
In Table 15, the pros, cons, opportunities and challenges are described for the concepts that looks
promising to implement in the longer run, while the technology have been further developed.
Table 15- Describes pros, cons and challenges for the concepts that looks promising to implement on a longer run, in the future.
Pros Cons Opportunities Challenges
Concept 5, SOFC – charge batteries and heat engine coolant
Efficient in producing electricity
Expensive Net profit of electricity
Control of steady flow
Few/no moving parts
Concept 6, SOFC – charge batteries and heat the catalyst
Efficient in producing electricity
Transfer of heat in air compared to coolant
Net profit of electricity
Does this cool the SOFC enough?
Few/no moving parts
Expensive Control of steady flow
Concept 7, Thermal electric generation – charge batteries and heat engine coolant
Simple burner technology
Low electric efficiency
Control of steady flow
Few/no moving parts
High weight Size and weight of the TEG
Expensive
Concept 8, Re-liquefy the BOG on the truck
High efficiency – saves the gas for actual fuel
Many parts Accepted solution while no emissions is allowed
Size and weight of equipment
Preserves the gas in its prospective configuration
Requires external energy
No maximum capacity of storage
Expensive
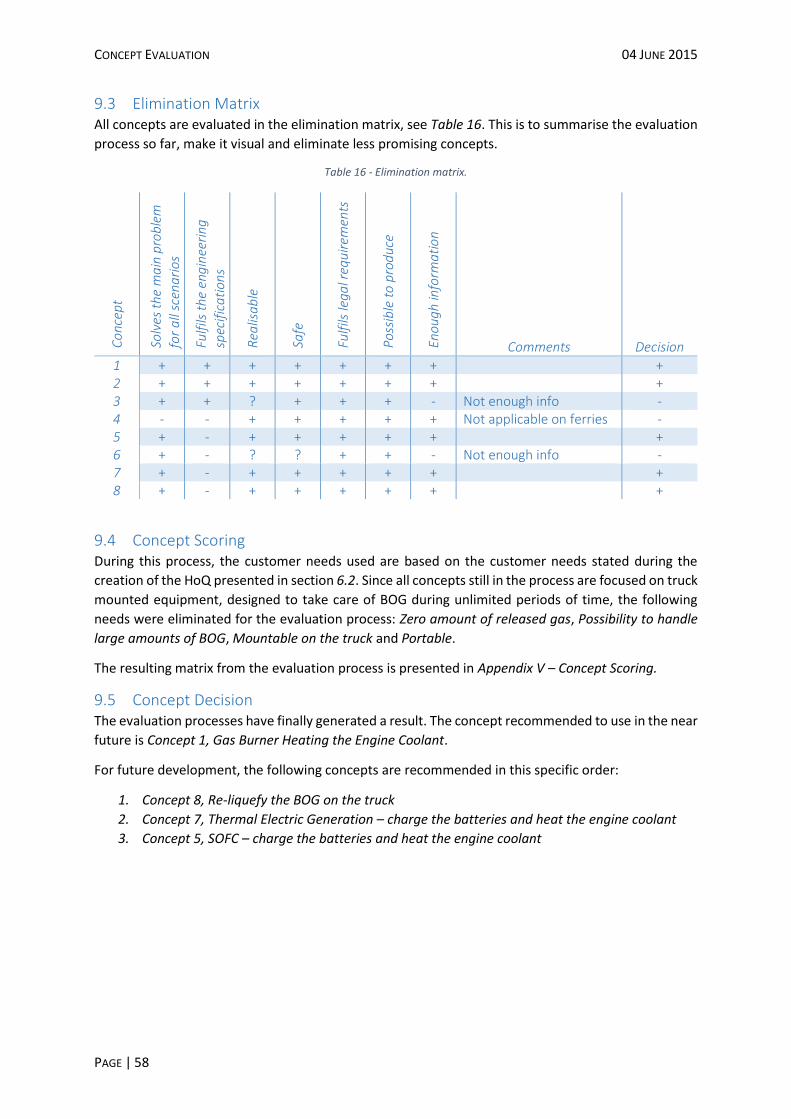
CONCEPT EVALUATION 04 JUNE 2015
PAGE | 58
9.3 Elimination Matrix All concepts are evaluated in the elimination matrix, see Table 16. This is to summarise the evaluation
process so far, make it visual and eliminate less promising concepts.
Table 16 - Elimination matrix.
Co
nce
pt
Solv
es t
he
ma
in p
rob
lem
fo
r a
ll sc
ena
rio
s
Fulf
ils t
he
eng
inee
rin
g
spec
ific
ati
on
s
Rea
lisa
ble
Safe
Fulf
ils le
ga
l req
uir
emen
ts
Po
ssib
le t
o p
rod
uce
Eno
ug
h in
form
ati
on
Comments Decision
1 + + + + + + + + 2 + + + + + + + + 3 + + ? + + + - Not enough info - 4 - - + + + + + Not applicable on ferries - 5 + - + + + + + + 6 + - ? ? + + - Not enough info - 7 + - + + + + + + 8 + - + + + + + +
9.4 Concept Scoring During this process, the customer needs used are based on the customer needs stated during the
creation of the HoQ presented in section 6.2. Since all concepts still in the process are focused on truck
mounted equipment, designed to take care of BOG during unlimited periods of time, the following
needs were eliminated for the evaluation process: Zero amount of released gas, Possibility to handle
large amounts of BOG, Mountable on the truck and Portable.
The resulting matrix from the evaluation process is presented in Appendix V – Concept Scoring.
9.5 Concept Decision The evaluation processes have finally generated a result. The concept recommended to use in the near
future is Concept 1, Gas Burner Heating the Engine Coolant.
For future development, the following concepts are recommended in this specific order:
1. Concept 8, Re-liquefy the BOG on the truck
2. Concept 7, Thermal Electric Generation – charge the batteries and heat the engine coolant
3. Concept 5, SOFC – charge the batteries and heat the engine coolant

DISCUSSION 04 JUNE 2015
PAGE | 59
10 Discussion This section will discuss the projects methods and result, as well as the environmental and economic
aspects of implementing suggested equipment. Engineering ethics in relation to this subject will also
be discussed within this following section.
10.1 Method The collection of theory and empirics and its credibility is evaluated in this section. Pros and cons for
the used methods are also stated.
10.1.1 Theoretical Information During a project like this, many sources are collected and cited. Some information is pure facts and
some are more subjective, which gives the authors the possibility to put their welfares into the
information. Organisations with interest in a specific subject, wants to describe that specific subject in
the best way possible. In this project, some sources are used which are connected to the fuel and gas
industry, like AGA, Tunestål, et al. representing Gasakademin, and Chart Industries etcetera. These
sources are mostly used for pure facts. When there is risk of partiality, these kind of sources are
complemented with other sources or reflections from within the project.
Oral presentations and materials withheld from such events, mostly regarding LNG and applications
using LNG have been used during this project. As described in the previous paragraph, these sources
could also put their welfares into the information or just to present the positive aspects, to embellish
the subject. While using this kind of information, it is also important to verify the material, with other
sources or analyse the material based on reflections from within the project.
When articles and books have been read, the primary source has been used in the vast majority of
cases. It is better to use the primary source than the secondary source, to guarantee that the
information has not been modified. On the other hand, it is better to use as new articles and books as
possible, since they could contain updated facts in the specific subject.
10.1.2 Empirical Information The project started off with some structured interviews, to investigate in what way Scania was
managed and how the industry of trucks work. All of the information from these interviews have not
been used in the report, but was important to understand the present situation as well as possibilities
for the future. This information helped to decide where to put most focus during the project.
More unstructured interviews have been used in later parts of this project. These interviews have
contained technical information and teaching about certain technologies, rather than focused on
investigation. This made unstructured interviews a better alternative, starting off by just one or two
really open question. The information stated by the interviewee raised a lot of new question which
generated further discussion. The knowledge about these technical parts have been limited before the
interviews, which made it hard to define more questions before the interviews.
To validate information given within the interviews, additional interviews was performed. In several
cases, this confirmed information stated in the first place. In other cases, two aspects where raised
which generated a discussion from which conclusions could be made. When additional interviews was
not possible or information for other reasons were needed to be verified by written sources, the fact
was strengthen by written literature. This gave the information stated during interviews more
objectivity.

DISCUSSION 04 JUNE 2015
PAGE | 60
After the interviews were held, the concluding text was written. These texts were then sent to the
interviewees, to make corrections and confirming that the content of the text correlates to the
information stated during the interview. This guarantees that no misunderstandings are published in
the report.
Some statistics used in this project have not been verified by several independent sources. Detailed
statistics regarding for example standstill of trucks have been especially hard, since this point of
interest is quite new to the business. Hours of standstill have not been interesting to truck companies
before. This new behaviour that occurs during standstill generate a new area of focus, for which
statistics have been generated in the best way possible within the set timeframe. In the cases where
the statistics have been unable to verify a certain behaviour, experiences from people within Scania as
well as transportation companies have been used. Since LNG is a quite new subject within European
trucking, this experiences have in most cases been based on diesel fuelled trucks and then been
transferred to LNG. Since the users are expected to keep their behaviours and usage of trucks during
the transition from diesel to LNG, these experiences are still valid. The fact that these trucks is more
expensive than diesel trucks also indicates that these will be used a lot. LNG trucks can therefore be
compared to diesel trucks that are driven a lot and statistics regarding these trucks have been used to
indicate how the use of LNG trucks might be.
10.1.3 Demand Specifications These methods, including stating customers and stakeholders, HoQ and List of Engineering
Specifications are all quite subjective. First of all, the result depend a lot on how the customers are
defined. This is an important step which might be adjusted during the process. In fact, the full work
regarding demand specifications might have to be adjusted along the development process, as the
group gets more knowledge and different solutions are investigated. This can be seen as both a
strength and a weakness of this method. It can be seen as a strength as it supports the learning process
and that it is easy to adjust the goals as well as the importance of any engineering specification. This is
also a weakness since the method does not give a definite answer from the beginning.
The HoQ however is a stable method if the customers are chosen wisely. The weight of the customer
needs are decided in relation to each other. The relation between each customer need and product
specification are stated in four levels, which is enough. Simple math then give the result as value of
importance for each product specification, separated for each customer. This is good base for
judgement regarding what specification and product feature should get the most attention during the
development process, to get an as competitive product as possible. That is the reason why HoQ has
been used during this project, to in a structured way present the customer needs and develop
engineering specifications important to each customer. Since several customer scenarios are stated as
well, with separate needs, the difference of the importance of each specification is interesting to
present and understand. There is however more parts to the original method described by Ullman
(2010). One of these are for presenting how well competitors fulfil the customer need. Since no
competitors have launched any solution for handling BOG on trucks, this part of the method was
excluded in this project.
A really tough part of the demand specification process is to state ideal and limit values for each
product specification. There is not any simple method for this process. It is all about defining what the
product is about to achieve and what target values are possible and solves the main functions of the
product in a competitive way. The more knowledge available regarding the product, surroundings,
functions, etcetera, makes it easier to set limit values that are achievable and makes the product
competitive. Benchmarking might tell what competitors product might achieve, but since this project
lack obvious competitors this is not an option. This values might be adjusted during the way as well, as
DISCUSSION 04 JUNE 2015
PAGE | 61
the learning process continues during the project. Even though a lot can be adjusted along the way,
the process of thinking these demands trough is important to understand the difficulties within the
task. Presenting a list of demand specifications is also a good method of visualising what values are
going into the development process, to reflect what thoughts and knowledge the project group
represent.
10.1.4 Function Analysis This method has been especially appreciated during this project due to the possibility of dividing the
problem into several smaller segments. This makes it possible to perform idea creating sessions in
several steps, where the technical principles is the first step. Since the resource going into the system
is known from the beginning but the customer needs to fulfil had to be stated along the way, this
method has been of additional importance. This has been a challenge during the entire process, that
the customer needs to fulfil have been unknown from the beginning, developing a solution with a
known resource instead. The possibility to focus the first brainstorming on what customer need to
fulfil, as technical principles, have been useful. Decomposing the problem further, getting to know
what functions are needed and generating ideas for solving these functions, makes the task easier to
understand and to finally generate concepts. This method has also made it easy to visualise the process.
Idea creating methods are limited to the persons attending the process. Usually, a good mix of people
aids this process to generate a wide range of ideas. This might have been a weakness during this project,
since the persons attending have been of quite similar background. This issues has been avoided as
much as possible, by doing several sessions with different people from several sections within Scania
R&D.
Knowledge about technologies possible to fulfil the functions stated along the function analysis is
essential. This knowledge have been based on benchmarking, scientific articles, web searches, etcetera.
This is also a limitation during the process, to have knowledge about technologies possible to use and
to know the limitations about those technologies. This is a matter of being effective in searching for
information, as well as using the knowledge within the project surroundings.
10.1.5 Concept Generation Generating concepts can be a tricky part of the development process, especially if there are plenty of
solutions for the sub-functions stated within the function analysis. This can make an endless amount
of combinations possible. Luckily, during this project there has not been too many possibilities. This
due to the possibility of eliminating several ideas early in the process and that each solution needed
research to investigate the technical possibilities of the solution. The concept generation phase did in
the end focus on putting solutions together that in combination could make working systems.
10.1.6 Concept Evaluation After generating concepts, several concept evaluation methods were chosen, to get one single concept
in the end. It is good to use several methods, since one concept could get good results in one method
and poor results in another. By using several methods, the concepts could be compared to each other
from different point of views.
The first step during the evaluation of concepts was to compare the concepts specifications to the
demand specifications stated. Since information in several cases have been unavailable or hard to find,
this evaluation has been hard to perform. Further development is required to fully judge these
fulfilments. Estimations have been used in several cases, to approximate the performance or
properties of the concepts. One benefit regarding this method is that only measureable criteria is
involved, so the method is pretty straight-forward.
DISCUSSION 04 JUNE 2015
PAGE | 62
One simple way of comparing the concepts to each other is to have a matrix with each concepts pros,
cons, possibilities and challenges. The more knowledge available for each concept, the easier it is to
understand each concept pros and cons for the different customer scenarios stated. Just because a
concept have most pros on paper, does not mean that it is the best to choose. This could happen due
to the amount of knowledge and information about this specific concept in comparison to the others.
This is however a good way of presenting as much information as possible, both as a base for decision
and also to show what information was known at the point of decision.
The elimination matrix evaluated not measureable, but important criteria for each concept, to
eliminate the least promising concepts. This method allows individual thoughts and values for each
concepts, if they fulfil the criteria or not. The concept scoring evaluated each concept in relation to the
customer needs. This is a relative method that is good when comparing the concepts to each other.
10.2 Investigating Boil-off This section discuss the options of investing in a solution for handling BOG, through both economic
and environmental aspects.
10.2.1 Scenarios of Boil-off The different scenarios of boil-off are not equally valued, depending on that they do not occur with
the same intervals during the trucks lifecycle and that they do not have the same impact. The most
important aspects of preventing the release is coming regulations against it. These regulations, which
most likely will be implemented in the future, will aim to make LNG a more environmentally friendly
option as a fuel for heavy transport. It turns out though, that economic aspects regarding the release
of BOG are not that important. Sure, the transportation companies have really slim margins and are
sensitive to higher costs, but since the BOG only will cost about 11 € per day, this has a quite small
effect. Also, the ability of giving return to an additional investment of equipment handling BOG, will
need many days of standstill to reach any values of importance. In combination with the fact that these
trucks are to be driven as much as possible, the will of paying for this equipment is limited.
Coming regulations will be based on public opinion and their will of finding more sustainable solutions.
Another stakeholder often interested in environmental issues and to get an environmentally friendly
image, is the companies ordering the transportation. These are often the reason why transportation
choose alternative fuels in the first place, and these might also request additional equipment to make
the trucks more environmentally friendly. These possible regulations forbidding the release of BOG
would imply that the equipment necessary would have to work for all scenarios during the lifecycle of
these trucks. This made an important factor during the development process and finally lead to the
conclusion that truck mounted equipment of some sort are necessary, to guarantee that no venting
occur, no matter where the truck is or how long it is standing still. Since the customers scenario that
are mostly affected by this truck mounted equipment, is during operations of the truck, their
requirements and the importance of their demand have been prioritised. These are also the group that
pays for the product in the first place, making this customer scenario even more important to satisfy.
For the scenario of transporting these vehicles on ferries, it is important to guarantee that no venting
of BOG happens at all. This is a present issue with the release of BOG, as no shipping company want to
have combustible gases released within their cargo space. If this could be avoided , guaranteeing that
no BOG is released, these trucks could be made welcome on-board ferries. Both Scania, during delivery
to the distributor, and the truck user, wants to transport trucks by ferry. If this cannot be done, it is
limiting the using of the truck as well as the delivering process from factory to customer. Since LNG is
such a new and unexplored fuel, companies developing these trucks have the possibility to influence
the standard of how these trucks should handle BOG, to be a safe method to be used on-board ferries.
DISCUSSION 04 JUNE 2015
PAGE | 63
There are several approximations made during the calculation of the amount of boil-off and its energy
content, made in section 4.2.3. First of all, the measurement of how much gas is released are made
during quite simple conditions. This test could be validated by several similar tests, where the amount
is measured more carefully. However, this gives a good estimate of the magnitude of BOG released.
The calculations are further based on figures from a Swedish LNG terminal, even though measured
during an extensive period of time. Wobbe index might vary, especially depending on the source of
the fuel, which would slightly change the results from this calculations. The amount and power output
however, is still a good estimate and these figures are still a good enough base for further development.
10.2.2 Avoiding Boil-off One important aspect to remember regarding LNG trucks and boil-off, especially when it comes to the
question of what events of the trucks lifecycle this occur, is that it is a specific type of customer who
buy these trucks. LNG as it is today, is not a suitable option for all kinds of users and trucks. These
trucks obviously need to run a lot since boil-off otherwise has to be vented. It is possible to save and
store this fuel, as mentioned throughout this report, but independent of how this is achieved it needs
energy to either re-liquefy or compress the gas. Therefore, the most efficient way of all is to avoid boil-
off by running the trucks so it does not occur.
Since LNG trucks are more expensive to buy, mostly since the tanks are much more complex than on
a diesel or petrol powered vehicle, the point of buying these trucks are in most cases that they run a
lot and therefore become profitable by lower fuel costs. This will, in itself, result in that LNG trucks will
run a lot and therefore avoid boil-off, since this is when these trucks are most profitable.
It is also important to inform and educate the drivers and owners of these trucks, making them
understand the consequences in leaving them standstill for long periods of time. This feature could for
instance be implemented into the fleet management systems, so that the company receives reminders
when LNG trucks have been standing still for a long time.
During delivery from factory, longer visits to service stations and other events that could be foreseen,
the amount of gas within the tank should be as low as possible. These tanks could be emptied into
other LNG trucks, separate tanks or not filled up from the beginning.
10.2.3 Environmental Aspects There are several aspects of using natural gas as a fuel for heavy vehicle transports. First of all, natural
gas is still a fossil fuel and an ending resource. Burning it, even though it is cleaner than petrol and
diesel, will have effects on global warming. Secondly, the transition towards using more LNG will
increase the development of infrastructure and vehicle technologies further. This will open up the
possibility of a further transition towards using biogas in larger quantities, which would be an even
more environmentally friendly and sustainable way of propelling the sector of heavy vehicle transports.
Sadly, on an international scale, biogas still looks very far away since the natural gas is seen as an
abundant resource. There is also the aspect that a lot of natural gas are flared and therefore spoiled
as a resource. Giving natural gas higher potential as a fuel for transports, could increase the use of this
resource rather than wasting it.
One week spot regarding the use of natural and biogas is when it leaks out into the atmosphere, just
like when boil-off is vented. This since methane has a significantly higher global warming potential than
carbon dioxide, described in section 3.4. The value for GWP varies a lot, depending on the source cited.
This variation might be according to what boundaries are put to the system when the GWP is calculated.
Regardless of the precise value, the effect on global warming is severe and the release of natural gas
into the atmosphere should be avoided.
DISCUSSION 04 JUNE 2015
PAGE | 64
The amount of CO2,eq generated during one day of venting BOG is severe. The same amount would be
generated if 250 kg of natural gas were flared. Though, since fuel consumption from trucks are quite
high, the same amount of carbon dioxide is generated in a quite short distance. It is still a spoiled
resource which by quite easy measures can be reduced by about 25 times.
The attitude towards venting of boil-off, as well as venting the full content of a tank while service are
about to be made on the tank, is essential to the precautions and actions completed. Experiences from
this project, especially from the American market, indicates that venting of BOG is accepted among
most people within the business. If necessary, due to the need of service etcetera, it also seem
accepted to vent the full content of a tank if this is the quickest option. As presented in section 3.4,
depending on the amount released, this could generate up to about eight tons of CO2,eq. This is not
seen as a part of this project, since the equipment needed would be a lot different, but it is still an
important aspect which indicates that regulations are needed to prevent the release of gas in the
future.
To get fully sustainable solutions for the future, these have to be sustainable regarding both
environmental, economic and social aspects. Therefore, regulations put into place too early might have
severe effects on the market for LNG trucks. The solutions for handling BOG as well as emptying tanks
in the future will have to be simple and cheap enough for these trucks to stay attractive to buy.
10.2.4 Economic Aspects The fact that no stakeholder actually wants to pay for this solution, is a challenge during the developing
process. This is based on the fact that the release of BOG should not occur that often during the lifetime
of a truck, as well as the low amount of money in costs per day of released BOG. The environmental
aspects are much more important than the economical. For Scania it is important to focus on their
environmental image, rather than earn some extra money on this solution.
If regulations come into play prohibiting the release of BOG, or the customers want an environmental
friendly alternative for all scenarios, Scania may not be able to sell these trucks. This threat could be
turned into a possibility for Scania. If a solution is developed and patented, Scania could hurry the
process of implementing these regulations, making their position on the market stronger.
10.3 Results In this section, the results from the development process is discussed.
10.3.1 Demand Specifications The engineering specifications has been changed during the project. This depends on that more
knowledge has been obtained regarding each specification. This is a normal part of the process, as the
knowledge about both the task and the technology are increased continuously.
Several engineering specification, for instance total equipment volume and weight, has the ideal value
of 0. This is due to that no one actually wants to have more components on the truck. The truck user
wants to have both as low extra volume and extra weight as possible on the truck, making it possible
for the truck to carry more load. Scania do not want to fit their trucks with unnecessary components,
since competition among prices and carrying loads are hard. The limit value for the total equipment
volume is set to 0.05 m3, this is about five times bigger than the auxiliary heater which is fitted to diesel
trucks today. The limit value for the weight is set to 40 kg, this is about 10 % of the additional weight
gain for a LNG truck of today, in relation to a diesel truck.
To avoid mistakes made by humans, the amount of manual operations must be as low as possible. That
is why the ideal value is set to 0. The goal is to affect the behaviour of the truck users as little as possible

DISCUSSION 04 JUNE 2015
PAGE | 65
in a negative way. The worst acceptable case, should be if the truck user had to do 5 manual operators,
e.g. push a button, connect a nozzle or electricity.
The product should have as few materials as possible, this due to simplifications in recovering materials
as well as making the equipment cheaper. If a product is added to the truck it will probably be made
of at least one metal and one plastic. The product should not contain more than 20 materials, related
to how complex the product might be.
It is not acceptable for the solution to release any BOG at all, so both the ideal and the limit value is
set to 0.
Since the BOG is a resource containing a lot of energy, it is completely waste just releasing it without
using any of the energy. It would also be a great risk if the gas was burned and none of the heat was
distributed to other components. This would generate a very hot spot on the truck, which would be a
risk of fire. The solution should aim to use the energy within the BOG, instead of supplying additional
energy to the system. The limit value for efficiency is set to 50 %, and this is the net result for both
electricity and heat. The ideal value is obviously 100 %.
The solution have to be able to manage the full amount of the content of the tanks. If the solution is
unable to handle the full content of the tanks, it cannot guarantee that releasing of BOG not occurs
and that coming laws are being fulfilled.
A reasonable lifespan for a truck is approximated to at least 1 200 000 km and the ideal value is
therefore that the equipment for handling BOG last the full lifetime of the truck. The limit value is set
to be half the lifespan, making the need of service or replacements of some parts after half the lifespan
of the truck.
The amount of released combustion emissions has an ideal value of 0, saving the gas instead of
consuming it and generate emissions. The limit value is so that the equipment manage the Euro6
requirements.
The amount of component within the solution should be as low as possible, to get it easy to assemble
and repair, as well as making the price as low as possible. The ideal value of components is 0, since the
best solution should be to not have anything new on the truck. The limit value is 100, where the
fasteners on the product are included.
The number of steps to reach the deepest located component should be as low as possible, both from
an assembling and a repairing point of view. As stated before, the best solution would be if no product
was added to the truck, and therefore the limit value is again 0. If there is a product added, it should
have maximum 25 steps to reach the deepest located component.
Today, the LNG tanks have two separate relief valves which is required by the regulations stated in
R110. The solution for handling the BOG should have the same amount of safety related devices, hence
both the ideal and limit values are set to two devices, to fulfil the requirements but without adding
anything extra.
The selling price for the solution should have 500 € as ideal value. That depends on that Scania invest
money in developing a solution, that they want to earn money from. Scania ensures the quality of their
LNG trucks by continuously improving them further. If the price of an LNG truck increase by much,
these trucks will need to be driven even more to get payback to the additional investment. It is
approximated that an additional increase of 3000 € would be a reasonable limit for an additional
increase of the selling price, due to this equipment.
DISCUSSION 04 JUNE 2015
PAGE | 66
The limit value for the amount of fasteners is set to 20, which is associated with the limit value for the
specification maximum number of steps to reach the deepest component.
It is good to have as few precious materials as possible. The access of these materials are limited, which
makes them very expensive to use and usually difficult to extract, with high environmental impact as
a result. The ideal value is therefore set to 0. The worst case still acceptable is set to use 1 precious
material.
10.3.2 Function Analysis The results from the function analysis is very much based on decisions made during the full
decomposition process. Starting of wide with preserving the gas and making use of the gas included
many different solutions, both on and off the truck. Several ideas created as technical principles were
eliminated due to the aspects described in section 7.2.3. For instance, the idea of compressing the BOG
was eliminated as a truck mounted solution as it has a limited capacity due to the need of pressure
vessels to store to pressurised gas. This end up as a way of increasing the holding time of the system,
as it has a limited volume for the CNG, rather than handling the full volume of the LNG system. Re-
liquefaction on the other hand, uses the storage of the LNG tanks themselves which result in that the
system can deal with the full amount of LNG on-board the truck, over and over again. If a system with
a limited capacity were fitted to the truck, this would need a second option for the BOG exceeding the
first systems maximum capacity. Since the costs and weight of the system have been of high
importance, dual systems or system limited to dealing with a certain volume have been eliminated.
Solutions only applicable to one or two of the customer scenarios stated have also been eliminated.
These solution, for instance feeding the delivery truck with BOG while transporting the trucks from
factory, or using the BOG for certain solutions at the factory or service workshop area, have been
removed. These are too limited, and focus during this project have been to find a more general solution.
The goal during the idea creating and evaluation process has also been to find solutions that are
independent of second parties. This mean that solutions depending on for instance shipping
companies to adapt or develop systems of their own, have been eliminated as well.
The solutions for storing the gas externally will be much more promising in future applications, when
there are more LNG trucks in use. Then, it will be more profitable to invest in devices that stores the
BOG, since the volume of stored BOG becomes bigger.
The benchmarking have generated ideas regarding technologies used for handling BOG in other
applications. This include equipment used on ships transporting LNG, LNG terminals and filling stations.
The benchmarking have also included technologies used on trucks to perform other duties than
handling BOG. This include both technologies of today, like burners for instance. It also include
research material about TEG and fuel cells, which might be used in the future.
An important aspect found during this part of the project, has been to try to use equipment already
on the truck. Since additional costs and weight are to be avoided, it is a great opportunity to use
technology already fitted to the truck and which costs already are accepted by the customers. This
made it suitable to divide the generation of concepts into presently feasible concepts and solutions for
the future, due to that some technologies are plausible to be fitted to trucks in the future.
The level of description of the different transformation system, or rather the technologies included
within the transformation systems, differs a bit from each other. This is due to the level of complexity
within the technologies and how much the reader might know in advance, which is estimated. The
amount of knowledge about each technology is important, both to eliminate alternatives as well as
generate concepts. The knowledge about the technologies investigated have been deep enough to
DISCUSSION 04 JUNE 2015
PAGE | 67
understand the basic functions and limitations. Some technologies, like the steam cycle, are easy to
understand and each component is quite simple to grasp. The system limitations though, mostly
regarding how small those systems can be and still work properly, is hard to estimate without finding
any working examples.
10.3.3 Concept Generation The evaluation and elimination of ideas have been a continuous process during the function analysis,
which have generated a quite small amount of branches within the function-means-tree. It is obviously
good to have plenty of alternatives to generate concepts from, but to eliminate non promising
technologies is important as well. The generation of concepts have due to the small amount of
branches within the function-means-tree, been a quite easy task. To combine concepts, focus were
put on the functions of the full system. This was the only limit within this generating process and all
combinations that seem to work were combined, resulting in that all technologies still in the game
were integrated in at least one concept.
Once combined, further limitations with the systems were discovered. One example of this was the
amount of heat generated from the BOG, first revealed in Concept 1 but later on applicable for most
concepts were heat is transferred to the engine coolant. The amount of energy within the BOG is so
big that the engine and other components would get too hot if all energy was transferred to the coolant,
and the coolant itself would boil. This was further investigated by a simulation and concluded in an
additional cooler added to the system.
Another area of focus during the generation and evaluation of concepts have been safety. It has been
important not to generate any hot spots or areas, which makes the transfer of heat from the unit of
double importance. If the cooling capacity is too low, this would lead to an severe increase in
temperature and possible risks of fire. It has also been important to focus on the combustion emissions
and not to pollute the air in enclosed spaces like for instance on ferries more than necessary. A burner
generates less emissions than the combustion generated in an engine, which have been taken into
account during the process.
10.3.4 Concept Evaluation The goal with the evaluation process is to compare the concepts in a justified way, eliminate those less
promising and finally chose one or more concepts to recommend. More knowledge about a concept
or technology will create a better base for evaluation and decisions to be made upon. To be able to
compare concepts to each other, the knowledge and level of descriptions have to be quite equal
among the different alternatives. If the differences are too big or the knowledge within the area is too
low, the decisions will be hard to make and based on too many uncertainties. Some concepts for the
future have not been eliminated, although more knowledge is needed for decisions to be based upon.
These concepts are based on technologies that need further development and investigation, but as for
today they look promising.
As mentioned previously, it is good to use technology that already are integrated to the trucks. This
could for instance be TEG, SOFC and auxiliary burner/heater. If technology that already are integrated
on the truck is used, fewer, lighter and less weight would be added to the truck. This would also fulfil
several ideal values within the list of demand specifications, as no or less equipment would have to be
fitted to the trucks, just to deal with the BOG.
DISCUSSION 04 JUNE 2015
PAGE | 68
10.4 Engineering Ethics LNG is a better fuel than diesel, from an environmental perspective. It has less GHG emissions and the
truck can therefore drive a longer range with the same amount of emissions. It is important for
engineers to work in projects that develops technologies to be more environmental friendly and more
sustainable. Today, humans consume more resources than the earth can manage in the long run. This
means that something has to be done right now, or it could be too late to act and we could ruin the
planet we live on. By develop resource effective technologies, the engineers could turn that negative
trend and make our living sustainable.
LNG is still a fossil fuel and is therefore not a long term sustainable fuel. LNG could work as a
springboard for biogas, which is a renewable and sustainable fuel. It does not matter if the LNG trucks
is fuelled by LNG or LBG, since they have the same composition and are fully compatible. Therefore
will the changeover to biogas be pretty uncomplicated.
The solution for handling BOG has been developed with good intentions, but it is hard to foresee future
events that this solutions might have effect on. The solution could affect the ambient positively as well
as negatively. If the solution, during its lifetime in the end releases more GHG by being heavy and
increase the consumption of fuel, than by releasing BOG, that would be really negative result for the
project.
As mentioned above, it is more important to focus on the environmental aspect rather than earning
money on the solution. This shows an important ethical aspect of this project. For solutions to be fully
sustainable, they need to be sustainable both regarding environmental, economic and social aspects.
A trigger to generate solutions less profitable but that improves environmental aspects, is regulations.
This is an important trigger for this project, but the environment in itself is also an important trigger.
It would be good if the less environmental friendly products were more expensive, and the profit from
these products were used to develop more environmental friendly options. If the environmentally
friendly products is much more expensive than the less environmental friendly, fewer would buy the
environmental friendly.
The project has in addition to environmental aspects also been focusing on working environment,
ergonomics and safety, during the development process. These areas are crucial to get the customers
satisfied. The customers do not want to change their behaviour in a negative way, just because of a
new component on the truck. The safety is important so that the solution can be used in all different
scenarios and not to generate any hazards.
Scania has sensitive information, which has been respected during this project. It is important for
engineers to work in accordance to the company’s rules for information dissemination and to respect
competition among companies. It is especially important during a project like this, not write any
sensitive information in the report, since it is being published.

CONCLUSION AND RECOMMENDATIONS 04 JUNE 2015
PAGE | 69
11 Conclusion and Recommendations This section starts off by concluding the project by answering the questions of research. The concept
recommended to implement in the near future is then presented, as well as other options that might
be possible to implement in the long run. Finally, it is presented how Scania should focus their future
work within this subject.
11.1 Conclusion This section targets the question stated in section 1.3.1, concluding the project and answering these
question in a summarised manner.
11.1.1 In What Situations do the Release of BOG Occur, During the Lifecycle of Trucks? The first thing to note is that the release of BOG should never, in a perfect world, occur during the
lifecycle of a truck. These type of trucks should run frequently enough, especially when LNG is used.
These trucks are more expensive to buy and usually have lower mileage costs. They therefore need to
run more, compared to diesel trucks, to give return to the higher investment of buying these trucks.
Statistics and experiences from people within the business point towards high mileage on these trucks,
but occasionally standstill might occur due to several reasons, e.g. vacations or breakdowns.
Statistics also show, apart from that many trucks run more than enough to avoid the release of BOG,
that there also are periods of lower running hours. There seem to be, not to surprisingly, less running
hours during periods of vacations. This is a matter of how the transport companies manage their
vacations, but it seems to be not that rear of a phenomenon. This could be a case where BOG is
released, happening at least once or twice a year. Statistics also show that for service workshop work
orders, about 5-6 % are still not finished after five days. This is a quite significant number, which might
vary depending on the region, where BOG could be released.
Another aspect, where the release of BOG might not happen but if did it could lead to disasters, is
during transports on ferries. This has turned in to a really important area of focus, as there has to be
guarantees of no release of combustible gases during these scenarios. Also, during delivery from
factory to customer contain extensive periods of standstill. This only happens once in the lifecycle of
the truck, but could extend through months. The interest of this case depends on whether the tank is
filled with LNG or not.
Sure, as for today mostly people with interest in alternative fuel buy these trucks, they are probably
well managed and run a lot. On the other hand, it seems that among people within the transport
industry, the release of natural gas into the atmosphere does not seem to be treated as a problem or
an issue. It rather seem like a good feature using gas, that it escapes up into the atmosphere when
released and that the problem therefore disappears. When LNG becomes more and more common,
additional trucks will be standstill as well, especially when LNG get more mainstream to use as fuel. If
these trucks are managed properly, BOG can be avoided. There cannot be any guarantees that these
trucks are managed in a perfect way or that occasions of standstill occur due to unforeseen failure.
11.1.2 Which Economic and Environmental Benefits do Utilisation of BOG Bring? If the BOG where to be saved, using a re-liquefaction process, this would use about 0.15 kWh/kg of
gas during the re-liquefaction process. This could be compared to the energy content of about
17 kWh/kg of gas. A certain amount of gas could therefore be re-liquefied more than 100 times without
using as much energy as in the gas itself. This demonstrates a severe economic as well as
environmental benefit, if the gas could be stored and utilised for its proper purpose.
CONCLUSION AND RECOMMENDATIONS 04 JUNE 2015
PAGE | 70
With respect to what the users of the trucks are willing to pay and what technologies are presently
usable, the easiest and most economical way of handling the gas is to burn it in a controlled process.
Doing this in a controlled way could be achieved by distributing the heat generated through the trucks
coolant system. The heat is then distributed to engine components and an additional cooler, utilising
some of the heat to keep the engine warm until next start up, as well as cooling off excess heat to
prevent the system from overheating.
There are several technologies of interest for future applications, especially if these technologies
already are fitted to the truck for other reasons which would be economically beneficial. This could for
instance be applications for TEG, utilising the heat from within the exhaust gases, but which also can
be used to utilise the heat generated while burning BOG, to generate electricity.
11.1.3 In Which Ways can BOG be Handled, in an Cost Efficient and Environmentally Friendly
Way? Since most transportation companies do not see the release of BOG as an issue, as it should rarely
occur, the interest from their part to invest in additional equipment is low. Also, the low costs for
released BOG per day of about 11 € will not be an high enough economic motive for an expensive
investment of additional equipment. This implies that the solution by which to solve this issue of
releasing BOG, should be as cheap as possible. The best option would be to use as much equipment
already fitted to the truck as possible, both to keep costs low and also not to add any extra weight to
the truck.
The BOG in itself could either be stored or consumed, to avoid the release into the atmosphere and
the severe effect this has to the environment. Methane is a GHG, many times worse than carbon
dioxide, which is described in section 3.4. Consuming it, turning it into carbon dioxide instead, reduces
the GWP a lot and thereby reduces the effect on the environment.
To guarantee no BOG is released and by this fulfilling regulations expected to be implemented in the
future, there has to be a limitless capacity to the system. Storing the gas will always be the most
efficient option, since the most obvious customer needs is to use the gas for its intended purpose, i.e.
propelling the truck forward. This though, has to be made by cost and weight efficient equipment,
supplied by energy either from the gas itself or from an external energy source. It is not a sustainable
solution to consume energy from the batteries on the truck, since this has a limited lifespan and
consumes more fuel during re-charging while the trucks is driven.
There might be customer needs to fulfil not related to the truck itself, which provides the possibility of
connecting the truck to external standalone equipment, to for instance utilise the gas for heating other
facilities. This might be a good complement to the equipment mounted to the truck, where truck
manufacturers fit their vehicles with a possibility to connect standalone equipment for storing or
consuming this gas externally. These equipment could be built to utilise the resource more effectively
and . Since standstill lasting several days, needed for BOG to be released, most likely occur by the
transportation companies own facilities, this seem like a promising option.
11.1.4 How Could Concepts for Handling BOG from LNG Trucks Look Like? Due to that guarantees has to be made of no released BOG, equipment has to be fitted to the truck for
this to be possible in every instance. In combination with this being a compact, light and cheap system,
the possibility of compressing and storing gas on the truck is excluded as an option of storing the gas.
Re-liquefying the BOG and transfer it back to the regular LNG tank is a better option, which is a
suggested concept for future implementation.
CONCLUSION AND RECOMMENDATIONS 04 JUNE 2015
PAGE | 71
The second best option, after storing and saving the resource, is to consume the gas making it less
unfriendly to the environment. While consuming the gas on the truck, the resources should be utilised
as much as possible. The best option would be to generate both electricity and heat, making the system
as efficient as possible. Another aspect of distributing the energy rather than just using a flare, is the
risk severe heat concentrations creating risks of fire to occur and spread.
The concepts recommended for handling the BOG is presented in section 11.2, below.
11.2 Concept Recommendation The recommendation consists of four different possibilities. The first is to avoid the release of BOG all
together, by having knowledge about when it occurs and how to avoid it. These trucks should for
example only be used in applications with high amount of usage, all year around. Avoiding and
minimising the release of BOG is essential to using LNG in a resource efficient way, and should
therefore be the primary target independent of what other solutions for handling BOG are available.
The second option is to utilise the heat generated form the BOG, in this case to be distributed to the
system of engine coolant, which is the simplest and most promising solution right now. Only
generating heat is not an optimal long term solution, since it uses electric energy during the
distribution process. This should therefore be combined with the generating of electricity from the
BOG, when these recommended technologies are further developed. This reduces the need of power
from external sources or the batteries, during the working process of the equipment. The fourth and
most promising option, is to re-liquefy the BOG into LNG on the truck. This is the most resource
efficient option, apart from avoiding the release of BOG all together.
11.2.1 Presently Feasible Solutions Concept 1, gas burner heating the engine coolant, is to be recommended for Scania to implement on
their trucks right now. This is the concept most promising to work on the truck for the moment, both
economically and technically. Using a gas burner is quite simple, and the technology already exists on
diesel trucks and gas buses. The system for distributing heat is already developed for trucks, used by
the auxiliary heater running on diesel. An additional cooler with an electric fan also has to be added,
but has also been used before on Scania trucks. This concept is further described in section 8.3.1.
11.2.2 Future Solutions This project has generated three promising technologies: SOFC, TEG and re-liquefaction, to look further
into as future options for utilising BOG. Two of these are technologies for generating electricity from
the BOG. An important aspect of which one of these to implement, as mentioned before, is to use as
much technologies as possible already on the truck. Hence, if TEG or SOFC are implemented for other
reasons, these could be utilised for handling BOG as well.
The most energy efficient solution is concept 8, re-liquefy the BOG on the truck. The re-liquefaction
concept is described in section 8.4.4. This is a technique used in other applications, like terminals and
LNG shipments, but could in much smaller scale be applicable on trucks. Once re-liquefied, the LNG is
transferred back to the regular LNG tanks, saving the fuel altogether.
11.3 Future Studies Since this project is a pre-study for further developing of handling the BOG, there are several tasks left
before the concept can be implemented on the truck. Further investigations on how much boil-off is
generated, as well as how these could be avoided in the first place, should be performed.
Regarding the burner, it is especially important to find a supplier for a gas burner of the desired size.
Further simulations also have to be made, to investigate the additional coolers capacity, or if other

CONCLUSION AND RECOMMENDATIONS 04 JUNE 2015
PAGE | 72
solutions might be possible. The amount of electricity used by the equipment needed in relation to the
capacity of the trucks batteries, is also a subject of further investigations. A lot of knowledge already
exist within Scania regarding auxiliary heaters, which makes cooperation among these groups essential.
For the future concepts it is important to keep an eye on and accelerate the development process of
these technologies. Several technologies, including fuel cells and TEG are developed with other
intentions within the industry of vehicles. Development of these systems, as ways of utilising BOG
should be completed in parallel with the use of these technologies for other applications. For the
concept re-liquefy the BOG on the truck, Scania should start discussing possible solutions with
suppliers carrying these kinds of equipment, making this equipment smaller, suitable for trucks. It is
not seen as realistic to develop this system in-house and since this is a widely spread technology,
several suppliers might be of interest for future cooperation.

REFERENCES 04 JUNE 2015
PAGE | 73
References Abu Bakar, W. A. W. & Ali, R., 2010. Natural Gas. In: P. Potocnik, ed. Natural Gas. Skudai: Sciyo, pp. 1-
39.
AGA, 2015. LNG Datablad - Bron till biogassamhället.. [Online]
Available at:
http://www.aga.se/internet.lg.lg.swe/sv/images/AGA%20LNG%20Datasheet%20SE586_137972.pdf
[Accessed 21 januari 2015].
Améen, J., 2015. Ecolution by Scania, Scania-Bilar Sverige AB [Interview] (20 April 2015).
Anton, N., 2015a. Market Prepared - Workshop manual GAS Euro 6. Södertälje, Scania CV AB.
Anton, N., 2015b. Method Engineer, Scania CV AB [Interview] (2 March 2015b).
Arteconi, A., Brandoni, D., Evangelista, F. & Polonara, F., 2009. Life-cycle greenhouse gas analysis of
LNG as a heavy vehicle fuel in Europe. Applied Energy, 13 November, pp. 2005-2013.
Bindekrans, G., 2015. Back office Process Engineer, Scania CV AB [Interview] (9 February 2015).
Björklund, M. & Paulsson, U., 2003. Seminarieboken - att skriva, presentera och opponera. 10th ed.
Lund: Studentlitteratur.
Borgmalm, F., 2015. Flow Control Developer, Scania CV AB [Interview] (13 February 2015).
Cengel, Y. A., Turner, R. H. & Cimbala, J. M., 2008. Fundamentals of Thermal-Fluid Science. 3rd ed.
New York: McGraw-Hill.
Chart, 2015. chartparts.com. [Online]
Available at: http://literature.chart-ind.com/ProductDetail.aspx?Id=626
[Accessed 28 January 2015].
Charuphan, P., 2015. Fordonsansvarig Svebol Logistics [Interview] (25 February 2015).
Choudhury, A., Chandra, H. & Arora, A., 2013. Application of solid oxide fuel cell technology for
power generation - A review. Renewable and Sustainable Energy Reviews, 11 January, pp. 430-442.
Dellrud, J., 2015. Senior Technical Advisor, Pre-development, Scania CV AB [Interview] (31 March
2015).
Eberspächer, 2015. eberspaecher-na.com. [Online]
Available at: http://www.eberspaecher-na.com/business-units/fuel-operated-heaters/product-
selection/coolant-heaters.html
[Accessed 8 April 2015].
ECE R110, 2014. Addendum 109: Regulation No. 110 - Concerning the Adoption of Uniform Technical
Prescriptions for Wheeled Vehicles, Equipment and Parts.... Revision 3 ed. Geneve: United Nations.
Ejvegård, R., 2009. Vetenskaplig metod. 4th ed. Lund: Studentlitteratur.
Engineering Toolbox, 2015. Fuels and Chemicals - Autoignition Temperatures - Engineering Toolbox.
[Online]
Available at: http://www.engineeringtoolbox.com/fuels-ignition-temperatures-d_171.html
[Accessed 4 May 2015].

REFERENCES 04 JUNE 2015
PAGE | 74
Eriksson, J., 2015b. LNG Sourcing Manager, AGA [Interview] (25 March 2015b).
Eriksson, L. T. & Wiedersheim-Paul, F., 2008. Att utreda, forska och rapportera. 8th ed. Lund: Liber.
Eriksson, T., 2015. LNG - Scania. Södertälje, AGA.
Everatt, G., 2015. Development Engineer, Climate Systems, Scania CV AB [Interview] (13 April 2015).
Fritzson, F., 2015. Senior Engineer, Engine Optimization Otto, Scania CV AB [Interview] (28 April
2015).
geology.com, 2015. geology.com. [Online]
Available at: http://geology.com/rocks/shale.shtml
[Accessed 02 June 2015].
GMZ Energy, 2012. Nanostructured High Temperature Bulk Thermoelectric Energy Conversion for
Efficient Waste Heat Recovery. Baltimore, 2012 DOE 3rd Thermoelectrics Applications Worshop.
Henghlein, A., 1984. Sonolysis of Carbon Dioxide, Nitrous Oxide and Methane in Aqueous Solution,
Berlin: Hahn-Meitner-Institut für Kernforschung Berlin.
Henryson, K., 2015. Senior Engineer, Certifications, Scania CV AB [Interview] (16 February 2015).
Hällqvist, T., 2015. Senior Engineer, Operational Preformance, Scania CV AB [Interview] (24 March
2015).
Hörnquist, M., 2015. Sjöingenjör och handläggare fartygstekniska frågor, Transportstyrelsen
[Interview] (11 03 2015).
IPCC, 2013. Intergovernmental Panel on Climate Change - Climate Change 2013, New York:
Cambridge University Press.
Johannesson, H., Persson, J.-G. & Pettersson, D., 2013. Produktutveckling - effektiva metoder för
konstruktion och design. 2nd ed. Stockholm: Liber AB.
Johansson, S., 2015a. Market Prepared - LNG. Södertälje, Scania CV AB.
Johansson, U., 2015b. VD Götene Kyltransporter [Interview] (25 February 2015b).
Kern, E., 2015. Business Development Manager; LNG Vehicle Fuel Systems, Chart Industries
[Interview] (18 February 2015).
Kumar, S. et al., 2011. LNG: An eco-friendly cryogenic fuel for sustainable development. Applied
Energy, 21 June, Volume 88, pp. 4264-4273.
Kylefors, B., 2015. Simulation of heat radiation from the engine, Scania CV AB [Interview] (13 April
2015).
L'Air Liquide, 2015. Gas Encyclopedia. [Online]
Available at: http://encyclopedia.airliquide.com/Encyclopedia.asp?GasID=41
[Accessed 27 January 2015].
Lantz, A., 2007. Intervjumetodik. 2nd ed. Lund: Studentlitteratur.
Larsson, P., 2015. FFU Design Support, Bodywork Engineering, Scania CV AB [Interview] (23 February
2015).

REFERENCES 04 JUNE 2015
PAGE | 75
Lechner, W., 2002a. Method for disposing of boil-off gas from a cryogenic tank and motor vehicle
operating with sais method. Germany, Patent No. WO2003062698 A1.
Lechner, W., 2002b. Motor vehicle comprising a cryotank. Germany, Patent No. WO2003062005 A1.
Lechner, W., 2004. Device for converting boil-off gas of cryogenic fuel tank has transport device for
combustion air required for conversion process and/or heater for line carrying cryogenic fuel and/or
boil-off gas provided as electric load. Germany, Patent No. DE102004045267 A1.
Liedholm, U., 1999. Systematisk konceptutveckling, Linköping: Avdelningen för Maskinkonstruktion,
Linköpings universitet.
Lindqvist, M., 2015. Delivery Planner, Scania CV AB [Interview] (13 February 2015).
Milione, D., 2015. Product Manager, Alternative Fuels, Sales and Market, Scania CV AB [Interview]
(09 February 2015).
NGVA, 2014. Natural & bio Gas Vehicle Association. [Online]
Available at: http://www.ngvaeurope.eu/downloads/statistics/20141007/europe/4_comparison-of-
fuel-prices-in-europe.xlsx
[Accessed 04 March 2015].
Nordling, C. & Österman, J., 2006. Physics Handbook for Science and Engineering. 8th ed. Lund:
Studentlitteratur AB.
Näslund red., M., 2006. LNG i Sverige. 1st ed. Lund: Inst. för Energivetenskaper, LTH.
Oliver, L. C. & Khaled, L., 2010. Natural gas: physical properties and combustion features. In: P.
Potocnik, ed. Natural gas. Nantes: Sciyo, pp. 40-71.
Palmqvist, J., 2015. Product manager, Alternative Fuels, Sales and Marketing, Scania CV AB
[Interview] (03 February 2015).
Persson, D., 2015. Product Planning Manager, Hybrid & Alternative fuel, Sales and Market, Scania CV
AB [Interview] (20 April 2015).
Sàez, A., 2010. Industrial application of natural gas. In: P. Potocnik, ed. Natural Gas. Viña del Mar:
Sciyo, pp. 245-271.
Scania CV AB, 2015a. Environmental Product Declaration Calculator - Scania.com. [Online]
Available at: http://se.scania.com/produkter-och-
tjanster/lastbilar/environment/epd2/calculator.aspx
[Accessed 20 April 2015].
Scania CV AB, 2015b. Scania Image Archive. [Online]
Available at: https://scaniaimagearchive.scania.com/fotoweb/
[Accessed 06 May 2015].
Spheros, 2015. www.spheros.eu. [Online]
Available at: http://www.spheros.eu/Products/Heating-systems/GBW-300.html
[Accessed 14 04 2015].
SS-EN ISO 15403-1:2008, 2008. Natural gas - Natural gas for use as a compressed fuel for vehicles.
Stockholm: SIS.

REFERENCES 04 JUNE 2015
PAGE | 76
Stojanovic, Z., 2015. Product manager, Alternative Fuels, Sales and Marketing, Scania CV AB
[Interview] (09 February 2015).
Swedish Environmental Protection Agency, 2012. Swedish Environmental Protection Agency Report
6518. [Online]
Available at: http://www.naturvardsverket.se/Documents/publikationer6400/978-91-620-6518-
8.pdf?pid=3827
[Accessed 28 January 2015].
Swedish Environmental Protection Agency, 2015a. Swedish Environmental Protection Agency -
Carbon dioxide equvalents. [Online]
Available at: http://www.naturvardsverket.se/Sa-mar-miljon/Statistik-A-O/Vaxthusgaser--utslapp-av-
svensk-konsumtion/Koldioxidekvivalenter/
[Accessed 21 januari 2015].
Swedish Environmental Protection Agency, 2015b. Swedish Environmental Protection Agency - Fossil
fuels. [Online]
Available at: http://www.naturvardsverket.se/Miljoarbete-i-samhallet/Miljoarbete-i-
Sverige/Uppdelat-efter-omrade/Energi/Fossila-branslen/
[Accessed 22 April 2015].
Svensson, J., 2014. Scania Cert. drawing gas engine truck, 2406840. Södertälje: Scania CV AB.
The de Bono Group, 2015. www.debonogroup.com. [Online]
Available at: http://www.debonogroup.com/six_thinking_hats.php
[Accessed 10 03 2015].
Thenander, M., 2015. Design Engineer, Customised Truck Department, Scania CV AB [Interview] (1
April 2015).
Tilly, D., 2015. Vehicle Application Manager Distribution, Operational Preformance, Scania CV AB
[Interview] (17 April 2015).
Tunestål, P. et al., 2007. Gasdrift av fordon. 1st ed. Malmö: Svenskt Gastekniskt Center AB.
Udaeta, M., Bernal, J., Burani, G. & Grimoni, A., 2010. Looking for clean energy considering LNG
assessment to provide energy security in Brazil and GTL from Bolivia natural gas reserves. In: P.
Potocnik, ed. Natural Gas. São Paulo: Sciyo, pp. 333-371.
Ullman, D. G., 2010. The Mechanical Design Process. Fourth ed. New York: McGraw-Hill.
Ulrich, K. T. & Eppinger, S. D., 2000. Product design and development. 2nd ed. New York: The
McGraw-Hill companies.
UNFCCC, 2014. United Nations Framework Convention on Climate Change - GWP. [Online]
Available at: http://unfccc.int/ghg_data/items/3825.php
[Accessed 5 February 2015].
Wikhede, K. & Berglund, O., 2015. Retail development manager, Scania CV AB [Interview] (13
February 2015).
Viksten, J., 2014. Internal report, Södertälje: Scania CV AB.
Örning, C., 2015. Development engineer, Climat Systan and Auxiliary Heater, Scania CV AB [Interview]
(27 March 2015).
INDEX 04 JUNE 2015
PAGE | 77
Index
6-3-5 method, 9
Benchmarking, 10
Black box, 9
Boil-off, 17
Brainstorming, 9
Carbon Dioxide Equivalents, CO2,eq, 19
Compressed Biogas, CBG, 18
Compressed Natural Gas, CNG, 16
Construction, 22
Cryogenics, 17
Distribution, 21
Economiser, Auto Refrigeration Regulator, 25
Functions-means-tree, 11
Gas panel, 24
Gas preparation components, 24
Global Warming Potential, GWP, 19
Greenhouse gases, GHG, 19
House of Quality, 8
Ignition temperature, 16
Knock rating, 16
LCNG, LCNG filling station, 39
Lean mixture, 16
Liquefied Biogas, LBG, 18
Liquefied natural gas, LNG, 17
LNG-SSL, 17
LNG-TER, 17
Long-haulage, 21
Main functions, 9
Methane number, 16
Octane number, 16
Public and Special, 22
Regulation No. 110, R110, 28
Rich mixture, 16
Six thinking hats, 10
Solid Oxide Fuel Cell, SOFC, 43
Sub-functions, 11
Super-insulated tanks, 17
Technical principles, 9
Thermal electricity generation, TEG, 42
Transformation functions, 11
Transformation system, 10
Ullage tank, 24
Wobbe index, 16

INDEX 04 JUNE 2015
PAGE | 78
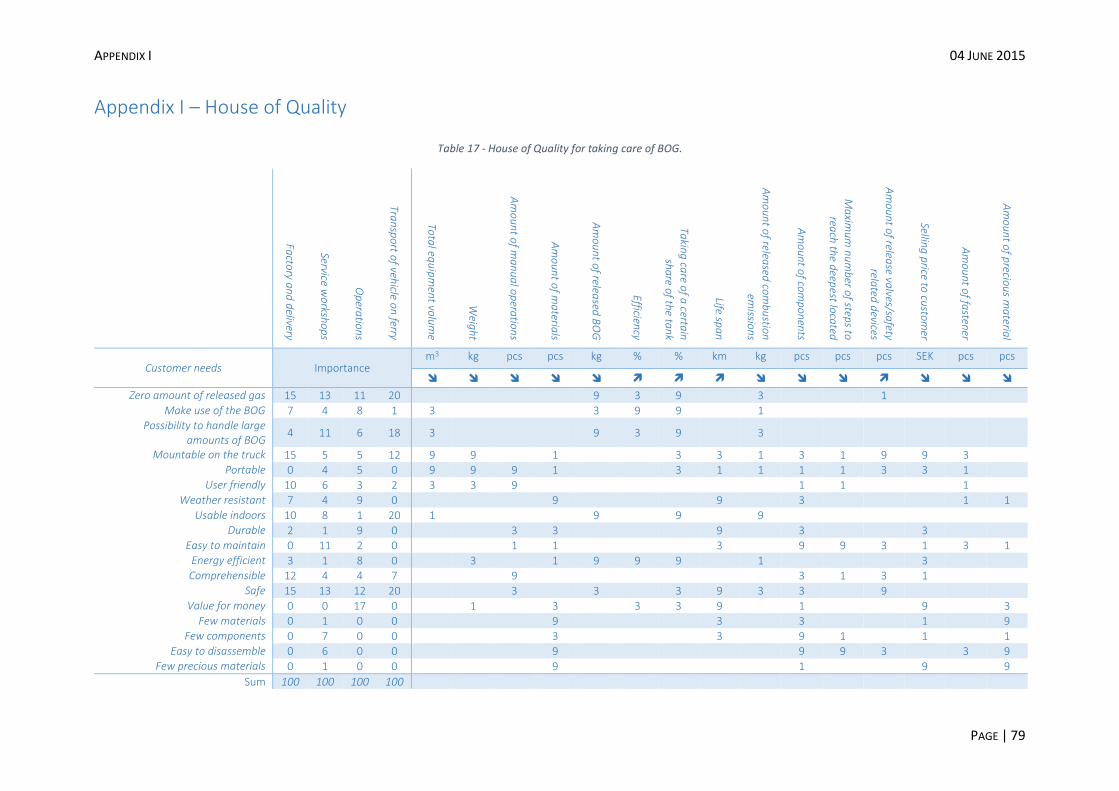
APPENDIX I 04 JUNE 2015
PAGE | 79
Appendix I – House of Quality
Table 17 - House of Quality for taking care of BOG.
Facto
ry an
d d
elivery
Service wo
rksho
ps
Op
eratio
ns
Tran
spo
rt of veh
icle on
ferry
Tota
l equ
ipm
ent vo
lum
e
Weig
ht
Am
ou
nt o
f ma
nu
al o
pera
tion
s
Am
ou
nt o
f ma
terials
Am
ou
nt o
f released
BO
G
Efficiency
Takin
g ca
re of a
certain
sha
re of th
e tan
k
Life spa
n
Am
ou
nt o
f released
com
bu
stion
em
ission
s
Am
ou
nt o
f com
po
nen
ts
Ma
ximu
m n
um
ber o
f steps to
reach
the d
eepest lo
cated
com
po
nen
t
Am
ou
nt o
f release va
lves/safety
related
devices
Selling
price to
custo
mer
Am
ou
nt o
f fasten
er
Am
ou
nt o
f precio
us m
ateria
l
Customer needs Importance m3 kg pcs pcs kg % % km kg pcs pcs pcs SEK pcs pcs
Zero amount of released gas 15 13 11 20 9 3 9 3 1
Make use of the BOG 7 4 8 1 3 3 9 9 1 Possibility to handle large
amounts of BOG 4 11 6 18 3 9 3 9 3
Mountable on the truck 15 5 5 12 9 9 1 3 3 1 3 1 9 9 3 Portable 0 4 5 0 9 9 9 1 3 1 1 1 1 3 3 1
User friendly 10 6 3 2 3 3 9 1 1 1 Weather resistant 7 4 9 0 9 9 3 1 1
Usable indoors 10 8 1 20 1 9 9 9 Durable 2 1 9 0 3 3 9 3 3
Easy to maintain 0 11 2 0 1 1 3 9 9 3 1 3 1 Energy efficient 3 1 8 0 3 1 9 9 9 1 3 Comprehensible 12 4 4 7 9 3 1 3 1
Safe 15 13 12 20 3 3 3 9 3 3 9 Value for money 0 0 17 0 1 3 3 3 9 1 9 3
Few materials 0 1 0 0 9 3 3 1 9 Few components 0 7 0 0 3 3 9 1 1 1
Easy to disassemble 0 6 0 0 9 9 9 3 3 9 Few precious materials 0 1 0 0 9 1 9 9
Sum 100 100 100 100
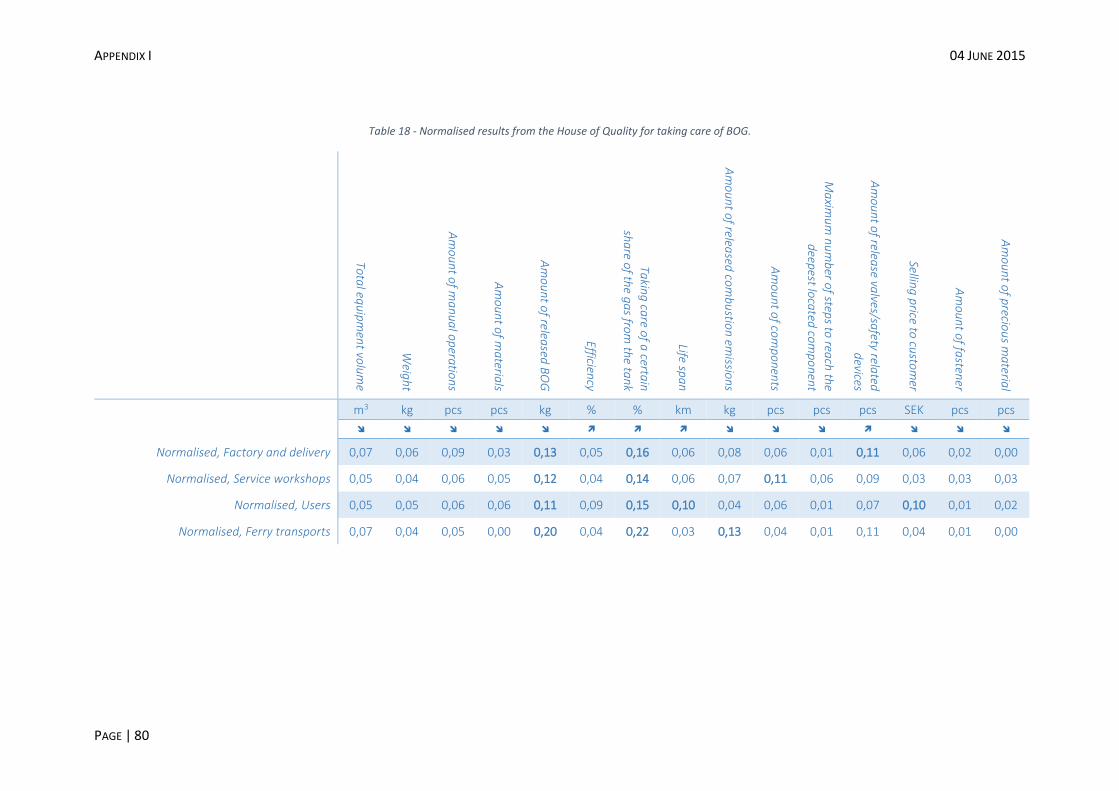
APPENDIX I 04 JUNE 2015
PAGE | 80
Table 18 - Normalised results from the House of Quality for taking care of BOG.
Tota
l equ
ipm
ent vo
lum
e
Weig
ht
Am
ou
nt o
f ma
nu
al o
pera
tion
s
Am
ou
nt o
f ma
terials
Am
ou
nt o
f released
BO
G
Efficiency
Takin
g ca
re of a
certain
sha
re of th
e ga
s from
the ta
nk
Life spa
n
Am
ou
nt o
f released
com
bu
stion
emissio
ns
Am
ou
nt o
f com
po
nen
ts
Ma
ximu
m n
um
ber o
f steps to
reach
the
deep
est loca
ted co
mp
on
ent
Am
ou
nt o
f release va
lves/safety rela
ted
devices
Selling
price to
custo
mer
Am
ou
nt o
f fasten
er
Am
ou
nt o
f precio
us m
ateria
l
m3 kg pcs pcs kg % % km kg pcs pcs pcs SEK pcs pcs
Normalised, Factory and delivery 0,07 0,06 0,09 0,03 0,13 0,05 0,16 0,06 0,08 0,06 0,01 0,11 0,06 0,02 0,00
Normalised, Service workshops 0,05 0,04 0,06 0,05 0,12 0,04 0,14 0,06 0,07 0,11 0,06 0,09 0,03 0,03 0,03
Normalised, Users 0,05 0,05 0,06 0,06 0,11 0,09 0,15 0,10 0,04 0,06 0,01 0,07 0,10 0,01 0,02
Normalised, Ferry transports 0,07 0,04 0,05 0,00 0,20 0,04 0,22 0,03 0,13 0,04 0,01 0,11 0,04 0,01 0,00
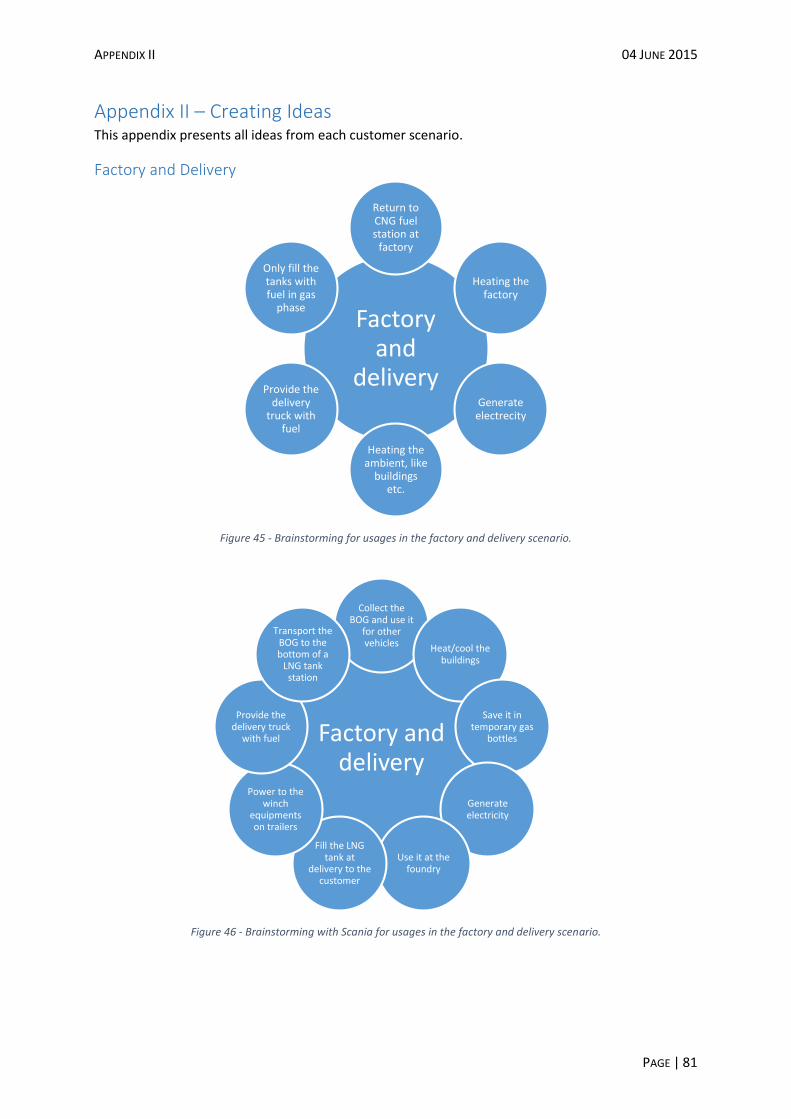
APPENDIX II 04 JUNE 2015
PAGE | 81
Appendix II – Creating Ideas This appendix presents all ideas from each customer scenario.
Factory and Delivery
Figure 45 - Brainstorming for usages in the factory and delivery scenario.
Figure 46 - Brainstorming with Scania for usages in the factory and delivery scenario.
Factory and
delivery
Return to CNG fuel station at
factory
Heating the factory
Generate electrecity
Heating the ambient, like
buildings etc.
Provide the delivery
truck with fuel
Only fill the tanks with fuel in gas
phase
Factory and delivery
Collect the BOG and use it
for other vehicles Heat/cool the
buildings
Save it in temporary gas
bottles
Generate electricity
Use it at the foundry
Fill the LNG tank at
delivery to the customer
Power to the winch
equipments on trailers
Provide the delivery truck
with fuel
Transport the BOG to the bottom of a
LNG tank station

APPENDIX II 04 JUNE 2015
PAGE | 82
Service Workshops
Figure 47 - Brainstorming for usages in the service workshops scenario.
Figure 48 - Brainstorming with Scania for usages in the service workshops scenario.
Service workshops
Heating the
buildings
Generate electricity
Use the cold
Return to a CNG
fuel station
Tools
Flare (portable)
Service workshops
Generate electricy to charge the batteries Save gas in
portable gas bottles
Empty the fuel to another LNG truck
when it arrive to the
workshop
Heating/cooling to the
building
Plug into the gas grid
Power other workshop equipment
Tank emptying equipment
Drive to the nearest tank station when changing tank
Standalone expanding
tank for collection of
BOG

APPENDIX II 04 JUNE 2015
PAGE | 83
Operations
Figure 49 - Brainstorming for usages during the operations scenario.
Figure 50 - Brainstorming with Scania for usages during the operations scenario.
Operations
Burn (mounted
on the truck)
Store (not re-
liquefaction)
Use the cold
Plug into a grid
Heat the cab
Generate electricity/
charge batteries
Re-liquefaction
Maintenan-ce bulletin that needs
heating
Engine heat
Operations
Collect the BOG and use it for other
vehiclesGenerate
electricity to charge the batteries
Cab heating/cooling
Customize the tank to handle
higher pressure
Heat the engine oil
Heat the engine coolant
Compress the BOG and save it on the truck
Re-liquefy the BOG on the
truck
Power a refrigeration
unit
Inflate a balloon for collection

APPENDIX II 04 JUNE 2015
PAGE | 84
Transport of Vehicle on a Ferry
Figure 51 - Brainstorming for usages in the transport of vehicle on a ferry scenario.
Figure 52 - Brainstorming with Scania for usages in the transport of vehicle on a ferry scenario.
Transport of vehicle on a ferry
Store the gas
Fuel the ferry
Heating/cooling of the ferry
Generate electricity
Burn
Cooling
Transport of vehicle on a ferry
Re-use the BOG on the
ferryCollect the BOG and return to
another gas using plant
Collect the BOG in a
balloon to release outside
Collect the BOG to use in
the truck
Collect and burn the BOG with a unit on
the ferry
A system on the truck that measures the holding time
Refrigerate the BOG with electricity that is connected to the truck
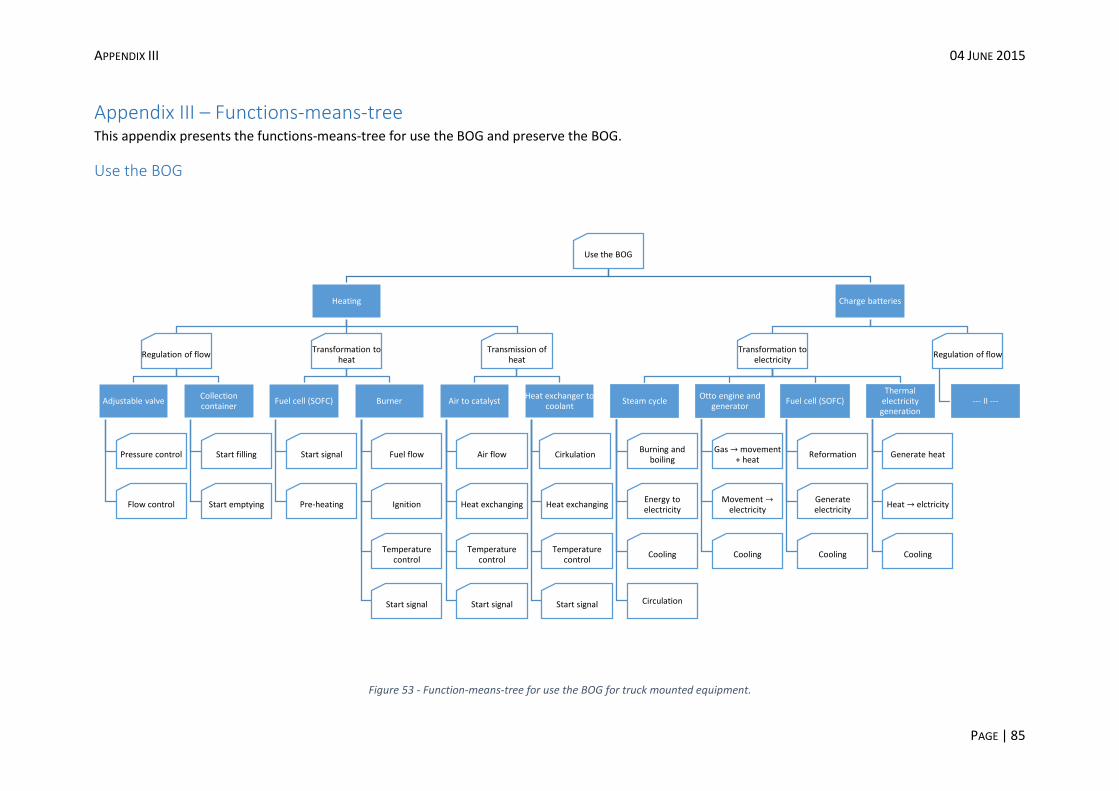
APPENDIX III 04 JUNE 2015
PAGE | 85
Appendix III – Functions-means-tree This appendix presents the functions-means-tree for use the BOG and preserve the BOG.
Use the BOG
Figure 53 - Function-means-tree for use the BOG for truck mounted equipment.
Use the BOG
Heating
Regulation of flow
Adjustable valve
Pressure control
Flow control
Collection container
Start filling
Start emptying
Transformation to heat
Fuel cell (SOFC)
Start signal
Pre-heating
Burner
Fuel flow
Ignition
Temperature control
Start signal
Transmission of heat
Air to catalyst
Air flow
Heat exchanging
Temperature control
Start signal
Heat exchanger to coolant
Cirkulation
Heat exchanging
Temperature control
Start signal
Charge batteries
Transformation to electricity
Steam cycle
Burning and boiling
Energy toelectricity
Cooling
Circulation
Otto engine and generator
Gas →movement + heat
Movement →electricity
Cooling
Fuel cell (SOFC)
Reformation
Generate electricity
Cooling
Thermal electricity generation
Generate heat
Heat → elctricity
Cooling
Regulation of flow
--- II ---
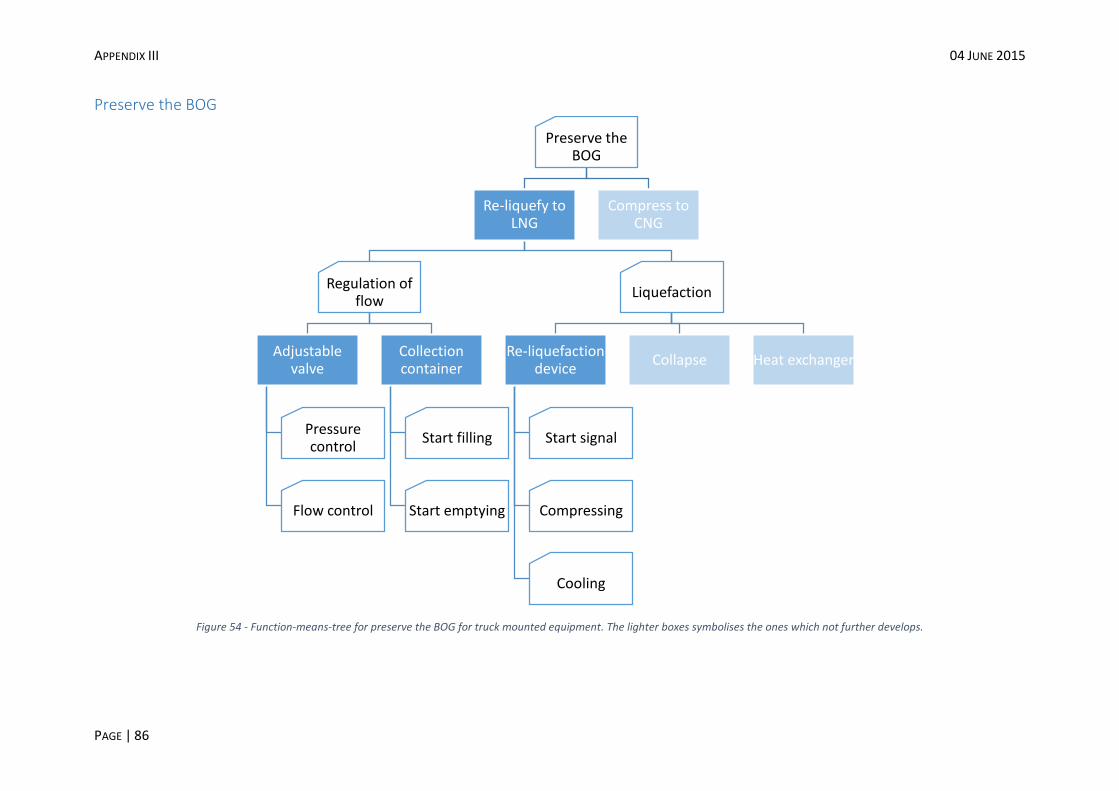
APPENDIX III 04 JUNE 2015
PAGE | 86
Preserve the BOG
Figure 54 - Function-means-tree for preserve the BOG for truck mounted equipment. The lighter boxes symbolises the ones which not further develops.
Preserve the BOG
Re-liquefy to LNG
Regulation of flow
Adjustable valve
Pressure control
Flow control
Collection container
Start filling
Start emptying
Liquefaction
Re-liquefaction device
Start signal
Compressing
Cooling
Collapse Heat exchanger
Compress to CNG
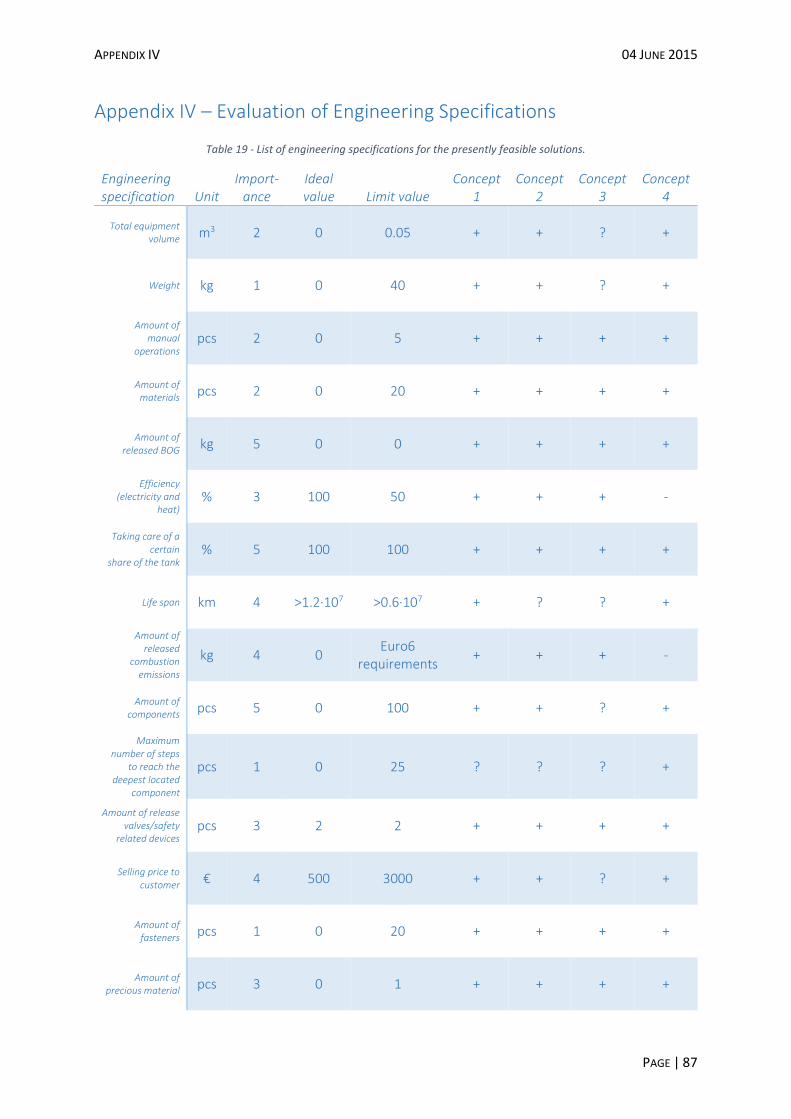
APPENDIX IV 04 JUNE 2015
PAGE | 87
Appendix IV – Evaluation of Engineering Specifications
Table 19 - List of engineering specifications for the presently feasible solutions.
Engineering specification Unit
Import-ance
Ideal value Limit value
Concept 1
Concept 2
Concept 3
Concept 4
Total equipment volume m3 2 0 0.05 + + ? +
Weight kg 1 0 40 + + ? +
Amount of manual
operations pcs 2 0 5 + + + +
Amount of materials pcs 2 0 20 + + + +
Amount of released BOG kg 5 0 0 + + + +
Efficiency (electricity and
heat) % 3 100 50 + + + -
Taking care of a certain
share of the tank % 5 100 100 + + + +
Life span km 4 >1.2·107 >0.6·107 + ? ? +
Amount of released
combustion emissions
kg 4 0 Euro6
requirements + + + -
Amount of components pcs 5 0 100 + + ? +
Maximum number of steps
to reach the deepest located
component
pcs 1 0 25 ? ? ? +
Amount of release valves/safety
related devices pcs 3 2 2 + + + +
Selling price to customer € 4 500 3000 + + ? +
Amount of fasteners pcs 1 0 20 + + + +
Amount of precious material pcs 3 0 1 + + + +
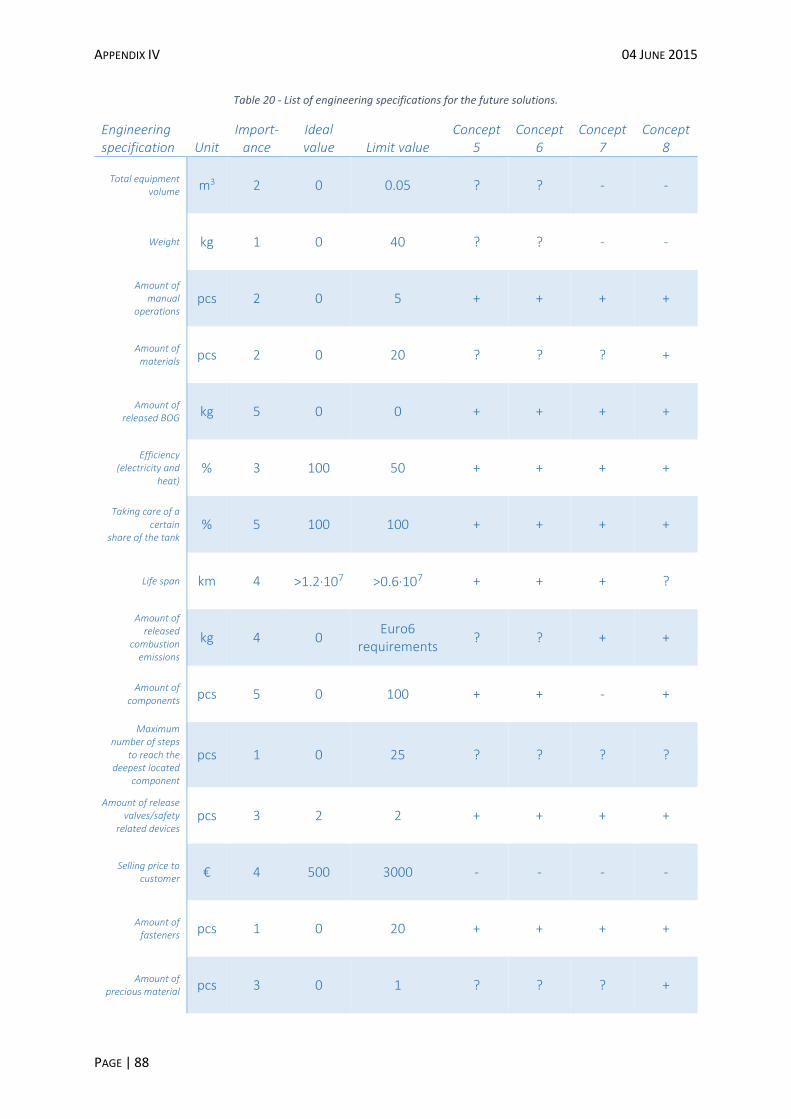
APPENDIX IV 04 JUNE 2015
PAGE | 88
Table 20 - List of engineering specifications for the future solutions.
Engineering specification Unit
Import-ance
Ideal value Limit value
Concept 5
Concept 6
Concept 7
Concept 8
Total equipment volume m3 2 0 0.05 ? ? - -
Weight kg 1 0 40 ? ? - -
Amount of manual
operations pcs 2 0 5 + + + +
Amount of materials pcs 2 0 20 ? ? ? +
Amount of released BOG kg 5 0 0 + + + +
Efficiency (electricity and
heat) % 3 100 50 + + + +
Taking care of a certain
share of the tank % 5 100 100 + + + +
Life span km 4 >1.2·107 >0.6·107 + + + ?
Amount of released
combustion emissions
kg 4 0 Euro6
requirements ? ? + +
Amount of components pcs 5 0 100 + + - +
Maximum number of steps
to reach the deepest located
component
pcs 1 0 25 ? ? ? ?
Amount of release valves/safety
related devices pcs 3 2 2 + + + +
Selling price to customer € 4 500 3000 - - - -
Amount of fasteners pcs 1 0 20 + + + +
Amount of precious material pcs 3 0 1 ? ? ? +
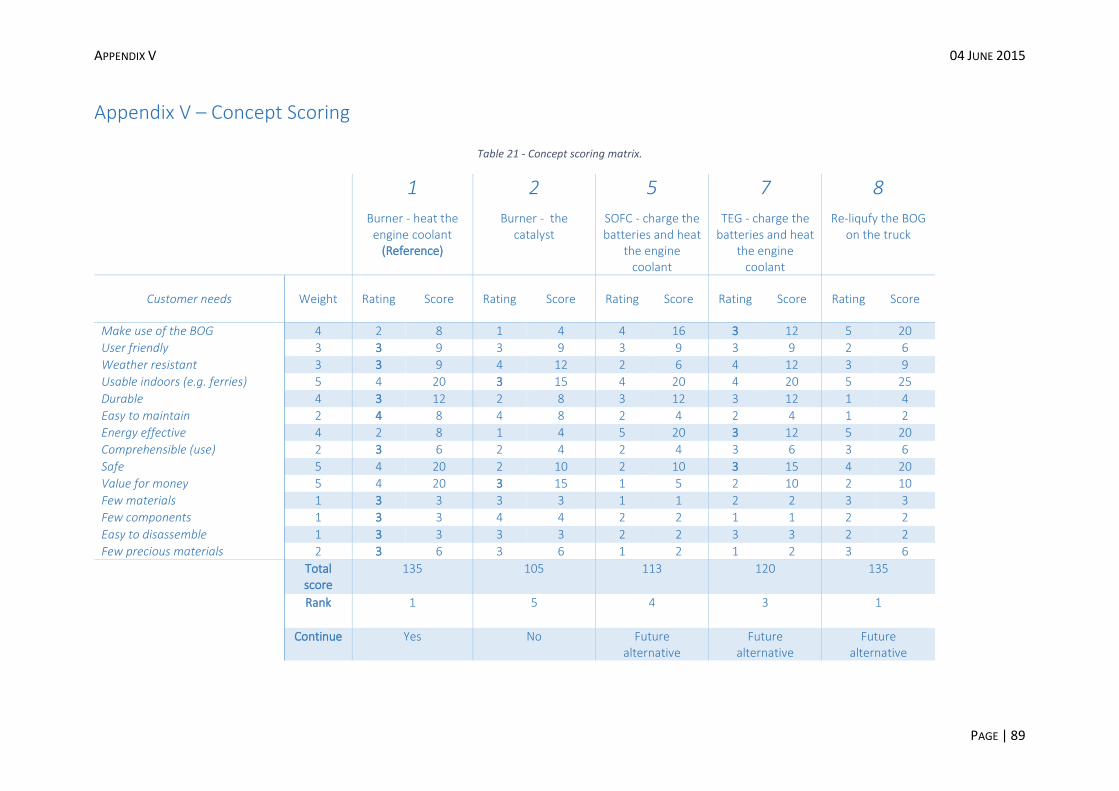
APPENDIX V 04 JUNE 2015
PAGE | 89
Appendix V – Concept Scoring
Table 21 - Concept scoring matrix.
1 2 5 7 8
Burner - heat the engine coolant
(Reference)
Burner - the catalyst
SOFC - charge the batteries and heat
the engine coolant
TEG - charge the batteries and heat
the engine coolant
Re-liqufy the BOG on the truck
Customer needs Weight Rating Score Rating Score Rating Score Rating Score Rating Score
Make use of the BOG 4 2 8 1 4 4 16 3 12 5 20
User friendly 3 3 9 3 9 3 9 3 9 2 6
Weather resistant 3 3 9 4 12 2 6 4 12 3 9
Usable indoors (e.g. ferries) 5 4 20 3 15 4 20 4 20 5 25
Durable 4 3 12 2 8 3 12 3 12 1 4
Easy to maintain 2 4 8 4 8 2 4 2 4 1 2
Energy effective 4 2 8 1 4 5 20 3 12 5 20
Comprehensible (use) 2 3 6 2 4 2 4 3 6 3 6
Safe 5 4 20 2 10 2 10 3 15 4 20
Value for money 5 4 20 3 15 1 5 2 10 2 10
Few materials 1 3 3 3 3 1 1 2 2 3 3
Few components 1 3 3 4 4 2 2 1 1 2 2
Easy to disassemble 1 3 3 3 3 2 2 3 3 2 2
Few precious materials 2 3 6 3 6 1 2 1 2 3 6 Total
score 135 105 113 120 135
Rank 1 5 4 3 1
Continue Yes No Future alternative
Future alternative
Future alternative
