how to create reproducible brand personality scales
TRANSCRIPT

ORIGINAL ARTICLE
How to create reproducible brand personality scales
Theo Lieven1
� Macmillan Publishers Ltd 2017
Abstract By means of personality traits, brands can be
characterized in a concise and comprehensible manner that
predestines a brand’s personality for management with the
assessment of brand characteristics and comparison with
competing brands. To be able to do comparisons, the
respective personality model has to be reproducible. The
differing measurements must be invariant across brands,
time, and, if needed, cultures. This reproducibility, how-
ever, is in question for existing brand personality scales.
Recent studies could not replicate several of the existing
solutions, neither in other countries nor for other brands
than those in the respective studies in which the scales were
generated. This study examines potential causes for
invariance problems and identifies a more stringent appli-
cation of the psycho-lexical approach as a remedy. The
study traces back to Galton’s (Fortn Rev 36:179–185,
1884) thoughts about synonyms. When factor items possess
substantially more pairwise synonyms with items within
this factor than with traits outside that respective factor, the
personality model will turn out to be reproducible. Surveys
were conducted in the USA, Germany, and France to test
for cross-cultural invariance. Implications, particularly for
global branding, will be discussed.
Keywords Brand personality � Psycho-lexical approach �Synonyms � Implicit personality theory � Reproducibility
The missing reproducibility of brand personalityscales
For several decades, marketing literature has addressed the
assignment of human personality traits to brands. The theory
of animism lies behind this approach (Gilmore 1919; Harvey
2005), in which tangible objects are characterized by attri-
butes that are typically associated with humans. The asso-
ciation of human personality traits with brands encourages
consumers to characterize brands as their partners or friends
(Fournier 1998). Personality scales help marketers position
and reposition their brands (Grohmann 2009). Brand per-
sonality is a strong predictor of brand equity (Aaker 1997;
Grohmann 2009). One facet of brand personality is brand
gender (Grohmann 2009). The positive effect of brand gen-
der on brand equity has been demonstrated (Lieven et al.
2014). Thus, brand personality appears to be an ideal
instrument to manage brands, to adjust brand personality
according to consumers’ perceptions, and to compare a
company’s own brands with competitors’ brands. As with
any comparison, the measuring tool has to be valid and
stable. Otherwise, comparisons are vacuous. Steenkamp and
Baumgartner (1998) postulate the generalizability of con-
sumer behavior theories to make them applicable across
different countries. This is achieved when the measurements
are equivalent and invariant. This holds whether the mea-
surements occur among different brands, industry sectors,
consumer groups, or countries and cultures.1
In recent years, scholars made recommendations to
increase confidence in scientific findings by testing their
reproducibility (Open Science Collaboration 2015). Sev-
eral attempts have been made to test the reproducibility of& Theo Lieven
1 Institute for Customer Insight, University of St. Gallen,
Bahnhofstr. 8, 9000 St. Gallen, Switzerland
1 The invariance is required for the measurement tool, however, not
for the results measured by this procedure.
J Brand Manag
DOI 10.1057/s41262-017-0058-0

the most famous brand personality model (Aaker 1997).
The ambiguous results have been widely discussed in other
literature. Thus, unlike the concept of brand equity that is
shaped rather consistently in literature, with only few equity
models not differing substantially from each other (Brady
et al. 2008; Keller 1993; Yoo et al. 2000), it seems that a
valid and reproducible brand personality model is unavail-
able. Moreover, the personality models themselves and
their conceptualization have been challenged as being
unable to measure brand personality (Azoulay and Kapferer
2003). Freling and Forbes (2005), for instance, argued that
the definition of brand personality as ‘‘…the set of human
characteristics associated to a brand’’ (Aaker 1997, p. 347)
was vague and indistinguishable from brand image or brand
identity. To narrow the purport of ‘‘brand personality,’’
Azoulay and Kapferer (2003) defined the term more pre-
cisely as the ‘‘…set of human personality traits that are both
applicable to and relevant for brands’’ (p. 151). Even more
precisely, Caprara et al. (2001) presented the most stringent
constraint, claiming that ‘‘…personality descriptors
[should] load on the same factor when used to describe
human personality and brand personalities’’ (p. 381).
While the concept of brand personality and several
exemplary scales have been described in detail in other
literature (Freling et al. 2011; Freling and Forbes 2005;
Geuens et al. 2009; Kim et al. 2001; Ouwersloot and
Tudorica 2001; Yoon 2004), the deployment of the
respective scales has not been analyzed in depth. Most of
the authors use a procedure that starts with a set of char-
acteristics that describe human personality. Within this so-
called psycho-lexical approach (Ashton and Lee 2005),
traits that describe human personalities are collected from a
dictionary. Thereafter, exploratory factor analyses (EFA)
based on empirical data refine the model by post hoc
elimination of attributes that do not fit. However, such an
approach may not be based on theory, but on the require-
ments of mathematical procedures (Kelloway 1995). These
procedures are known to be suspiciously blind to any theory
(Mueller and Hancock 2001). The use of EFAs may be
acceptable to detect coherences where theories do not (yet)
exist. The lexical approach, however, has a theoretical
background that lies in the dictionary itself. As Galton
(1884) explained, ‘‘Roget’s thesaurus […] contained fully
one thousand words expressive of character, each of which
has a separate shade of meaning, while each shares a large
part of its meaning with some of the rest’’ (p. 181). Words
sharing a large part of their meaning with other words are
called synonyms. They are defined as ‘‘words which express
what is essentially the same idea, but which (commonly)
differ from one another’’ (Dolch and Leeds 1953, p. 185).
The traits honest and reliable are direct synonyms (Collins
English Thesaurus). Although they do not identically mean
the same thing, they belong together in a way that a person
perceived as being honest is perceived as reliable as well. At
least, both characteristics can come to mind by raters of a
sincere human personality. But how, then, can it happen that
the terms ‘‘honest’’ and ‘‘reliable’’ both do not load on the
same factor? In Aaker’s (1997) model, only ‘‘honest’’ is
listed under the factor ‘‘sincerity,’’ while ‘‘reliable’’ loads
on ‘‘competence.’’ Of course, the EFA has mathematically
correctly assigned both traits regarding the particular set of
brands in Aaker’s (1997) research. However, one can be
skeptical whether such a model is reproducible.
This study suggests an approach with a closer integration
of lexical knowledge in the construction of brand person-
ality scales to make them reproducible. Personality traits
will be selected in a way so that factors emerge a priori
according to their common synonyms. The underlying rule
claims that traits having a high number of common syn-
onyms belong to a specific factor. These traits share only a
few common synonyms with traits outside this factor. By
this, solid predictions can be made about the later tests in
factor analyses. In a way, the EFA becomes confirmatory
within this approach because it should support the before-
hand developed factor solution based solely on the deter-
mination of common synonyms in the thesaurus. The
contribution of this study lies in the simplification of
today’s scale development procedure and in its support for a
reproducible outcome of scale construction. Brand man-
agers will be more confident about their brand personality
models, and practitioners can be a priori assured that their
scales work reliably, even in cross-cultural studies.
In what follows, the psycho-lexical approach will be
described, including how it is used nowadays to develop
brand personality scales. After a critical discussion of this
procedure, an alternative approach will be proposed that is
based on the implicit knowledge of language by common
synonyms. To test the validity of this approach, Aaker’s
(1997) brand personality model will be evaluated theoret-
ically based on the common-synonyms rule and empiri-
cally with EFAs and confirmatory factor analyses (CFAs).
A control model will be analyzed the same way. Results of
six surveys in the USA, Germany, and France will be
reported (each two for Aaker’s and the new model). The
personality models will be applied to 12 internationally
well-known brands.
Theoretical development
The psycho-lexical approach
Galton’s (1884) article was the start of the psycho-lexical
approach (Caprara and Cervone 2000). Psychologists in
the nineteenth and twentieth centuries felt the need to
describe human personality with all its facets, including
T. Lieven

neuroticism, agreeableness, and even intelligence (for a
comprehensive overview, cf. John et al. (1988). The so-
called sedimentation hypothesis of the psycho-lexical
approach implies that those characteristics that are impor-
tant when describing humans are deposited in language
(Goldberg 1981). Galton not only collected these traits but
also distinguished them depending on their separate or
common shades of meaning. Galton, who also introduced
the theory of correlations (1888), influenced Charles
Spearman, who in turn developed the first factor analyses
(1927). R. Cattell, Spearman’s student, used factor analyses
to distribute personality traits across different clusters
(Cattell 1943, 1945). According to the lexical approach, a
set of character traits is selected from the dictionary.
Subsequently, factor analyses are conducted to reduce this
set to a smaller number of groups on which several char-
acteristics are ‘‘loading.’’ Based on the psycho-lexical
approach, Goldberg (1990) designed the renowned Big
Five Model that included 339 trait adjectives, loading on
the factors ‘‘extraversion,’’ ‘‘agreeableness,’’ ‘‘conscien-
tiousness,’’ ‘‘neuroticism,’’ and ‘‘openness.’’
Aaker’s brand personality model (1997)
In the 1990s, researchers and marketers began to perceive
brands as being endowed with personality (Aaker and
Fournier 1995). In 1997, Aaker developed a brand per-
sonality model composed of five factors, similar to Gold-
berg’s (1990) Big Five: ‘‘sincerity,’’ ‘‘excitement,’’
‘‘competence,’’ ‘‘sophistication,’’ and ‘‘ruggedness.’’ Aaker
began the construction of her model with 309 attributes that
were derived from existing personality models and quali-
tative research. This list of attributes was too large and
unruly, so it was reduced to 114 traits through the assess-
ment of survey participants’ perceptions about the
descriptiveness of the original 309 characteristics for three
brands: Wrangler (jeans), Pepto-Bismol (stomach medica-
tion), and Dr. Pepper (soft drink). In a test–retest design,
the 114 traits were initially reduced to 45, depending on the
highest item-to-total correlations in an EFA, and because
three traits had a test–retest correlation only below .60,
these were also eliminated, leaving 42 traits in five factors.
Aaker et al. (2001) evaluated Aaker’s (1997) model in
Japanese and Spanish. In the Japanese model, the
‘‘ruggedness’’ factor had to be replaced by ‘‘peacefulness’’.
In the Spanish model, ‘‘competence’’ and ‘‘ruggedness’’
were replaced by ‘‘passion’’ and ‘‘peacefulness,’’ respec-
tively. No five-factor solution could be found in Austin
et al. (2003) and Milas and Mlacic (2007). Furthermore,
appropriate solutions could not be found due to cross-
loadings. Hosany et al. (2006) applied Aaker’s model to
tourist destinations. Only 27 traits remained, loading on
only three factors: ‘‘sincerity,’’ ‘‘excitement,’’ and
‘‘conviviality.’’ Milas and Mlacic (2007) investigated the
effects of different stages of aggregation on the factor
solutions and found significant differences. Aaker achieved
a five-factor solution with aggregated data, whereas Milas
and Mlacic (2007) obtained only two. Kim et al. (2001) had
to remove six items from Aaker’s scales, which did not
load on any factor. Twenty-five attributes indeed loaded on
the same factors, but the factors themselves had different
meanings, which resulted in only six traits loading on
identical factors as in Aaker’s model. Ferrandi et al. (2015)
tested Aaker’s (1997) model on replicability in France.
Instead of five factors, a solution based on the eigenvectors
in the above one resulted in seven factors. Nine traits had to
be removed to receive a useful five-factor solution. Not all
factors had the same meaning as in Aaker’s model and had
to be reinterpreted. Thus, Aaker’s model is an interesting
reflection of the Big Five’s scales; however, it may not be
suitable for practitioners in global branding to measure and
compare brand personality in a cross-cultural context.
Several possibilities have been discussed as to what
could have caused the missing reproducible. The most
obvious explanation came from Austin et al. (2003),
pointing out that not all of Aaker’s dimensions were pre-
dicted on the basis of Goldberg’s (1990) Big Five Model
(neuroticism, for example, is pretty much never a dimen-
sion of brands). Furthermore, Aaker was criticized for
aggregating the data across brands. Aggregation can have
serious impacts on correlations, the effect of which is
known as the ecological fallacy (Robinson 1950).
Another reason may be the subjectivity of the different
researchers conducting their own factor analyses. One of
the problems with EFA is the missing-criterion variable
against which the solution could be tested and different
approaches to the number of factors or the choice of factor
rotation cannot be resolved by objective criteria (Tabach-
nick and Fidell 1996). It is in the nature of exploratory
factor analysis that a detailed model is not specified in
advance (Bollen 1989). Some minor rules exist, e.g., the
extraction of factors with eigenvalues above 1.0, or the
interpretation of the scree plot. However, marketers should
avoid a situation where their applied procedures lead to
meaningless results. Although mathematical procedures are
important and helpful, they are no substitute for a theo-
retical basis. Without any preceding theory, EFA results
are a sole function of the ‘‘mechanics and mathematics of
the method’’ (Kieffer 1999, p. 77). Because of these threats
to valid EFA solutions, ‘‘appropriate use of EFA necessi-
tates thoughtful and informed researcher decision making’’
(Henson and Roberts 2006, p. 397). Collecting personality
traits from several sources that themselves may have been
founded properly on a theoretical basis (as the psycho-
lexical approach) is appropriate as long it is about per-
sonality. However, the applied procedures thereafter may
How to create reproducible brand personality scales

not be appropriate for brand personality models. Aaker
created the initial set of 309 traits by selecting and elimi-
nating redundancies from ‘‘personality scales from psy-
chology, personality scales used by marketers (academics
and practitioners), and original qualitative research’’
(Aaker 1997, p. 349), which is appropriate according to the
psycho-lexical approach. To transfer them to brands, 25
subjects (70% female) were interviewed regarding how
descriptive these traits are for the brands Wrangler, Pepto-
Bismol, and Dr. Pepper. This may be problematic because
a measuring instrument was directly derived from and thus
is confounded with the object that originally had to be
measured. This may be appropriate if the object serves as a
reference, e.g., dividing the reference of the 21,600 nauti-
cal-mile (NM) circumference of the earth by 360 degrees,
which defines one degree as 60 nautical miles for any great
circle. However, are Wrangler, Pepto-Bismol, and Dr.
Pepper reference brands? It may have been Wrangler that
convinced Aaker to include the traits ‘‘Western’’ and
‘‘outdoorsy,’’ two traits that caused problems in subsequent
research (Austin et al. 2003).
Selecting brand personality factors by common
synonyms
One of the first thoughtful theoretical steps to creating
brand personality scales should be the involvement of the
lexical knowledge. Referring to the sedimentation
hypothesis, personality traits are encoded in language
(Goldberg 1981), sharing more or less meaning with each
other in the form of synonyms (Galton 1884). A synonym
is defined ‘‘one of two or more words or expressions of the
same language that have the identical or nearly the same
meaning in some or all senses’’ (Whitten et al. 1979,
p. 109). Following implicit personality theory, humans
exhibit consistent consensus regarding synonymous per-
sonality traits. Goldberg and Kilkowski (1985) applied
synonyms to explore correlations in self- and peer-rating
studies. According to their findings, ‘‘...this issue can never
be resolved in the absence of detailed information regard-
ing the sheer similarity of meaning among the trait-de-
scriptive terms used in these investigations’’ (Goldberg and
Kilkowski 1985, p. 82). This is what causes the traits re-
liable and honest to occur simultaneously in a judgment
about a sincere person. Depending on respondents’ per-
ception of high or low sincerity, their ratings for reliable
and honest will correlate positively. Because all classical
statistical analyses are correlational in nature (Knapp
1978), the correlation matrix is the basis for any EFA. The
correlation between traits X1 and X2 then determines the
product of their respective factor loadings, which can be
seen as bivariate correlations between the factor and its
respective indicator variables, i.e., the trait. To load on a
specific factor, loadings of traits must be sufficiently high.
Thus, correlations between this factor’s traits must be high
as well. Because the correlations stem from the implicit
knowledge of personality raters, those traits that possess a
high number of common synonyms will load higher on a
common factor than traits that have no common synonyms
with these characteristics. As a result, a factor is linked to
traits having a high number of common synonyms which,
in turn, have only a few common synonyms with traits
outside this factor.
Assessing common synonyms of selected traits
One famous source of synonyms is Collins English The-
saurus. The procedure to determine common synonyms
goes on as follows, explained by the traits ‘‘honest’’ and
‘‘reliable’’ (Fig. 1). ‘‘Honest’’ and ‘‘reliable’’ are the traits
followed by their respective synonyms. Each item from the
first trait is pairwise compared to each item of the second
trait regarding their identity. By this, it can be determined
that ‘‘honest’’ and ‘‘reliable’’ are direct synonyms (‘‘reli-
able’’ is a synonym for ‘‘honest’’ and vice versa). All
common synonyms can be seen by the arrows in Fig. 1.
Altogether, ‘‘honest’’ and ‘‘reliable’’ possess seven com-
mon synonyms. The numbers of these synonyms are
inserted for each pair of traits into a symmetrical matrix
such as it is depicted, as a hypothetical example, in Fig. 2.
In the hypothetical description in Fig. 2, the pairwise
numbers of common synonyms were derived from com-
parisons of the traits as described above. Inside the first
factor, 3 9 (3 - 1) = 6 cells exist (without the diagonals).
Outside the first factor, this number is 15 in factor 2. By the
sum of common synonyms within factor 1 (30) and outside
this factor in factor 2 (4), the division of the average
number of synonyms within the factor (30/6 = 5.00) by the
average number of synonyms outside the factor (4/
15 = .27) represents the cross-ratio between the two fac-
tors (5.00/.27 = 18.8). From the deliberations in this the-
oretical section, it can be expected that the higher this ratio
is, the higher the loadings within the respective factor will
emerge in statistical procedures such as factor analyses. As
well, only low cross-loadings with other factors will be
found.
Proof of concept
Theoretical study
The above procedure was demonstrated with 69 selected
traits, 42 belonging to Aaker’s (1997) model, 40 belonging
to a new control model (13 traits overlap with the Aaker
constructs). The respective traits were selected from
T. Lieven

existing models and from the dictionary by a group of six
doctoral students evaluating the traits’ ability to describe
personality. In the first step, the synonyms were assessed
from Collins English Thesaurus and thereafter compared
pairwise for common synonyms.2 Results for the USA can
be seen in Appendix 1. For the Aaker model (Appendix
1a), the 42 traits had a total of 1245 synonyms. Each of the
42 traits and their synonyms then were pairwise compared
with each synonym of each other trait, which resulted in
291 common synonyms. Subsequently, the cross-ratios
were calculated similarly to the procedure in Fig. 2. The
same was done for the 40 traits of the control model. From
the total of 1290 synonyms, 1038 were common. The
numbers of common synonyms in the control model are
depicted in Appendix 1b.
Comparing the cross-ratios for the factors in Aaker’s
model, these were 6.8 for ‘‘sincerity,’’ 5.9 for ‘‘excite-
ment,’’ 2.6 for ‘‘competence,’’ 15.4 for ‘‘sophistication,’’
and 32.8 for ‘‘ruggedness.’’ The ratios for the control
model were 69.0 for ‘‘agreeableness,’’ 32.7 for ‘‘sincerity,’’
and 36.8 for a factor named ‘‘assertiveness.’’ Thus, the
ratios between traits within the factors and outside the
factors were mostly substantially higher in the control
model. The same procedure was applied to both models in
a German translation and a French translation (results in
Appendices 2a, 2b, 3). As thesauri, Collins English The-
saurus was used for the USA, the DUDEN was used for
Germany (Dudenredaktion 2014), and for France, the
honest; above board; authentic; bona fide; candid; conscientious;decent; dinkum; direct; equitable; ethical; fair; fair and square;forthright; frank; genuine; high-minded; honest to goodness;honorable; impartial; ingenuous; law-abiding; on the level; on the upand up; open; outright; plain; proper; real; reliable; reputable;round; scrupulous; sincere; straight; straightforward; true;trustworthy; trusty; truthful; undisguised; unfeigned; upfront;upright; veracious; virtuous
reliable; attested; certain; definitive; dependable; failsafe;faithful; honest; predictable; regular; reputable; responsible; safe;sound; stable; staunch; sure; tried and tested; tried and true; true;trustworthy; trusty; unfailing; upright; well-built; well-engineered;well-founded
Fig. 1 Seven common
synonyms between honest and
reliable (Collins English
Thesaurus)
Items (N = 8) Factor 1 (n = 3) Factor 2 (n = 5)
Trai
t 1
Trai
t 2
Trai
t 3
Trai
t 4
Trai
t 5
Trai
t 6
Trai
t 7
Trai
t 8
Fact
or 1 Trait 1 5 6 0 0 0 1 0
Trait 2 5 4 1 0 0 0 1Trait 3 6 4 0 0 1 0 0
Fact
or 2
Trait 4 0 1 0 11 2 5 6Trait 5 0 0 0 11 7 1 3Trait 6 0 0 1 2 7 8 7Trait 7 1 0 0 5 1 8 2Trait 8 0 1 0 6 3 7 2
# of cells within factor [n × (n - 1)] 6 20# of cells outside factor [n × (N - n)] 15 15# of common synonyms within factor 30 104# of common synonyms outside factor 4 4Avg # of synonyms within factor 5,00 5,20Avg # of synonyms outside factor 0,27 0,27Cross Ra�o 18,8 19,5
Fig. 2 Hypothesized
distribution of common
synonyms across factors
2 Due to the magnitude of items, the detection of common synonyms
was done by a software program. The code and respective instructions
are available from the corresponding author.
How to create reproducible brand personality scales

thesaurus website of a university was chosen (Universite
de Caen). The main figures of the analyses are cited in
Table 1. It can be seen that the total number of synonyms is
substantially higher in the control model. As well, a com-
parison of the cross-ratios reveals that these are higher for
the control than for the Aaker model in each country.
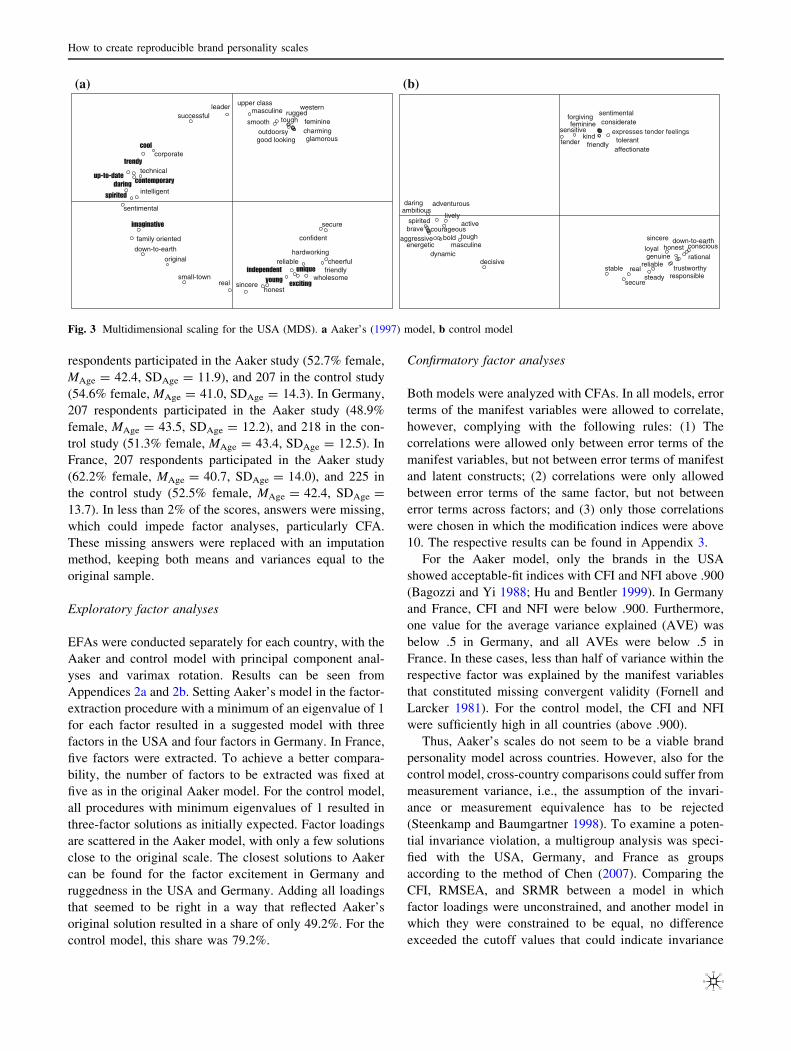
The distribution of common synonyms (Appendices 1a,
1b) can also be visualized by a multidimensional scaling
(MDS) after the numbers are converted to distances by
subtracting them from the maximum value. Figure 3a
shows the result for Aaker’s (1997) model. Some traits are
depicted close to each other as described by Aaker’s EFA
solution. Others, however, are rather scattered. The traits of
the factor ‘‘excitement,’’ for example, ‘‘cross-load’’ with
other attributes from the factors ‘‘sincerity’’ and ‘‘compe-
tence.’’ The traits that originally built the two factors
‘‘sophistication’’ and ‘‘ruggedness,’’ rather seem to belong
to only one common construct here. The MDS for the
control model, in contrast, depicts the respective traits in
the three intended factors clearly separated from each other
(Fig. 3b).
Empirical study
The Aaker and the control model both have been tested for
a set of global brands. A variety of worldwide available
and well-known brands was selected: BMW (cars), L’Oreal
and Dove (cosmetics), Sony (electronics), Apple (IT),
Coca-Cola and Kellogg’s (food), Febreze (household
products), Nike (apparel), and Google, Hilton, and Visa
(service brands). These brands were selected by a group of
six doctoral students to cover several product and service
brands, as well as keeping the number of stimuli reasonably
small to avoid overload. In each country, two separate
surveys were conducted, one for the Aaker and one for the
control model. At the beginning, the 12 brand logos were
shown, and survey participants could choose one or more
brands that they were familiar with, that they had bought
yet or that they knew from friends. By this, it could be
guaranteed that no brands were assigned to respondents
that they did not know and that could have led to them
answering with insignificant statements. For each selected
brand, participants rated the respective personality traits
(42 in the Aaker and 40 in the control model) that were
presented in random order.
Participants were recruited via e-mail invitation by an
international provider of survey sampling. The provider
collected completed questionnaires from respondents aged
18–65 and according to the countries’ demographics to
provide a representation as close as possible to the popu-
lation. Sample sizes were calculated by the 5:1 rule, which
requires 5 cases for each variable (MacCallum et al.
1999).Thus, with about 40 variables, sample sizes of
200–210 participants seemed sufficient. In the USA, 214
Table 1 Results of the synonym detection per model and country
Aaker Control model
Factor Cross-ratio Factor Cross-ratio
USA USA
42 traits
1245 synonyms
291 common synonyms
Sincerity 6.8 40 traits
1290 synonyms
1038 common synonyms
Agreeableness 69.0
Excitement 5.9 Sincerity 32.7
Competence 2.6 Assertiveness 38.8
Sophistication 15.4
Ruggedness 32.8
Germany Germany
42 traits
950 synonyms
318 common synonyms
Sincerity 3.9 40 traits
1072 synonyms
917 common synonyms
Excitement 3.7 Agreeableness 68.6
Competence .5 Sincerity 19.7
Sophistication 2.5 Assertiveness 60.9
Ruggedness 3.4
France France
42 traits
1366 synonyms
612 common synonyms
Sincerity 1.5 40 traits
1405 synonyms
1410 common synonyms
Agreeableness 4.8
Excitement .3 Sincerity 8.1
Competence 1.2 Assertiveness 4.5
Sophistication 5.3
Ruggedness 2.2
T. Lieven
respondents participated in the Aaker study (52.7% female,
MAge = 42.4, SDAge = 11.9), and 207 in the control study
(54.6% female, MAge = 41.0, SDAge = 14.3). In Germany,
207 respondents participated in the Aaker study (48.9%
female, MAge = 43.5, SDAge = 12.2), and 218 in the con-
trol study (51.3% female, MAge = 43.4, SDAge = 12.5). In
France, 207 respondents participated in the Aaker study
(62.2% female, MAge = 40.7, SDAge = 14.0), and 225 in
the control study (52.5% female, MAge = 42.4, SDAge =
13.7). In less than 2% of the scores, answers were missing,
which could impede factor analyses, particularly CFA.
These missing answers were replaced with an imputation
method, keeping both means and variances equal to the
original sample.
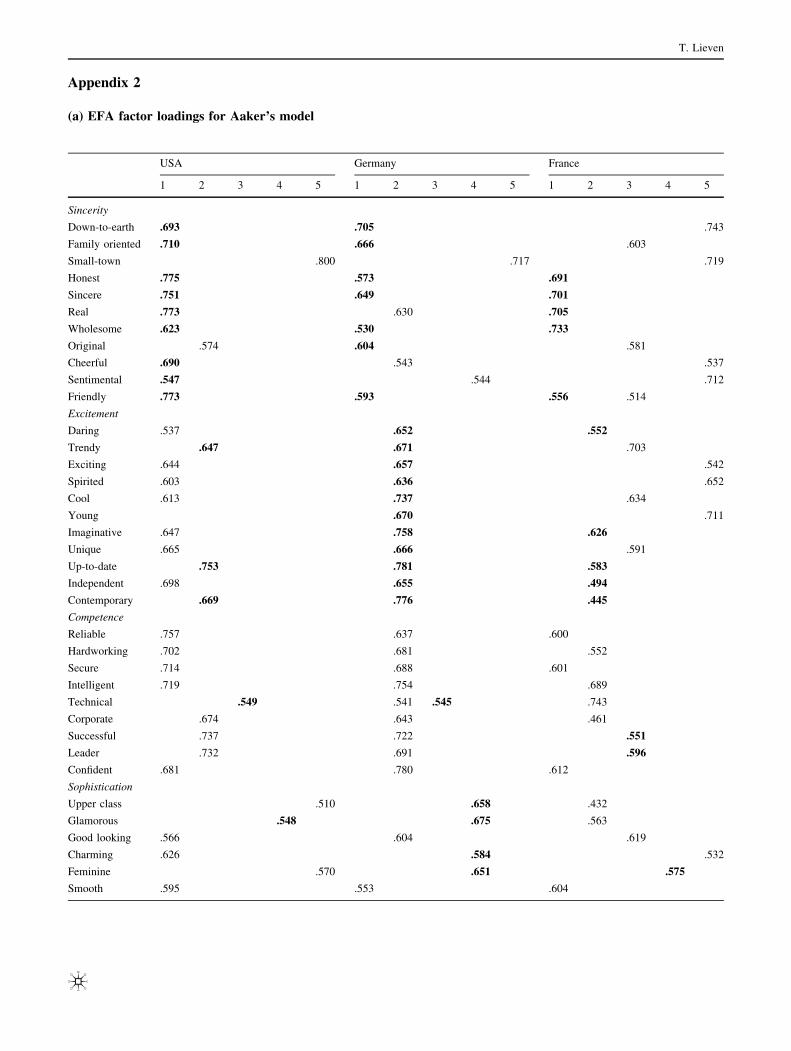
Exploratory factor analyses
EFAs were conducted separately for each country, with the
Aaker and control model with principal component anal-
yses and varimax rotation. Results can be seen from
Appendices 2a and 2b. Setting Aaker’s model in the factor-
extraction procedure with a minimum of an eigenvalue of 1
for each factor resulted in a suggested model with three
factors in the USA and four factors in Germany. In France,
five factors were extracted. To achieve a better compara-
bility, the number of factors to be extracted was fixed at
five as in the original Aaker model. For the control model,
all procedures with minimum eigenvalues of 1 resulted in
three-factor solutions as initially expected. Factor loadings
are scattered in the Aaker model, with only a few solutions
close to the original scale. The closest solutions to Aaker
can be found for the factor excitement in Germany and
ruggedness in the USA and Germany. Adding all loadings
that seemed to be right in a way that reflected Aaker’s
original solution resulted in a share of only 49.2%. For the
control model, this share was 79.2%.
Confirmatory factor analyses
Both models were analyzed with CFAs. In all models, error
terms of the manifest variables were allowed to correlate,
however, complying with the following rules: (1) The
correlations were allowed only between error terms of the
manifest variables, but not between error terms of manifest
and latent constructs; (2) correlations were only allowed
between error terms of the same factor, but not between
error terms across factors; and (3) only those correlations
were chosen in which the modification indices were above
10. The respective results can be found in Appendix 3.
For the Aaker model, only the brands in the USA
showed acceptable-fit indices with CFI and NFI above .900
(Bagozzi and Yi 1988; Hu and Bentler 1999). In Germany
and France, CFI and NFI were below .900. Furthermore,
one value for the average variance explained (AVE) was
below .5 in Germany, and all AVEs were below .5 in
France. In these cases, less than half of variance within the
respective factor was explained by the manifest variables
that constituted missing convergent validity (Fornell and
Larcker 1981). For the control model, the CFI and NFI
were sufficiently high in all countries (above .900).
Thus, Aaker’s scales do not seem to be a viable brand
personality model across countries. However, also for the
control model, cross-country comparisons could suffer from
measurement variance, i.e., the assumption of the invari-
ance or measurement equivalence has to be rejected
(Steenkamp and Baumgartner 1998). To examine a poten-
tial invariance violation, a multigroup analysis was speci-
fied with the USA, Germany, and France as groups
according to the method of Chen (2007). Comparing the
CFI, RMSEA, and SRMR between a model in which
factor loadings were unconstrained, and another model in
which they were constrained to be equal, no difference
exceeded the cutoff values that could indicate invariance
(a) (b)
tough
westernmasculine
outdoorsysmooth feminine
charminggood looking glamorous
upper class
confident
leadersuccessful
corporate
technical
intelligent
secure
hardworkingreliable
contemporary
independent
up-to-date
unique
imaginative
young
cool
spirited
exciting
trendy
daring
friendly
sentimental
cheerfuloriginal
wholesomereal sincere
honest
small-town
family oriented
down-to-earth
rugged
adventurous
active
daringambitious
lively
toughboldbrave
aggressive
spirited
energeticdynamic
courageous
decisive
masculine loyal
steadystable real
secureresponsible
reliable
down-to-earth
trustworthy
genuine
conscious
rational
sincerehonest
toleranttender
sensitive
friendlyaffectionate
sentimental
feminine
kind
forgivingconsiderate
expresses tender feelings
Fig. 3 Multidimensional scaling for the USA (MDS). a Aaker’s (1997) model, b control model
How to create reproducible brand personality scales

(DCFI = .940–.943 = -.003[-.005; DRMSEA = .035–
.034 = .001\ .010; DSRMR = .0390–.0382 = .0008\
.025. Thus, the invariance assumption of the control model
across the USA, Germany, and France was supported, and
the model emerged as reproducible.
Discussion, limitations and conclusion
The main finding of this article is the positive link between
an extended lexical approach by the use of synonyms and
an enhanced reproducibility of the emerging brand per-
sonality scales in empirical studies within different cultural
environments. The pivotal problem underlying this
research was the question why researchers perform the
second step (incorporating brands to develop a tool to
measure brands) before the first, i.e., building valid and
reproducible personality models by incorporating the
knowledge that is deeply ingrained in human language and
thereafter applying these personality models to brands. It
was not the intention of this article to criticize Aaker’s
(1997) model in general – it worked quite well in the USA.
The theoretical and empirical studies in this article, how-
ever, showed evidence why personality models may not
have been reproducible, and recommendations were given
regarding how to improve them. The achieved results
encourage researchers and marketers to further make
extensive use of brand personality models. As the single
most important managerial implication, this method could
support the global brand manager. Obviously, globalization
has advanced in recent decades. As more nations open their
economies to other parts of the world, manufacturers
venture into new markets to increase revenues, and these
companies take their existing brands with them. Marketers
then face the question of how to manage brands in different
countries (Douglas et al. 2001). Some international com-
panies, particularly those with convenience goods, leave
brand management to their local subsidiaries. However, if
global culture is converging, then a homogeneous brand
strategy would evidently save time and expense (De Mooij
2003). Aaker and Joachimsthaler (1999) claimed that
successful global branding requires a system that measures
brand equity in terms of brand personality. Thus, a global
brand personality model is required.
Of course, character perceptions may differ according to
varying cultures. Therefore, adjusting Aaker’s original
model for each culture may be appropriate. The marketing
practitioner, however, is unable to manage a brand globally
with such a variety of models unless one shortens Aaker’s
scales to a reproducible rump model. However, only a few
items that load identically would remain. This article
showed how the required generalizability can be improved.
By a worldwide application of a brand gender model that
fulfills the synonym rule (Grohmann 2009), it could be
shown how cultural differences influence perceptions of
brand equity (Lieven and Hildebrand 2016).3
By far, it is not claimed that the described procedure
solves all problems of cross-cultural invariance. Neverthe-
less, it supports the construction of reproducible models in a
way that fulfills necessary conditions (the synonym rule)
rather than resulting in reproducible scales by all means.
Careful consideration is still required, and factor analyses
are not obsolete regarding the demonstrated method.
The presented procedure extends the psycho-lexical
approach by the rule that personality traits are combined
to a factor when they possess a sufficiently high number
of common synonyms and only a few synonyms with
traits outside of this factor. Accordingly, brand person-
ality scales can be theoretically founded and justified. As
the proof of concept demonstrated, a higher repro-
ducibility could be achieved. It could be argued that the
described procedure overly predetermines the structure of
the personality scales, and many traits with too many
common synonyms may be redundant, which can also be
seen from the high Cronbach’s alphas. The redundancy
itself, however, is no problem since factor analysis is a
way to reduce a set of redundant variables (Briggs and
Cheek 1986). The difference described in the present
article from the traditional way to develop and evaluate
personality scales is the fact that the development of the
scales is done before EFAs by the synonym rule. Human
character traits are sedimented in language and can be
selected to a personality model by the procedure descri-
bed here. However, EFAs are not needless. The human
personality scales built by the presented procedure can be
tested with an EFA if the selected human character traits
load on the same factors when applied to brands, as
Caprara et al. (2001). The EFA becomes rather confir-
matory, similar to the CFA.
To avoid overloads by too many redundant synonyms,
the parsimonious parameters in the CFA (PGFI and PNFI)
should be sufficiently high by reducing the set of traits
accordingly. PGFI and PNFI do not have predefined cutoff
values; nonetheless, in connection with other fit indices,
they can be adjusted to the highest values, comparing
models that still have a good fit.
3 Lieven and Hildebrand (2016) revealed that androgynous brands
generate higher brand equity relative to exclusively masculine,
exclusively feminine, and undifferentiated brands. They also showed
a brand gender congruence effect such that male consumers value
masculine brands higher than females while female consumers value
more feminine brands higher than males. Finally, highly masculine
brands generate higher brand equity in more individualistic (Western)
countries whereas highly feminine brands generate higher brand
equity in more collectivistic (Eastern) countries.
T. Lieven

It is knowledge from language that predetermines the
factors, and only abnormalities or inadequate translation
could deviate from this implicit knowledge in such a way
that a shift in meaning can occur. Austin et al. (2003), who
tried to adapt Aaker’s model to restaurants, found that
Asian survey participants could not interpret the trait
‘‘Western.’’ Likewise, al-fresco dining restaurants were
perceived to be more outdoorsy, and restaurants special-
izing in serving families were perceived as being family
oriented.
Translations can be misleading. Obviously, the trait
‘‘aggressive’’ from English was translated to ‘‘agressif’’ in
French, which seems to have a negative connotation in
France compared to the USA. In Appendix 3, its coefficient
in the French model under ‘‘assertiveness’’ is only .337;
i.e., it would be better to remove it from the trait list. It
might have been better to translate ‘‘aggressive’’ with
‘‘belliqueux,’’ which has the meaning of the German ‘‘an-
griffslustig’’ and in some sense the English ‘‘bellicose.’’
In Collins thesaurus, ‘‘reliable’’ and ‘‘honest’’ are
direct synonyms (Fig. 1). While this holds in language, it
could be challenged that this holds also for brands. Toyota
certainly could be perceived as ‘‘honest’’; nevertheless,
due to several problems with their pedals, Toyota could
not be deemed ‘‘reliable.’’ However, the issue concerns
human character, not technical properties. ‘‘Reliable’’
does not mean the same when used for a reliable friend or,
in contrast, for a reliable car. The meanings are not too far
away; however, if one uses personality models for brands,
the respective traits should be personality characteristics
as well. Another example is ‘‘Western,’’ which could
describe, as an example, the Marlboro Man. For Asian
consumers, though, all American car brands like GM,
Ford, and others may be Western in contrast to the Eastern
Toyota. Relief for these misunderstandings could be the
presentation of the character traits in whole sentences,
e.g., ‘‘Toyota reminds me of a reliable person’’ to avoid
the shift of meaning of ‘‘reliable’’ from a personality trait
to a functional property. Unfortunately, this makes
translations even more difficult in an international con-
text. When there exists the risk of such shifts in meaning,
one should rather refrain from implementing these traits.
Similarly, Appendix 3 demonstrates that several traits
should not be used in an international context: ‘‘young,’’
‘‘technical,’’ ‘‘corporate,’’ and ‘‘Western.’’ Particularly,
the trait ‘‘feminine’’ does not positively contribute to the
constructs. All of this has been apparent in the synonym
matrices. ‘‘Young,’’ ‘‘technical,’’ ‘‘corporate,’’ and
‘‘Western’’ had no common synonyms at all, while
‘‘feminine’’ had two ( Appendix 1a). This non-overlap-
ping property could be seen as a limitation of the
described method. In some brand personality models,
particularly for cosmetic brands, ‘‘feminine’’ may be
required to be included in the brand personality scale.
‘‘Feminine’’ itself has 18 synonyms in the Collins The-
saurus, whereof only two were common synonyms in the
Aaker model used in the USA (‘‘feminine’’ had the syn-
onym ‘‘tender’’ in common with the trait ‘‘sentimental,’’
and ‘‘feminine’’ had the synonym ‘‘pretty’’ in common
with the trait ‘‘good looking’’). Hence, to let the trait
‘‘feminine’’ absolutely be part of the scales, one could
include other characteristics with synonyms in common
with ‘‘feminine’’ (e.g., ‘‘humble,’’ ‘‘modest’’). Particu-
larly, the synonyms of ‘‘feminine’’ themselves could be
added, though they might lead to high redundancy or even
overload. Alternatively, researchers or marketers intend-
ing to describe femininity and masculinity should make
use of Grohmann’s (2009) brand gender model, which has
been found reproducible in 10 countries on four conti-
nents (Lieven and Hildebrand 2016).
Lieven and Hildebrand (2016) also demonstrated the
usefulness of brand gender as part of personality to
predict brand equity, which is one of the most important
outcomes of marketing and brand management. This is
one of the main purposes of brand personality: to
describe brands’ characteristics in an intuitive way that is
comprehensible to almost anyone and to derive conclu-
sions regarding brand image, strength, and equity (Aaker
and Joachimsthaler 1999). The reason why the use of
brand personality has not been propagated more often in
recent years may be found in the ambiguous results that
occurred when the replication of existing scales was
attempted. Using the method described in this study may
help to develop better scales. Through an a priori analysis
from the dictionary, mistakes can be avoided. Empirical
data do not have to be assessed again and again due to
poor model fit or the need to remove traits that did not
load correctly. In addition to the robust theoretical
foundation, the procedure, thus, is a resource-saving
endorsement of the existing approach. It is also suit-
able for any development of personality models in soci-
ology or psychology.
How to create reproducible brand personality scales

Appendix 1
(a) Cross-ratios model Aaker USA
Items (N = 42)
dow
n-to
-ear
th fa
mily
-orie
nted
smal
l-tow
n h
ones
t si
ncer
e re
al w
hole
som
e o
rigin
al c
heer
ful
sen�
men
tal
frie
ndly
dar
ing
tren
dy e
xci�
ng sp
irite
d c
ool
you
ng im
agin
a�ve
uni
que
up-
to-d
ate
inde
pend
ent
con
tem
pora
ry re
liabl
e h
ardw
orki
ng se
cure
inte
llige
nt te
chni
cal
cor
pora
te su
cces
sful
lead
er c
onfid
ent
upp
er c
lass
gla
mor
ous
goo
d-lo
okin
g c
harm
ing
fem
inin
e sm
ooth
out
door
sy m
ascu
line
wes
tern
toug
h ru
gged
down-to-earth 11detneiro-ylimaf
nwot-llams211173440131tsenoh12331311erecnis
1111263101laer124emoselohw
21171634lanigiro111111322lufreehc
latnemitnes 111111221yldneirf
21126gnirad476ydnert
112gniticxe12211111631detirips11432214616211looc
young11117evitanigami
unique 1767etad-ot-pu
11113tnednepedni7441yraropmetnoc
11126227elbailer11gnikrowdrah
122561111eruces11tnegilletni
technicalcorporate
111lufsseccus4122redael
115212111tnedifnoc413ssalcreppu
glamorous 7 5 1216171111gnikool-doog161511gnimrahc
1eninimef 1 2122141112htooms
outdoorsy 16711122enilucsam
western6271221hguot
6262111111deggur# of cells within factor [n × (n - 1)]# of cells outside factor [n × (N - n)]# of common synonyms within factor# of common synonyms outside factorAvg # of synonyms within factorAvg # of synonyms outside factorCross Ra�o
Ruggedness (n = 5)Sophis�ca�on (n = 6)Competence (n = 9)Excitement (n = 11)Sincerity (n = 11)
Exci
tem
ent
Com
pete
nce
Soph
is�ca
�on
Rugg
edne
ssSi
ncer
ity
020327011581612792143143
110
220354944587468249811
1,01,02,01,02,09,31,24,09,01,1
,516,29,58,6 4 32,8
T. Lieven

(b) Cross-ratios control model USA
Items (N = 40)
exp
r. te
nder
feel
. c
onsid
erat
e fo
rgiv
ing
kin
d fe
min
ine
sen�
men
tal
affe
c�on
ate
frie
ndly
sens
i�ve
tend
er to
lera
nt h
ones
t si
ncer
e ra
�ona
l c
onsc
ious
gen
uine
trus
twor
thy
dow
n-to
-ear
th re
liabl
e re
spon
sible
secu
re re
al st
able
stea
dy lo
yal
mas
culin
e d
ecisi
ve c
oura
geou
s d
ynam
ic e
nerg
e�c
spiri
ted
agg
ress
ive
bra
ve b
old
toug
h li
vely
am
bi�o
us d
arin
g a
c�ve
adv
entu
rous
expresses tender feelings 3 4 13 1 1 7 8 6 18 273etaredisnoc 1 3 8 2 1
631164gnivigrof69841416731dnik1531111eninimef
611111latnemitnes11417etanoitceffa 121826
1126464138yldneirfsensi�ve 6 8 1 8 3 1 2 4 16 3 2 2 2
81rednet 2 3 9 5 6 8 6 16 3 1 1 1 1 2tolerant 2 1 6 6 1 1 2 3 3 1
31101137931311tsenoh1312129131erecnis
lanoitar 2 1 1 3 1 3 5 212112suoicsnoc
117113219131eniunegtrustworthy 9 2 1 1 2 1 10 7 2 2 3 6 6
111131htrae-ot-nwodreliable 7 2 1 1 3 10 6 6 2 6 7 7 1 1
3elbisnopser 3 2 1 7 1 6 3 5 6 22142010113621eruces
11131122713101laer1elbats 5 1 1 3 1 6 5 10 15 4 2 1 1 1 6 1 1
21ydaets 11651016716611312layol 1641227
masculine 1 2 1 5 2 3 2 4 4 4 7 3 2 2 3 1decisive 1 4 3 1 1 1 1 1 2 1 1 1 3 1 1courageous 5 1 2 1 17 16 3 1 3 10 4dynamic 2 1 15 6 5 3 2 9 5 1 11energe�c 1 3 2 15 6 6 4 10 13 12 1 16spirited 2 2 6 6 3 2 4 1 10 6 5 8 2aggressive 4 1 1 5 6 3 1 5 5 5 6 2 10 2brave 4 1 17 2 1 21 1 1 5 11 5bold 1 1 4 1 16 3 4 4 5 21 2 9 6 13 6 6
12hguot 2 1 6 1 7 3 3 2 10 1 5 1 2 2 9 5lively 13221129150131911311121
21532112suoitibma 6 6 5 6 9 11 6 11 5daring 2 10 1 1 5 2 11 13 2 6 2 11
121132560186111131111evitca412suorutnevda 2 2 5 6 1 5 11 1
# of cells within factor [n × (n - 1)]# of cells outside factor [n × (N - n)]# of common synonyms within factor# of common synonyms outside factorAvg # of synonyms within factorAvg # of synonyms outside factorCross Ra�o
Asser�veness (n = 15)
Agre
eabl
enes
sSi
ncer
ityAs
ser�
vene
ss
Agreeableness (n = 11) Sincerity (n = 14)
012281011573463913879275824545381
8,837,230,96
7,41,39,31,01,01,0
How to create reproducible brand personality scales
Appendix 2
(a) EFA factor loadings for Aaker’s model
USA Germany France
1 2 3 4 5 1 2 3 4 5 1 2 3 4 5
Sincerity
Down-to-earth .693 .705 .743
Family oriented .710 .666 .603
Small-town .800 .717 .719
Honest .775 .573 .691
Sincere .751 .649 .701
Real .773 .630 .705
Wholesome .623 .530 .733
Original .574 .604 .581
Cheerful .690 .543 .537
Sentimental .547 .544 .712
Friendly .773 .593 .556 .514
Excitement
Daring .537 .652 .552
Trendy .647 .671 .703
Exciting .644 .657 .542
Spirited .603 .636 .652
Cool .613 .737 .634
Young .670 .711
Imaginative .647 .758 .626
Unique .665 .666 .591
Up-to-date .753 .781 .583
Independent .698 .655 .494
Contemporary .669 .776 .445
Competence
Reliable .757 .637 .600
Hardworking .702 .681 .552
Secure .714 .688 .601
Intelligent .719 .754 .689
Technical .549 .541 .545 .743
Corporate .674 .643 .461
Successful .737 .722 .551
Leader .732 .691 .596
Confident .681 .780 .612
Sophistication
Upper class .510 .658 .432
Glamorous .548 .675 .563
Good looking .566 .604 .619
Charming .626 .584 .532
Feminine .570 .651 .575
Smooth .595 .553 .604
T. Lieven

(b) EFA factor loadings for control model
USA Germany France
1 2 3 4 5 1 2 3 4 5 1 2 3 4 5
Ruggedness
Outdoorsy .781 .557 .625
Masculine .761 .589
Western .713 .837 .749
Tough .685 .525
Rugged .817 .826 .741
Extraction method: principal component analysis. Rotation method: varimax with Kaiser normalization
Bold numbers represent high loadings correctly assigned to the intended factors
USA Germany France
1 2 3 1 2 3 1 2 3
Agreeableness
Expresses tender feelings .803 .833 .809
Considerate .573 .755 .719
Forgiving .706 .745 .697
Kind .649 .529 .720 .790
Feminine .721 .603 .625
Sentimental .723 .823 .786
Affectionate .776 .826 .800
Friendly .690 .627 .602
Sensitive .759 .806 .645
Tender .802 .855 .813
Tolerant .504 .697 .629
Sincerity
Honest .707 .573 .632
Sincere .621 .623 .620
Rational .529 .536 .566
Conscious .594 .745 .594
Genuine .729 .702 .648
Trustworthy .772 .660 .773
Down-to-earth .601 .567 .642
Reliable .767 .743 .774
Responsible .718 .611 .659
Secure .686 .758 .773
Real .734 .749 .686
Stable .728 .755 .704
Steady .729 .750 .700
Loyal .665 .550 .610
Assertiveness
Masculine .655 .550
Decisive .666 .591 .602
Courageous .505 .589 .532
Dynamic .547 .695 .736
Energetic .554 .645 .664
How to create reproducible brand personality scales

Appendix 3
Coefficients Aaker and control model
USA Germany France
1 2 3 1 2 3 1 2 3
Spirited .529 .617 .629
Aggressive .781 .818 .727
Brave .522 .583 .584
Bold .561 .736 .629
Tough .756 .705 .536
Lively .548 .550 .590
Ambitious .584 .571 .659
Daring .718 .723 .632
Active .596 .706 .738
Adventurous .604 .711 .576
Extraction method: principal component analysis. Rotation method: varimax with Kaiser normalization
Bold numbers represent high loadings correctly assigned to the intended factors
Aaker model Control model
USA Germany France USA Germany France
SRMR .0567 .0755 .0770 SRMR .0382 .0686 .0457
CFI .920 .881 .839 CFI .957 .929 .942
NFI .901 .861 .819 NFI .941 .912 .929
RMSEA .066 .075 .078 RMSEA .051 .064 .062
Sincerity Agreeableness
Down-to-earth .819 .713 .628 Expresses tender feelings .781 .761 .828
Family oriented .756 .660 .451 Considerate .844 .852 .845
Small-town .542a .322a .358a Forgiving .817 .836 .877
Honest .859 .775 .733 Kind .884 .814 .886
Sincere .853 .801 .738 Feminine .582 .486a .555a
Real .846 .778 .669 Sentimental .754 .824 .823
Wholesome .733 .640 .557 Affectionate .849 .864 .867
Original .707 .671 .693 Friendly .896 .907 .914
Cheerful .855 .819 .796 Sensitive .822 .824 .732
Sentimental .766 .765 .660 Tender .817 .850 .841
Friendly .835 .843 .713 Tolerant .805 .790 .859
a .943 .914 .888 a .952 .952 .956
AVE .615 .520 .420 AVE .654 .652 .682
Excitement Sincerity
Daring .812 .745 .749 Honest .829 .811 .844
Trendy .672 .758 .577 Sincere .823 .818 .831
Exciting .868 .766 .739 Rational .755 .717 .810
Spirited .825 .778 .693 Conscious .816 .671 .855
Cool .839 .771 .710 Genuine .779 .736 .791
Young .745 .710 .510a Trustworthy .789 .724 .683
Imaginative .853 .821 .736 Down-to-earth .797 .753 .809
Unique .806 .728 .682 Reliable .691 .742 .696
Up-to-date .680 .806 .719 Responsible .792 .767 .804
T. Lieven

References
Aaker, J.L. 1997. Dimensions of brand personality. Journal of
Marketing Research 34(3): 347–356. http://www.jstor.org/
stable/3151897?origin=crossref.
Aaker, J.L., and S. Fournier. 1995. A brand as a character, a partner
and a person: Three perspectives on the question of brand
personality. In NA—Advances in consumer research, vol. 22, ed.
F.R. Kardes, and M. Sujan, 391–395. Provo, UT: Association for
Consumer Research.
Aaker, D.A., and E. Joachimsthaler. 1999. The lure of global
branding. Harvard Business Review (November–December):
137–144.
Aaker, J.L., V. Benet-Martınez, and J. Garolera. 2001. Consumption
symbols as carriers of culture: A study of Japanese and Spanish
brand personality constructs. Journal of Personality and Social
Psychology 81 (3): 492–508.
Ashton, M.C., and K. Lee. 2005. A defence of the lexical approach to
the study of personality structure. European Journal of Person-
ality 19: 5–24.
Austin, J.R., J.A. Siguaw, and A.S. Mattila. 2003. A re-examination
of the generalizability of the Aaker brand personality
measurement framework. Journal of Strategic Marketing 11
(2): 77–92.
Azoulay, A., and J.-N. Kapferer. 2003. Do brand personality scales
really measure brand personality? The Journal of Brand
Management 11 (2): 143–155.
Bagozzi, R.P., and Y. Yi. 1988. On the evaluation of structural
equation models. Academy of Marketing Science 16 (1): 74–94.
Bollen, K.A. 1989. Structural equations with latent variables. New
York: Wiley.
Aaker model Control model
USA Germany France USA Germany France
Independent .843 .755 .715 Secure .790 .703 .767
Contemporary .660 .785 .601 Real .789 .754 .855
a .949 .939 .903 Stable .775 .684 .743
AVE .617 .587 .462 Steady .811 .659 .773
Competence Loyal .829 .817 .817
Reliable .832 .766 .625 a .960 .947 .960
Hardworking .826 .811 .751 AVE .626 .550 .629
Secure .825 .811 .715 Assertiveness
Intelligent .859 .856 .792 Masculine .470a .505a .555a
Technical .556a .586a .604 Decisive .752 .805 .851
Corporate .466a .800 .547a Courageous .827 .820 .875
Successful .573 .662 .731 Dynamic .802 .784 .780
Leader .654 .759 .612 Energetic .839 .785 .776
Confident .819 .783 .651 Spirited .850 .790 .778
a .906 .924 .871 Aggressive .573 .557 .337a
AVE .527 .583 .454 Brave .860 .806 .838
Sophistication Bold .696 .613 .811
Upper class .737 .629 .715 Tough .652 .645 .759
Glamorous .790 .636 .808 Lively .841 .798 .817
Good looking .816 .792 .700 Ambitious .789 .787 .757
Charming .869 .789 .751 Daring .728 .775 .817
Feminine .637 .510a .397a Active .818 .776 .773
Smooth .839 .836 .717 Adventurous .843 .768 .831
a .909 .873 .821 a .954 .948 .952
AVE .616 .501 .482 AVE .584 .549 .591
Ruggedness
Outdoorsy .888 .887 .684
Masculine .758 .751 .529
Western .751 .567 .436
Tough .862 .677 .748
Rugged .797 .481 .631
a .895 .794 .774
AVE .661 .472 .379
a Cronbach’s a is higher when this item is deleted
How to create reproducible brand personality scales
Brady, M.K., J.J. Cronin, G.L. Fox, et al. 2008. Strategies to offset
performance failures: The role of brand equity. Journal of
Retailing 84: 151–164.
Briggs, S.R., and J.M. Cheek. 1986. The role of factor analysis in the
development and evaluation of personality scales. Journal of
Personality 54 (1): 106–148.
Caprara, G.V., and D. Cervone. 2000. Personality—Determinants,
dynamics, and potentials. Cambridge: Press Syndicate of the
University of Cambridge.
Caprara, G.V., C. Barbaranelli, and G. Guido. 2001. Brand person-
ality: How to make the metaphor fit? Journal of Economic
Psychology 22: 377–395.
Cattell, R.B. 1943. The description of personality: Basic traits
resolved into clusters. Journal of Abnormal and Social Psychol-
ogy 38 (4): 476–506.
Cattell, R.B. 1945. The description of personality: Principles and
findings in a factor analysis. The American Journal of Psychol-
ogy 58 (1): 69–90.
Chen, F.F. 2007. Sensitivity of goodness of fit indexes to lack of
measurement invariance. Structural Equation Modeling: A
Multidisciplinary Journal 14 (3): 464–504.
Collins English Thesaurus. n.d. http://www.collinsdictionary.com/
dictionary/english-thesaurus/honest. Accessed 9 Sept 2015.
Collins English Thesaurus. n.d. http://www.collinsdictionary.com/
english-thesaurus. Accessed 15 Sept 2015.
De Mooij, M. 2003. Convergence and divergence in consumer
behavior: Implications for global advertising. International
Journal of Advertising 22: 183–202.
Dolch, E.W., and D. Leeds. 1953. Vocabulary tests and depth of
meaning. The Journal of Educational Research 47 (3): 181–189.
Douglas, S.P., C.S. Craig, and E.J. Nijssen. 2001. Integrating
branding strategy across markets: Building international brand
architecture. Journal of International Marketing 9(2): 97–114.
http://apps.webofknowledge.com/full_record.do?product=WOS
&search_mode=GeneralSearch&qid=1&SID=T17bUyKkQU3MR
qb9z7M&page=1&doc=2.
Dudenredaktion. 2014. Duden - Das Synonymworterbuch, 6. Auflage.
Ferrandi, J.-M., P. Valette-Florence, and S. Fine-Falcy. 2015. Aaker’s
brand personality scale in a French context: A replication and a
preliminary test of its validity. In Proceedings of the 2000
Academy of Marketing Science (AMS) annual conference, ed.
H.E. Spotts, and H.L. Meadow, 7–14. Cham: Springer.
Fornell, C., and D.F. Larcker. 1981. Evaluation structural equation
models with unobservable variables and measurement error.
Journal of Marketing Research 18 (1): 39–50.
Fournier, S. 1998. Consumers and their brands: Developing relation-
ship theory in consumer research. Journal of Consumer Research
24 (4): 343–353.
Freling, T.H., and L.P. Forbes. 2005. An examination of brand
personality through methodological triangulation. Journal of
Brand Management 13 (2): 148–162.
Freling, T.H., J.L. Crosno, and D.H. Henard. 2011. Brand personality
appeal: Conceptualization and empirical validation. Journal of
the Academy of Marketing Science 39 (3): 392–406.
Galton, F. 1884. The measurement of character. Fortnightly Review
36: 179–185.
Galton, F. 1888. Co-relations and their measurement, chiefly from
anthropometric data. Proceedings of the Royal Society of London
45: 135–145.
Geuens, M., B. Weijters, and K. De Wulf. 2009. A new measure of
brand personality. International Journal of Research in Market-
ing 26 (2): 97–107. doi:10.1016/j.ijresmar.2008.12.002.
Gilmore, G.W. 1919. Animism, or thought currents of primitive
people. Boston: Marshall Jones.
Goldberg, L.R. 1981. Language and individual differences: The
search for universals in personality lexicons. In Review of
personality and social psychology, vol. 2, ed. L. Wheeler,
141–165. Beverly Hills: Sage.
Goldberg, L.R. 1990. An alternative ‘description of personality’: The
big five factor structure. Journal of Psychology and Social
Psychology 59 (6): 1216–1229.
Goldberg, L.R., and J.M. Kilkowski. 1985. The prediction of semantic
consistency in self-descriptions: Characteristics of persons and
of terms that affect the consistency of responses to synonym and
antonym pairs. Journal of Personality and Social Psychology 48
(1): 82–98.
Grohmann, B. 2009. Gender dimensions of brand personality. Journal
of Marketing Research 46 (1): 105–119.
Harvey, G. 2005. Animism—Respecting the living world. London: C.
Hurst & Co.
Henson, R.K., and J.K. Roberts. 2006. Use of exploratory factor
analysis in published research: Common errors and some
comment on improved practice. Educational and Psychological
Measurement 66 (3): 393–416.
Hosany, S., Y. Ekinci, and M. Uysal. 2006. Destination image
and destination personality: An application of branding
theories to tourism places. Journal of Business Research 59
(5): 638–642.
Hu, L., and P.M. Bentler. 1999. Cutoff criteria for fit indexes in
covariance structure analysis: Conventional criteria versus new
alternatives. Structural Equation Modeling: A Multidisciplinary
Journal 6 (1): 1–55.
John, O.P., A. Angleitner, and F. Ostendorf. 1988. The lexical
approach to personality: A historical review of trait taxonomic
research. European Journal of Personality 2 (1988): 171–203.
Keller, K.L. 1993. Conceptualizing, measuring, and managing
customer-based brand equity. Journal of Marketing 57 (1): 1–22.
Kelloway, E.K. 1995. Structural equation modelling in perspective.
Journal of Organizational Behavior 16 (3): 215–224.
Kieffer, K.M. 1999. An introductory primer on the appropriate use of
exploratory and confirmatory factor analysis. Research in the
Schools 6 (2): 75–92.
Kim, C.K., D. Han, and S.-B. Park. 2001. The effect of brand
personality and brand identification on brand loyalty: Applying
the theory of social identification. Japanese Psychological
Research 43 (4): 195–206. doi:10.1111/1468-5884.00177.
Knapp, T.R. 1978. Canonical correlation analysis: A general
parametric significance-testing system. Psychological Bulletin
85 (2): 410–416.
Lieven, T., and C. Hildebrand. 2016. The impact of brand gender on
brand equity: Findings from a large-scale cross-cultural study
in ten countries. International Marketing Review 33 (2):
178–195.
Lieven, T., B. Grohmann, A. Herrmann, et al. 2014. The effect of
brand gender on brand equity. Psychology and Marketing 31 (5):
371–385.
MacCallum, R.C., K.F. Widaman, S.B. Zhang, et al. 1999. Sample
size in factor analysis. Psychological Methods 4 (1): 84–99.
Milas, G., and B. Mlacic. 2007. Brand personality and human
personality: Findings from ratings of familiar Croatian brands.
Journal of Business Research 60 (6): 620–626.
Mueller, R.O., and G.R. Hancock. 2001. Factor analysis and latent
structure: Confirmatory factor analysis. In International ency-
clopedia of social and behavioral sciences, ed. N.J. Smelser, and
P.B. Baltes, 5239–5244. Oxford: Pergamon.
Open Science Collaboration. 2015. Estimating the reproducibility of
psychological science. Science 349 (6251): aac4716-1-8.
Ouwersloot, H., and A. Tudorica. 2001. Brand personality creation
through advertising. Victoria, 25.
Robinson, W.S. 1950. Ecological correlations and the behavior of
individuals. American Sociological Review 15 (3): 351–357.
Spearman, C.E. 1927. The abilities of man. Oxford: Macmillan.
T. Lieven

Steenkamp Jan-Benedict, J.-B.E.M., and H. Baumgartner. 1998.
Assessing measurement invariance in cross-national consumer
research. Journal of Consumer Research 25 (1): 78–107.
Tabachnick, B.G., and L.S. Fidell. 1996. Using multivariate statistics,
3rd ed. New York: Harper Collins.
Universite de Caen Basse Normandie, France. n.d. Dictionnaire
Electronique des Synonymes (DES). http://www.crisco.unicaen.
fr/des/synonymes/. Accessed 12 Sept 2015.
Whitten, W.B., W. Newton Suter, and M.L. Frank. 1979. Bidirec-
tional synonym ratings of 464 noun pairs. Journal of Verbal
Learning and Verbal Behavior 18 (1): 109–127.
Yoo, B., N. Donthu, and S. Lee. 2000. An examination of selected
marketing mix elements and brand equity. Journal of the
Academy of Marketing Science 28 (2): 195–211.
Yoon, T.-H. 2004. An empirical study of the concept of brand
personality: The case of restaurants. http://epubs.surrey.ac.uk/
theses/49.
Theo Lieven has received degrees in management and economics and
is adjunct professor for marketing at the Institute for Customer
Insight, University of St. Gallen, Switzerland.
How to create reproducible brand personality scales