how to analyze your gender pay gap: an employer’s guide · 5 glassdoor | how to analyze your...
TRANSCRIPT
How to Analyze Your Gender Pay Gap: An Employer’s Guide
By Dr. Andrew ChamberlainChief Economist, Glassdoor
RESEARCH REPORT | APRIL 2017
This Gender Pay Analysis Guide is provided for informational purposes only and does not constitute legal advice. You should not rely upon this information without seeking advice from an attorney who is competent in the relevant field of law.
2 Glassdoor | How to Analyze Your Gender Pay Gap: An Employer's Guide
I. Introduction
2 I. Introduction
3 II. How to Think About the Gender Pay Gap
6 III. A Step-by-Step Guide
17 IV. What to Do Now
According to a recent Glassdoor survey, more than two-thirds (67 percent) of U.S. employees say they would not apply for jobs at employers where they believe a gender pay gap exists.1 Today, the gender pay gap is more than a social or legal issue. It’s an issue that can affect the ability of employers to attract and retain talent.
How should HR practitioners react to concerns about the gender pay gap? One increasingly popular way is to perform an internal gender pay audit to understand whether a gap exists at your company. This involves examining your own payroll data for evidence of a gender pay gap, and making recommendations to senior management about ways to lower gender barriers in recruitment, hiring, pay and promotion before they arise as broader organizational concerns.
Unfortunately, most HR teams today do not have technical data science staff who can perform complex statistical analysis of payroll data. The goal of this guide is to bridge that gap.
In this guide, we provide a technical step-by-step guide for how to analyze your company’s gender pay gap — including example data and code — showing you how to apply the rigorous methods used by the economists at Glassdoor Economic Research to your own payroll data.
Our goal is to arm HR practitioners with the basic tools they’ll need to perform their own internal gender pay audit, without the need to rely on expensive outside consultants and with limited support from technical data science staff. By making it easy for companies to study their gender pay gaps — and share the results with employees — we believe we can make significant progress toward better gender pay fairness in today’s labor market.
With that prelude, let’s get started.
1 “Global Gender Pay Gap Survey” (February 2016), Glassdoor. Available at https://www.glassdoor.com/press/equal-pay-equal-work-glassdoor- survey-finds-perceptions-dont-match-reality-7-countries-majority-employed-adults-men-women-company-paid-equally/.
Download the accompanying data and code for this guide at:
R Code: https://glassdoor.box.com/v/gender-pay-code
Data: https://glassdoor.box.com/v/gender-pay-data
3 Glassdoor | How to Analyze Your Gender Pay Gap: An Employer's Guide
What do we mean by the “gender pay gap”? In this guide, it simply means: The difference between average pay for men and women, both before and after we’ve accounted for differences among workers in education, experience, job roles, employee performance and other factors aside from gender that affect pay.
The most important thing to know about the gender pay gap is that there’s not one best way to measure it. Instead, there are different ways to measure pay gaps, each with their own pros and cons. As an employer auditing your gender pay gap, it’s important to understand the differences between different measures, and pick the approach that’s right for your company.
WHICH MEASURE IS BEST?
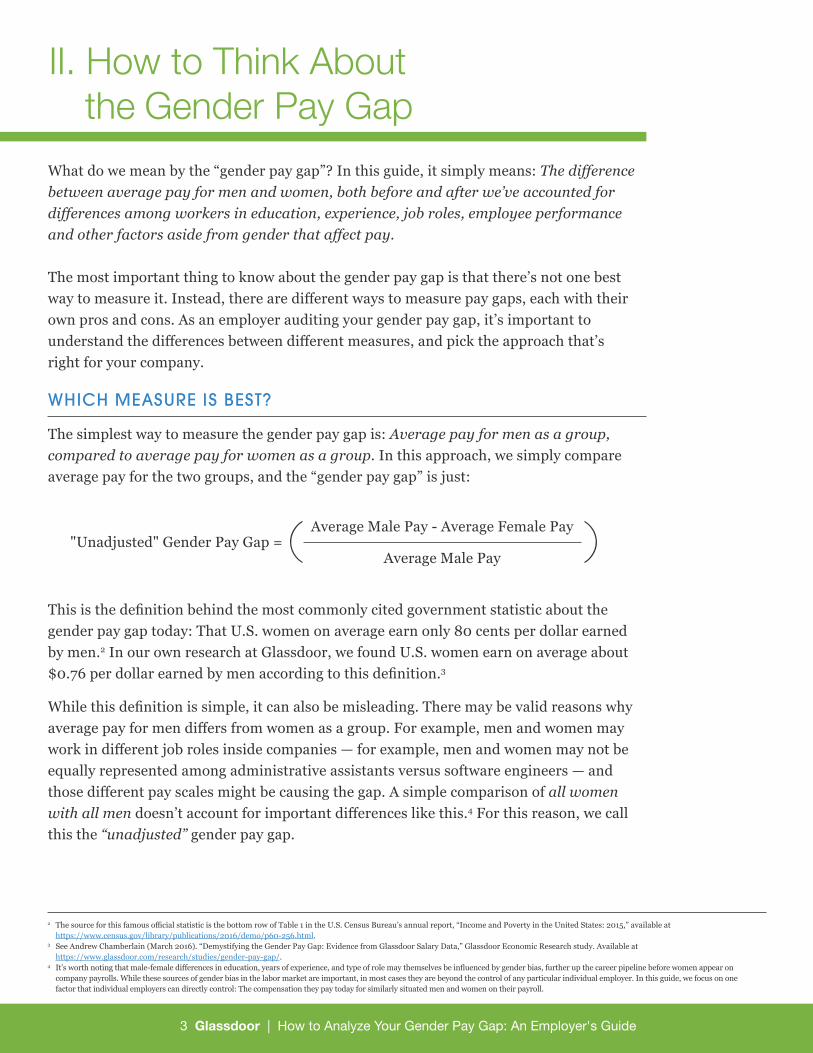
The simplest way to measure the gender pay gap is: Average pay for men as a group, compared to average pay for women as a group. In this approach, we simply compare average pay for the two groups, and the “gender pay gap” is just:
This is the definition behind the most commonly cited government statistic about the gender pay gap today: That U.S. women on average earn only 80 cents per dollar earned by men.2 In our own research at Glassdoor, we found U.S. women earn on average about $0.76 per dollar earned by men according to this definition.3
While this definition is simple, it can also be misleading. There may be valid reasons why average pay for men differs from women as a group. For example, men and women may work in different job roles inside companies — for example, men and women may not be equally represented among administrative assistants versus software engineers — and those different pay scales might be causing the gap. A simple comparison of all women with all men doesn’t account for important differences like this.4 For this reason, we call this the “unadjusted” gender pay gap.
II. How to Think About the Gender Pay Gap
2 The source for this famous official statistic is the bottom row of Table 1 in the U.S. Census Bureau’s annual report, “Income and Poverty in the United States: 2015,” available at https://www.census.gov/library/publications/2016/demo/p60-256.html. 3 See Andrew Chamberlain (March 2016). “Demystifying the Gender Pay Gap: Evidence from Glassdoor Salary Data,” Glassdoor Economic Research study. Available at https://www.glassdoor.com/research/studies/gender-pay-gap/.4 It’s worth noting that male-female differences in education, years of experience, and type of role may themselves be influenced by gender bias, further up the career pipeline before women appear on company payrolls. While these sources of gender bias in the labor market are important, in most cases they are beyond the control of any particular individual employer. In this guide, we focus on one factor that individual employers can directly control: The compensation they pay today for similarly situated men and women on their payroll.
"Unadjusted" Gender Pay Gap =Average Male Pay - Average Female Pay( )Average Male Pay
4 Glassdoor | How to Analyze Your Gender Pay Gap: An Employer's Guide
A more accurate way to look at the gender pay gap is to compare similarly situated male and female employees — an apples-to-apples comparison. Because many factors affect pay, we should try to separately measure them to understand how each impacts pay. In addition to gender, this comparison will ensure we’ve accounted for differences in education, experience, type of job role and others factors that differ between men and women. The goal is to make a fair comparison between similar workers, to see what gender pay gap remains. This is what we call the “adjusted” gender pay gap.
In order to move from the simple “unadjusted” to the more sophisticated “adjusted” pay gap you’ll have to do some statistics — something we’ll show you how to do below. But it’s important to keep in mind that both of these measures are useful.
By looking at both your company’s “unadjusted” and “adjusted” gender pay gap, you’ll gain a robust view of what’s causing pay differences between men and women, which will help you solve any problems you find. This exercise will reveal whether pay gaps are due to years of experience, education, performance evaluations, job roles or other factors. We recommend employers always examine both their “unadjusted” and “adjusted” pay gaps when performing a gender pay audit.
HOW TO CALCULATE YOUR ADJUSTED PAY GAP
Economists estimate gender pay gaps by estimating a salary equation.5 That means you write down an equation that relates employee pay to personal characteristics like years of experience, education, job role, gender and other factors. You then use basic regression analysis or “ordinary least squares” to estimate the impact of each factor on pay using your company’s payroll data. In Section III, we’ll walk you through a detailed step-by-step guide for how to do this.
This approach tells us the separate impact of each factor on pay — gender, as well as other factors — and shows us whether males have a pay advantage or not after we’ve accounted for these differences between workers.
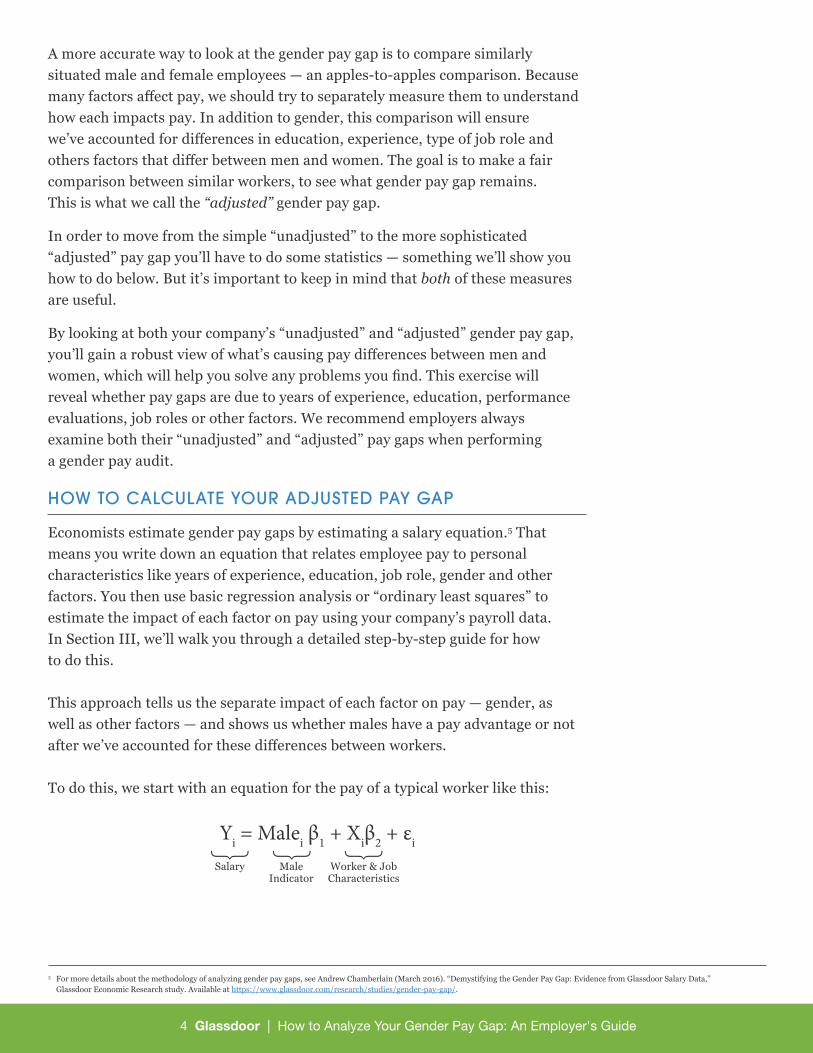
To do this, we start with an equation for the pay of a typical worker like this:
Yi = Malei β1 + Xiβ2 + εi
5 For more details about the methodology of analyzing gender pay gaps, see Andrew Chamberlain (March 2016). “Demystifying the Gender Pay Gap: Evidence from Glassdoor Salary Data,” Glassdoor Economic Research study. Available at https://www.glassdoor.com/research/studies/gender-pay-gap/.
Salary Male Indicator
Worker & Job Characteristics

5 Glassdoor | How to Analyze Your Gender Pay Gap: An Employer's Guide
In this equation, Yi is the annual salary of worker i, Malei is a dummy equal to 1 for men and 0 for women, and Xi is a large collection of controls for everything about workers and jobs that we think might explain pay differences — including age, education, years of experience, job role, performance evaluation scores and other factors.
Using any statistical software, like R, Stata, Python, SAS or others, we then estimate this equation using your company’s payroll data. The estimated coefficient on the “male” dummy term β1 tells us the “adjusted” gender pay gap in your company’s data. It tells us the approximate pay advantage for men compared to women, all else equal.6
If your company has a gender pay issue, this simple and transparent method will help you uncover it. This approach works for companies of almost any size — as long as you have 200 or more employees — and is simple enough for anyone with basic experience in regression analysis to use.
An Approach for Advanced Users For most employers, we recommend the above approach to audit your gender pay gap. However, for larger employers with a more sophisticated data science team there’s an alternative known as a Oaxaca-Blinder decomposition.
Under this approach, we start with the overall gender pay gap and decompose how much is “explained” by differences in employee and job characteristics, and how much is left “unexplained” and may be due to subtle biases in the workplace.7 For an explanation of how the Oaxaca-Blinder decomposition works and how to implement one yourself, our March 2016 study provides a detailed summary.8
While more sophisticated methods like the Oaxaca-Blinder decomposition are popular in academic research, in practice they suffer from many drawbacks. First, this method requires a lot of payroll data, making it applicable only by large employers with more than 1,000 employees. Second, it relies on a strong assumption about the linear relation between pay and worker characteristics — something we find is often violated in practice, making the results unstable and sensitive to underlying assumptions in how the decomposition is done. Finally, this method is complicated and requires an economist or expert data scientist on staff.
For these reasons, we don’t recommend the Oaxaca-Blinder decomposition for most employers. Instead, we recommend the simpler method outlined above — ordinary regression analysis with a dummy indicator for gender and controls for employee characteristics. In the remainder of this guide, that’s the approach we’ll focus on.
6 If this equation is estimated using annual salaries, it shows the male pay advantage in dollars. If it’s estimated using the natural logarithm or “log” of salaries — as we recommend below in this guide — it shows the percentage gender pay gap between men and women. 7 See Oaxaca (1973) and Blinder (1973). For a practical overview of how the Oaxaca-Blinder decomposition is implemented by researchers at the World Bank, see O’Donnell, Owen et al. (2008). 8 Andrew Chamberlain (March 2016). “Demystifying the Gender Pay Gap: Evidence from Glassdoor Salary Data,” Glassdoor Economic Research study. Available at https://www.glassdoor.com/research/studies/gender-pay-gap/.
6 Glassdoor | How to Analyze Your Gender Pay Gap: An Employer's Guide
III. A Step-by-Step Guide
In this section we’ll walk you through a step-by-step example of how to study your company’s gender pay gap using the statistical software R. However, you can use any other statistical software to analyze your pay gap (Stata, Python, SAS, or others).
Before diving in, there are a few questions your HR team should ask to be sure you’re ready for a gender pay audit.
• How good is your HR data reporting process? For this analysis, your HR team will need to provide accurate and timely information on employees, such as age, gender, seniority level, current annual base pay, bonus pay, recent performance evaluation scores, and other employee data. You’ll need this process to be a well-oiled machine to realistically support an ongoing process of gender pay audits.
• Who will perform your analysis? A gender pay audit will require someone to compile the data and do the statistical analysis. Be sure you’ve identified who this individual contributor will be before starting the process. We recommend this work be done by a member of your company’s analytics, data science, or finance team who has some experience with regression analysis and statistical software.
• Are you large enough for this approach to work? In our experience, the approach we use in this guide requires at least 200 employees to provide reliable results. We don’t recommend our approach for small companies with few than 200 employees. For small employers, a case-by-case analysis of gender pay difference by job title may be a more appropriate way to perform a gender pay audit.
Once your HR team has answered these questions, you’re ready to get started on a gender pay audit. Let’s walk through the steps you’ll need to take.

7 Glassdoor | How to Analyze Your Gender Pay Gap: An Employer's Guide
STEP 1. INSTALL THE SOFTWARE YOU’LL NEED
The first step is to obtain the statistical software you’ll need to audit your gender pay gap. Any standard statistical software will work, including R, Python, Stata, SAS and more. This step will likely be done by the individual contributor you’ve identified in data science, finance or analytics. They’ll be the ones running your regression analysis.
In this guide, we’ll walk you through an example using R, the open source statistical computing language. R is free, easy to learn, and is maintained by an active open-source community of academic statistical researchers.
To get started, we recommend installing a copy of R Studio on your computer, which is a freely available R user interface that’s available for both Mac and PC. You can download and install a copy here: https://www.rstudio.com/products/rstudio/download/.
STEP 2. GATHER YOUR DATA
Your next step is to gather employee data from your HR team. Here is our recommended data you should try to collect. It’s important to note that you don’t need to have all of these data to analyze your gender pay gap. More data is better, but you can still perform a basic gender pay audit with even a few of these variables.
For each employee, we recommend trying to collect information on:
• Gender;
• Job title (or role, such as “individual contributor,” “manager”, etc.);
• Age or birth year;
• Company department;
• City or state location (if your company has multiple workplaces);
• Full-time / part-time status;
• Annual base pay;
• Annual bonuses, commissions, stock awards or other compensation;
• Seniority level (such as “tier” within the company);
• Highest education (high school, college, grad school, etc.);
• Score on most recent performance evaluation (if applicable);
• Hire date; and
• Race or ethnicity.

8 Glassdoor | How to Analyze Your Gender Pay Gap: An Employer's Guide
Ask your HR team to compile these data in an Excel file, with columns for each piece of information. As you collect these data, be sure to keep all personally identifying information out of the file, such as names or employee numbers. It’s important to protect employee privacy and anonymity at all times while conducting a gender pay audit.
Here’s an example of what your Excel file might look like once you’re finished.
Job Title Gender AgeHighest
EducationLatest Performance
Evaluation Score (1-5)Department
Seniority Level (1-5)
Base Pay Bonus Pay
Graphic Designer Female 36 Masters 5 Operations 2 $52,911 $10,014
Software Engineer Male 32 College 3 Management 5 $124,520 $11,117
Warehouse Associate Female 29 High School 4 Administration 4 $102,074 $10,300
Software Engineer Male 46 Ph.D. 5 Engineering 3 $87,794 $11,256
Graphic Designer Male 55 College 4 Sales 3 $93,408 $10,182
Employee privacy is important. Before analyzing any payroll data, we recommend you have a plan in place to protect the privacy and anonymity of your employees. No personally identifying information should ever be transferred to the analyst who is tasked with performing your gender pay audit. All sensitive information should be removed from your data file before analyzing the gender pay gap.
In some cases, this will require your HR team to suppress the job title of employees in unique roles. For example, if there is only one VP of Marketing, we recommend replacing this job title with a numerical code (such as “12345”) or grouping it together with other similar job titles to prevent any individual employee from being identified from your data. Only trusted employees who are covered by your company’s non-disclosure policy should perform gender pay audits.
Second, take data security seriously when performing a gender pay audit. Employee payroll data should never be emailed or stored in a cloud data storage platform that may be subject to hacks or security breaches. Instead, we recommend you store data on an encrypted, removable flash drive that is locked in a secure physical location (such as a locked file cabinet in your company’s offices).
If you’re not sure how to encrypt a USB flash drive, ask an expert on your IT team for help. This is the most secure way to store your data, and help safeguard your employee information.
PRIVACY AND DATA SECURITY MATTER
9 Glassdoor | How to Analyze Your Gender Pay Gap: An Employer's Guide
STEP 3. CLEAN UP YOUR DATA
Before crunching the numbers for your gender pay audit, there are few easy pre-analysis clean ups that we recommend for your payroll data.
• Group together similar job titles: Organize job titles into a smaller number of related groups. Having too many unique job titles with only a few workers in each will make your statistical work less reliable. For example, group together job titles like Financial Analyst I, Senior Financial Analyst, and Forecasting Financial Analyst into one “Financial Analyst” role. Your goal should be to have many men and women in each job role, so that we can study the pay gap within job titles.9
• Group together similar departments: We recommend grouping together departments in your company into the smallest number that you can, while still preserving important differences between groups. This is for the same reason as with job titles: We want as large a mixture of women and men within each department as possible, to provide us with enough data in each to estimate gender pay gaps by department.
• Focus on grouping workers by country: If you’re an international company, we recommend you always examine gender pay gaps for countries separately. Each country has dramatically different labor regulations, institutions, and currency differences that make workers in different countries not comparable. If you’re mostly a U.S. employer, we recommend you omit all overseas employees from your analysis and focus on U.S. workers only.
• Focus on full-time workers: We recommend only including full-time workers in your gender pay audit. Research shows dramatic differences in the labor markets facing full- and part-time workers — they are not directly comparable. If your company employs many part-time workers, we recommend you perform gender pay audits separately for full- and part-time workers. If your company is mostly a full-time employer, we recommend you omit part-time workers from your audit.
• Value stock grants at current market value: If you’re an employer that pays your workers partly in equity — such as restricted stock grants — you’ll need to make a decision about how to value that annual compensation. We recommend valuing equity compensation at current fair market value, based on today’s prevailing share price. In your data file, add this compensation to your “bonus” compensation column.
9 For your statistical analysis to be valid, you won’t need an equal number of men and women in each job title or role. You only need two or more of each gender within each category to separately identify the gender pay gap in that group. However, if you can group together similar workers into categories with more men and women mixed together, your statistical estimates of the gender pay gap will be more accurate and reliable.

10 Glassdoor | How to Analyze Your Gender Pay Gap: An Employer's Guide
STEP 4. LOAD YOUR DATA INTO R
Now that you have a clean data file, it’s time to load it into R for analysis. To help walk you through an example of how to do this, we’ve provided R code and a sam-ple data file for a hypothetical employer with 1,000 employees, spread across 10 job roles and 5 company departments.
Before moving on, we recommend you download our example CSV data file here: https://glassdoor.box.com/v/gender-pay-data. Also, you’ll want to download our free accompanying R code here: https://glassdoor.box.com/v/gender-pay-code, which contains all the code you’ll need to perform your own gender pay audit.
Here are ten sample rows from our hypothetical data file. This is what your own data file should look like before loading it into R.
To load your data into R, open the R Studio application and go to File > New File > R Script. That will open a new window that we’ll type our code into. In that window, here’s the code to import your CSV data file (and load the needed R packages for analysis: “stargazer,” “broom” and “dplyr”).
# Load R libraries we’ll use. library(stargazer) library(broom) library(dplyr)
# Load employee data.
data <- read.csv("data.csv")
Job Title Gender AgeLatest Performance
Evaluation Score (1-5)Highest
EducationDepartment
Seniority Level (1-5)
Base Pay Bonus Pay
Marketing Associate Female 51 2 High School Management 2 $70,658 $5,083
IT Male 50 1 College Operations 3 $89,678 $3,454
Data Scientist Female 55 3 Masters Administration 4 $107,986 $6,412
Manager Male 56 3 Masters Engineering 4 $139,842 $6,715
Marketing Associate Female 24 3 PhD Operations 4 $72,205 $7,932
Driver Male 42 3 PhD Operations 4 $103,094 $6,376
IT Male 47 5 PhD Operations 1 $76,575 $7,853
Software Engineer Male 21 4 PhD Engineering 5 $100,702 $8,413
Warehouse Associate Male 22 5 Masters Engineering 2 $64,794 $10,114
Driver Male 38 5 PhD Engineering 4 $99,741 $9,400
11 Glassdoor | How to Analyze Your Gender Pay Gap: An Employer's Guide
STEP 5. GET THE DATA READY
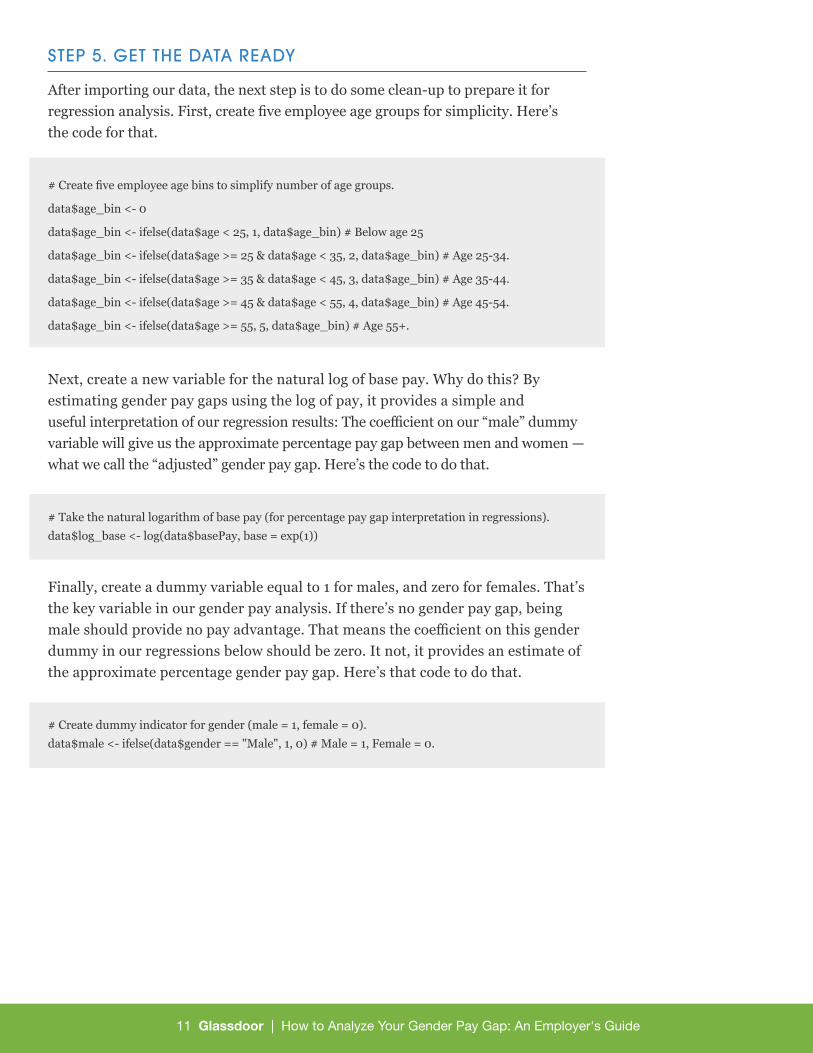
After importing our data, the next step is to do some clean-up to prepare it for regression analysis. First, create five employee age groups for simplicity. Here’s the code for that.
# Create five employee age bins to simplify number of age groups.
data$age_bin <- 0
data$age_bin <- ifelse(data$age < 25, 1, data$age_bin) # Below age 25
data$age_bin <- ifelse(data$age >= 25 & data$age < 35, 2, data$age_bin) # Age 25-34.
data$age_bin <- ifelse(data$age >= 35 & data$age < 45, 3, data$age_bin) # Age 35-44.
data$age_bin <- ifelse(data$age >= 45 & data$age < 55, 4, data$age_bin) # Age 45-54.
data$age_bin <- ifelse(data$age >= 55, 5, data$age_bin) # Age 55+.
Next, create a new variable for the natural log of base pay. Why do this? By estimating gender pay gaps using the log of pay, it provides a simple and useful interpretation of our regression results: The coefficient on our “male” dummy variable will give us the approximate percentage pay gap between men and women — what we call the “adjusted” gender pay gap. Here’s the code to do that.
# Take the natural logarithm of base pay (for percentage pay gap interpretation in regressions). data$log_base <- log(data$basePay, base = exp(1))
Finally, create a dummy variable equal to 1 for males, and zero for females. That’s the key variable in our gender pay analysis. If there’s no gender pay gap, being male should provide no pay advantage. That means the coefficient on this gender dummy in our regressions below should be zero. It not, it provides an estimate of the approximate percentage gender pay gap. Here’s that code to do that.
# Create dummy indicator for gender (male = 1, female = 0). data$male <- ifelse(data$gender == "Male", 1, 0) # Male = 1, Female = 0.
12 Glassdoor | How to Analyze Your Gender Pay Gap: An Employer's Guide
STEP 6. LOOK AT THE DATA
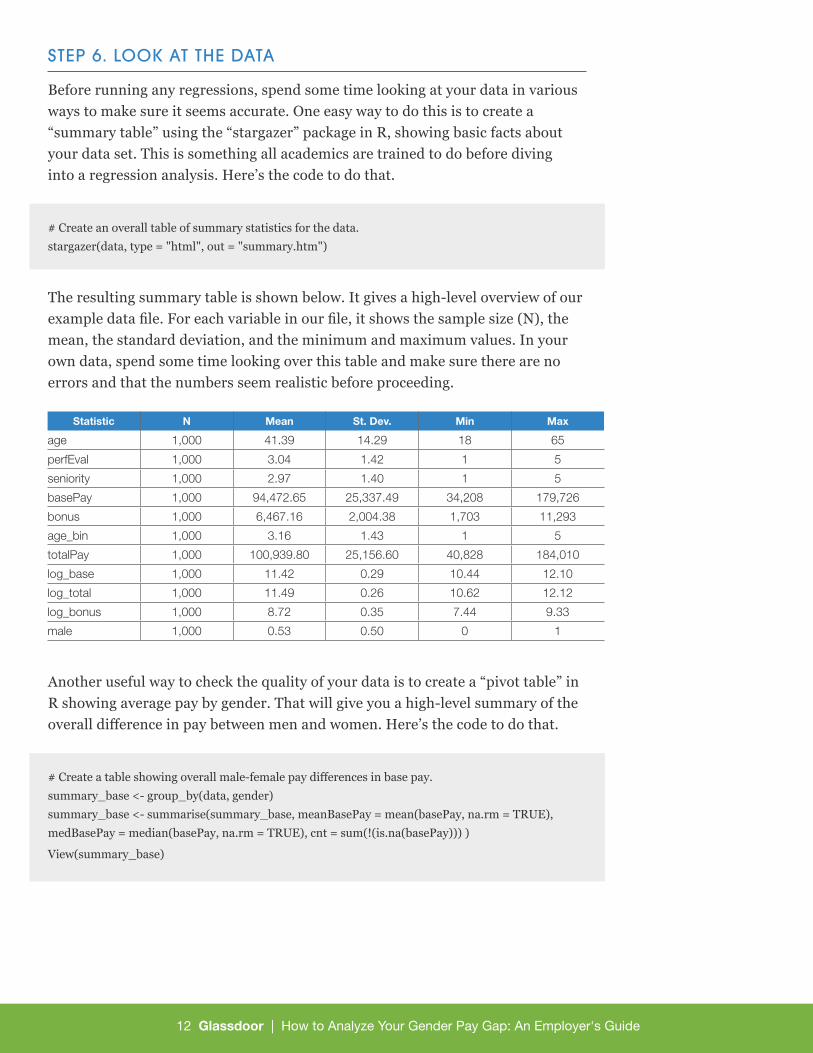
Before running any regressions, spend some time looking at your data in various ways to make sure it seems accurate. One easy way to do this is to create a “summary table” using the “stargazer” package in R, showing basic facts about your data set. This is something all academics are trained to do before diving into a regression analysis. Here’s the code to do that.
# Create an overall table of summary statistics for the data. stargazer(data, type = "html", out = "summary.htm")
The resulting summary table is shown below. It gives a high-level overview of our example data file. For each variable in our file, it shows the sample size (N), the mean, the standard deviation, and the minimum and maximum values. In your own data, spend some time looking over this table and make sure there are no errors and that the numbers seem realistic before proceeding.
Another useful way to check the quality of your data is to create a “pivot table” in R showing average pay by gender. That will give you a high-level summary of the overall difference in pay between men and women. Here’s the code to do that.
# Create a table showing overall male-female pay differences in base pay. summary_base <- group_by(data, gender) summary_base <- summarise(summary_base, meanBasePay = mean(basePay, na.rm = TRUE), medBasePay = median(basePay, na.rm = TRUE), cnt = sum(!(is.na(basePay))) )
View(summary_base)
Statistic N Mean St. Dev. Min Max
age 1,000 41.39 14.29 18 65
perfEval 1,000 3.04 1.42 1 5
seniority 1,000 2.97 1.40 1 5
basePay 1,000 94,472.65 25,337.49 34,208 179,726
bonus 1,000 6,467.16 2,004.38 1,703 11,293
age_bin 1,000 3.16 1.43 1 5
totalPay 1,000 100,939.80 25,156.60 40,828 184,010
log_base 1,000 11.42 0.29 10.44 12.10
log_total 1,000 11.49 0.26 10.62 12.12
log_bonus 1,000 8.72 0.35 7.44 9.33
male 1,000 0.53 0.50 0 1
13 Glassdoor | How to Analyze Your Gender Pay Gap: An Employer's Guide
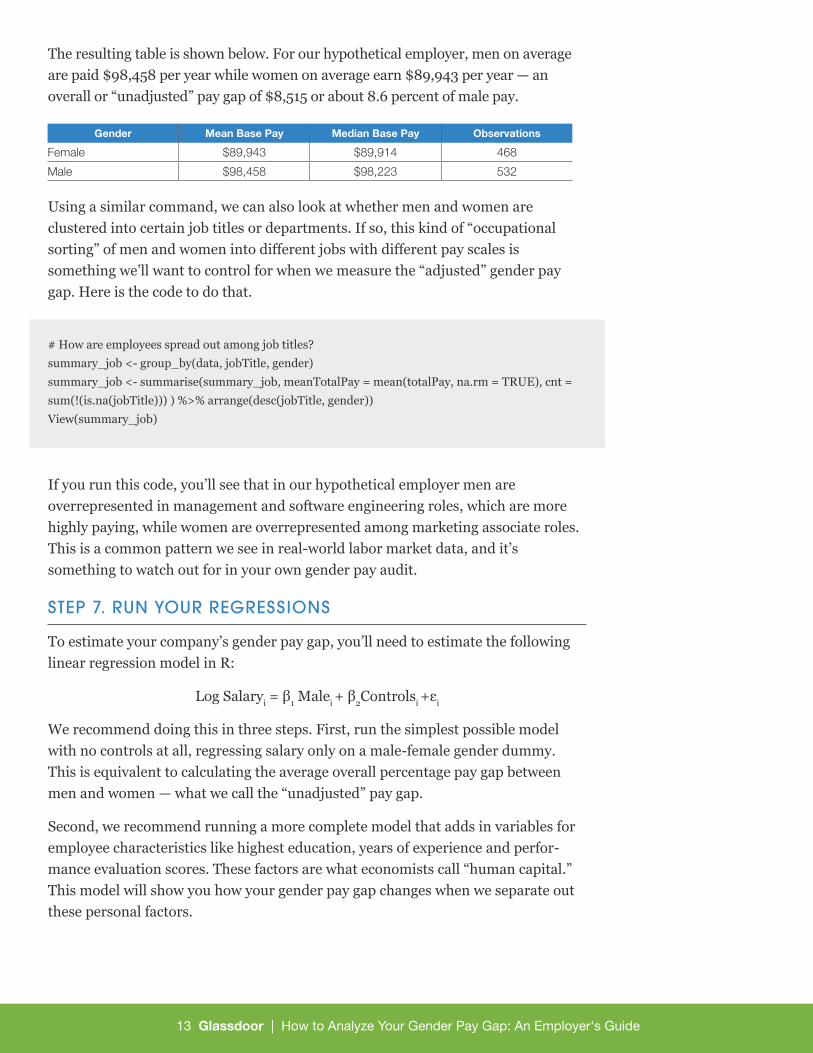
The resulting table is shown below. For our hypothetical employer, men on average are paid $98,458 per year while women on average earn $89,943 per year — an overall or “unadjusted” pay gap of $8,515 or about 8.6 percent of male pay.
Using a similar command, we can also look at whether men and women are clustered into certain job titles or departments. If so, this kind of “occupational sorting” of men and women into different jobs with different pay scales is something we’ll want to control for when we measure the “adjusted” gender pay gap. Here is the code to do that.
# How are employees spread out among job titles? summary_job <- group_by(data, jobTitle, gender) summary_job <- summarise(summary_job, meanTotalPay = mean(totalPay, na.rm = TRUE), cnt = sum(!(is.na(jobTitle))) ) %>% arrange(desc(jobTitle, gender)) View(summary_job)
If you run this code, you’ll see that in our hypothetical employer men are overrepresented in management and software engineering roles, which are more highly paying, while women are overrepresented among marketing associate roles. This is a common pattern we see in real-world labor market data, and it’s something to watch out for in your own gender pay audit.
STEP 7. RUN YOUR REGRESSIONS
To estimate your company’s gender pay gap, you’ll need to estimate the following linear regression model in R:
Log Salaryi = β1 Malei + β2Controlsi +εi
We recommend doing this in three steps. First, run the simplest possible model with no controls at all, regressing salary only on a male-female gender dummy. This is equivalent to calculating the average overall percentage pay gap between men and women — what we call the “unadjusted” pay gap.
Second, we recommend running a more complete model that adds in variables for employee characteristics like highest education, years of experience and perfor-mance evaluation scores. These factors are what economists call “human capital.” This model will show you how your gender pay gap changes when we separate out these personal factors.
Gender Mean Base Pay Median Base Pay Observations
Female $89,943 $89,914 468
Male $98,458 $98,223 532
14 Glassdoor | How to Analyze Your Gender Pay Gap: An Employer's Guide
Finally, we recommend running a model with all of the controls that you have access to, including job title, department and more. The coefficient on the male- female dummy in this model tells you the gender pay gap that’s left over after you’ve made an apples-to-apples comparison of male and female workers, controlling for every difference you see in the data. This is what we call the “adjusted” pay gap.
Here is the R code for running those three regression models, and creating an organized table of results.
# No controls. ("unadjusted" pay gap.) model1 <- lm(log_base ~ male, data = data)
# Add controls for age, education and performance evaluations. model2 <- lm(log_base ~ male + perfEval + age_bin + edu, data = data)
# Add all controls. ("adjusted" pay gap.) model3 <- lm(log_base ~ male + perfEval + age_bin + edu + dept + seniority + jobTitle, data = data)
# Publish a clean table of regression results. stargazer(model1, model2, model3, type = "html", out = "results.htm")
STEP 8. INTERPRET THE RESULTS
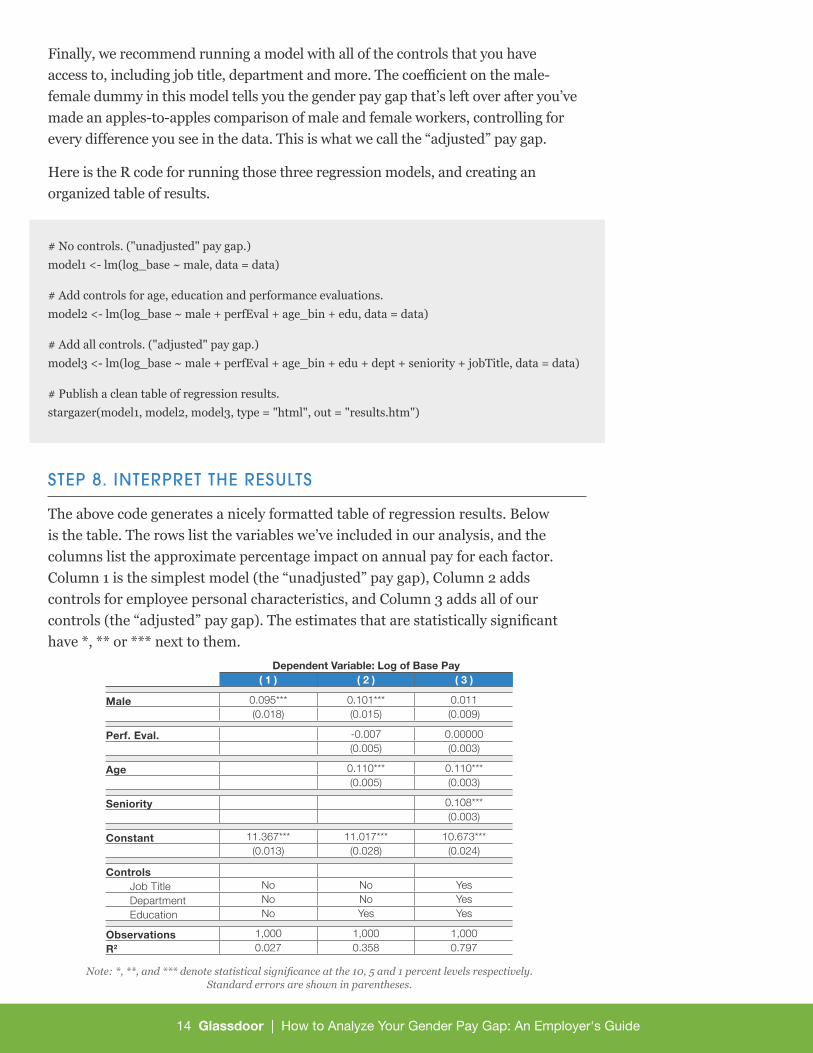
The above code generates a nicely formatted table of regression results. Below is the table. The rows list the variables we’ve included in our analysis, and the columns list the approximate percentage impact on annual pay for each factor. Column 1 is the simplest model (the “unadjusted” pay gap), Column 2 adds controls for employee personal characteristics, and Column 3 adds all of our controls (the “adjusted” pay gap). The estimates that are statistically significant have *, ** or *** next to them.
Dependent Variable: Log of Base Pay( 1 ) ( 2 ) ( 3 )
Male 0.095*** 0.101*** 0.011(0.018) (0.015) (0.009)
Perf. Eval. -0.007 0.00000(0.005) (0.003)
Age 0.110*** 0.110***(0.005) (0.003)
Seniority 0.108***(0.003)
Constant 11.367*** 11.017*** 10.673***(0.013) (0.028) (0.024)
ControlsJob Title No No YesDepartment No No YesEducation No Yes Yes
Observations 1,000 1,000 1,000R2 0.027 0.358 0.797
Note: *, **, and *** denote statistical significance at the 10, 5 and 1 percent levels respectively. Standard errors are shown in parentheses.
15 Glassdoor | How to Analyze Your Gender Pay Gap: An Employer's Guide
The first row of the table shows our estimates of the “unadjusted” and “adjusted” gender pay gap. That’s the coefficient on our male-female dummy. In Column 1, a coefficient of 0.095 means there is a 9.5 percent “unadjusted” gender pay gap in our hypothetical company. Put differently, men on average earn about 9.5 percent more than women on average in this company. We also see this estimate is highly statistically significant.
In Column 2, we add individual controls like age, performance evaluations and education. Here we see the gender pay gap hasn’t changed much. It’s still a 10.1 percent pay gap, which is still highly statistically significant. Whatever is causing the pay gap in our hypothetical employer isn’t due to differences in education, age or performance evaluations of men and women.
In Column 3 we add all of the controls we have in our data. This is the “adjusted” gender pay gap. In this case, we see the gender pay gap shrinks to 1.1 percent after controlling for job title, job seniority and company department. More importantly, this estimate is no longer statistically significant — so we can’t conclude it’s really different from zero. In this case, we say there’s no evidence of a systematic gender pay gap on an “adjusted” basis, after controlling for observable differences between male and female workers.
Why Does the Gap Disappear? In our hypothetical data, the gender pay gap shrinks to near zero once we control for differences in job titles between men and women. Why is this? It’s because in our hypothetical data, men are over-represented in higher-paying software engineer and manager roles, while they are under-represented in lower-paying marketing roles.
Once we control for the fact that men and women work in different roles in this company, the remaining pay difference that’s due to differences in gender turns out to be very small — in this case, close to zero.
STEP 9. LOOK FOR GAPS BY JOB TITLE AND DEPARTMENT
Even if your company does not have an overall pay gap between men and women, it’s still possible that gender pay gaps are hidden only within certain job titles or departments.
To test for differences in the gender pay gap among departments or job titles in your company, we make a slight adjustment to the models above. In addition to including a “male” dummy, we include interaction terms for male x department, or male x job title. By looking at whether the coefficients on these interaction terms are statistically significant or not, we can test whether the gender pay gap within certain job titles or departments differs from the overall company average.10
10 For more details on using interaction terms to test for differences among subgroups, see Richard Williams, “Interaction Effects and Group Comparisons,” available at http://gldr.co/1LG91nD.
16 Glassdoor | How to Analyze Your Gender Pay Gap: An Employer's Guide
Here’s the code to test for differences in the gender pay gap among different job titles.
# All controls with job title interaction terms. job_results <- lm(log_base ~ male*jobTitle + perfEval + age_bin + edu + seniority + dept, data = data)
# Publish a clean table of regression results. stargazer(job_results, type = "html", out = "job.htm")
After running this code, examine each of the coefficients in the table of results for the male x job title interaction terms. If they’re statistically significant, that means the gender pay gap in that particular job title is different from the overall company average, and it’s worth investigating why. If they’re not significant, there’s no evidence of differences in pay gaps by job title.
If you want to see what the estimated gender pay gap is for each job title, you’ll simply need to combine two numbers from your regression output. For the gender pay gap in a particular job title, add together the coefficient from the male variable plus the coefficient from the male x job title variable for that job title. That tells you the gender gap from being both male and working in that particular role.
STEP 10. DECIDE WHETHER TO GO FURTHER
In this example, we focus on base pay and used ordinary regression analysis to estimate our gender pay gap. While this method works well for most companies, if you’re a large employer with a skilled data science team, you may want to dive deeper for your gender pay audit.
For those looking to go the extra mile in terms of analyzing their gender pay gap, we recommend performing a Oaxaca-Blinder decomposition on your payroll data. Compared to the simple method above, this will provide a more detailed picture of what’s causing any gender pay gap in your company, dividing the overall gap into an “explained” and “unexplained” portion — and highlighting what factors are responsible for each.
You can implement a Oaxaca-Blinder decomposition in R using the freely available “oaxaca” package. Because this method is complex and requires many judgment calls by whomever performs your analysis, we recommended it only for experts.11
11 For more details about how to implement and interpret the results of a Oaxaca-Blinder decomposition, see Andrew Chamberlain (March 2016). “Demystifying the Gender Pay Gap: Evidence from Glassdoor Salary Data,” Glassdoor Economic Research study. Available at https://www.glassdoor.com/research/studies/gender-pay-gap/.
17 Glassdoor | How to Analyze Your Gender Pay Gap: An Employer's Guide
IV. What to Do Now
Performing a gender pay audit at your company is an important first step. Once you’ve completed your analysis, what’s the next step?
First, you should decide whether to share your findings internally with employees. Being transparent about your efforts to pay workers fairly can help boost employee engagement, and contribute toward a healthy culture of fair pay and openness. However, internal communication of the results of your gender pay audit may not be right for every employer — it’s a decision leadership teams will approach differently.
Next, you’ll have to decide whether the results of your gender pay audit suggest that changes may be necessary in your company’s pay and promotion systems. If your analysis identifies a large “adjusted” pay gap, or particularly large gender gaps within certain departments or job titles, your analysis can help target where to invest efforts to improve pay fairness in the future.
Finally, your team should decide whether or not to share the results of your internal gender pay audit with the world. Many employers have publicized the findings of their internal gender pay analyses — including Glassdoor12 — and your company may wish to do so as well. Being transparent about gender pay fairness can help build employer brand and goodwill with job seekers, customers, and the broader public. One way to publicize your commitment to pay equality is to take the Glassdoor Equal Pay Pledge and showcase a badge on your profile.
With this guide, our goal is to encourage employers to build regular gender pay audits into the DNA of their hiring, pay and promotions systems. We believe that doing so can provide benefits to employers, to workers, and the broader effort in America to promote greater gender fairness in the workplace.
MORE RESOURCES:
• 5 Ways to Address the Gender Pay Gap at Your Company
• What to Do About the Gender Pay Gap
• How We Analyzed the Pay Gap at Glassdoor
• An Employer’s Guide to Know Your Worth
• Glassdoor Guide to Salary Conversations
• How to Use Salary Estimates to Determine Your Next Employee’s Salary
• Take the Glassdoor Equal Pay Pledge
12 See Andrew Chamberlain (June 14, 2016). “How We Analyzed the Gender Pay Gap at Glassdoor,” Glassdoor Economic Research blog. Available at https://www.glassdoor.com/research/how-we-analyzed-the-gender-pay-gap-at-glassdoor/.
© Glassdoor 2017
100 Shoreline Hwy, Mill Valley, CA 94941
Web: glassdoor.com/research
Email: [email protected]