how the trmm 3b42 v7 product reproduces the … · véronique michot how the trmm 3b42 v7 product...
TRANSCRIPT
LETG Rennes
UMR 6554 CNRS
FRANCE
LOCEAN UMR7617
CNRS PARIS 7
FRANCE
Véronique MICHOT
How the TRMM 3b42 v7 product reproduces the seasonal cycles of precipitation in the different regions of the
Amazon Basin?
V.Dubreuil, B.Funatsu, D.Arvor J.Ronchail D.Vila
DSA CPTEC INPE
BRAZIL
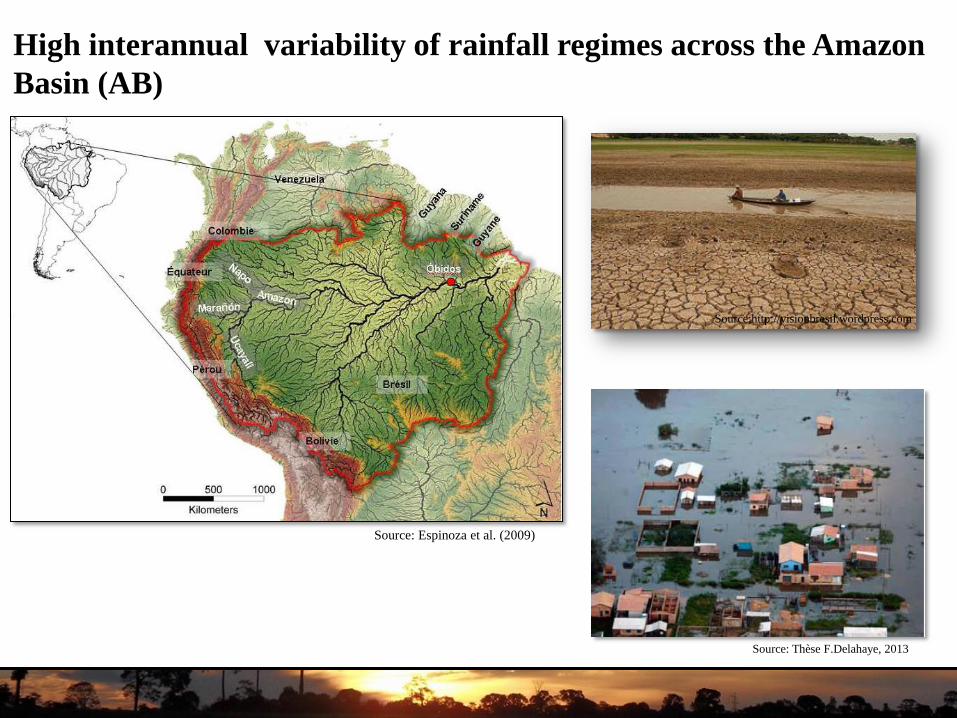
Source;http://visionbresil.wordpress.com
Source: Thèse F.Delahaye, 2013
High interannual variability of rainfall regimes across the Amazon
Basin (AB)
Source: Espinoza et al. (2009)
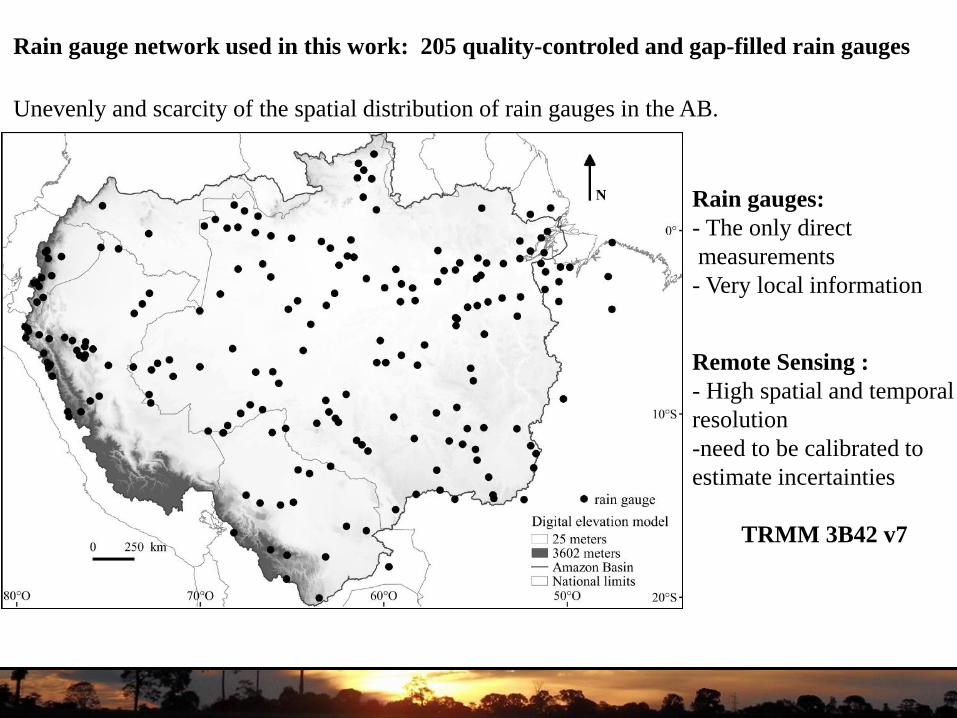
Unevenly and scarcity of the spatial distribution of rain gauges in the AB.
Rain gauges:
- The only direct
measurements
- Very local information
Remote Sensing :
- High spatial and temporal
resolution
-need to be calibrated to
estimate incertainties
TRMM 3B42 v7
Rain gauge network used in this work: 205 quality-controled and gap-filled rain gauges

Outline
I. Quantitative and qualitative statistics for the
whole AB
II. Comparison between rain gauges and TRMM
3B42 v7 at regional scale
III. Relationship between TRMM errors and the
geographical context (altitude and exposure)

TRMM 3B42 v7:
- 1998 to 2013
- Daily scale
- Point to pixel approach
Comparison for the whole AB :
Climatological description of the spatial distribution of
mean daily rainfall, quantitative statistics (Bias,
Relative RMSE ) and qualitative statistics (POD, FAR).
I- Quantitative and qualitative statistics II- Regional scale III- geographical context

Rain gauge network TRMM 3B42 v7
Distribution of mean daily rainfall
I- Quantitative and qualitative statistics II- Regional scale III- geographical context

Daily Bias calculated for the study period over the AB
Spatial
Heterogeneity
Contrast between
highlands / lowlands
I- Quantitative and qualitative statistics II- Regional scale III- geographical context

I- Quantitative and qualitative statistics II- Regional scale III- geographical context
Daily relative RMSE calculated for the study period over the AB
- Contrast between
lowlands and highlands
- Mainly of pixel < 3mm
I- Quantitative and qualitative statistics II- Regional scale III- geographical context
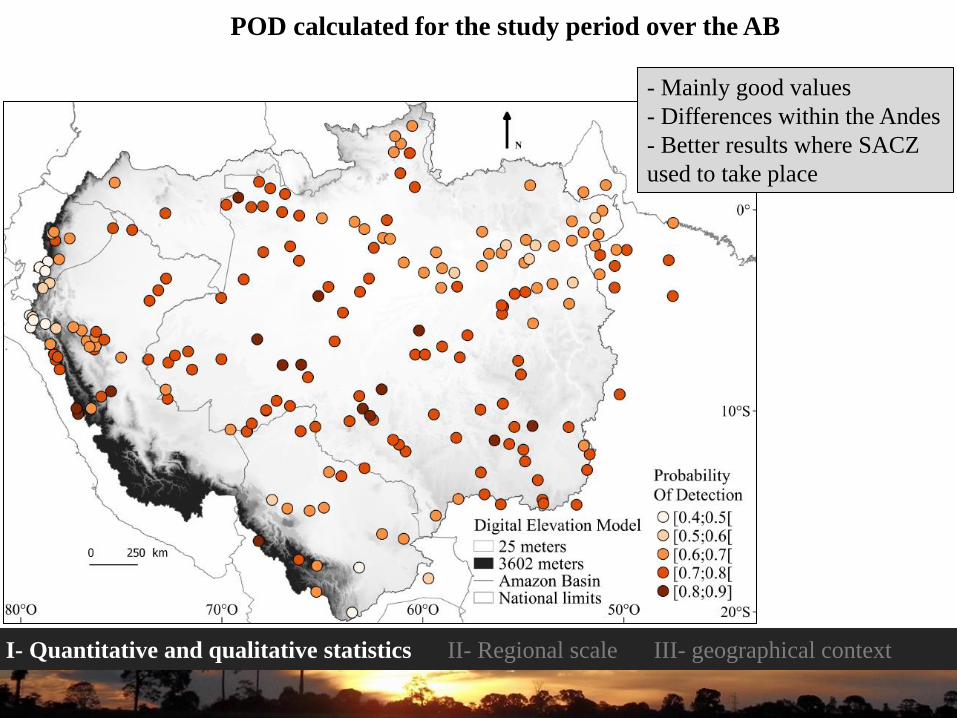
POD calculated for the study period over the AB
- Mainly good values
- Differences within the Andes
- Better results where SACZ
used to take place
I- Quantitative and qualitative statistics II- Regional scale III- geographical context
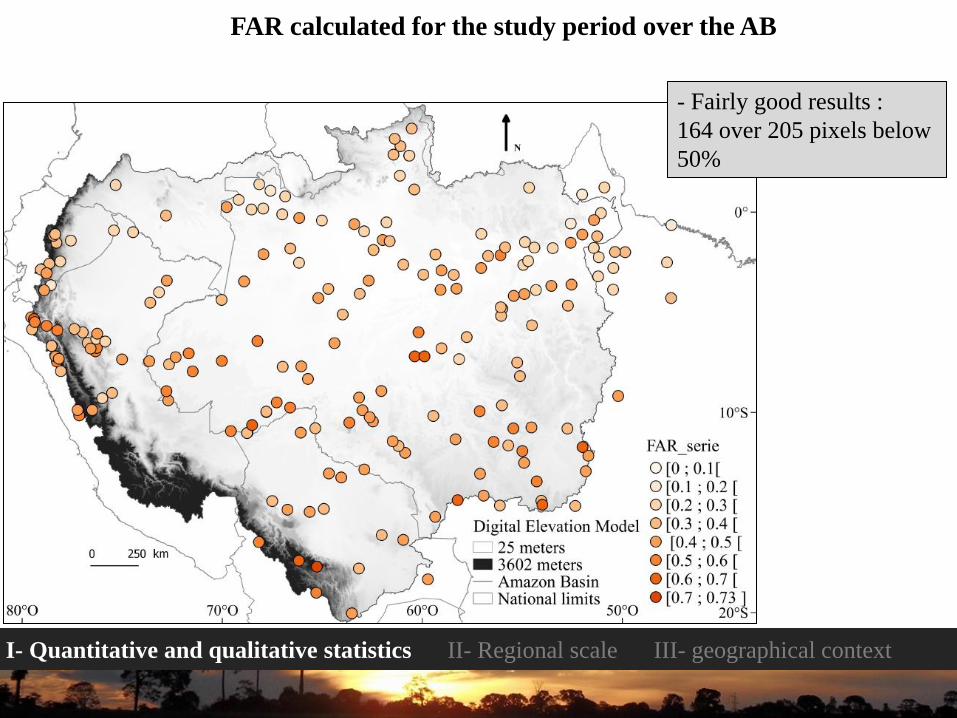
FAR calculated for the study period over the AB
- Fairly good results :
164 over 205 pixels below
50%

II. Comparison between rain gauges and TRMM
3B42 v7 at regional scale

I- Quantitative and qualitative statistics II- Regional scale III- geographical context
Regionalization of the 205 rain gauges considered in the present study
1
2
3
4
5
0
100
200
300
400
january march may july september november
0
100
200
300
400
january march may july september november
0
100
200
300
400
january march may july september november
0
100
200
300
400
january march may july september november0
100
200
300
400
january march may july september november
3B42 v7
Rain gauge

I- Quantitative and qualitative statistics II- Regional scale III- geographical context
REGION 2
3
1
2
4
5
Average annual precipitation cycle
Mm
/day

I- Quantitative and qualitative statistics II- Regional scale III- geographical context
REGION 5
3
1
2
4
5
Average annual precipitation cycle
Mm
/day

III. Relationship between TRMM 3b42 v7 errors and
the geographical context (altitude and exposure)

I- Quantitative and qualitative statistics II- Regional scale III- geographical context
R5
Exemple of relationship and correlation between 3B42 v7 results and altitude
No
relationship

I- Quantitative and qualitative statistics II- Regional scale III- geographical context
Exemples of relationship between 3B42 v7 results and exposure of rain gauge location

I- Quantitative and qualitative statistics II- Regional scale III- geographical
context
Cases of 3B42 v7 overestimations
Rain gauge exposure:
bottom of the valley,
or shelter exposure

Cases of 3b42 v7 underestimations
Rain gauge exposure: does not appear as specific
I- Quantitative and qualitative statistics II- Regional scale III- geographical context

Thank you
Tour LBA, Réserve du Cristalino MT, 2012. V.Michot
Summary and conclusions:
-At daily scale TRMM 3b42 v7 performs better in lowlands than in highlands and
within the Andes
-TRMM 3b42 v7 errors behaviour differ with the rainfall regime
-No clear relationship between TRMM 3b42 v7 errors and altitude
-Exposure/shelter effect may influence of the overestimation errors of TRMM