how the population of texas is dynamically...
TRANSCRIPT
@TexasDemography
How the population of Texas is dynamically changing
Leadership WomenMarch 4, 2018
Fort Worth, Texas

Growing States, 2010‐2017
2010 CensusPopulation 2017 Population
NumericChange
2010-2017
PercentChange
2010-2017
United States 308,745,538 325,719,178 16,973,640 5.5%
Texas 25,145,561 28,304,596 3,159,035 12.6%
California 37,253,956 39,536,653 2,282,697 6.1%
Florida 18,801,310 20,984,400 2,183,090 11.6%
Georgia 9,687,653 10,429,379 741,726 7.7%
North Carolina 9,535,483 10,273,419 737,936 7.7%
Washington 6,724,540 7,405,743 681,203 10.1%
Arizona 6,392,017 7,016,270 624,253 9.8%
Colorado 5,029,196 5,607,154 577,958 11.5%
Source: U.S. Census Bureau. 2000 and 2010 Census Count, 2017 Population Estimates.

Dallas
Howard
FoardFloyd
Brewster
FranklinHunt
Newton
Starr
Kinney
Collingsworth
TomGreen
Coleman
Brazoria
Leon
Duval
Lamb
Morris
Smith
Jackson
Medina
Wheeler
Dallam
Callahan
Lamar
Coryell
Gaines
Kendall
Nacogdoches
Milam
Hays
Willacy
Johnson
Reagan
Webb
Shackelford
Bowie
Scurry
Kenedy
Somervell
Oldham
Taylor
King
Borden
Walker
Stephens
Deaf Smith
Roberts
Tyler
Val Verde
Brown
Parker
Harris
Zapata
RedRiver
Karnes
PaloPinto
GlasscockShelby
Wood
Crosby
Refugio
Burnet
Sterling
Montgomery
San Augustine
Rains
Nueces
Jack
Swisher
Camp
Brazos
Orange
Colorado
Pecos
Cochran
Parmer
FreestoneWinkler
Wichita
Gray
Schleicher
Hardeman
TravisGillespie
Yoakum
Fayette
Uvalde
Grimes
VanZandt
Throckmorton
Falls
Grayson
Ellis
Hall
Dickens
TrinityReeves
Marion
Terrell
Lynn
LaSalle
Jasper
Jones
Castro
Victoria
Kleberg
Briscoe
Clay
Matagorda
Brooks
Runnels
Carson
Liberty
Lee
Hale
Bexar
Garza
Montague
UptonHamilton
FisherDawson
Dimmit
Hutchinson
Llano
Presidio
Eastland
Sabine
Wharton
Rusk
Tarrant
Lavaca
Childress
Hidalgo
Kaufman
Moore
Menard
Edwards
SanPatricio
Terry
Crockett
Houston
Waller
Coke
Ward
Titus
Lampasas
Haskell
Martin
Atascosa
HemphillHartley
Young
BurlesonHardin
Gonzales
McMullen
Erath
Galveston
Hopkins
McLennan
Madison
McCulloch
Donley
Kent
Real
Sutton
Midland
Hudspeth
Zavala
Harrison
Comanche
Mitchell
Navarro
Crane
Lubbock
Wise
Washington
Jeff Davis
El Paso
Gregg
Williamson
Lipscomb
Mason
Henderson
Hansford
Chambers
Hill
Potter
JimWells
DeltaStonewall
Ector
Cameron
Maverick
Collin
Baylor
Panola
Guadalupe
Bastrop
Austin
Andrews
Anderson
Blanco
DeWitt
Bandera
Bell
Aransas
Archer
Armstrong
Bee
Angelina
Bailey
Jefferson
Frio
Fannin
Goliad
Loving
Cass
Fort Bend
Bosque
Hockley
SanSaba
Kerr
Mills
Cooke
Wilbarger
Irion
Caldwell
JimHogg
Culberson
Upshur
Cherokee
Denton
Concho
Randall
Kimble
Knox
Polk
Hood
San Jacinto
Robertson
Wilson
Nolan
Cottle
Calhoun
Rockwall
LiveOak
Motley
Sherman Ochiltree
Comal
Total Estimated Population by County, Texas, 2016
Source: U.S. Census Bureau, 2016 Vintage Population Estimates
86%
113 - 10,000
10,001 - 50,000
50,001 - 100,000
100,001 - 500,000
500,001 - 4,589,928

Pecos
Brewster
Webb
Hudspeth
PresidioTerrell
CulbersonReeves
Val Verde
Crockett
Hill
Duval
Harris
Frio
Bell
Kerr
Kenedy
Starr
Polk
Clay
Edwards
Irion
Hall
Ellis
Jeff Davis
Sutton
Uvalde
Bee
Hale
Dallam
Leon
Bexar
Gaines
Hidalgo
Upton
Hartley
King
Erath
Jack
Kinney
Kent
Zavala
Brazoria
Tyler
GrayOldham
Dimmit
CassLynn HuntWise
La Salle
Rusk
Kimble
Lamb
Medina
Floyd
Terry
Coke
Llano
Liberty
Ector
Andrews
Milam
Travis Lee
Knox
Mills
Smith
Falls
Ward
Collin
Jones
Nolan
Potter
Burnet
Cottle
Nueces
Taylor
Zapata
Real
Coryell
Bowie
Motley
Young
Lamar
Martin
Garza
DallasFisher
Moore
Baylor
Kleberg
Archer
Scurry
Cameron
Cooke
Mason
Parker
Castro
Navarro
Brooks
Hardin
Deaf Smith
Lavaca
Donley
Hays
Goliad
Denton
El Paso
Fannin
Tarrant
Crane
Carson
Crosby
Borden
Schleicher
Gillespie
Shelby
Foard
Wood
Menard
Panola
Walker
Winkler
Harrison
Eastland
Loving
Bandera
Wichita
Hood
Matagorda
Brown
Reagan Houston
Maverick
Jasper
Coleman
Tom Green
Bailey
DeWittAtascosa
Bosque
Wharton
Concho
Runnels
Fayette
Haskell
Calhoun
Newton
Live Oak
Randall
Sterling
Jefferson
Briscoe
McMullen
Parmer
Jim Hogg
Mitchell
Wilson
Victoria
Trinity
Roberts
Howard
Bastrop
Grayson
San Saba
Midland
Hockley Dickens
Swisher
Gonzales
Anderson
Dawson
Willacy
Grimes
Wheeler
Cherokee
Colorado
Lubbock
Karnes
Red River
Refugio
Austin
Hemphill
Williamson
Jackson
Blanco
Ochiltree
McCulloch
Sherman
Wilbarger
Hansford
Callahan
McLennan
Yoakum
Angelina
Hopkins
Lipscomb
StephensPalo Pinto
Stonewall
Hamilton
MontagueCochran
Jim Wells
Limestone
Kaufman
Fort Bend
Titus
Comal
Armstrong
Kendall
FreestoneComancheGlasscock
Johnson
Galveston
Henderson
Montgomery
Brazos
Van Zandt
Chambers
Robertson
Waller
Sabine
Upshur
Hutchinson
Shackelford
Childress
Burleson
Nacogdoches
Lampasas
Collingsworth
Hardeman
Throckmorton
Guadalupe
Caldwell
Aransas
Marion
San Patricio
Madison
San Jacinto
Delta
Washington Orange
Rains
Gregg
Morris
San Augustine
Franklin
Somervell
Rockwall
Estimated Population Change, Texas Counties, 2010 to 2016
4Source: U.S. Census Bureau, 2016 Vintage Population Estimates
96 counties lost population over the 6 year period.
-2,010 - 0
1 - 1,000
1,001 - 20,000
20,001 - 100,000
100,001 - 497,469

Estimated Percent Change of the Total Population by County, Texas, 2010 to 2016
5Source: U.S. Census Bureau, 2016 Vintage Population Estimates
Pecos
Brewster
Webb
Hudspeth
PresidioTerrell
CulbersonReeves
Val Verde
Crockett
Hill
Duval
Harris
Frio
Bell
Kerr
Kenedy
Starr
Polk
Clay
Edwards
Irion
Hall
Ellis
Jeff Davis
Sutton
Uvalde
Bee
Hale
Dallam
Leon
Bexar
Gaines
Hidalgo
Upton
Hartley
King
Erath
Jack
Kinney
Kent
Zavala
Brazoria
Tyler
GrayOldham
Dimmit
CassLynn HuntWise
La Salle
Rusk
Kimble
Lamb
Medina
Floyd
Terry
Coke
Llano
Liberty
Ector
Andrews
Milam
Travis Lee
Knox
Mills
Smith
Falls
Ward
Collin
Jones
Nolan
Potter
Burnet
Cottle
Nueces
Taylor
Zapata
Real
Coryell
Bowie
Motley
Young
Lamar
Martin
Garza
DallasFisher
Moore
Baylor
Kleberg
Archer
Scurry
Cameron
Cooke
Mason
Parker
Castro
Navarro
Brooks
Hardin
Deaf Smith
Lavaca
Donley
Hays
Goliad
Denton
El Paso
Fannin
Tarrant
Crane
Carson
Crosby
Borden
Schleicher
Gillespie
Shelby
Foard
Wood
Menard
Panola
Walker
Winkler
Harrison
Eastland
Loving
Bandera
Wichita
Hood
Matagorda
Brown
Reagan Houston
Maverick
Jasper
Coleman
Tom Green
Bailey
DeWittAtascosa
Bosque
Wharton
Concho
Runnels
Fayette
Haskell
Calhoun
Newton
Live Oak
Randall
Sterling
Jefferson
Briscoe
McMullen
Parmer
Jim Hogg
Mitchell
Wilson
Victoria
Trinity
Roberts
Howard
Bastrop
Grayson
San Saba
Midland
Hockley Dickens
Swisher
Gonzales
Anderson
Dawson
Willacy
Grimes
Wheeler
Cherokee
Colorado
Lubbock
Karnes
Red River
Refugio
Austin
Hemphill
Williamson
Jackson
Blanco
Ochiltree
McCulloch
Sherman
Wilbarger
Hansford
Callahan
McLennan
Yoakum
Angelina
Hopkins
Lipscomb
StephensPalo Pinto
Stonewall
Hamilton
MontagueCochran
Jim Wells
Limestone
Kaufman
Fort Bend
Titus
Comal
Armstrong
Kendall
FreestoneComancheGlasscock
Johnson
Galveston
Henderson
Montgomery
Brazos
Van Zandt
Chambers
Robertson
Waller
Sabine
Upshur
Hutchinson
Shackelford
Childress
Burleson
Nacogdoches
Lampasas
Collingsworth
Hardeman
Throckmorton
Guadalupe
Caldwell
Aransas
Marion
San Patricio
Madison
San Jacinto
Delta
Washington Orange
Rains
Gregg
Morris
San Augustine
Franklin
Somervell
Rockwall
-4.8% - 0%
0.1% - 2.5%
2.6% - 5%
5.1% - 10%
10.1% - 18.1%

CountyU.S. Rank Population Change
Population Change
Percent of Change from
Natural Increase
Percent Changefrom Domestic
Migration
Percent Change from
International Migration
Harris 2 56,587 79.9% ‐27.9% 48.1%Tarrant 5 35,462 44.4% 37.7% 17.9%Bexar 7 33,198 44.6% 39.3% 16.1%Dallas 9 29,209 79.9% ‐20.9% 41.0%Denton 11 27,689 23.9% 67.1% 9.0%
Fort Bend 13 27,388 24.8% 59.4% 15.8%Collin 14 26,506 25.8% 58.7% 15.5%Travis 17 24,505 44.2% 33.3% 22.5%
Williamson 22 20,659 20.3% 74.1% 5.6%Montgomery 24 19,769 18.5% 73.5% 8.0%Hidalgo* 54 10,529 113.5% ‐33.4% 19.9%
Hidalgo County had negative net migration (‐13.5% of total population growth).Source: U.S. Census Bureau, 2016 Vintage Population Estimates
Top Counties for Numeric Growth in Texas, 2015-2016

Top Counties for Percent Growth* in Texas, 2015-2016
County U.S. Rank
2015‐2016Percent
Population Change
Percent Change from Domestic Migration
Percent Change from InternationalMigration
Kendall 2 5.2% 95.9% 4.0%Hays 3 5.1% 82.2% 1.8%Comal 6 4.4% 88.5% 2.0%
Williamson 14 4.1% 74.1% 5.6%Fort Bend 18 3.8% 59.4% 15.8%
Montgomery 24 3.7% 73.5% 8.0%Rockwall 25 3.6% 82.2% 2.5%Denton 28 3.6% 67.1% 9.0%Kaufman 36 3.4% 81.3% 2.2%Bastrop 42 3.1% 83.5% 0.7%Ellis 50 3.1% 78.1% 2.6%
*Among Counties with 10,000 or more population in 2016Source: U.S. Census Bureau, 2016 Vintage Population Estimates

Estimates of percent components of population change, Texas, 2015‐2017
43.0% 47.1% 52.5%
22.1%24.9%
27.7%
34.9%28.0%
19.8%
0.0%
10.0%
20.0%
30.0%
40.0%
50.0%
60.0%
70.0%
80.0%
90.0%
100.0%
2015 2016 2017
Net DomesticMigration
Net InternationalMigration
Natural Increase
8Source: U.S. Census Bureau, 2017 Vintage population estimates

Population change, Texas, Florida, and California, 2011‐2017
9
402,77
6
433,90
3
400,95
2 475,15
7
500,44
4
449,98
2
399,73
4
250,90
8
243,95
8
243,60
0 312,82
0 370,82
0
388,02
2
327,81
1
344,96
4
346,35
2
328,37
7
353,89
5
331,16
6
264,03
2
240,17
7
‐
100,000
200,000
300,000
400,000
500,000
600,000
2011 2012 2013 2014 2015 2016 2017
Texas Florida California
Source: U.S. Census Bureau, 2017 Vintage Population Estimates

Natural increase, Texas, Florida, California, 2011‐2017
10
213,65
1
208,96
4
205,79
5
213,54
1
214,38
0
212,02
1
209,69
0
38,710
40,265
31,345
37,268
30,762
25,592
22,019
271,33
6
257,87
0
251,86
0
254,91
2
246,77
3
217,86
6
213,93
9
‐
50,000
100,000
150,000
200,000
250,000
300,000
2011 2012 2013 2014 2015 2016 2017
Texas Florida California
Source: U.S. Census Bureau, 2017 Vintage Population Estimates
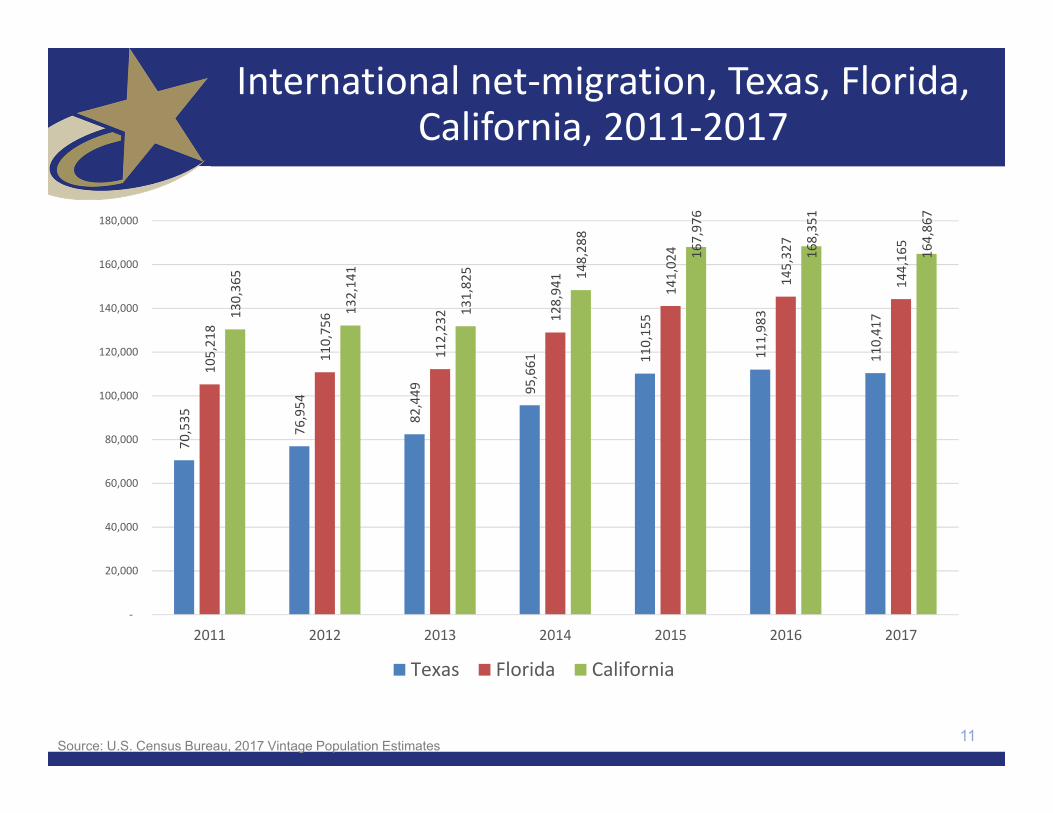
International net‐migration, Texas, Florida, California, 2011‐2017
11Source: U.S. Census Bureau, 2017 Vintage Population Estimates
70,535
76,954
82,449
95,661
110,15
5
111,98
3
110,41
7
105,21
8
110,75
6
112,23
2 128,94
1
141,02
4
145,32
7
144,16
5
130,36
5
132,14
1
131,82
5 148,28
8
167,97
6
168,35
1
164,86
7
‐
20,000
40,000
60,000
80,000
100,000
120,000
140,000
160,000
180,000
2011 2012 2013 2014 2015 2016 2017
Texas Florida California

Domestic net‐migration, Texas, Florida, California, 2011‐2017
12
117,61
5
145,51
3
110,61
4
163,16
0
174,20
0
125,80
0
79,163
105,69
6
91,745
99,228
144,01
7
196,56
0
216,95
6
160,85
4
(54,62
6)
(40,75
6)
(53,07
6)
(46,33
0)
(80,85
9)
(122
,123
)
(138
,195
)
(200,000)
(150,000)
(100,000)
(50,000)
‐
50,000
100,000
150,000
200,000
250,000
2011 2012 2013 2014 2015 2016 2017
Texas Florida California
Source: U.S. Census Bureau, 2017 Vintage Population Estimates

13
Annual Shares of Recent Non‐Citizen Immigrants to Texas by World Area of Birth, 2005‐2015
44.1%
50.6%
69.4%
35.8%
33.0%
17.3%
7.1%
7.3%
7.8%
13.1%
9.1%
5.5%
2015
2010
2005
Latin America Asia Europe Africa and OtherSource: U.S. Census Bureau, American Community Survey, 1-Year PUMS
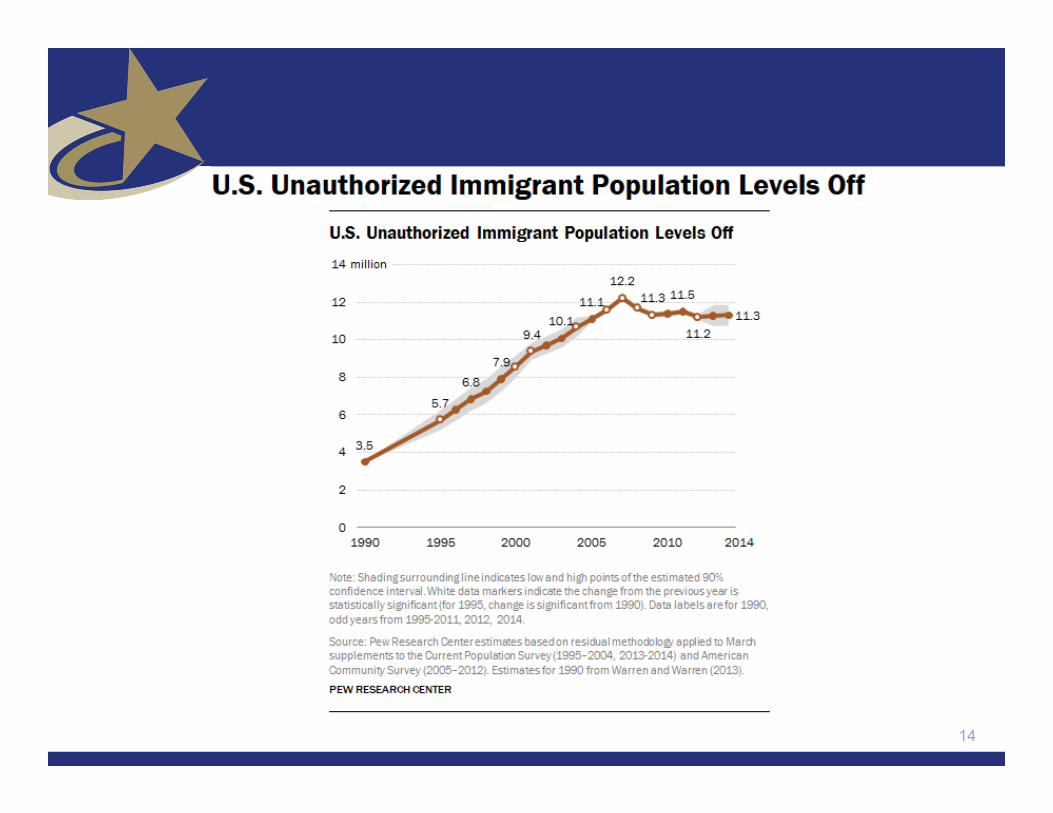
14

15
~5.8% of Texas’ population

Texas White (non‐Hispanic) and Hispanic Populations by Age, 2014
0
50,000
100,000
150,000
200,000
250,000
Popu
latio
n
Age
White (non‐Hispanic)
Hispanic
16Source: U.S. Census Bureau 2010 Decennial Census, SF1
250,000 200,000 150,000 100,000 50,000 0 50,000 100,000 150,000 200,000 250,000Under 1 year
5 years
10 years
15 years
20 years
25 years
30 years
35 years
40 years
45 years
50 years
55 years
60 years
65 years
70 years
75 years
80 years
85 + years
Male White, Non‐Hispanic Female White, Non‐Hispanic
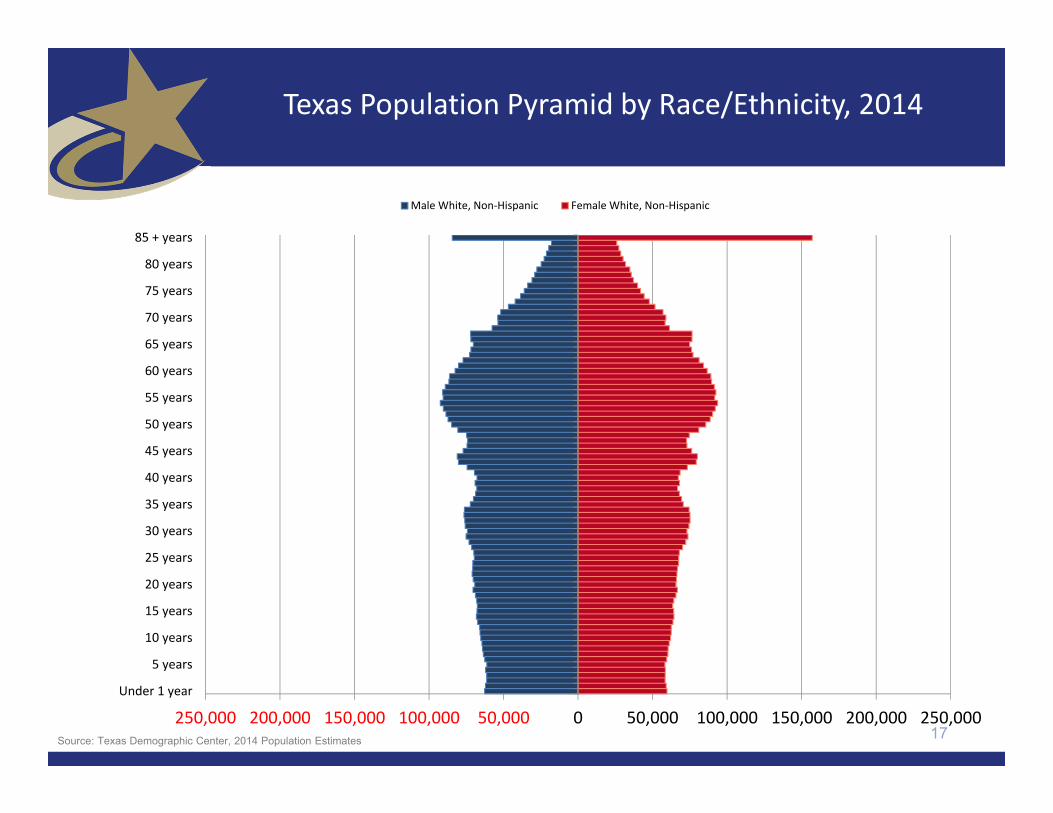
17
Texas Population Pyramid by Race/Ethnicity, 2014
Source: Texas Demographic Center, 2014 Population Estimates

250,000 200,000 150,000 100,000 50,000 0 50,000 100,000 150,000 200,000 250,000Under 1 year
5 years
10 years
15 years
20 years
25 years
30 years
35 years
40 years
45 years
50 years
55 years
60 years
65 years
70 years
75 years
80 years
85 + years
Male Hispanic Female, Hispanic
18
Texas Population Pyramid by Race/Ethnicity, 2014
Source: Texas Demographic Center, 2014 Population Estimates

250,000 200,000 150,000 100,000 50,000 0 50,000 100,000 150,000 200,000 250,000Under 1 year
5 years
10 years
15 years
20 years
25 years
30 years
35 years
40 years
45 years
50 years
55 years
60 years
65 years
70 years
75 years
80 years
85 + years
Male White, Non‐Hispanic Male Hispanic Male Black, Non Hispanic Male Other, Non Hispanic
Female White, Non‐Hispanic Female, Hispanic Female Black, Non Hispanic Female Other, Non Hispanic
19
Texas Population Pyramid by Race/Ethnicity, 2014
Source: Texas Demographic Center, 2014 Population Estimates

Percentage of Population with Drive Times Longer than 25 Minutes, Texas Census Tracts, 1990 and 2010*
19901990 2010*2010*
Source: U.S. Census Bureau, 1990 decennial census and *American Community Survey, 2008-2012 5 Year Sample.
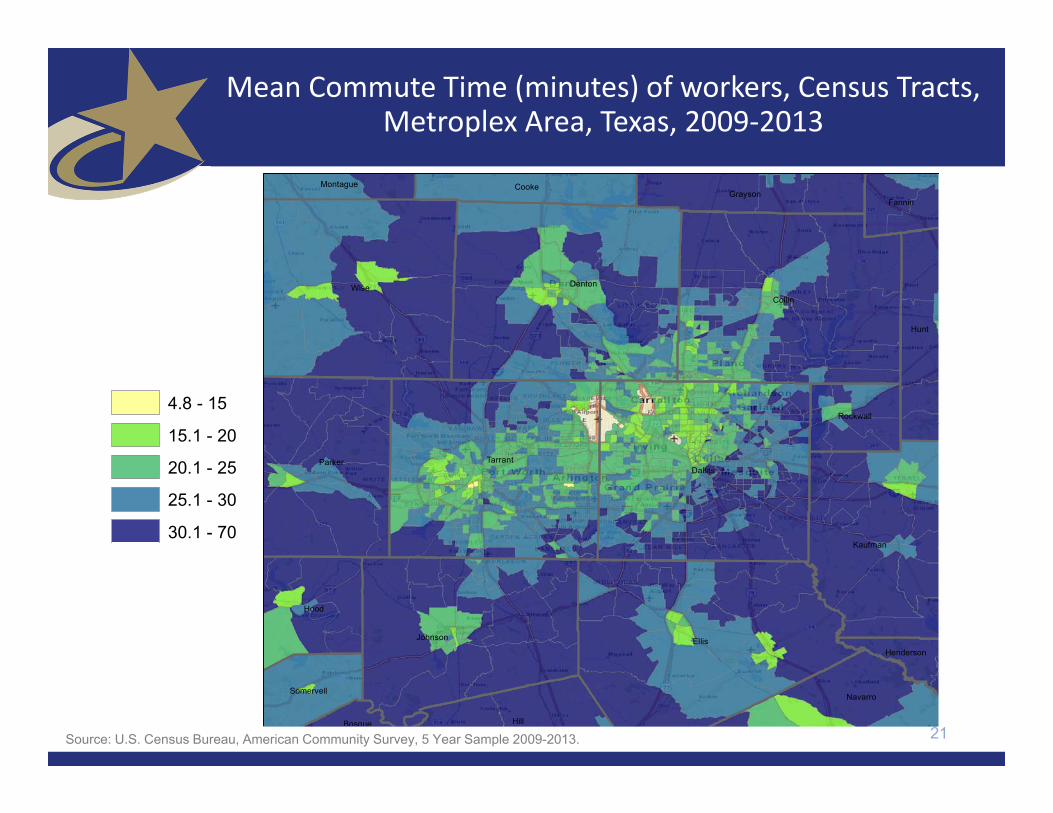
Mean Commute Time (minutes) of workers, Census Tracts, Metroplex Area, Texas, 2009‐2013
21Source: U.S. Census Bureau, American Community Survey, 5 Year Sample 2009-2013.
4.8 - 15
15.1 - 20
20.1 - 25
25.1 - 30
30.1 - 70
Dallas
Hunt
Johnson
Somervell
Parker
Grayson
Ellis
Montague
Tarrant
Kaufman
Navarro
Wise
Henderson
Hill
Collin
Fannin
Bosque
Cooke
Denton
Hood
Rockwall
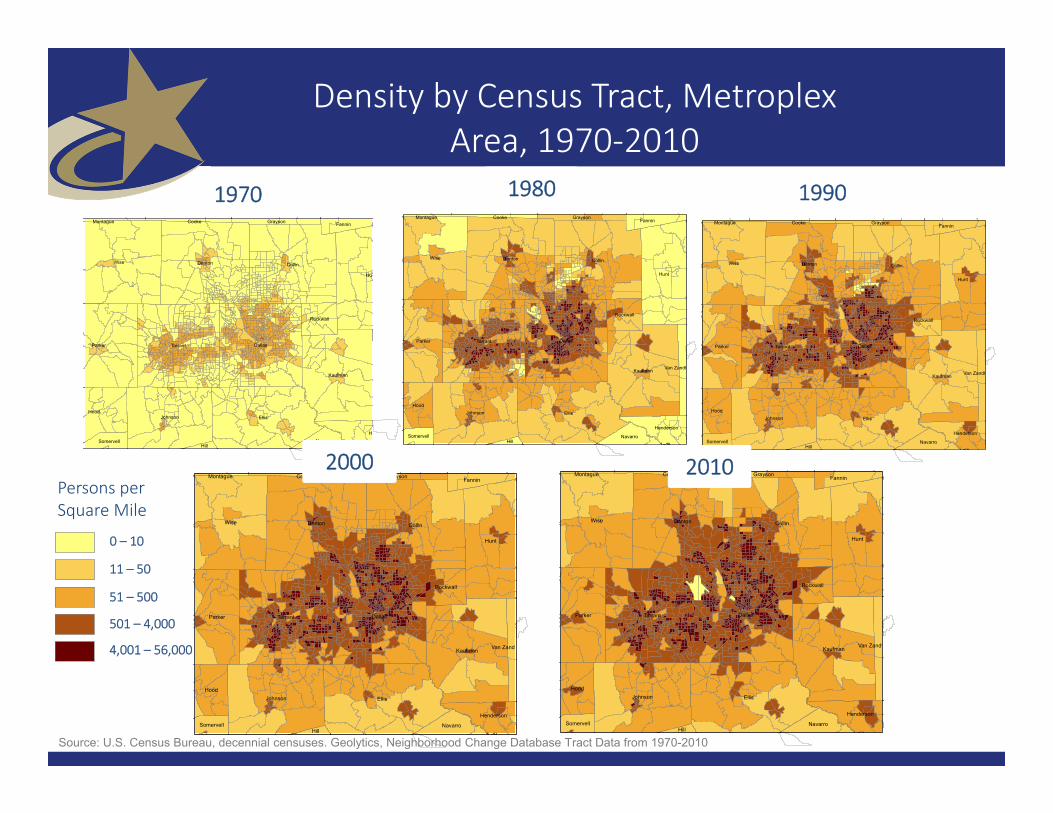
Persons per Square Mile
0 – 10
11 – 50
51 – 500
501 – 4,000
4,001 – 56,000
1970 1980 1990
Density by Census Tract, MetroplexArea, 1970‐2010
Source: U.S. Census Bureau, decennial censuses. Geolytics, Neighborhood Change Database Tract Data from 1970-2010
Ellis
Hun
Wise Collin
Dallas
Denton
TarrantParker
Kaufman
JohnsonHood
H
Rockwall
Fannin
NavarroSomervell
Grayson
Hill
CookeMontague
Ellis
Collin
Dallas
Wise Denton
Tarrant
Hunt
Kaufman
Johnson
Parker
Hood
Rockwall
Henderson
Navarro
Fannin
Somervell
Van Zandt
Grayson
Hill
CookeMontague
Ellis
Collin
Dallas
Wise Denton
Tarrant
Hunt
Kaufman
Johnson
Parker
Hood
Rockwall
Henderson
Navarro
Fannin
Somervell
Van Zandt
Grayson
Hill
CookeMontague
Ellis
Collin
Dallas
Wise Denton
Tarrant
Hunt
Kaufman
Johnson
Parker
Hood
Rockwall
Henderson
Navarro
Fannin
Somervell
Van Zandt
Grayson
Hill
CookeMontague2000
Ellis
Collin
Dallas
Wise Denton
Tarrant
Hunt
Kaufman
Johnson
Parker
Hood
Rockwall
Henderson
Navarro
Fannin
Somervell
Van Zandt
Grayson
Hill
CookeMontague 2010

Percent of Housing Units Built Before 1960, Census Tracts, Metroplex Area, Texas, 2012-2016
Source: U.S. Census Bureau, American Community Survey, 2012-2016 5-Year Sample 23
Ellis
WiseCollin
Dallas
Denton
TarrantParker
Johnson
Cooke
Navarro
Grayson
Hood
Kaufman
Montague
Fannin
Somervell
Rockwall
Hunt
Henderson
0% - 10%
10.1% - 25%
25.1% - 50%
50.1% - 75%
75.1% - 100%

Percent of Housing Units Built Between 1960 and 1979, Census Tracts, Metroplex Area, Texas, 2012-2016
24
Ellis
WiseCollin
Dallas
Denton
TarrantParker
Johnson
Cooke
Navarro
Grayson
Hood
Kaufman
Montague
Fannin
Somervell
Rockwall
Hunt
Henderson
0% - 10%
10.1% - 25%
25.1% - 50%
50.1% - 75%
75.1% - 100%
Source: U.S. Census Bureau, American Community Survey, 2012-2016 5-Year Sample
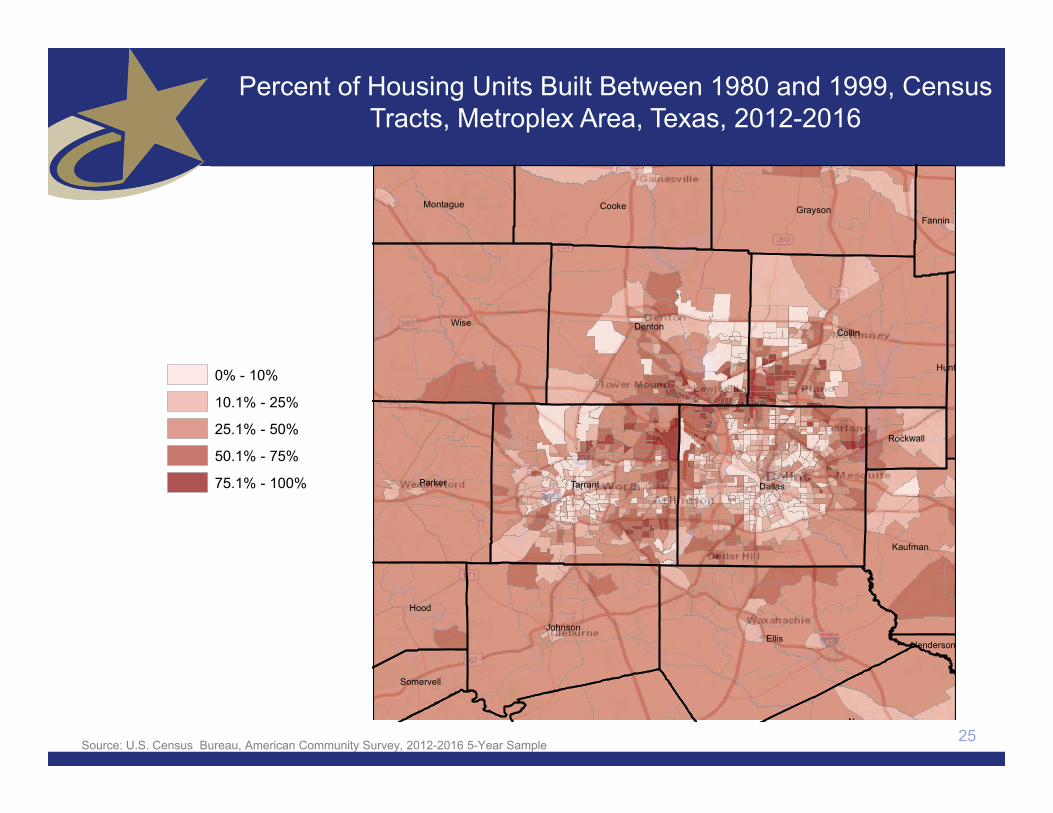
Percent of Housing Units Built Between 1980 and 1999, Census Tracts, Metroplex Area, Texas, 2012-2016
25
Ellis
WiseCollin
Dallas
Denton
TarrantParker
Johnson
Cooke
Navarro
Grayson
Hood
Kaufman
Montague
Fannin
Somervell
Rockwall
Hunt
Henderson
0% - 10%
10.1% - 25%
25.1% - 50%
50.1% - 75%
75.1% - 100%
Source: U.S. Census Bureau, American Community Survey, 2012-2016 5-Year Sample
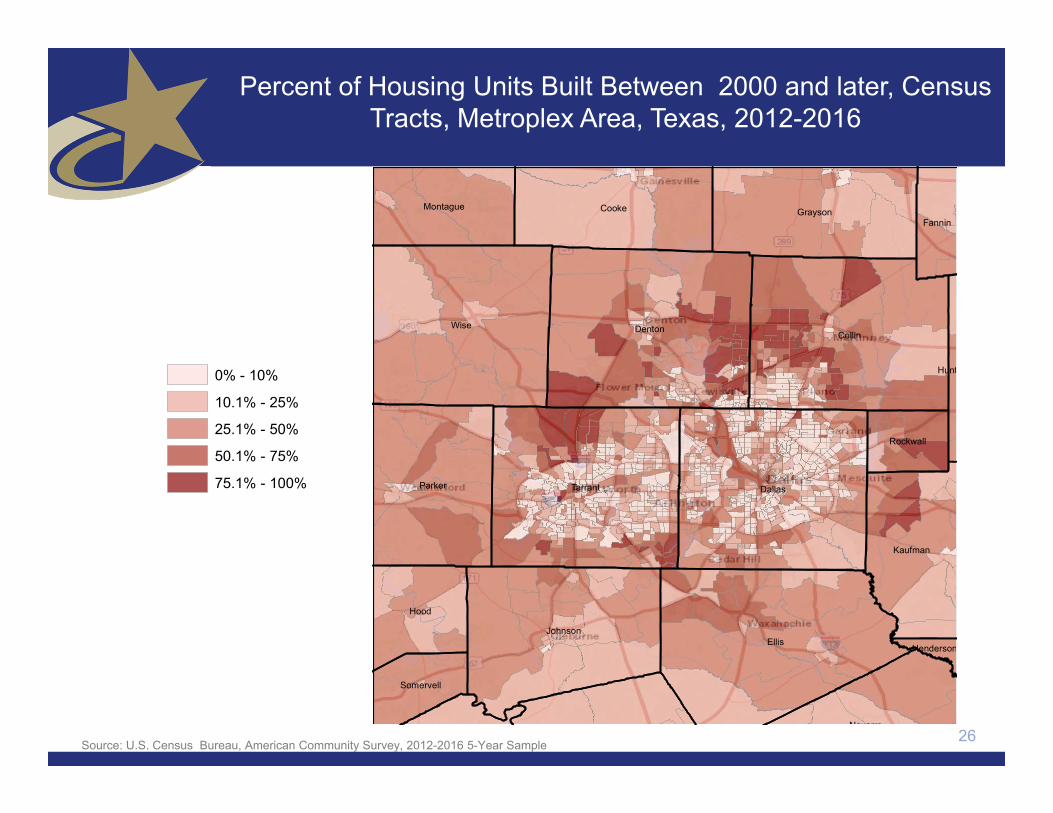
Percent of Housing Units Built Between 2000 and later, Census Tracts, Metroplex Area, Texas, 2012-2016
26
0% - 10%
10.1% - 25%
25.1% - 50%
50.1% - 75%
75.1% - 100%
Ellis
WiseCollin
Dallas
Denton
TarrantParker
Johnson
Cooke
Navarro
Grayson
Hood
Kaufman
Montague
Fannin
Somervell
Rockwall
Hunt
Henderson
Source: U.S. Census Bureau, American Community Survey, 2012-2016 5-Year Sample

Percent of labor force working in management, business, science, and arts occupations, Census Tracts, Metroplex area, Texas, 2012‐2016
27
g0% - 15%
15.1% - 30%
30.1% - 45%
45.1% - 60%
60.1% - 84.6%
Source: U.S. Census Bureau, American Community Survey, 2012-2016 5-Year Sample
Ellis
WiseCollin
Dallas
Denton
TarrantParker
Johnson
Cooke
Navarro
Grayson
Hood
Kaufman
Montague
Fannin
Somervell
Rockwall
Hunt
Henderson

Percent of owner occupied housing units valued at $500k and more, Census Tracts, Metroplex area, Texas, 2012‐2016
28
0% - 2%
2.1% - 10%
10.1% - 30%
30.1% - 60%
60.1% - 100%
Source: U.S. Census Bureau, American Community Survey, 2012-2016 5-Year Sample
Ellis
WiseCollin
Dallas
Denton
TarrantParker
Johnson
Cooke
Navarro
Grayson
Hood
Kaufman
Montague
Fannin
Somervell
Rockwall
Hunt
Henderson
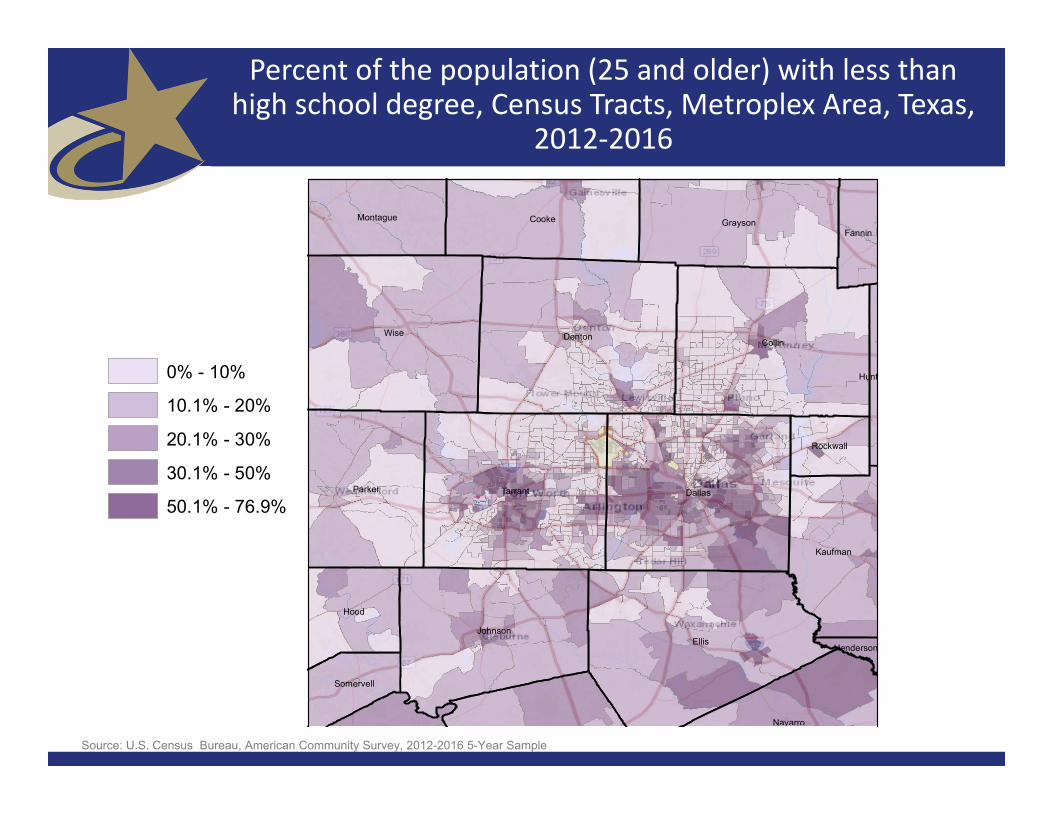
Percent of the population (25 and older) with less than high school degree, Census Tracts, Metroplex Area, Texas,
2012‐2016
Source: U.S. Census Bureau, American Community Survey, 2012-2016 5-Year Sample
0% - 10%
10.1% - 20%
20.1% - 30%
30.1% - 50%
50.1% - 76.9%
Ellis
WiseCollin
Dallas
Denton
TarrantParker
Johnson
Cooke
Navarro
Grayson
Hood
Kaufman
Montague
Fannin
Somervell
Rockwall
Hunt
Henderson

Percent of that is Hispanic, Census Tracts, Metroplex Area, Texas, 2012‐2016
30Source: U.S. Census Bureau, American Community Survey, 2012-2016 5-Year Sample
Ellis
WiseCollin
Dallas
Denton
TarrantParker
Johnson
Cooke
Navarro
Grayson
Hood
Kaufman
Montague
Fannin
Somervell
Rockwall
Hunt
Henderson
0% - 20%
20.1% - 40%
40.1% - 60%
60.1% - 80%
80.1% - 100%

Percent of the population (5 and older) who speak a language other than English at home and English “less than very well,” Census Tracts,
Metroplex Area, Texas, 2012‐2016
31
0% - 10%
10.1% - 15%
15.1% - 30%
30.1% - 40%
40.1% - 80.3%
Source: U.S. Census Bureau, American Community Survey, 2012-2016 5-Year Sample
Ellis
WiseCollin
Dallas
Denton
TarrantParker
Johnson
Cooke
Navarro
Grayson
Hood
Kaufman
Montague
Fannin
Somervell
Rockwall
Hunt
Henderson

20
25
30
35
40
45
50
55
60
Millions
Zero Net Migration
Half 2000 ‐2010
2000 ‐2010
2010 ‐2015
Projected Population Growth in Texas, 2010‐2050
32Source: Texas State Data Center 2016 Population Projections

24
25
26
27
28
29
30
31
Millions
Zero Net Migration
Half 2000 ‐2010
2000 ‐2010
2010 ‐2015
Estimates
Projected Population Growth in Texas, 2010‐2020
33Source: Texas State Data Center 2016 Population Projections
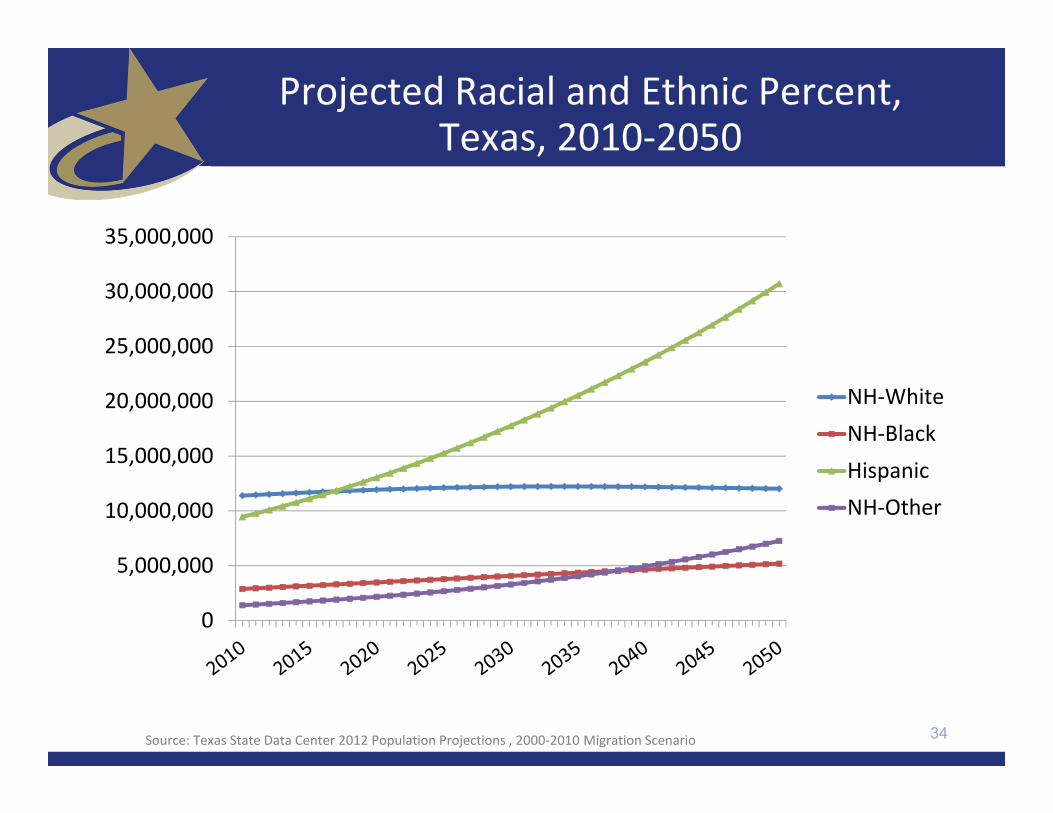
Projected Racial and Ethnic Percent, Texas, 2010‐2050
0
5,000,000
10,000,000
15,000,000
20,000,000
25,000,000
30,000,000
35,000,000
NH‐WhiteNH‐BlackHispanicNH‐Other
34Source: Texas State Data Center 2012 Population Projections , 2000‐2010 Migration Scenario
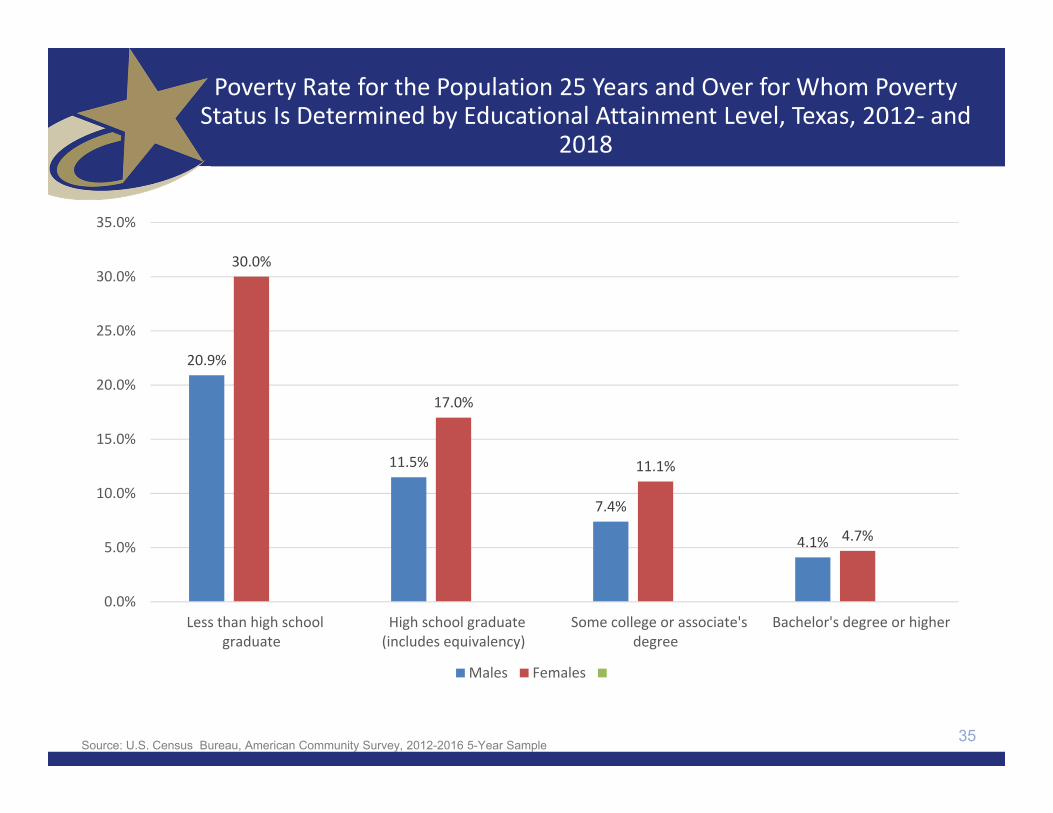
Poverty Rate for the Population 25 Years and Over for Whom Poverty Status Is Determined by Educational Attainment Level, Texas, 2012‐ and
2018
20.9%
11.5%
7.4%
4.1%
30.0%
17.0%
11.1%
4.7%
0.0%
5.0%
10.0%
15.0%
20.0%
25.0%
30.0%
35.0%
Less than high schoolgraduate
High school graduate(includes equivalency)
Some college or associate'sdegree
Bachelor's degree or higher
Males Females
35Source: U.S. Census Bureau, American Community Survey, 2012-2016 5-Year Sample

Labor force participation by sex, Tarrant County and Texas, 2012‐2016
36
TexasTarrant County
Male:In labor force: 71.7% 76.2%Employed or in Armed Forces 67.3% 71.7%Unemployed 4.4% 4.5%Not in labor force 28.3% 23.8%
Female:In labor force: 57.8% 61.2%Employed or in Armed Forces 53.9% 57.4%
Unemployed 3.8% 3.8%
Not in labor force 42.2% 38.8%
Source: U.S. Census Bureau, American Community Survey, 2012-2016 5-Year Sample

Married Never Married
Male:
In labor force: 77.8% 66.5%
Employed or in Armed Forces 75.3% 59.2%
Unemployed 2.5% 7.3%
Not in labor force 22.2% 33.5%
Female:
In labor force: 57.0% 64.0%
Employed or in Armed Forces 54.4% 57.6%
Unemployed 2.6% 6.4%
Not in labor force 43.0% 36.0%
37
Labor force participation (16 years and older) by marital status and sex, Texas, 2012‐2016
Source: U.S. Census Bureau, American Community Survey, 2012-2016 5-Year Sample

Percent female for occupations, Texas, 2012‐2016
2.4%3.6%
12.3%13.8%16.4%
23.0%23.3%23.6%
43.4%45.0%45.5%
49.8%54.9%
65.8%70.8%72.7%
79.8%86.1%
0.0% 10.0% 20.0% 30.0% 40.0% 50.0% 60.0% 70.0% 80.0% 90.0% 100.0%
Construction and extraction occupations Installation, maintenance, and repair occupations
Transportation occupations Farming, fishing, and forestry occupations
Material moving occupations Computer, engineering, and science occupations:
Protective service occupations: Production occupations
Management, business, and financial occupations: Building and grounds cleaning and maintenance…Civilian employed population 16 years and over
Sales and related occupations Food preparation and serving related occupations
Education, legal, community service, arts, and media… Office and administrative support occupations
Healthcare practitioner and technical occupations: Personal care and service occupations
Healthcare support occupations
38Source: U.S. Census Bureau, American Community Survey, 2012-2016 5-Year Sample

Percent distribution of employed persons by industry, Texas, 2005 and 2017
1.7%
5.8%
9.2%
20.3%
2.3%
4.5%
1.8%
5.0%
0.6%
6.2%
1.4%
10.7%
1.0%
8.2%
3.6%
17.5%
2.0%
5.8% 7.1%
19.8%
1.6%
4.4%
1.8%
6.0%
1.0%
6.6%
1.7%
12.0%
1.1%
9.6%
3.6%
15.9%
0.0%
5.0%
10.0%
15.0%
20.0%
25.0%
2005 2017
39Source: Texas Workforce Commission, Tracer, Employment Estimates. http://www.tracer2.com/cgi/dataanalysis/AreaSelection.asp?tableName=Ces

Percent of Civilian Labor Force by Occupation, Texas, 2008, 2014 and 2014‐2008 Difference
9.3%
4.4% 4.4%
7.7%
3.9%
12.3%
9.9%
4.7%5.3%
6.8%
3.5%
12.0%
0.5% 0.3%0.9%
‐0.9% ‐0.4% ‐0.3%‐2.0%
0.0%
2.0%
4.0%
6.0%
8.0%
10.0%
12.0%
14.0%
2008 2014 Difference 2014‐2008
40Source: U.S. Census Bureau, American Community Survey, 1‐Year Sample, 2008, 2010, 2014`

Educational Attainment, Persons Aged 25 Years and Older, Texas, 2011 and 2015
2011 2015
Percent high school graduate or higher 81.1% 82.4% *
Percent bachelor's degree or higher 26.4% 28.4% *
41U.S. Census Bureau American Community Survey, 1-Year Samples, 2011 and 2015* Years significantly different p<.05

Percent Distribution of Educational Attainment of Persons Aged 25 Years and Older, Texas, 2008, 2011, and 2015
20.4% 18.9% 17.6%
25.4% 25.5% 25.3%
28.8% 29.1% 28.7%
17.1% 17.7% 18.7%
8.3% 8.7% 9.7%
0%
10%
20%
30%
40%
50%
60%
70%
80%
90%
100%
2008 2011 2015
Percen
t
Year
Graduate orProfessional Degree
Bachelor Degree
Some College orAssociate Degree
High School orEquivelent
Less than High School
42.9%
57.1%
45.8%
54.2%
42Source: U.S. Census Bureau, American Community Survey, 1‐Year Samples, 2008‐2015

11.8% 12.2%6.7%
36.5% 33.6%
29.6%
14.2% 23.9%
27.6%27.5%
36.3%
15.9%
32.2%
22.7%24.0%
22.4%
57.7%
37.2%
13.2% 15.0%
0%
10%
20%
30%
40%
50%
60%
70%
80%
90%
100%
Black Asian Non‐HispanicWhite
Hispanic All Other
Bachelor, Graduate,Professional Degree
Some College or AssociateDegree
High School or Equivelant
Less than High School
35.9%
69.4%
43
Educational Attainment of Persons Age 25 Years and Older by Race/Ethnicity, Texas, 2015
Source: U.S. Census Bureau, American Community Survey, 1‐Year Sample, 2015

Educational attainment of women aged 25 years and older, Texas and Tarrant County, 2016
Texas Tarrant County
White alone, not Hispanic or LatinoHigh school graduate or higher 93.4% 94.6%Bachelor's degree or higher 36.6% 38.4%
Black aloneHigh school graduate or higher 90.1% 91.4%Bachelor's degree or higher 25.2% 24.0%
Asian aloneHigh school graduate or higher 85.4% 80.8%Bachelor's degree or higher 53.4% 38.5%
Hispanic or Latino OriginHigh school graduate or higher 66.3% 62.4%Bachelor's degree or higher 15.3% 14.4%
44Source: U.S. Census Bureau, 2016 American Community Survey 1-Year Estimates

Trends in Educational Attainment of Persons in the Labor Force (25‐64 Years of Age) in Texas by Race/Ethnicity –
High School Graduates and Above
50%
55%
60%
65%
70%
75%
80%
85%
90%
95%
100%
2001 2002 2003 2004 2005 2006 2007 2008 2009 2010 2011
White
Black
Hispanic
Other
Source: U.S. Census Bureau, American Community Survey, Public Use Micro Sample, 2001‐2011

Percent of the Civilian Labor Force (ages 25‐64) by Educational Attainment for 2011, 2030 Using Constant Rates,
Texas
46
15.0%
23.8%
31.3%
20.1%
9.8%
18.1%
24.0%
29.9%
18.7%
9.3%
0.0%
5.0%
10.0%
15.0%
20.0%
25.0%
30.0%
35.0%
Less than High School High School orEquivalent
Some College /Associate Degree
Bachelor's Degree Graduate orProfessional Degree
Percen
t of the
Civilian
Lab
or Force
Educational Attainment
2011 ACS
2030 Constant 2011 %
These should be going DOWN These should be going UP
Sources: U.S. Census Bureau, American Community Survey, 1-Year PUMS.Texas State Data Center, 2012 Vintage Population Projections, 0.5 Migration Scenario

Percent of the Civilian Labor Force (ages 25‐64) by Educational Attainment for 2011, and 2030 Using Trended
Rates, Texas
47
15.0%
23.8%
31.3%
20.1%
9.8%11.4%
20.4%
34.3%
22.1%
11.8%
0.0%
5.0%
10.0%
15.0%
20.0%
25.0%
30.0%
35.0%
40.0%
Less than High School High School orEquivalent
Some College /Associate Degree
Bachelor's Degree Graduate orProfessional Degree
Percen
t of the
Civilian
Lab
or Force
Educational Attainment
2011 ACS
2030 Trended (2001‐2011 Trend)
These should be going DOWN These should be going UP
Sources: U.S. Census Bureau, American Community Survey, 1-Year PUMS.Texas State Data Center, 2012 Vintage Population Projections, 0.5 Migration Scenario

Teen (ages 15‐19 years) birth rates, the U.S. and select states, 2015
Area Rank Birth Rate Per 1,000 Women
United States 23.3Arkansas 1 38.0Mississippi 2 34.8Oklahoma 3 34.8New Mexico 4 34.6Texas 5 34.6Louisiana 6 34.1Kentucky 7 32.4West Virginia 8 31.9Tennessee 9 30.5Alabama 10 30.1Alaska 11 29.3Wyoming 12 29.2Nevada 13 27.6South Dakota 14 26.4Arizona 15 26.3
48Source: National Center for Health Statistics at the Centers for Disease Control and Prevention

Adult Obesity
49Source: http://stateofobesity.org/files/stateofobesity2015.pdf

Projected Increase in Obesity in Texas by Ethnicity, 2006 to 2040
50Source: Office of the State Demographer projections, using 2000-2004 migration scenario population projections

Contact
State DemographerOffice: (210) 458‐6530Email: [email protected]: demographics.texas.gov
Lloyd Potter, Ph.D.
@TexasDemography
51