how states achieve high seat belt use rates
TRANSCRIPT

DOT HS 810 962 August 2008
How States Achieve High Seat Belt Use Rates
This document is available to the public from the National Technical Information Service, Springfield, Virginia 22161
This publication is distributed by the U.S. Department of Transportation, National Highway Traffic Safety Administration, in the interest of information exchange. The opinions, findings, and conclusions expressed in this publication are those of the authors and not necessarily those of the Department of Transportation or the National Highway Traffic Safety Administration. The United States Government assumes no liability for its contents or use thereof. If trade or manufacturers’ names or products are mentioned, it is because they are considered essential to the object of the publication and should not be construed as an endorsement. The United States Government does not endorse products or manufacturers.

This report is dedicated to the memory of Kathryn Swanson, who succumbed to a two-year battle with ALS on February 28, 2008.
Kathy worked in the Minnesota Office of Traffic Safety for 29 years, the last 9 as its director.
She ran an exemplary highway safety program and was a superb chair of the Governors Highway Safety Association.
She was a friend and mentor to many in the highway safety community.
Her positive and forward-looking attitude never failed: she insisted on holding an interview for this study
during her last two weeks at work. She will be greatly missed but her legacy will live on.

1. Report No.
DOT HS 810 962 2. Government Accession No. 3. Recipient's Catalog No.
4. Title and Subtitle
How States Achieve High Seat Belt Use Rates 5. Report Date
August 2008 6. Performing Organization Code
7. Authors
James Hedlund, S. Hope Gilbert, Katherine Ledingham, and David Preusser 8. Performing Organization Report No.
9. Performing Organization Name and Address
Preusser Research Group, Inc. 7100 Main Street Trumbull, CT 06611
10. Work Unit No. (TRAIS)
11. Contract or Grant No.
DTNH22-05-D-15043 12. Sponsoring Agency Name and Address
U.S. Department of Transportation National Highway Traffic Safety Administration Office of Regulatory Analysis and Evaluation NVS-431 1200 New Jersey Avenue SE. Washington, DC 20590
13. Type of Report and Period Covered
Final Report
14. Sponsoring Agency Code
15. Supplementary Notes
The Contracting Officer's Technical Representative for this project was Charlene Doyle.
16. Abstract
This study compared States with high seat belt use rates and States with low seat belt use rates using statistical analyses and conducted case studies of 10 high seat belt use States. Primary enforcement seat belt use laws clearly help increase seat belt use, though three case study States with secondary laws have achieved high seat belt use. High-visibility seat belt law enforcement is critical. The statistical analyses suggest that the most important difference between the high and low seat belt use States is enforcement, not demographics or funds spent on media. A few geographic, demographic, and cultural factors are associated with lower seat belt use, but none is a barrier to high seat belt use, as demonstrated by examples from the case study States. The key factors in all high seat belt use case study States were high-visibility seat belt law enforcement, excellent relations with law enforcement command and officers statewide, effective seat belt law enforcement publicity, high priority for increasing seat belt use, effective planning and implementation of seat belt use programs based on solid data and research, and effective Highway Safety Office and seat belt program management. Recommendations for States wishing to increase seat belt use are: (1) make seat belt use a high priority; (2) set seat belt use goals and establish long-range plans to achieve these goals; (3) provide adequate resources; (4) upgrade secondary to primary enforcement laws; (5) use high-visibility enforcement in the way that best fits each State’s resources and characteristics; and (6) strive for the ultimate goals of 100-percent seat belt use and 100-percent seat belt law enforcement. 17. Key Words
Seat Belt Observed Seat Belt Use Passenger Vehicles
18. Distribution Statement
This report is available free of charge from the NHTSA Web site at www.nhtsa.dot.gov
19. Security Classif.(of this report)
Unclassified 20. Security Classif.(of this page)
Unclassified 21. No. of Pages
170 22. Price

TECHNICAL SUMMARY
CONTRACTOR CONTRACT NUMBER
Preusser Research Group, Inc. DTNH22-05-D-15043
REPORT TITLE REPORT DATE
How States Achieve High Seat Belt Use Rates August 2008
REPORT AUTHORS:
James Hedlund, S. Hope Gilbert, Katherine Ledingham, and David Preusser
Background
Seat belt use is the single most important factor in preventing or reducing the severity of injuries to vehicle occupants involved in a traffic crash. When used properly, lap/shoulder belts reduce the risk of fatal injury to front-seat passenger car occupants by 45 percent and the risk of moderate-to-severe injury by 50 percent. All States except New Hampshire require seat belts to be worn by all passenger vehicle drivers and right-front passengers.
Increasing seat belt use has been a priority of the National Highway Traffic Safety Administration (NHTSA) for 30 years. Seat belt use has increased from a national level of about 14 percent in the early 1980s to 82 percent in NHTSA’s June 2007 nationwide survey. While this increase is impressive, one out of every six occupants still is not buckled up. The seat belt use rate is far lower for occupants in severe crashes: in 2005, fewer than half were belted.
Seat belt use varies substantially across the 50 States. In 2006, observed seat belt use exceeded 90 percent in 9 States but was less than 75 percent in another 10.
Study goal and methods
This study investigated why some States have higher seat belt use than others; to identify strategies that States with lower seat belt use may be able to use to increase seat belt use. The study was conducted in two parallel components.
1) Statistical analyses compared a group of States with high belt use to a group of low use States using data from several sources. These quantitative analyses revealed some factors on which the two groups differed, some of which may affect seat belt use. They also revealed many factors on which the two groups did not differ. Additional analyses
i

examined the effects of changing from a secondary to a primary enforcement law in six States that made this change between January 2000 and December 2004.
2) Case studies were conducted in 10 high belt use States. These descriptive studies revealed some features common to all 10 States that appear to have helped them achieve high seat belt use. The case studies also revealed many features on which the 10 States differed, suggesting that these features are neither guarantees of nor substantial obstacles to high seat belt use.
Statistical analyses of high and low belt use States
For the statistical analyses, two groups of States – those with high and low seat belt use – were defined based on 2005 seat belt use rates from observations and from the Fatality Analysis Reporting System (FARS). High belt use States were those with at least 90 percent observed seat belt use, or at least 85 percent observed seat belt use and at least 50 percent belted fatalities (drivers and adult right-front-seat passengers). Low belt use States were those with no more than 70 percent observed seat belt use, or no more than 80 percent observed seat belt use and no more than 40 percent belted fatalities. These definitions produced 16 high and 15 low belt use States. The remaining 19 States and the District of Columbia were called “medium belt use” for convenience, though individual States may rank high or low on one of the criteria.
High, Medium, and Low Belt Use States
The statistical analyses compared the 16 high belt use States to the 15 low belt use States on a number of geographic, demographic, and cultural features. The geographic similarities and differences are suggested by the map, which shows that the high and low belt use States are not randomly distributed across the country. Mean annual precipitation and temperature did not
ii
differ significantly (p>.05) between the high and low belt use States. High belt use States are generally larger and had significantly more total road miles per capita (p<.01). But the road miles are distributed differently: high belt use States had significantly more urban miles per capita (p=.04) and low belt use States had twice as many rural miles per capita (p<.01).
Population density was about 50-percent greater in the high belt use States, but the difference was not significant because the high and low belt use groups both contain large rural States and small urban States. The number of vehicles per capita did not differ significantly, but the annual vehicle miles of travel per capita was significantly greater in low belt use States (p=.01).
The significant demographic and cultural differences were that the high belt use States had a substantially higher proportion of Hispanic or Latino residents and a slightly higher proportion of residents with bachelor’s degrees. Low belt use States had a substantially higher proportion of White residents and a slightly higher proportion of residents 65 and older. High and low belt use States did not differ significantly in the proportions of residents age 18 to 24 or of high school graduates. They were almost identical on two measures of overall health: the proportions of residents 50 and older with diabetes or with hypertension.
The high and low belt use groups differed substantially and significantly on several measures directly related to traffic safety and seat belt use. High belt use States had only half as many front-seat passenger vehicle occupant fatalities as low belt use States (p<.01). Thirteen of the 16 high belt use States had primary belt use laws compared to only 1 of the 15 low belt use States. High belt use States also had slightly higher belt law fines, with a median fine of $25 compared to $20 (p=.02). While the number of law enforcement officers per capita was virtually identical in high and low belt use States, high belt use States issued twice as many seat belt citations per capita in the 2005 Click It or Ticket (CIOT) campaign as did low belt use States (p<.001). Yet the low belt use States spent 40 percent more per capita on 2005 CIOT campaign media than did high belt use States (p=.06).
The National Seat Belt Tracking Survey (called the Click It or Ticket or CIOT Survey) was administered to a randomly selected national sample of households before the May 2007 CIOT campaign. Self-reported demographics between the high and low States did not differ. These include the respondent’s sex, education, ethnicity, and vehicle type. (Age did vary and so was controlled for in further analyses.) Beliefs about the value of seat belts also did not differ, including strong agreement in both high and low belt use States with the statement that respondents would want to be belted if they were in a crash. However, respondents from high belt use States more often agreed that seat belt law enforcement was important and that their personal risk of getting a ticket was high. Respondents from low belt use States reported a significantly lower perceived risk of getting a ticket.
Six States – Delaware, Illinois, Michigan, New Jersey, Tennessee, and Washington – changed from a secondary to a primary enforcement law between January 2000 and December 2004. The effects of these changes in each State were analyzed using ARIMA (autoregressive integrated moving average) time series analysis on monthly FARS data from 1994 through 2005. All six States observed an immediate and statistically significant increase in seat belt use of passenger vehicle drivers and right-front passengers in fatal crashes (p≤.01). Michigan and Washington
iii

also observed a statistically significant decrease in fatalities of passenger vehicle drivers and right-front passengers (p≤.02). The decrease in New Jersey approached significance (p=.07).
In summary, the statistical analyses suggest that the most important difference between the high and low belt use States is enforcement, not demographic characteristics or dollars spent on media. Both the high and the low belt use States conducted CIOT enforcement campaigns. But enforcement was much more vigorous in the high belt use States, as shown by an average of twice as many seat belt law citations per capita during the campaign. While it is possible to achieve high seat belt use with a secondary law, it is more difficult and, as discussed in the case studies, requires some effort and a secondary law that is straightforward to enforce. Survey data confirmed the role of enforcement, with respondents in high belt use States reporting that they have a higher risk of receiving a ticket if unbelted than respondents in low belt use States.
Case studies
Ten States with high seat belt use were studied to investigate factors that may have contributed to their success but that may not be revealed in the statistical analyses. The States were reasonably distributed across the country and included both primary and secondary law States. All had high belt use rates compared to other States both in on-road observations and in fatal crashes.
Study staff visited each State between late February and late June 2007 and met with key individuals recommended by the State’s Governor’s Representative or Coordinator, who were knowledgeable about the State’s seat belt program management, activities, communications, law enforcement, data, and research. These typically included the Governor’s Representative or Coordinator, the Highway Safety Office’s people responsible for occupant protection and public affairs, a law enforcement representative, often a researcher or data specialist, and sometimes people from partner organizations or from the NHTSA Regional office. When key individuals were not available during the visit, discussions were conducted by telephone. From 3 to 13
iv

people were interviewed in each State. Individuals in each State provided research studies, briefing papers, press releases, data summaries, and other written information relevant to each State’s seat belt use activities.
The case studies demonstrated that there are no insurmountable barriers to a high belt use rate. Three case study States had a secondary seat belt use law; several were rural and had older populations. The key factors in all high belt use case study States were high-visibility seat belt law enforcement, excellent relations with law enforcement command and officers statewide, effective seat belt law enforcement publicity, high priority for increasing seat belt use, effective planning and implementation of seat belt use programs based on solid data and research, and effective Highway Safety Office and seat belt program management. The case study States differed in the specific activities and strategies they employed in each of these areas. The differences reflect the various States’ geography, traffic laws, law enforcement organization and practices, media market structure, resources, social culture, and all the other features that make each State unique.
Recommendations
Based on these findings, States wishing to increase their seat belt use should consider the following actions.
1) Make seat belt use a high priority within the State and within the Highway Safety Office.
2) Set seat belt use goals and establish long-range plans to achieve these goals based on the State’s unbelted population, laws, law enforcement community, and other characteristics.
3) Provide adequate resources.
4) Upgrade secondary to primary enforcement laws.
5) Use high-visibility enforcement in the way that best fits the State’s resources and characteristics.
6) Strive for two ultimate goals: 100-percent seat belt use and 100-percent enforcement. All drivers and occupants will be buckled up all the time; all officers will enforce the State’s seat belt laws 24/7, on all patrols.
v

TABLE OF CONTENTS
Page I. INTRODUCTION ..................................................................................................................1 II. BACKGROUND ....................................................................................................................3 Seat Belt History .....................................................................................................................3 Seat Belt Effectiveness ...........................................................................................................3 Factors Associated With Higher Seat Belt Use ......................................................................3 Seat Belt Use Laws and Provisions ........................................................................................4 Seat Belt Law Effectiveness ...................................................................................................5 Seat Belt Law Enforcement ....................................................................................................5 III. NATIONAL AND STATE SEAT BELT USE ......................................................................7 Observed Belt Use ..................................................................................................................7 Fatality Analysis Reporting System Belt Use ........................................................................8 IV. STATISTICAL COMPARISON OF HIGH AND LOW BELT USE STATES..................10
Methodology.........................................................................................................................10 Comparisons of High and Low Belt Use States....................................................................12
Click It or Ticket Survey ......................................................................................................19 V. EFFECT OF ADOPTING A PRIMARY SEAT BELT USE LAW ON FATALITY RATES AND BELT USE .........................................................................24
Methodology.........................................................................................................................24 Results...................................................................................................................................25
VI. CASE STUDIES OF HIGH BELT USE STATES...............................................................39
Methodology.........................................................................................................................39 Results...................................................................................................................................41
VII. DISCUSSION AND RECOMMENDATIONS....................................................................52 Statistical Analyses ...............................................................................................................52
Surveys..................................................................................................................................52 Case Studies of High Belt Use States ...................................................................................52
Recommendations.................................................................................................................54
vi

REFERENCES ..............................................................................................................................55
APPENDICES
Appendix A: Table of State Seat Belt Use Laws............................................................ A-1 Appendix B: Table of State Seat Belt Funding Sources.......................................................B-1 Appendix C: State Case Studies ......................................................................................C-1 Appendix D: Brief Case Study Description.................................................................... D-1 Appendix E: California Case Study Discussion Outline .................................................E-1
vii

LIST OF FIGURES
Page Figure 1. Observed Belt Use Rates in the United States, 1983-2007 ..........................................7 Figure 2. State 2005 Observed Seat Belt Use..............................................................................8
Figure 3. Seat Belt Use for Front-Seat Passenger Vehicle Occupant Fatalities, Age 15 and Older .........................................................................................................8 Figure 4. 2005 FARS Seat Belt Use for Front-Seat Fatalities, Age 15 and Older ......................9 Figure 5. 2006 FARS Seat Belt Use for Front-Seat Fatalities, Age 15 and Older ......................9 Figure 6. High, Medium, and Low Belt Use States...................................................................10 Figure 7. Observed 2005 Seat Belt Use for Low and High Belt Use States..............................11 Figure 8. FARS 2005 Seat Belt Use for Low and High Belt Use States ...................................12 Figure 9. Proportion of Belted, Front-Seat Passenger Vehicle Occupant Fatalities in Michigan.................................................................................................26 Figure 10. Number of Front-Seat Passenger Vehicle Occupant Fatalities in Michigan Over Time ..................................................................................................27 Figure 11. Proportion of Belted, Front-Seat Passenger Vehicle Occupant Fatalities in New Jersey..............................................................................................28 Figure 12. Number of Front-Seat Passenger Vehicle Occupant Fatalities in New Jersey Over Time........................................................................................................29 Figure 13. Proportion of Belted, Front-Seat Passenger Vehicle Occupant Fatalities in Washington.............................................................................................................30 Figure 14. Number of Front-Seat Passenger Vehicle Occupant Fatalities in Washington Over Time ..............................................................................................31 Figure 15. Proportion of Belted, Front-Seat Passenger Vehicle Occupant Fatalities in Delaware.....................................................................................................................32 Figure 16. Number of Front-Seat Passenger Vehicle Occupant Fatalities in Delaware Over Time ..................................................................................................33 Figure 17. Proportion of Belted, Front-Seat Passenger Vehicle Occupant Fatalities in Illinois.....................................................................................................34 Figure 18. Number of Front-Seat Passenger Vehicle Occupant Fatalities in Illinois
Over Time...................................................................................................................35 Figure 19. Proportion of Belted, Front-Seat Passenger Vehicle Occupant Fatalities in Tennessee ..............................................................................................................36 Figure 20. Number of Front-Seat Passenger Vehicle Occupant Fatalities in Tennessee Over Time.................................................................................................37 Figure 21. Case Study States .......................................................................................................39
viii
LIST OF TABLES
Page Table 1. Population and Traffic Fatalities by Seat Belt Use ....................................................13 Table 2. Precipitation and Temperature by Seat Belt Use........................................................13 Table 3. Education, Age, Race, and Ethnicity by Seat Belt Use..............................................14 Table 4. Roadways by Seat Belt Use........................................................................................15 Table 5. Registered Vehicles and Vehicle Miles Traveled by Seat Belt Use...........................16 Table 6. Seat Belt Fines and Laws by Seat Belt Use................................................................16 Table 7. Number of Sworn Officers by Seat Belt Use .............................................................16 Table 8. CIOT Citations by Seat Belt Use ...............................................................................17 Table 9. CIOT Total Media Dollars Spent by Seat Belt Use, 2003 .........................................17 Table 10. CIOT Total Media Dollars Spent by Seat Belt Use, 2004 .........................................17 Table 11. CIOT Total Media Dollars Spent by Seat Belt Use, 2005 .........................................18 Table 12. Health Status by Seat Belt Use...................................................................................18 Table 13. Selected Responses to the 2007 Pre-Campaign National Seat Belt
Tracking Survey .........................................................................................................21 Table 14. Logistic Regression Analyses for Selected Responses to the 2007 Pre-Campaign
National Seat Belt Tracking Survey...........................................................................22 Table 15. States with Primary Law Changes Since 2000...........................................................24 Table 16. Michigan ARIMA Parameter Estimates for Proportion Belted, Front -Seat Passenger Vehicle Occupant Fatalities .............................................................26 Table 17. Michigan ARIMA Parameter Estimates for Front-Seat Passenger
Vehicle Occupant Fatalities........................................................................................27 Table 18. New Jersey ARIMA Parameter Estimates for Proportion Belted, Front
Seat Passenger Vehicle Occupant Fatalities...............................................................28 Table 19. New Jersey ARIMA Parameter Estimates for Front-Seat Passenger
Vehicle Occupant Fatalities........................................................................................29 Table 20. Washington ARIMA Parameter Estimates for Proportion Belted,
Front-Seat Passenger Vehicle Occupant Fatalities.....................................................30 Table 21. Washington ARIMA Parameter Estimates for Front-Seat Passenger
Vehicle Occupant Fatalities........................................................................................31 Table 22. Delaware ARIMA Parameter Estimates for Proportion Belted, Front -Seat Passenger Vehicle Occupant Fatalities .............................................................32 Table 23. Delaware ARIMA Parameter Estimates for Front-Seat Passenger
Vehicle Occupant Fatalities........................................................................................33 Table 24. Illinois ARIMA Parameter Estimates for Proportion Belted, Front-Seat
Passenger Vehicle Occupant Fatalities.......................................................................34 Table 25. Illinois ARIMA Parameter Estimates for Front-Seat Passenger Vehicle
Occupant Fatalities .....................................................................................................35
ix

Table 26. Tennessee ARIMA Parameter Estimates for Proportion Belted, Front -Seat Passenger Vehicle Occupant Fatalities .............................................................36 Table 27. Tennessee ARIMA Parameter Estimates for Front-Seat Passenger
Vehicle Occupant Fatalities........................................................................................37 Table 28. Effects of Primary Law Changes on Seat Belt Use and Occupant Fatalities .............38 Table 29. Seat Belt Use From Observations and FARS, Sorted by State ..................................47 Table 30. Seat Belt Use Sorted by Law Type and 2006 Observed Use .....................................48 Table 31. Seat Belt Use Sorted by Law Type and Use in 2005 FARS ......................................49 Table 32. Geographic, Demographic, CIOT, Seat Belt Law, and Seat Belt Use Data ..............50 Table 33. Enforcement, Media, and Management .....................................................................51
x

I. INTRODUCTION
Seat belt use is the single most important factor in preventing or reducing the severity of injuries to vehicle occupants involved in a traffic crash. When used properly, lap/shoulder belts reduce the risk of fatal injury to front-seat passenger car occupants by 45 percent and the risk of moderate-to-severe injury by 50 percent (NHTSA, 2007a). In recognition of the importance of seat belt use, all States except New Hampshire require seat belts to be worn by all passenger vehicle drivers and right-front passengers. New Hampshire requires seat belt use by all occupants under the age of 18.
Increasing seat belt use has been a priority of the National Highway Traffic Safety Administration (NHTSA) for 30 years (Nichols & Ledingham, 2008). And seat belt use has increased, from a national level of about 14 percent in the early 1980s to 82 percent in NHTSA’s June 2007 nationwide survey (Glassbrenner & Ye, 2007). While this increase is impressive, one out of every six occupants still is not buckled up. The seat belt use rate is far lower for occupants in severe crashes: in 2005, fewer than half were belted.
Seat belt use varies substantially across the 50 States. In 2006, observed seat belt use exceeded 90 percent in 10 States but was less than 75 percent in another 11 (NHTSA, 2007b; Table 28).
The primary objectives of this study were to investigate the reasons for and the factors that contribute to these substantial differences in seat belt use across the States and to identify strategies that lower belt use States may be able to use to increase seat belt use.
The study was conducted in two parallel components.
1) Statistical analyses compared a group of high belt use States to a group of low-use States using data from several sources. These quantitative analyses revealed some factors on which the two groups differed, some of which may affect seat belt use. They also revealed many factors on which the two groups did not differ. Additional analyses examined the effects of changing from a secondary to a primary enforcement law in 6 States that made this change between January 2000 and December 2004.
2) Case studies were conducted in 10 high belt use States. These descriptive studies revealed some features common to all 10 States that appear to have helped them achieve high seat belt use. The case studies also revealed many features on which the 10 States differed, suggesting that these features are neither guarantees of nor substantial obstacles to high seat belt use.
The report is organized as follows:
• Chapter II, Background, describes the legislative history of seat belt use in the United States and briefly reviews key literature on seat belt use and seat belt use laws.
• Chapter III, National and State Seat Belt Use, presents national and State seat belt use data to provide context for the remaining work.
1

• Chapter IV, High and Low Belt Use States, presents statistical analyses of factors on which high and low belt use States do and do not differ.
• Chapter V, Effect of Adopting a Primary Seat Belt Use Law on Fatality Rates and Seat Belt Use, presents statistical analyses of the effect of recent primary seat belt law change on fatalities and seat belt use.
• Chapter VI, Case Studies of High Belt Use States, presents findings from the 10 case studies of high belt use States.
• Chapter VII, Discussion, summarizes and synthesizes the results and presents conclusions and recommendations that may help States increase their seat belt use.
• Appendix A provides a table of State seat belt use laws and provisions for adults as of January 1, 2008.
• Appendix B documents each State’s Federal funding for seat belt activities.
• Appendix C contains full reports on each of the 10 State case studies.
• Appendix D provides the one-page description used to describe the case studies.
• Appendix E provides the discussion outline used for the California case study. The outlines used for the other States were very similar.
2
II. BACKGROUND
This chapter provides brief background information on seat belt characteristics and effectiveness and on State seat belt use laws, types, effectiveness, and enforcement. It summarizes research on factors associated with higher seat belt use. Chapter III summarizes information on national and State seat belt use rates and trends.
The subjects of this chapter have been studied extensively. Readers are referred to several excellent recent summaries of existing research, which in turn provide copious references to the original studies.
SEAT BELT HISTORY
Seat belts were developed and tested in the 1950s and then were available as aftermarket or optional equipment. Front-seat driver and passenger seat belts became standard equipment in all 1964 model year cars (O’Neill, 2001). Domestic cars had lap belts while imports had lap/shoulder belts. In 1968, all new passenger vehicles were required to have both lap and shoulder belts for drivers and right-front passengers. Most vehicles had separate lap and shoulder belts. Beginning with the 1973 model year, vehicles were required to have three-point lap/shoulder belts for drivers and right-front passengers. As a result, almost all passenger vehicles on the road in 2007 had driver and right-front passenger lap/shoulder belts.
SEAT BELT EFFECTIVENESS
The effectiveness of seat belts in preventing fatality and injury is documented extensively and proven conclusively. NHTSA’s most recent estimates are that lap/shoulder belts reduce the risk of fatal injury to front-seat passenger car occupants by 45 percent and the risk of moderate-to-critical injury by 50 percent (NHTSA, 2007b). Seat belts are even more effective for light-truck occupants, reducing the fatality risk by 60 percent and the moderate-to-serious injury risk by 65 percent. In 2006, seat belts saved an estimated 15,383 lives of vehicle occupants age 5 and older (NHTSA, 2007b). Shinar (2007) summarizes 9 original studies on belt effectiveness.
FACTORS ASSOCIATED WITH HIGHER SEAT BELT USE
Shinar (2007) summarizes results from 14 recent studies on personal characteristics associated with the use of seat belts. These findings are consistent with earlier research, summarized previously (Shinar, 1993). Higher seat belt use is associated with:
• Older drivers, compared to younger drivers;
• Married drivers, especially those with children, compared to unmarried;
• Women, compared to men;
3
• Higher socioeconomic status, based on education and income, compared to lower;
• Owners of newer and more expensive vehicles, compared to owners of older and less expensive vehicles;
• Whites, compared to Blacks and Hispanics;
• Passenger car drivers, compared to pickup truck drivers;
• Alcohol abstainers or moderate drinkers, compared to heavier drinkers;
• Nonsmokers, compared to smokers; and
• Low-crash and crash-free drivers compared to high-crash drivers.
Taken together and said another way, these findings show that lower seat belt use is associated with lower education, lower socioeconomic status, and higher risk-taking behavior. These general conclusions are quite familiar to State Highway Safety Offices.
SEAT BELT USE LAWS AND PROVISIONS
New York was the first State to enact a seat belt use law, in 1984. Other jurisdictions followed quickly, with laws in 21 States (including the District of Columbia among the States) by the end of 1987, 40 by 1992, and 50 by 1995 (IIHS, 2008). While law provisions vary, all cover adult drivers and right-front passengers in cars. State seat belt law histories and provisions are summarized in Appendix A; see also NHTSA (2007c). IIHS (2008) maintains a current list of the key provisions of each State’s law.
Under New York’s law, nonusers may be stopped and cited independently of any other traffic behavior. The next law enacted, by New Jersey in 1985, allows nonusers to be cited only after their vehicle has been stopped for some other traffic violation. These laws are called secondary enforcement laws in contrast to New York’s primary enforcement law. The seat belt law enacted initially in 42 States was a secondary law, with only 8 States initially enacting a primary law (IIHS, 2008).
California upgraded its seat belt use law from secondary to primary enforcement in 1992, effective January 1, 1993. Through the end of 2007, 18 other States also upgraded their laws. As of January 1, 2008, 27 States had primary laws and 23 States had secondary laws. New Hampshire had no law covering all adults: New Hampshire’s law covers only those under the age of 18. (Appendix A; see also IIHS, 2008; and Nichols & Ledingham, 2008).
Primary law upgrades went into effect in 2006 or 2007 in 5 States (IIHS, 2008): Alaska (May 2006), Kentucky (July 2006), Maine (September 2007), Mississippi (May 2006), and South Carolina (December 2006). In this report, these States are included with the secondary law States in the statistical analyses of 2005 data in the first part of Chapter IV (see Table 6) and for the selection of case study States in Chapter VI. All except Maine are included with the primary law States in the 2007 Click It or Ticket survey analyses of Chapter IV.
4
SEAT BELT LAW EFFECTIVENESS
Many of the 40 seat belt use laws in effect in 1992 were evaluated either individually or in multi-State studies. The evaluations consistently found that the laws increased seat belt use and decreased fatalities and serious injuries. The earliest laws increased seat belt use by about 32 percentage points, from a baseline of 16 to 18 percent to about 50 percent. The evaluations found that the laws reduced fatalities by a median 9 percent and serious injuries by a median 13 percent. Nichols and Ledingham (2008) summarize these early studies.
Evaluations also found greater seat belt use increases and casualty decreases in primary law States than in secondary law States. A systematic review of 13 high-quality studies (Shults et al., 2004) found that primary laws increase seat belt use by about 14 percentage points and reduce occupant fatalities by about 8 percentage points compared to secondary laws.
With seat belt laws in effect in all States (except New Hampshire) by 1995, attention turned to the effect of upgrading a secondary to a primary enforcement law. Eleven upgrades from 1993 to 2007 have been evaluated and results are listed and summarized in Nichols and Ledingham (2008). The median increase in seat belt use was 15 to 16 percentage points. The upgrades typically reduced occupant fatalities by about 8 percent.
Current seat belt use data shows clearly the relation between law type and seat belt use. In 2006, seat belt use in the median primary law State was 88.1 percent compared to 78.8 percent in the median secondary law State (Table 30; Alaska and Mississippi are considered primary law States for this comparison as their primary laws went into effect in May 2006, before their observation surveys; Kentucky and South Carolina are considered secondary law States).
SEAT BELT LAW ENFORCEMENT
High-visibility, short-duration seat belt law enforcement programs, sometimes called Selective Traffic Enforcement Programs (STEPs), blitzes, or mobilizations, were demonstrated in individual communities in the late 1980s. North Carolina’s Click It or Ticket program took this model statewide beginning in 1993 and raised the North Carolina use rate above 80 percent. Statewide, multi-State, and national enforcement programs increased through the 1990s under different names and sponsors. These enforcement programs typically raised seat belt use by 13 to 26 percentage points, with greater gains where seat belt use was lower. Seat belt use often decreased by about 6 percentage points after the enforcement program ended (Nichols & Ledingham, 2008).
The Click It or Ticket model expanded nationwide in 2003. Recent programs have used extensive paid advertising as part of their communications and outreach strategies and have included strategies designed specifically to increase seat belt use among low belt use groups such as pickup truck drivers.
Some jurisdictions enforce their seat belt use laws vigorously as part of their regular traffic enforcement activities (NHTSA, 2008). There are no evaluations of the specific effect of this
5

sustained seat belt use enforcement strategy, probably for several reasons. Sustained enforcement is not a discrete “yes-no” event like a law change, but rather a law enforcement practice. Typically it has evolved over time, at different rates across a jurisdiction. This makes it difficult to identify which jurisdictions can be said to practice sustained seat belt law enforcement, much less to compare those that do with those that do not. Before-and-after studies would be equally difficult because of the many other factors that have affected seat belt use over time. All 10 case study States use sustained enforcement to some degree. The case study reports illustrate how sustained and high-visibility enforcement strategies have complemented each other to raise seat belt use.
Countermeasures That Work has a short and succinct summary of seat belt law enforcement history, activities, and effectiveness in the Chapter 2 Overview and Section 2.2 (NHTSA, 2008). Nichols and Ledingham (2008) provide an extensive history and synthesis of results from dozens of local, State, and national enforcement activities through 2005. Shults et al. (2004) summarize a systematic review of 13 high-quality studies of enforcement program effectiveness.
6

III. NATIONAL AND STATE SEAT BELT USE
Seat belt use has increased substantially in the United States over the past 25 years. Seat belt use varies considerably across the States. This chapter presents national and State seat belt use data to provide background and context for the study’s analyses.
OBSERVED SEAT BELT USE
Figure 1 shows national seat belt use rates since 1983 for passenger vehicle drivers and right-front passengers taken from observation surveys. Rates for the years 1983 to 1991 were estimated from observations in 19 cities. Rates for 1992 and 1993 are a weighted average of rates from State observational surveys. Beginning in 1994 they come from NHTSA’s National Occupant Protection Use Survey (NOPUS) (Nichols & Ledingham, 2008).
Seat belt use increased rapidly from 1983 to 1993, a period when most States enacted seat belt use laws. It has increased gradually since then and has hovered around the 80 percent level since 2004.
Figure 1. Observed Seat Belt Use Rates in the United States, 1983-2007
US Safety Belt Use
0
20
40
60
80
100
1983
1984
1985
1986
1987
1988
1989
1990
1991
1992
1993
1994
1995
1996
1997
1998
1999
2000
2001
2002
2003
2004
2005
2006
2007
Year
Perc
ent F
ront
Sea
t Bel
t Use
Nichols and Ledingham, 2008
Since 1998, almost all States have conducted annual observational seat belt use surveys in June. Each State uses a valid probability sampling scheme approved by NHTSA. The reported seat belt use rates can be compared from State to State and from year to year within a State (NHTSA, 2005, 2007a).
Figure 2 shows the observed seat belt use rates for all States in 2005. Figure 2 shows vividly how seat belt use varies across the States, ranging from just over 60 percent to about 95 percent. Note that New Hampshire and Wyoming did not conduct surveys in 2005.
7

Figure 2. State 2005 Observed Seat Belt Use
Section 157, 2005
0
10
20
30
40
50
60
70
80
90
100 M
SM
AKY AR SD KS SC W
IFL TN R
IM
E ID ND
MO LA AK OH
CO NE
MT
VA IN CT
GA AL MN
OK
PA DE
VT WV NY IA IL NJ
NC UT
DC
NM TX MD
CA MI
OR
AZ NV
WA H
IN
HW
Y
States
Perc
ent O
bser
ved
Bel
t Use
NHTSA (2007a)
FATALITY ANALYSIS REPORTING SYSTEM SEAT BELT USE
The Fatality Analysis Reporting System (FARS) contains data on all fatal traffic crashes in the United States from 1975 to the present. Figure 3 shows the seat belt use rate for front-seat passenger vehicle occupant fatalities from 1994 to 2006.
Figure 3. Seat Belt Use for Front-Seat Passenger Vehicle Occupant Fatalities, Age 15 and Older
US Seat Belt Fatalities
0
20
40
60
80
100
1994
1995
1996
1997
1998
1999
2000
2001
2002
2003
2004
2005
2006
Year
Perc
ent F
ront
Sea
t Bel
tFa
talit
ies
FARS
8

Compare Figure 1, from observations, to Figure 3, from FARS. Both show gradual increases from 1994 to date. The FARS use rates are far lower, however. Part of the difference is due to the seat belts themselves, because seat belts prevent some fatalities. But much of the difference is due to the fact that high-risk drivers, who are more likely to be involved in potentially fatal crashes, are less likely to be buckled up than lower-risk drivers. As just one example, seat belt use is lower at night than during daytime, crash risk is higher at night, and the seat belt use observations all are taken in the daytime.
Figures 4 and 5 show the FARS seat belt use rates by month for 2005 and 2006. In each year the use rate increased from May to June and then dropped off gradually. The national Click It or Ticket campaign occurs each May and likely is responsible for the higher seat belt use rate in June. This June increase became evident in 2003, when the national CIOT May campaign became widespread.
Figure 4. 2005 FARS Seat Belt Use for Front-Seat Fatalities, Age 15 and Older FARS, 2005
0
10
20
30
40
50
Jan-
05
Feb-
05
Mar
-05
Apr-
05
May
-05
Jun-
05
Jul-0
5
Aug-
05
Sep-
05
Oct
-05
Nov
-05
Dec
-05
Time
Perc
ent B
elte
d Fa
talit
ies
FARS
Figure 5. 2006 FARS Seat Belt Use for Front-Seat Fatalities, Age 15 and Older FARS, 2006
0
10
20
30
40
50
Jan-
06
Feb-
06
Mar
-06
Apr-
06
May
-06
Jun-
06
Jul-0
6
Aug-
06
Sep-
06
Oct
-06
Nov
-06
Dec
-06
Time
Perc
ent B
elte
d Fa
talit
ies
FARS
9
IV. STATISTICAL COMPARISON OF HIGH AND LOW BELT USE STATES
METHODOLOGY
Two groups of States – those with high and low belt use – were defined based on 2005 seat belt use rates from observations and from FARS. The high-use and low-use groups were compared on a variety of characteristics that may influence seat belt use. Some characteristics measure geographic, demographic, and cultural features of the State and its inhabitants. Others may be more directly related to seat belt use, such as the State’s seat belt law provisions, law enforcement activity, and seat belt law publicity. Still others come from surveys of residents’ self-reported knowledge, attitudes, and behavior. Comparisons of high and low belt use States used the Mann-Whitney test for continuous variables and the chi-square test for categorical variables.
High and Low Belt Use States Defined
High belt use States were defined as those with at least 90-percent observed seat belt use (2005), or at least 85-percent observed seat belt use (2005) and at least 50-percent belted fatalities (2005 FARS). Low belt use States were defined as those with no more than 70-percent observed seat belt use (2005), or no more than 80-percent observed seat belt use (2005) and no more than 40-percent belted fatalities (2005 FARS). These definitions produced 16 high belt use and 15 low belt use States.
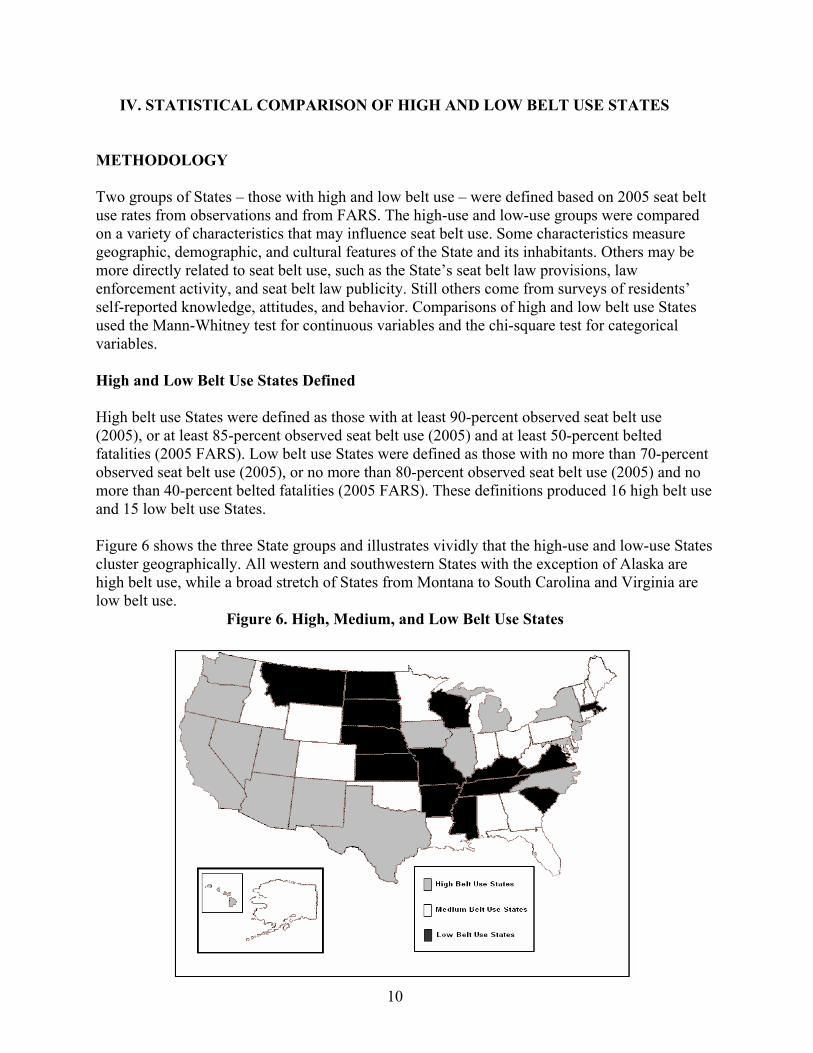
Figure 6 shows the three State groups and illustrates vividly that the high-use and low-use States cluster geographically. All western and southwestern States with the exception of Alaska are high belt use, while a broad stretch of States from Montana to South Carolina and Virginia are low belt use.
Figure 6. High, Medium, and Low Belt Use States
10

The remaining 19 States and the District of Columbia were called “medium belt use” for convenience, though individual States may rank high or low on one of the criteria. New Hampshire and Wyoming were not eligible for inclusion as high or low belt use States because they did not conduct seat belt use surveys in 2005 (NHTSA 2007a). If their previous observed seat belt use rates (2003 for New Hampshire and 2004 for Wyoming) had been used, New Hampshire would have been a low belt use State and Wyoming a medium belt use State (Table 29).
As noted in Chapter III, FARS use rates are considerably lower than observed use rates. Observed State use rates are obtained during daylight, in June, on a large but not complete sample of each State’s roads (States may exclude up to 15 percent of low-population areas from their surveys). FARS rates measure seat belt use in every fatal crash, including many at night and in rural areas. FARS rates are closely related to use rates in potentially fatal crashes, the situations in which seat belt use is most important (Nichols & Ledingham, 2008, Appendix A). While State observed and FARS use rates are correlated, some States rank high on one measure but low on the other (Nichols & Ledingham, 2008, Appendix F). Since neither observed nor FARS rates provides an ideal measure, both were used in defining the high and low belt use groups.
Figure 7. Observed 2005 Seat Belt Use for Low and High Belt Use States
High belt use definition: > 90 percent observed seat belt use (2005) OR > 85 percent observed seat belt use (2005) AND > 50 percent belted fatalities (2005 FARS). Low belt use definition: < 70 percent observed seat belt use (2005) OR < 80 percent observed seat belt use (2005) AND < 40 percent belted fatalities (2005 FARS).
* Arizona’s observed seat belt use for 2005 may have been overstated: had the 2006 seat belt use results been used, Arizona would not have qualified as a high belt use State. Arizona was retained as a high belt use State because the 2005 rate was accepted by NHTSA and because these analyses use 2005 data for all variables whenever possible. Arizona is only one of the 16 high belt use States so the results will not change appreciably regardless of whether it is included or not.
11

Figures 7 and 8 show the 2005 seat belt use rates from observations and from FARS for the high and low belt use States. The figures show clearly that most of the high belt use States have primary seat belt use laws (13 out of 16, both from observations and FARS) while most of the low belt use States have secondary laws (14 out of 15, again both from observations and FARS).
Figure 8. FARS 2005 Seat Belt Use for Low and High Belt Use States
COMPARISONS OF HIGH AND LOW BELT USE STATES
The high and low belt use State groups were compared on a variety of geographic, demographic, highway, enforcement, and other variables. All data are for the year 2005 unless noted otherwise. P-values were computed using the Mann-Whitney test for all continuous variables. All per capita variables were weighted to 2005 U.S. Census population projections and reported per 10,000 people. In the tables that follow, variables on which the high and low belt use States differ significantly (at the .05 level) are in bold.
The following tables give each variable’s median value and interquartile range (25th and 75th
percentiles) for the high and low belt use States. A chi-square statistic was used for the categorical variable Law Type (Table 6) and presented as a p-value with percent primary law (number of primary law States).
12
1) Population and traffic fatalities
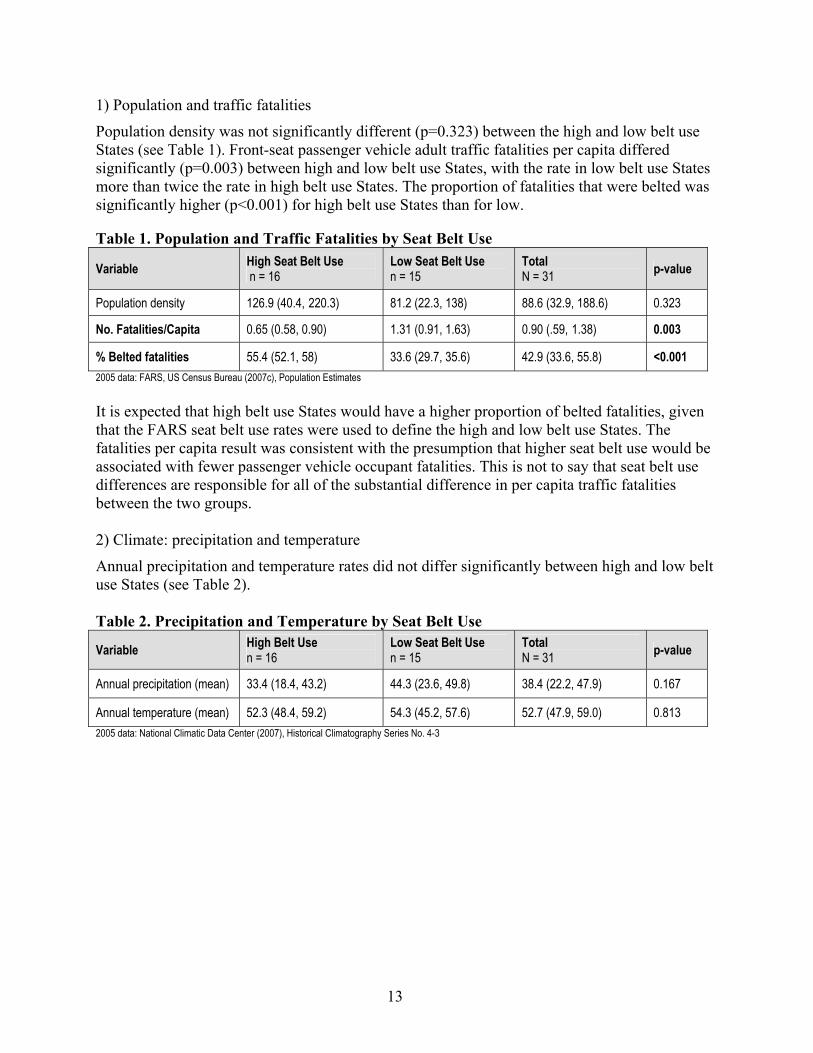
Population density was not significantly different (p=0.323) between the high and low belt use States (see Table 1). Front-seat passenger vehicle adult traffic fatalities per capita differed significantly (p=0.003) between high and low belt use States, with the rate in low belt use States more than twice the rate in high belt use States. The proportion of fatalities that were belted was significantly higher (p<0.001) for high belt use States than for low.
Table 1. Population and Traffic Fatalities by Seat Belt Use
Variable High Seat Belt Use n = 16
Low Seat Belt Use n = 15
Total N = 31 p-value
Population density 126.9 (40.4, 220.3) 81.2 (22.3, 138) 88.6 (32.9, 188.6) 0.323
No. Fatalities/Capita 0.65 (0.58, 0.90) 1.31 (0.91, 1.63) 0.90 (.59, 1.38) 0.003
% Belted fatalities 55.4 (52.1, 58) 33.6 (29.7, 35.6) 42.9 (33.6, 55.8) <0.001 2005 data: FARS, US Census Bureau (2007c), Population Estimates
It is expected that high belt use States would have a higher proportion of belted fatalities, given that the FARS seat belt use rates were used to define the high and low belt use States. The fatalities per capita result was consistent with the presumption that higher seat belt use would be associated with fewer passenger vehicle occupant fatalities. This is not to say that seat belt use differences are responsible for all of the substantial difference in per capita traffic fatalities between the two groups.
2) Climate: precipitation and temperature
Annual precipitation and temperature rates did not differ significantly between high and low belt use States (see Table 2).
Table 2. Precipitation and Temperature by Seat Belt Use
Variable High Belt Use n = 16
Low Seat Belt Use n = 15
Total N = 31 p-value
Annual precipitation (mean) 33.4 (18.4, 43.2) 44.3 (23.6, 49.8) 38.4 (22.2, 47.9) 0.167
Annual temperature (mean) 52.3 (48.4, 59.2) 54.3 (45.2, 57.6) 52.7 (47.9, 59.0) 0.813 2005 data: National Climatic Data Center (2007), Historical Climatography Series No. 4-3
13

3) Demographics: age, race, and education
The proportion of the population in the young driver age category (18 to 24) did not differ significantly between high and low belt use States (p=0.137). The proportion in the older age category (65 and older) was significantly larger in low belt use States than in high belt use States, though the difference in the median States was only 1.3 percentage points (p=0.006). High belt use States had a substantially larger proportion of Hispanic/Latino population (p<0.001) than low belt use States, while proportions of White only were substantially higher in low belt use States (p=0.005). The proportion of people with bachelor’s degrees was marginally higher (p=0.058) among high belt use States (25.6% vs. 22.0%) with no difference in the proportion of high school graduates between seat belt use categories (p=0.635) (see Table 3).
Table 3. Education, Age, Race, and Ethnicity by Seat Belt Use
Variable High Seat Belt Use n = 16
Low Seat Belt Use n = 15
Total N = 31 p-value
% Ages 18-24 9.7 (9.4, 10.0) 9.9 (9.6, 10.3) 9.8 (9.5, 10.2) 0.137
% Ages > 64 12.1 (11.1, 13.0) 13.4 (12.4, 14.0) 12.8 (11.7, 13.5) 0.006
% Hispanic/Latino 10.7 (6.0, 22.5) 2.4 (1.5, 5.5) 5.5 (2.4, 12.3) <0.001
% White 65.6 (57.2, 78.8) 83.1 (78.6, 88.0) 78.6 (63.8, 85.3) 0.005
% High school grads 81.8 (79.0, 84.9) 81.5 (75.9, 85.1) 81.5 (78.0, 85.1) 0.635
% ≥Bachelor's degree 25.6 (22.9, 27.0) 22.0 (19.6, 25.6) 23.5 (21.5, 26.2) 0.058 2005 data: US Census Bureau (2007c), Population Estimates
4) Roadways
Roadway types and mileage varied between low and high belt use States. First, high belt use States contained more total road miles, because they were on average larger States (p=.058); however, they had fewer total road miles per capita (p=.003). As seen in Table 4, there were significantly more total miles of rural roadways per capita in low belt use States (p=.004) and significantly more total miles of urban roadways per capita in high belt use States (p=.044). The same relationships – higher per capita rural miles in low belt use States and higher per capita urban miles in high belt use States – held for all the individual road categories, though some of the differences were not statistically significant.
14
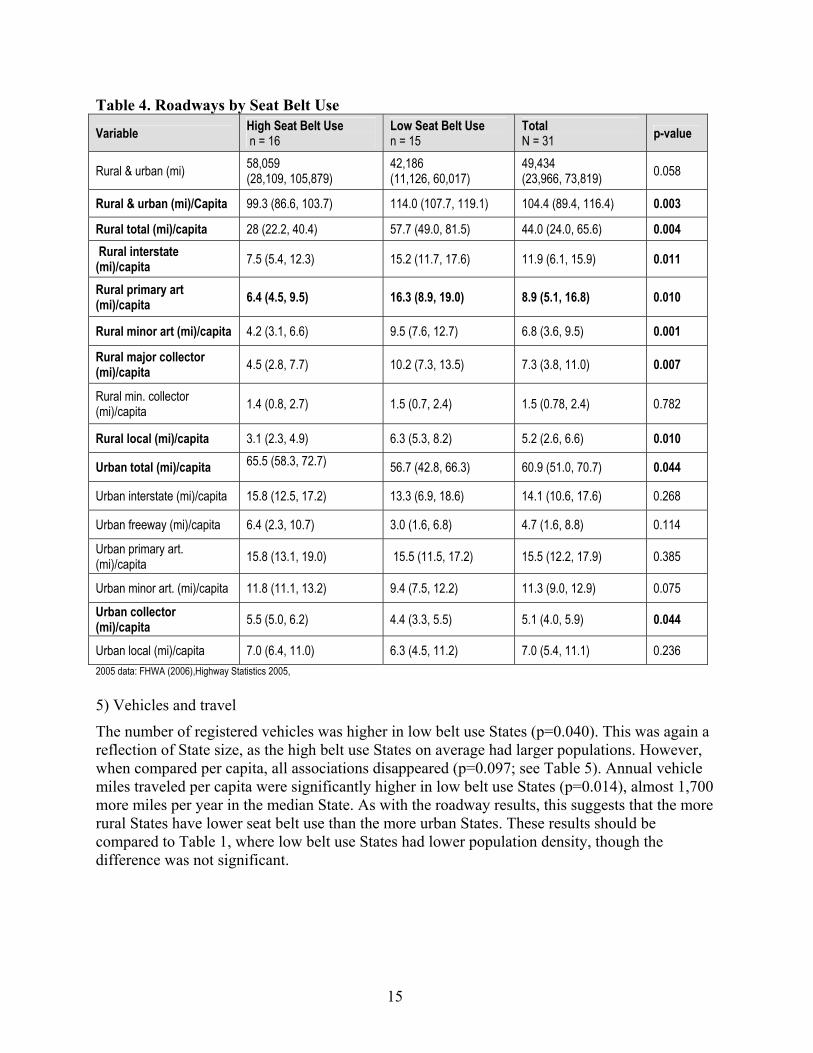
Table 4. Roadways by Seat Belt Use
Variable High Seat Belt Use n = 16
Low Seat Belt Use n = 15
Total N = 31 p-value
Rural & urban (mi) 58,059 (28,109, 105,879)
42,186 (11,126, 60,017)
49,434 (23,966, 73,819) 0.058
Rural & urban (mi)/Capita 99.3 (86.6, 103.7) 114.0 (107.7, 119.1) 104.4 (89.4, 116.4) 0.003
Rural total (mi)/capita 28 (22.2, 40.4) 57.7 (49.0, 81.5) 44.0 (24.0, 65.6) 0.004 Rural interstate
(mi)/capita 7.5 (5.4, 12.3) 15.2 (11.7, 17.6) 11.9 (6.1, 15.9) 0.011
Rural primary art (mi)/capita 6.4 (4.5, 9.5) 16.3 (8.9, 19.0) 8.9 (5.1, 16.8) 0.010
Rural minor art (mi)/capita 4.2 (3.1, 6.6) 9.5 (7.6, 12.7) 6.8 (3.6, 9.5) 0.001
Rural major collector (mi)/capita 4.5 (2.8, 7.7) 10.2 (7.3, 13.5) 7.3 (3.8, 11.0) 0.007
Rural min. collector (mi)/capita 1.4 (0.8, 2.7) 1.5 (0.7, 2.4) 1.5 (0.78, 2.4) 0.782
Rural local (mi)/capita 3.1 (2.3, 4.9) 6.3 (5.3, 8.2) 5.2 (2.6, 6.6) 0.010
Urban total (mi)/capita 65.5 (58.3, 72.7) 56.7 (42.8, 66.3) 60.9 (51.0, 70.7) 0.044
Urban interstate (mi)/capita 15.8 (12.5, 17.2) 13.3 (6.9, 18.6) 14.1 (10.6, 17.6) 0.268
Urban freeway (mi)/capita 6.4 (2.3, 10.7) 3.0 (1.6, 6.8) 4.7 (1.6, 8.8) 0.114
Urban primary art. (mi)/capita 15.8 (13.1, 19.0) 15.5 (11.5, 17.2) 15.5 (12.2, 17.9) 0.385
Urban minor art. (mi)/capita 11.8 (11.1, 13.2) 9.4 (7.5, 12.2) 11.3 (9.0, 12.9) 0.075
Urban collector (mi)/capita 5.5 (5.0, 6.2) 4.4 (3.3, 5.5) 5.1 (4.0, 5.9) 0.044
Urban local (mi)/capita 7.0 (6.4, 11.0) 6.3 (4.5, 11.2) 7.0 (5.4, 11.1) 0.236 2005 data: FHWA (2006),Highway Statistics 2005,
5) Vehicles and travel
The number of registered vehicles was higher in low belt use States (p=0.040). This was again a reflection of State size, as the high belt use States on average had larger populations. However, when compared per capita, all associations disappeared (p=0.097; see Table 5). Annual vehicle miles traveled per capita were significantly higher in low belt use States (p=0.014), almost 1,700 more miles per year in the median State. As with the roadway results, this suggests that the more rural States have lower seat belt use than the more urban States. These results should be compared to Table 1, where low belt use States had lower population density, though the difference was not significant.
15

Table 5. Registered Vehicles and Vehicle Miles Traveled by Seat Belt Use
Variable High Seat Belt Use n = 16
Low Seat Belt Use n = 15
Total N = 31 p-value
Number registered vehicles/capita
7,560.5 (6,959.7, 8,404.1)
8,217.1 (7,754.7, 9,531.2) 7,928.3 (7,283.8, 8,871.1) 0.097
Annual VMT (ml)/capita 9,817 (8,244, 10,359) 11,505 (10,634, 11,876) 10,433 (8,667, 11,664) 0.014 2005 data: FHWA (2006) Highway Statistics 2005.
6) Seat belt laws and fines
As shown by Figures 1 and 2, primary seat belt use laws were strongly associated with high seat belt use and secondary laws with low belt use, as is confirmed by the statistical test (chi-square p<0.001; see Table 6). Thirteen of the 16 high belt use States but only one of the 16 low belt use States had a primary law. Seat belt fines were higher in high belt use States than in low belt use States ((p=0.024), though the difference between the fines in the median States was only $5.00.
Table 6. Seat Belt Fines and Laws by Seat Belt Use Variable High Seat Belt Use
n = 16 Low Seat Belt Use n = 15
Total N = 31 p-value
Law (Primary) 81.25 (13) 6.67 (1) 45.16 (14) <0.001
Min. 1st fine 25 (25, 44) 20 (10, 25) 25 (20, 25) 0.024 2005 data: IIHS (2008) The fine amounts exclude any court costs in addition to the fine amount.
7) Law enforcement
The total number of sworn officers was marginally higher in high belt use States (p=0.070). As with registered vehicles (Table 5), this is a reflection of State population. However, there was no significant difference in the number sworn officers per capita (p=0.906; see Table 7). Indeed, the number of officers per capita is virtually identical in high and low belt use States.
Table 7. Number of Sworn Officers by Seat Belt Use
Variable High Seat Belt Use n = 16
Low Seat Belt Use n = 15
Total N = 31 p-value
Number officers/capita 21.2 (19.2, 25.4) 22.4 (18.5, 25.0) 21.2 (19.0, 25.0) 0.906 2005 data: Federal Bureau of Investigation, Crime in the United States, 2005
8) CIOT citations, 2005
During the 2005 May Click It or Ticket (CIOT) campaign, the number of citations issued was significantly higher in high belt use States than in low belt use States (p<0.001). The citation result suggests that high belt use States were more active in enforcing their seat belt use laws than low belt use States, at least during the CIOT campaign (see Table 8).
16

Table 8. CIOT Citations by Seat Belt Use
Variable High Seat Belt Use n = 16
Low Seat Belt Use n = 15
Total N = 31 p-value
CIOT Citations in 2005/Capita 26.0 (17.6, 30.8) 13.0 (7.8, 16.4)
n=14 17.1 (11.5, 26.8) N=30 <0.001
2005 data: NHTSA (2007d)
9) CIOT media dollars spent, 2003 to 2005
During the 2003 May CIOT campaign, there was no significant association between seat belt use status and media dollars spent for the campaign in total or for radio or television separately (see Table 9). The same associations were tested for the 2004 CIOT with the same results (see Table 10). While the differences are not significant, it’s notable that low belt use States spent more media dollars per capita, total and for television and radio separately, than high belt use States in each of the 2003 and 2004 CIOT efforts.
Table 9. CIOT Total Media Dollars Spent by Seat Belt Use, 2003
Variable High Seat Belt Use n = 16
Low Seat Belt Use n = 15
Total N = 31 p-value
CIOT Total Media Dollars in 2003/Capita 401.3 (101.4, 590.8) 678.0 (401.7, 853.7) 471.4 (197.9, 826.9) 0.097
CIOT Television Media Dollars in 2003/Capita 52.2* (0, 339.2) 322.4 (0, 624.2) 272.2 (0, 487.5) 0.214
CIOT Radio Media Dollars in 2003/Capita 101.6 (4.6, 243.7) 193.4 (0, 283.1) 138.5 (0, 276.2) 0.319
2003 data: NHTSA (2007d) *California and New York handle their media buys differently than most other States and were entered as $0 for this calculation.
Table 10. CIOT Total Media Dollars Spent by Seat Belt Use, 2004
Variable High Seat Belt Use n = 16
Low Seat Belt Use n = 15
Total N = 31 p-value
CIOT Total Media Dollars in 2004/Capita
641.4 (517.8, 805.7) n=14 966.1 (535.1, 1616.6)
736.4 (529.8, 966.1) N=29 0.093
CIOT Television Media Dollars in 2004/Capita
436.1 (193.0, 573.9) n=14 707.1 (233.7, 917.6) 498.7 (233.7, 727.4)
N=29 0.205
CIOT Radio Media Dollars in 2004/Capita
175.3 (147.4, 314.8) n=14 385.9 (182, 521.9) 246.1 (154.3, 476.5)
N=29 0.074
2004 data: NHTSA (2007d)
17
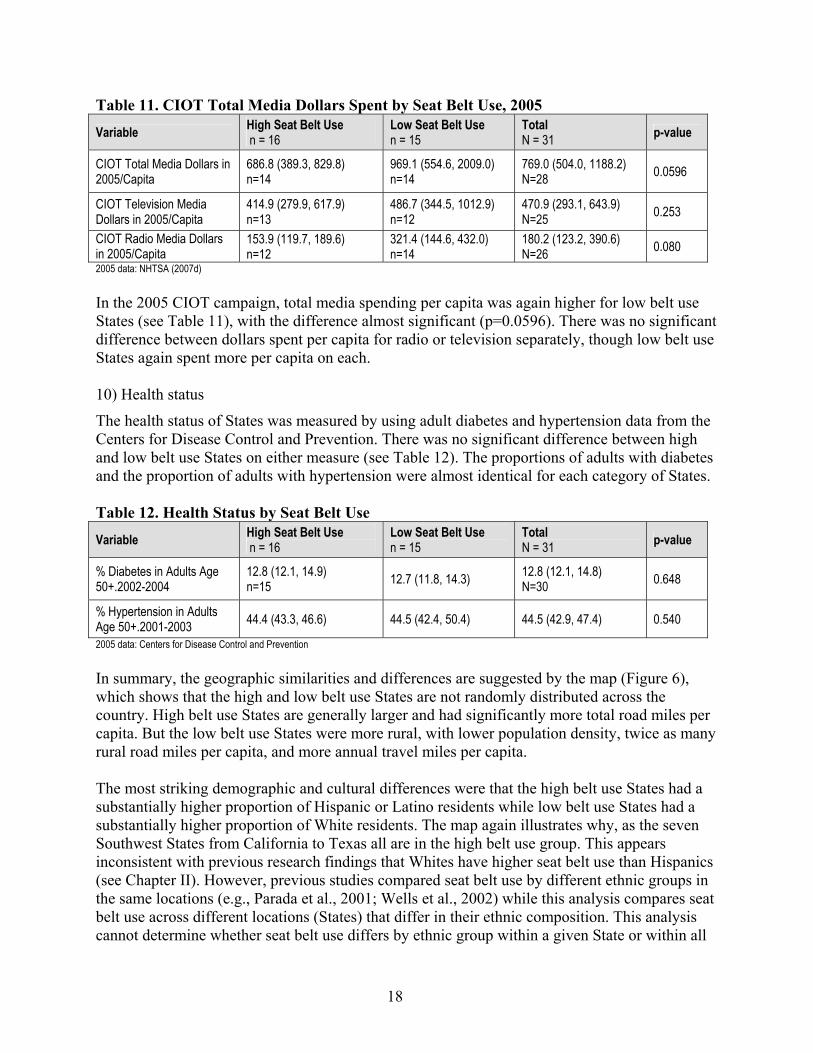
Table 11. CIOT Total Media Dollars Spent by Seat Belt Use, 2005
Variable High Seat Belt Use n = 16
Low Seat Belt Use n = 15
Total N = 31 p-value
CIOT Total Media Dollars in 2005/Capita
686.8 (389.3, 829.8) n=14
969.1 (554.6, 2009.0) n=14
769.0 (504.0, 1188.2) N=28 0.0596
CIOT Television Media Dollars in 2005/Capita
414.9 (279.9, 617.9) n=13
486.7 (344.5, 1012.9) n=12
470.9 (293.1, 643.9) N=25 0.253
CIOT Radio Media Dollars in 2005/Capita
153.9 (119.7, 189.6) n=12
321.4 (144.6, 432.0) n=14
180.2 (123.2, 390.6) N=26 0.080
2005 data: NHTSA (2007d)
In the 2005 CIOT campaign, total media spending per capita was again higher for low belt use States (see Table 11), with the difference almost significant (p=0.0596). There was no significant difference between dollars spent per capita for radio or television separately, though low belt use States again spent more per capita on each.
10) Health status
The health status of States was measured by using adult diabetes and hypertension data from the Centers for Disease Control and Prevention. There was no significant difference between high and low belt use States on either measure (see Table 12). The proportions of adults with diabetes and the proportion of adults with hypertension were almost identical for each category of States.
Table 12. Health Status by Seat Belt Use
Variable High Seat Belt Use n = 16
Low Seat Belt Use n = 15
Total N = 31 p-value
% Diabetes in Adults Age 50+.2002-2004
12.8 (12.1, 14.9) n=15 12.7 (11.8, 14.3) 12.8 (12.1, 14.8)
N=30 0.648
% Hypertension in Adults Age 50+.2001-2003 44.4 (43.3, 46.6) 44.5 (42.4, 50.4) 44.5 (42.9, 47.4) 0.540
2005 data: Centers for Disease Control and Prevention
In summary, the geographic similarities and differences are suggested by the map (Figure 6), which shows that the high and low belt use States are not randomly distributed across the country. High belt use States are generally larger and had significantly more total road miles per capita. But the low belt use States were more rural, with lower population density, twice as many rural road miles per capita, and more annual travel miles per capita.
The most striking demographic and cultural differences were that the high belt use States had a substantially higher proportion of Hispanic or Latino residents while low belt use States had a substantially higher proportion of White residents. The map again illustrates why, as the seven Southwest States from California to Texas all are in the high belt use group. This appears inconsistent with previous research findings that Whites have higher seat belt use than Hispanics (see Chapter II). However, previous studies compared seat belt use by different ethnic groups in the same locations (e.g., Parada et al., 2001; Wells et al., 2002) while this analysis compares seat belt use across different locations (States) that differ in their ethnic composition. This analysis cannot determine whether seat belt use differs by ethnic group within a given State or within all
18

States in either the high or the low belt use groups. It does suggest that other factors have a stronger influence on seat belt use than ethnicity and that States can achieve high seat belt use independent of their ethnic composition. Similar comments apply to the observation that high belt use States had a slightly lower proportion of older residents.
The high and low belt use groups differed substantially and significantly on several measures directly related to traffic safety and seat belt use. Thirteen of the 16 high belt use States had primary seat belt use laws compared to only 1 of the 15 low belt use States. High belt use States also had slightly higher seat belt law fines, with a median fine of $25 compared to $20. While the number of law enforcement officers per capita was virtually identical in high and low belt use States, high belt use States issued twice as many seat belt citations per capita in the 2005 CIOT campaign as did low belt use States. Yet the low belt use States spent 40 percent more per capita on 2005 CIOT campaign media than did high belt use States. The conclusions are obvious: primary laws and active law enforcement raise seat belt use; higher fines may help, though the median difference was small; and publicity by itself is not effective.
CLICK IT OR TICKET SURVEY
The National Seat Belt Tracking Survey (called the Click It or Ticket or CIOT Survey) was administered to a randomly selected national sample of households before the May 2007 CIOT campaign. This survey is particularly relevant in the current context because it is so recent and because the survey questions deal directly with program media, the perceived likelihood of getting a ticket, and direct exposure to enforcement activity. This section reports detailed results from this survey.
Respondents were classified by their residence as living in a high, medium, or low belt use State, using the same definitions as for the previous analyses (see Figure 6).
A chi-square statistic was used to test for significant differences between the three categories of seat belt use for each of the CIOT survey questions. Logistic regression modeling was used for selected questions to compare low belt use States to medium and high belt use States. All logistic regressions were adjusted, or controlled, for the respondent’s age. In addition, the data were weighted to control for unequal probabilities of selection (the number of telephone lines, number of adults in household, and the respondent’s age and sex).
A total of 1,204 survey interviews was conducted. Of these, 556 (46%) were from high belt use States, 401 (33%) from medium belt use States, and 247 (21%) from low belt use States. No significant differences were found among respondents from high, medium, and low belt use States in driving frequency, type of vehicle used, sex, education, or ethnicity (p>0.05). There was, however, a statistically significant difference in age: respondents in low belt use States were younger on average than those medium belt use States, who in turn were younger than those in high belt use States (p<0.05).
Table 13 presents responses to selected questions from the survey for low, medium, and high belt use State respondents. There were no significant differences across the three State belt use
19
groups among the several questions that probed survey respondents’ beliefs about use and effectiveness of seat belts in daily driving and in an accident (Q13a, Q13b; p>0.05). Respondents in all seat belt use groups strongly agreed that they would want to have seat belts on in an accident. Similarly, only a small proportion of survey respondents in each seat belt use group felt that seat belts were just as likely to harm you as help you. Self-reported seat belt use was slightly higher in high belt use States than in medium States, and again slightly higher in medium than in low belt use States, but the differences were only marginally significant (Q4/5; p=0.06). Self-reported seat belt use was lower at night and showed the same trend from high- to medium- to low belt use States, but the differences were not significant (Q10b; p>0.05).
Significant differences across the three seat belt use categories were observed with respect to beliefs about the importance of seat belt enforcement (Q13d, Q31). Perceptions concerning the amount of seat belt enforcement observed in the community also differed significantly (Q10, Q13c). Respondents in high belt use States were more likely to believe that seat belt law enforcement is important and that unbelted occupants will be ticketed (p<0.05).
Results from logistic regression analyses for these questions are presented in Table 14. Since there were significant differences in age by State seat belt use category, all models were adjusted for respondent age. Similar to the results above, beliefs about seat belt use and effectiveness of seat belts in daily driving and in an accident from respondents in high and medium belt use States did not differ significantly from those of respondents in low belt use States (Q13a, Q13b; p>0.05). Survey respondents in high belt use States were significantly more likely to use seat belts all the time compared to respondents in low belt use States. No significant differences were found between respondents in medium and low belt use States for overall or nighttime self-reported seat belt use (Q4/5, Q10b).
Support for the enforcement of seat belt laws was significantly more likely to be expressed by survey respondents from high belt use States than from low belt use States. No differences were found in support for seat belt law enforcement between respondents in medium and low belt use States (Q13d and Q31). The perceived risk of being ticketed for failure to wear a seat belt was significantly higher for survey respondents in high belt use States than in low belt use States. No significant differences were found in the perceived risk of being ticketed between respondents in medium and low belt use States (Q10, Q13c).
In summary, survey respondents from high, medium, and low belt use States did not differ significantly with respect to their driving frequency, type of vehicle used, sex, education, or ethnicity. They also did not differ on their beliefs concerning the value of seat belts should they ever become involved in an accident. That is, respondents from the three State seat belt use groups did not differ significantly with respect to a range of demographic and attitudinal variables known to be related to seat belt use.
Logistic regression analyses indicated that respondents from high belt use States were more likely to agree that it is important for police to enforce the seat belt laws strictly compared to respondents in low belt use States. Further, they were more likely to believe that they would “personally” receive a ticket if they did not wear their seat belts compared to respondents in low belt use States.
20

Table 13. Selected Responses to the 2007 Pre-Campaign National Seat Belt Tracking Survey *
High Belt Use States Medium Belt Use States Low Belt Use States Survey Question n=556 (46.2%) n=401 (33.3%) n=247 (20.5%) p-Value†
0.89 (0.85, 0.94) 0.87 (0.81, 0.92) 0.06
0.32 (0.24, 0.39) 0.32 (0.24, 0.39) 0.01
0.80 (0.73, 0.86) 0.76 (0.68, 0.85) 0.44
0.14 (0.09, 0.19) 0.21 (0.13, 0.30) 0.37
0.88 (0.83, 0.94) 0.90 (0.85, 0.95) 0.16
0.18 (0.12, 0.24) 0.19 (0.12, 0.26) <0.01
0.66 (0.59, 0.74) 0.69 (0.62, 0.76) 0.02
0.62 (0.55, 0.70) 0.53 (0.46, 0.66) 0.02
Q4/5. When driving this 0.94 (0.90, 0.98) vehicle, how often do you wear your shoulder and/or lap belt? All the time
Q10. Assume that you did 0.48 (0.41, 0.55) not use your seat belt at all while driving for the next six months. How likely do you think you will be to receive a ticket for not wearing a seat belt? Very likely
Q10b. When driving this 0.83 (0.77, 0.89) (car/truck/van) AT NIGHT (after midnight) how often do you wear your lap belt? All the time
Q13a. Seat belts are just as 0.17 (0.12, 0.23) likely to harm you as help you? Strongly agree
Q13b. If I was in an 0.93 (0.91, 0.96) accident, I would want to have my seat belt on. Strongly agree
Q13c. Police in my 0.13 (.08, 0.17) community generally will not bother to write tickets for seat belt violations? Strongly agree
Q13d. It is important for 0.78 (0.73, 0.82) police to enforce the seat belt laws? Strongly agree
Q31. How important do 0.69 (0.63, 0.74) you think it is for [respondent's STATE] to enforce seat belt laws for ADULTS more strictly? Very Important
*Presented as weighted proportion (95% confidence interval). † P-value calculated by chi-square analysis using weighted survey analyses.
21

Table 14. Logistic Regression Analyses for Selected Responses to the 2007 Pre-Campaign National Seat Belt Tracking Survey *
High Belt Use States Medium Belt Use States Low Belt Use States Survey Question n=556 (46.2%) n=401 (33.3%) n=247 (20.5%)
Q4/5. When driving this 2.70 (1.26, 5.78), p=0.01 1.38 (0.70, 2.72), p=0.35 1.00 vehicle, how often do you wear your shoulder and/or lap belt? All the time
Q10. Assume that you did not 2.10 (1.36, 3.24), p<0.01 1.06 (0.66, 1.71) p=0.81 1.00 use your seat belt at all while driving for the next six months. How likely do you think you will be to receive a ticket for not wearing a seat belt? Very likely
Q10b. When driving this 1.55 (0.84, 2.85), p=0.16 1.25 (0 68, 2.31), p=0.48 1.00 (car/truck/van) AT NIGHT (after midnight) how often do you wear your lap belt? All the time
Q13a. Seat belts are just as 0.72 (0.38, 1.34), p=0.29 0.58 (0.30, 1.12), p= 0.11 1.00 likely to harm you as help you? Strongly agree
Q13b. If I were in an 1.60 (0.81, 3.18), .p=0.18 0.86 (0.41, 1.80) p=0.69 1.00 accident, I would want to have my seat belt on. Strongly agree
Q13c. Police in my community 0.49 (0.26, 0.92), p=0.03 1.01 (0.55, 1.87), p=0.96 1.00 generally will not bother to write tickets for seat belt violations? Strongly agree
Q13d. It is important for police 1.55 (1.00, 2.39), p=0.05 0.89 (0.56, 1.42), p=0.62 1.00 to enforce the seat belt laws? Strongly agree
Q31. How important do you 1.92 (1.25, 2.94), p<0.01 1.40 (0.89, 2.21), p=0.15 1.00 think it is for [respondent's STATE] to enforce seat belt laws for ADULTS more strictly? Very Important
* Logistic regression models adjusted for age with low belt use States as reference group using weighted survey analyses. Presented as odds ratio (95% confidence interval), p-value.
22
These results suggest that the perceived level of enforcement is an important factor associated with a State’s seat belt use rate while demographic factors and knowledge and attitudes regarding seat belts are not. It’s important to note that 12 of the 15 high belt use States (80%) had primary enforcement laws at the time of this survey as compared with only 4 of the 15 (27%) low belt use States. Since the perception of enforcement tends to be higher in primary law States, the primary laws may account for much of the difference in the perceived level of enforcement across the three State seat belt use groups. However, other factors also may contribute, such as the cost of the fine for failing to wear a seat belt, the types of vehicles covered under the seat belt law and, most importantly, the actual levels of ticketing and related enforcement activity.
23
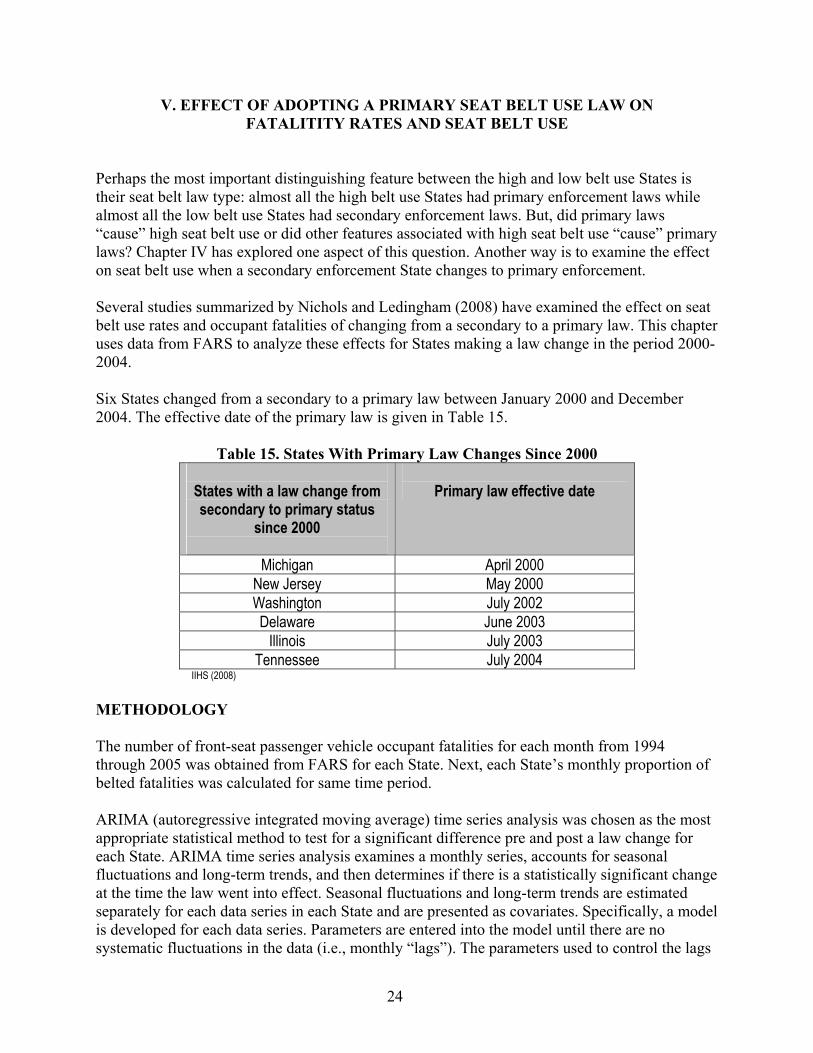
V. EFFECT OF ADOPTING A PRIMARY SEAT BELT USE LAW ON FATALITITY RATES AND SEAT BELT USE
Perhaps the most important distinguishing feature between the high and low belt use States is their seat belt law type: almost all the high belt use States had primary enforcement laws while almost all the low belt use States had secondary enforcement laws. But, did primary laws “cause” high seat belt use or did other features associated with high seat belt use “cause” primary laws? Chapter IV has explored one aspect of this question. Another way is to examine the effect on seat belt use when a secondary enforcement State changes to primary enforcement.
Several studies summarized by Nichols and Ledingham (2008) have examined the effect on seat belt use rates and occupant fatalities of changing from a secondary to a primary law. This chapter uses data from FARS to analyze these effects for States making a law change in the period 2000-2004.
Six States changed from a secondary to a primary law between January 2000 and December 2004. The effective date of the primary law is given in Table 15.
Table 15. States With Primary Law Changes Since 2000
States with a law change from secondary to primary status
since 2000
Primary law effective date
Michigan April 2000 New Jersey May 2000 Washington July 2002 Delaware June 2003
Illinois July 2003 Tennessee July 2004
IIHS (2008)
METHODOLOGY
The number of front-seat passenger vehicle occupant fatalities for each month from 1994 through 2005 was obtained from FARS for each State. Next, each State’s monthly proportion of belted fatalities was calculated for same time period.
ARIMA (autoregressive integrated moving average) time series analysis was chosen as the most appropriate statistical method to test for a significant difference pre and post a law change for each State. ARIMA time series analysis examines a monthly series, accounts for seasonal fluctuations and long-term trends, and then determines if there is a statistically significant change at the time the law went into effect. Seasonal fluctuations and long-term trends are estimated separately for each data series in each State and are presented as covariates. Specifically, a model is developed for each data series. Parameters are entered into the model until there are no systematic fluctuations in the data (i.e., monthly “lags”). The parameters used to control the lags
24

must significantly affect the series before they can be used in the model. SPSS version 13.0 with the Trends Module was used to conduct the ARIMA time series analyses.
Analyses were conducted on two separate data series for each State. The first series was the monthly percentage of belt use among fatally injured occupants (passenger vehicle drivers and right-front passengers age 15 and older). These analyses tested the hypothesis that the law change increased seat belt use. The second series was monthly fatalities of front-seat passenger vehicle occupants (again, drivers and right front passengers age 15 and older). These analyses tested the hypothesis that the change from a secondary to a primary seat belt use law reduced occupant fatalities.
Data were analyzed for each month within the 12-year period from January 1994 through December 2005. This provided 144 data points for each State. For each State, the pre-law period began in January 1994 and ended with the month before the law went into effect. The post-law period began the month that the law went into effect and ended in December 2005.
States were examined individually to examine the effects of the law change on seat belt use and occupant fatalities for each State and because the States implemented the law change differently (for example, in the timing and strength of any enforcement or in the use of a warning period). A single-stage model (testing for a single change at the month when the law went into effect) was used instead of a multistage model (testing for changes at different times, for example when the law went into effect and when enforcement began) because information was not available to develop consistent multistage models for each State.
Shelby County was not included in the Tennessee State data and analysis. This county had an existing primary seat belt law prior to the statewide law change.
FARS data for calendar years 1994 through 2005 were downloaded from the National Center for Statistics and Analysis. These data were limited to fatalities that met the following criteria: age 15 and older, front-seat occupants of passenger vehicles, either drivers or right-front passengers. Passenger vehicles included passenger cars, sport utility vehicles (SUVs), minivans, and pickup trucks.
RESULTS
The following analyses tested whether each State’s law change increased seat belt use among front-seat passenger vehicle occupants killed in fatal crashes and whether it reduced front-seat passenger vehicle occupant fatalities. The State results are presented in the order in which the law changes occurred, from Michigan in April 2000 through Tennessee in July 2004. In each State model, the “law change” regression coefficient estimates the change in belt use or occupant fatalities, respectively, associated with the law change. Each Figure shows the same 12-year period from January 1994 through December 2005, with the month of each State’s law change noted by a vertical line.
25

Mic
higa
n AR
IMA
Perc
ent B
elte
d
.8
.7
.6
.5
.4
.3
.2
.8
.7
.6
.5
.4
.3
.2Mic
higa
n AR
IMA
Perc
ent B
elte
d
JJaan 94n 94 –– MMaarrcchh 0000 AprilApril 0000 –– DDeecc 0505
Month aMonth and Yearnd Year
1) Michigan
Michigan’s change to a primary seat belt use law increased the seat belt use rate for front-seat passenger vehicle occupant fatalities by an estimated 15.0 percentage points (p<.001; see Table 16 and Figure 9).
Table 16. Michigan ARIMA Parameter Estimates for Proportion Belted, Front Seat Passenger Vehicle Occupant Fatalities Michigan (100 101) Non-Seasonal Lags Non-Seasonal AR1
Estimates .21040566
Std Error .08239420
T 2.553646
Approx Sig .01173833
Seasonal Lags Seasonal AR1 .97026776 .07233444 13.413634 .00000000 Seasonal MA1 .87675971 .16958769 5.169949 .00000080
Regression Coefficients MI Law Change .14979827 .01319929 11.348962 .00000000 Constant .45151240 .01370319 32.949427 .00000000
Figure 9. Proportion of Belted, Front-Seat Passenger Vehicle Occupant Fatalities in Michigan
26
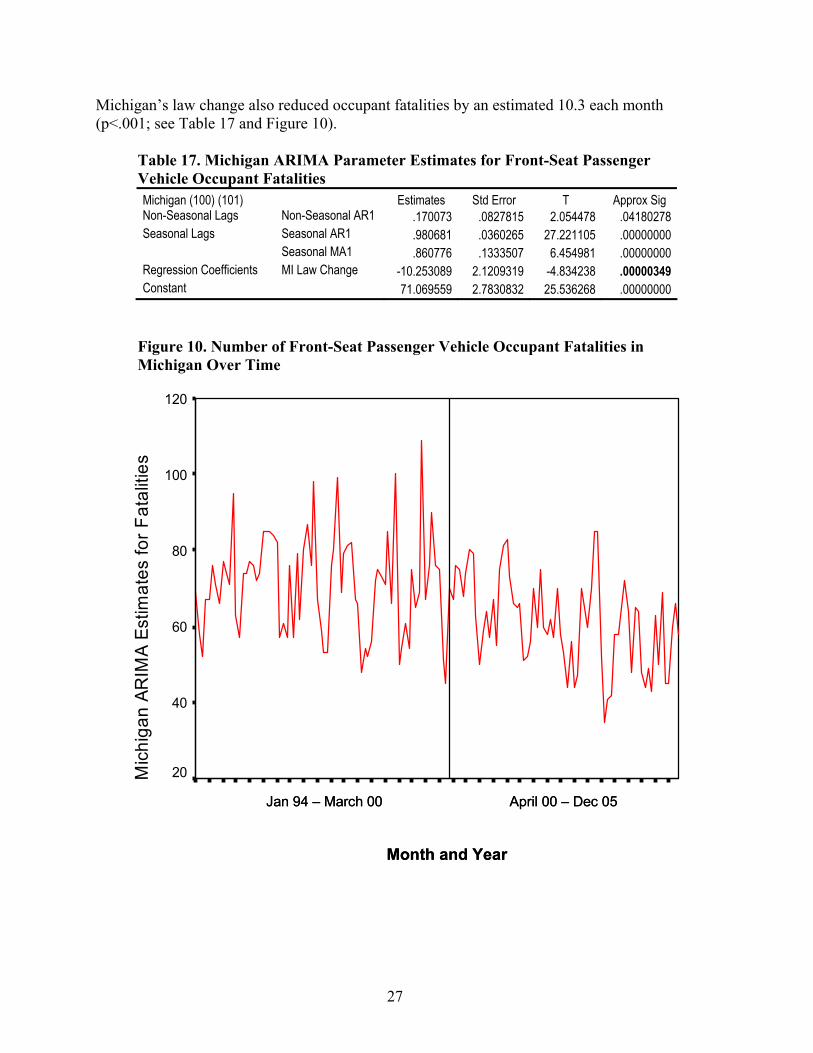
Mic
higa
n AR
IMA
Estim
ates
for F
atal
ities
120
100
80
60
40
20
Mic
higa
n AR
IMA
Estim
ates
for F
atal
ities
120
100
80
60
40
20
JJaann 9944 –– MMarcarchh 0000 AApprriill 0000 –– DDecec 0055
MoMonntth andh and YearYear
Michigan’s law change also reduced occupant fatalities by an estimated 10.3 each month (p<.001; see Table 17 and Figure 10).
Table 17. Michigan ARIMA Parameter Estimates for Front-Seat Passenger Vehicle Occupant Fatalities Michigan (100) (101) Non-Seasonal Lags Non-Seasonal AR1
Estimates .170073
Std Error .0827815
T 2.054478
Approx Sig .04180278
Seasonal Lags Seasonal AR1 .980681 .0360265 27.221105 .00000000 Seasonal MA1 .860776 .1333507 6.454981 .00000000
Regression Coefficients MI Law Change -10.253089 2.1209319 -4.834238 .00000349 Constant 71.069559 2.7830832 25.536268 .00000000
Figure 10. Number of Front-Seat Passenger Vehicle Occupant Fatalities in Michigan Over Time
27

New
Jer
sey
ARIM
A Pe
rcen
t Bel
ted
.8
.7
.6
.5
.4
.3
.2
.1
.8
.7
.6
.5
.4
.3
.2
.1New
Jer
sey
ARIM
A Pe
rcen
t Bel
ted
JJaann 9944 –– AApprrilil 0000 May 00May 00 –– DDec 0ec 055
MoMonntth ah annd Yeard Year
2) New Jersey
New Jersey’s law change increased occupant fatality seat belt use by an estimated 10.8 percentage points (p<.001; see Table 18 and Figure 11).
Table 18. New Jersey ARIMA Parameter Estimates for Proportion Belted, Front Seat Passenger Vehicle Occupant Fatalities New Jersey (000) (000) Estimates Std Error T Approx Sig Regression Coefficients NJ Law Change .10777062 .01635959 6.587613 .0000000 Constant .38951168 .01119803 34.783942 .0000000
Figure 11. Proportion of Belted, Front-Seat Passenger Vehicle Occupant Fatalities in New Jersey
28
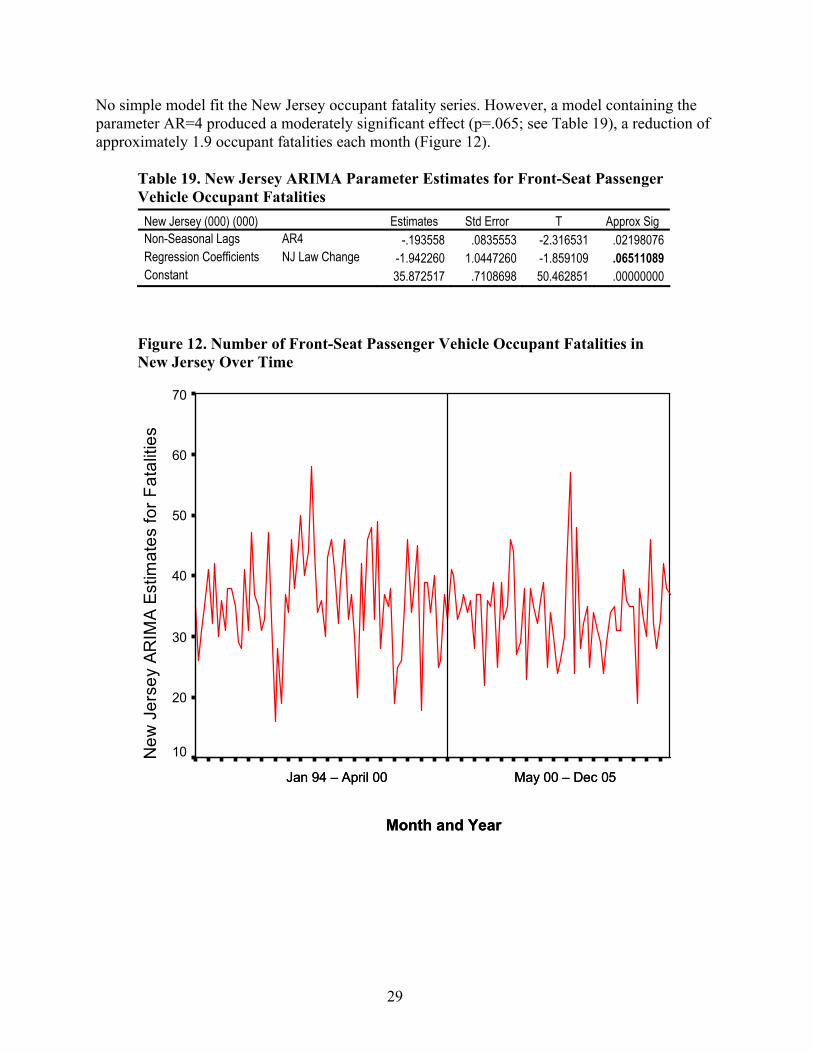
New
Jer
sey
ARIM
A Es
timat
es fo
r Fat
aliti
es
70
60
50
40
30
20
10
70
60
50
40
30
20
10New
Jer
sey
ARIM
A Es
timat
es fo
r Fat
aliti
es
JaJann 9944 –– AApprrilil 0000 MMaayy 0000 –– DDecec 0055
MoMonthnth aanndd YearYear
No simple model fit the New Jersey occupant fatality series. However, a model containing the parameter AR=4 produced a moderately significant effect (p=.065; see Table 19), a reduction of approximately 1.9 occupant fatalities each month (Figure 12).
Table 19. New Jersey ARIMA Parameter Estimates for Front-Seat Passenger Vehicle Occupant Fatalities
New Jersey (000) (000) Estimates Std Error T Approx Sig Non-Seasonal Lags AR4 -.193558 .0835553 -2.316531 .02198076 Regression Coefficients NJ Law Change -1.942260 1.0447260 -1.859109 .06511089 Constant 35.872517 .7108698 50.462851 .00000000
Figure 12. Number of Front-Seat Passenger Vehicle Occupant Fatalities in New Jersey Over Time
29
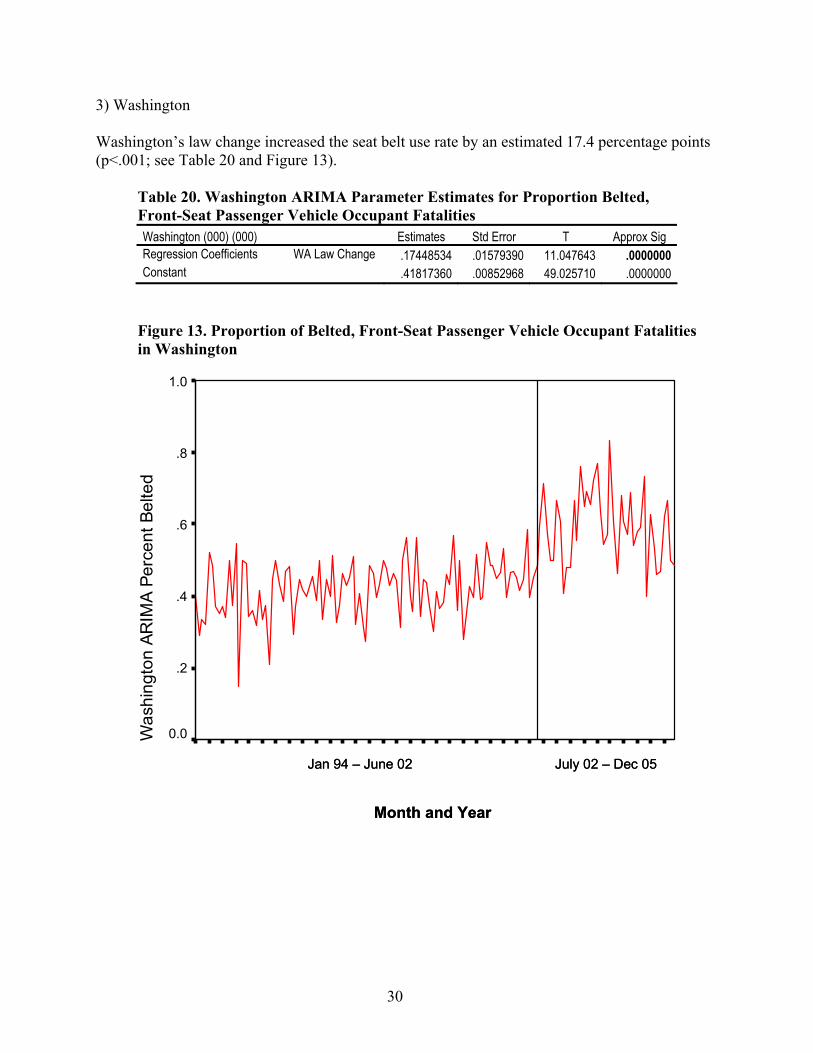
Was
hing
ton
ARIM
A Pe
rcen
t Bel
ted
1.0
.8
.6
.4
.2
0.0
1.0
.8
.6
.4
.2
0.0Was
hing
ton
ARIM
A Pe
rcen
t Bel
ted
JaJann 9494 –– JJununee 0202 JuJulyly 0202 –– DDeecc 0505
MoMonntth ah and Ynd Yearear
3) Washington
Washington’s law change increased the seat belt use rate by an estimated 17.4 percentage points (p<.001; see Table 20 and Figure 13).
Table 20. Washington ARIMA Parameter Estimates for Proportion Belted, Front-Seat Passenger Vehicle Occupant Fatalities Washington (000) (000) Estimates Std Error T Approx Sig Regression Coefficients WA Law Change .17448534 .01579390 11.047643 .0000000 Constant .41817360 .00852968 49.025710 .0000000
Figure 13. Proportion of Belted, Front-Seat Passenger Vehicle Occupant Fatalities in Washington
30

Was
hing
ton
ARIM
A Es
timta
tes
for F
atal
tites
70
60
50
40
30
20
10
Was
hing
ton
ARIM
A Es
timta
tes
for F
atal
tites
70
60
50
40
30
20
10
JJaann 9494 –– JJununee 0202 JJuullyy 0202 –– DDeecc 0505
MonMontth ah and Yearnd Year
The time series analysis of the number of front-seat passenger vehicle occupant fatalities lends strong support to the hypothesis that Washington’s primary law reduced fatalities. The regression coefficient for the law change was statistically significant (p=.002; see Table 21 and Figure 14). The coefficient gives the estimated change in number of fatalities per month. After the effective date of the Washington primary law change, an estimated 4.7 fewer fatalities occurred each month.
Table 21. Washington ARIMA Parameter Estimates for Front-Seat Passenger Vehicle Occupant Fatalities Washington (000) (100) Estimates Std Error T Approx Sig Seasonal Lags Seasonal AR1 .213928 .0867921 2.464830 .01490925 Regression Coefficients WA Law Change -4.685852 1.5023150 -3.119088 .00220008 Constant 34.930341 .8607956 40.579137 .00000000
Figure 14. Number of Front-Seat Passenger Vehicle Occupant Fatalities in Washington Over Time
31
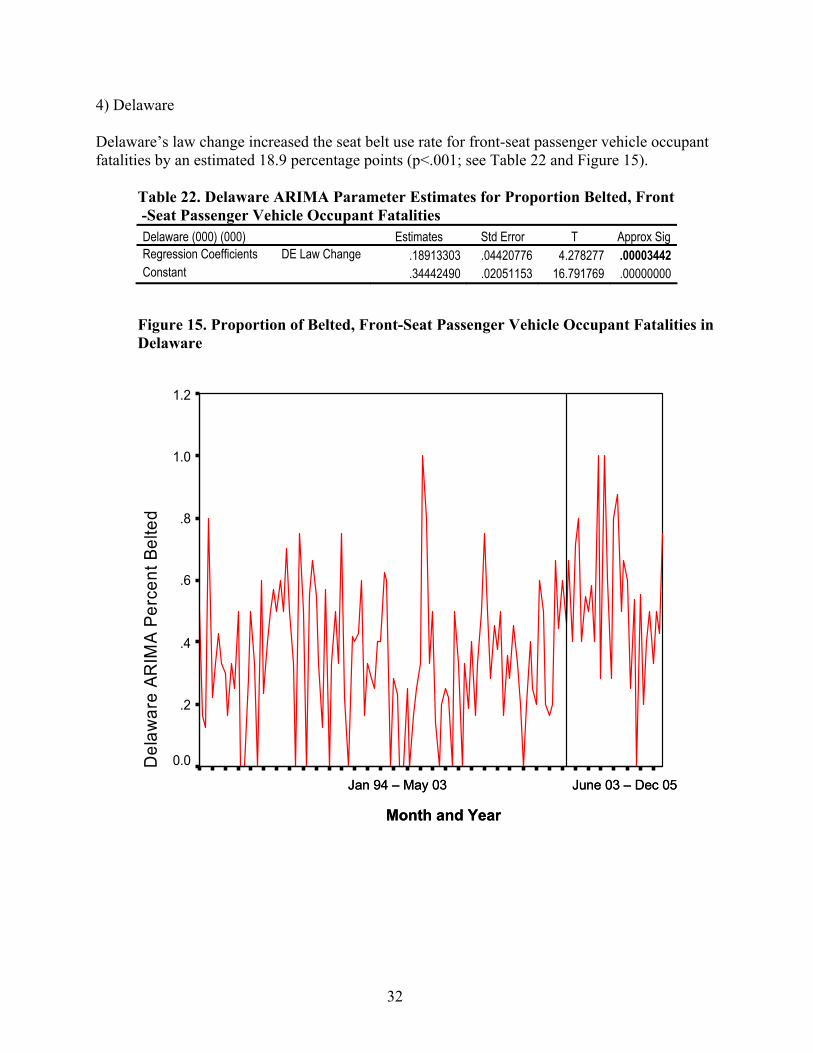
Del
awar
e AR
IMA
Perc
ent B
elte
d
1.2
1.0
.8
.6
.4
.2
0.0
1.2
1.0
.8
.6
.4
.2
0.0Del
awar
e AR
IMA
Perc
ent B
elte
d
JJaan 94 –n 94 – MMay 0ay 033 JJuunnee 0303 –– DDeecc 0055
MMoonntth ah annd Yd Yeearar
4) Delaware
Delaware’s law change increased the seat belt use rate for front-seat passenger vehicle occupant fatalities by an estimated 18.9 percentage points (p<.001; see Table 22 and Figure 15).
Table 22. Delaware ARIMA Parameter Estimates for Proportion Belted, Front -Seat Passenger Vehicle Occupant Fatalities Delaware (000) (000) Estimates Std Error T Approx Sig Regression Coefficients DE Law Change .18913303 .04420776 4.278277 .00003442 Constant .34442490 .02051153 16.791769 .00000000
Figure 15. Proportion of Belted, Front-Seat Passenger Vehicle Occupant Fatalities in Delaware
32

Del
awar
e AR
IMA
Estim
ates
for F
atal
ities
20
10
0
20
10
0Del
awar
e AR
IMA
Estim
ates
for F
atal
ities
JaJann 9494 –– MMayay 0033 JJuunnee 0033 –– DDec 05ec 05
MonMontth ah annd Yeard Year
A moderately significant effect was found for passenger vehicle occupant fatalities in Delaware (p=.067); however the coefficient for law change estimates that fatalities increased by 1.2 each month (see Table 23 and Figure 16). Note that both Delaware results should be interpreted very cautiously because of the small number of occupant fatalities in Delaware each month.
Table 23. Delaware ARIMA Parameter Estimates for Front-Seat Passenger Vehicle Occupant Fatalities Delaware (000) (000) Estimates Std Error T Approx Sig Regression Coefficients DE Law Change 1.1684271 .63402737 1.842865 .06743393 Constant 6.2831858 .29417625 21.358576 .00000000
Figure 16. Number of Front-Seat Passenger Vehicle Occupant Fatalities in Delaware Over Time
33

Illin
ois
ARIM
A Pe
rcen
t Bel
ted
.7
.6
.5
.4
.3
.2
.7
.6
.5
.4
.3
.2
JaJann 9944 –– JJuunnee 0303 JulyJuly 0033 –– DDeecc 0505
MMoonntth ah annd Yd Yeearar
Illin
ois
ARIM
A Pe
rcen
t Bel
ted
5) Illinois
No simple model fit the Illinois seat belt use data; however, a model containing the parameter AR=6 produced stationarity with a significant effect (p<.001; Table 24 and Figure 17). The model estimates an increase in seat belt use of 11.9 percentage points.
Table 24. Illinois ARIMA Parameter Estimates for Proportion Belted, Front-Seat Passenger Vehicle Occupant Fatalities
Illinois (000) (000) Estimates Std Error T Approx Sig Non-Seasonal Lags AR6 .29067669 .08292474 3.505307 .00061184 Regression Coefficients IL Law Change .11858290 .01592856 7.444674 .00000000 Constant .38224461 .00782353 48.858348 .00000000
Figure 17. Proportion of Belted, Front-Seat Passenger Vehicle Occupant Fatalities in Illinois
34

Illin
ois
ARIM
A Es
timat
es fo
r Fat
aliti
es
100
90
80
70
60
50
40
30
100
90
80
70
60
50
40
30Illin
ois
ARIM
A Es
timat
es fo
r Fat
aliti
es
JJanan 9944 –– JJuunnee 0033 JJuulyly 0303 –– DDec 0ec 055
MontMonth ah anndd YearYear
The analysis showed no effect of the Illinois primary law on occupant fatalities. The final model was not significant (p=.805; see Table 25). Figure 18 shows there was no significant downward trend in the number of monthly fatalities after the law change.
Table 25. Illinois ARIMA Parameter Estimates for Front-Seat Passenger Vehicle Occupant Fatalities Illinois (100) (000) Estimates Std Error T Approx Sig Non-Seasonal Lags Non-Seasonal AR1 .209856 .0823281 2.549024 .01187216 Regression Coefficients IL Law Change .715073 2.8911606 .247331 .80501206 Constant 63.537934 1.3303453 47.760482 .00000000
Figure 18. Number of Front-Seat Passenger Vehicle Occupant Fatalities in Illinois Over Time
35

Tenn
esse
e AR
IMA
Perc
ent B
elte
d
.5
.4
.3
.2
.1
0.0
.5
.4
.3
.2
.1
0.0Tenn
esse
e AR
IMA
Perc
ent B
elte
d
JaJann 9494 –– JJununee 0404 JulyJuly 0404 –– DDeecc 0505
Month andMonth and YearYear
6) Tennessee
Tennessee’s law change increased the seat belt use rate for front-seat passenger vehicle occupants killed in fatal crashes by an estimated 6.3 percentage points (p=.013; see Table 26 and Figure 19).
Table 26. Tennessee ARIMA Parameter Estimates for Proportion Belted, Front Seat Passenger Vehicle Occupant Fatalities Tennessee (101) (000) Estimates Std Error T Approx Sig Non-Seasonal Lags Non-Seasonal AR1 .98777290 .01612335 61.263492 .00000000
Non-Seasonal MA1 .89265471 .05321234 16.775332 .00000000 Regression Coefficients TN Law Change .06279142 .02499219 2.512442 .01312440 Constant .27924930 .03073702 9.085113 .00000000
Figure 19. Proportion of Belted, Front-Seat Passenger Vehicle Occupant Fatalities in Tennessee
36
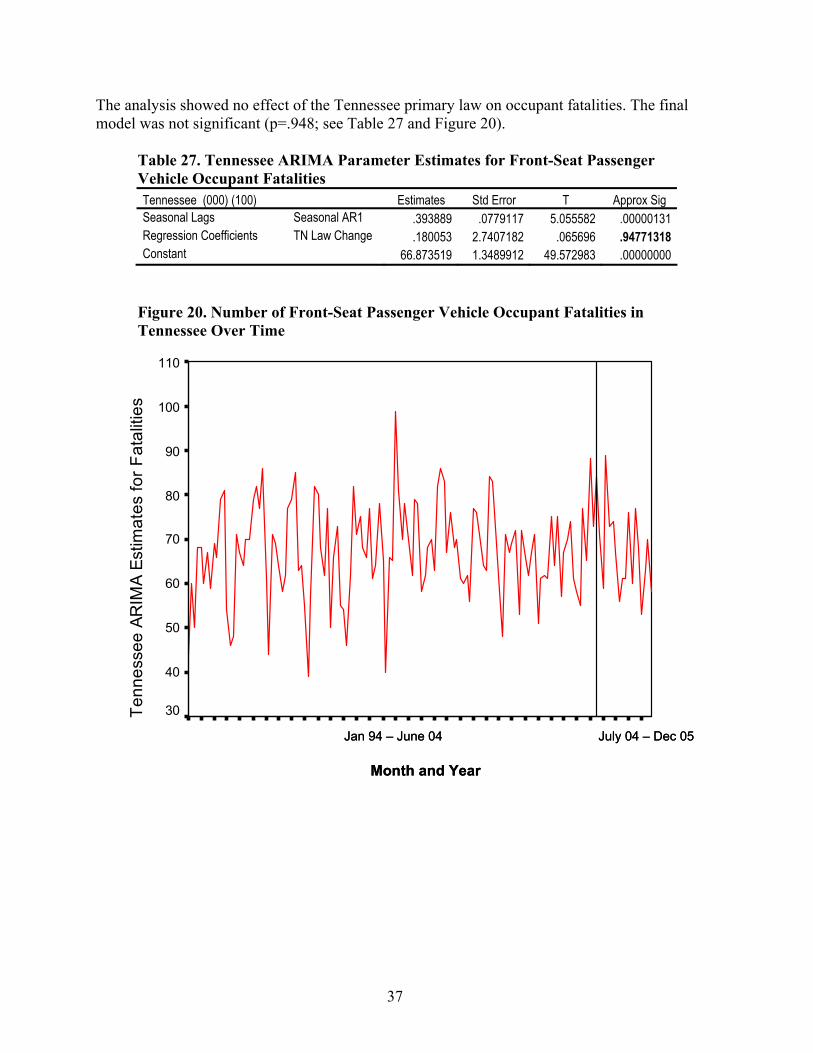
Tenn
esse
e AR
IMA
Estim
ates
for F
atal
ities
110
100
90
80
70
60
50
40
30
Tenn
esse
e AR
IMA
Estim
ates
for F
atal
ities
110
100
90
80
70
60
50
40
30
JJan 94 –an 94 – JJuneune 0044 JJuullyy 04 –04 – DDecec 0505
MMoonntthh aandnd YeaYearr
The analysis showed no effect of the Tennessee primary law on occupant fatalities. The final model was not significant (p=.948; see Table 27 and Figure 20).
Table 27. Tennessee ARIMA Parameter Estimates for Front-Seat Passenger Vehicle Occupant Fatalities Tennessee (000) (100) Estimates Std Error T Approx Sig Seasonal Lags Seasonal AR1 .393889 .0779117 5.055582 .00000131 Regression Coefficients TN Law Change .180053 2.7407182 .065696 .94771318 Constant 66.873519 1.3489912 49.572983 .00000000
Figure 20. Number of Front-Seat Passenger Vehicle Occupant Fatalities in Tennessee Over Time
37
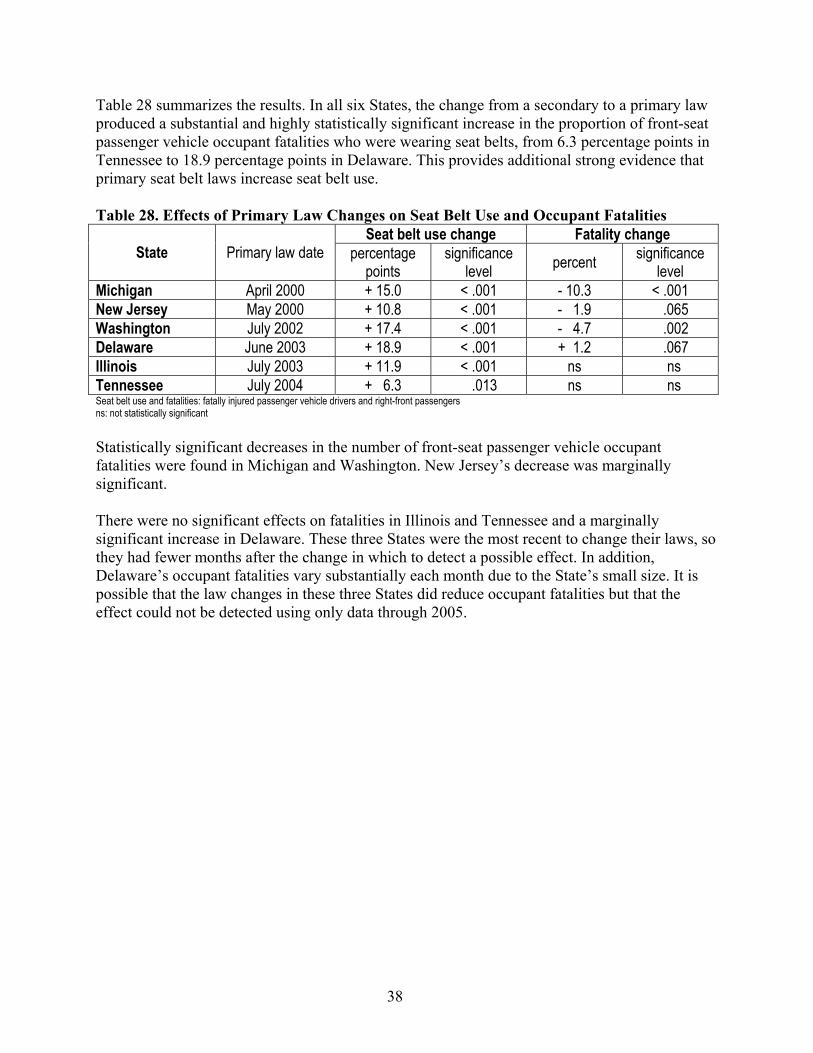
Table 28 summarizes the results. In all six States, the change from a secondary to a primary law produced a substantial and highly statistically significant increase in the proportion of front-seat passenger vehicle occupant fatalities who were wearing seat belts, from 6.3 percentage points in Tennessee to 18.9 percentage points in Delaware. This provides additional strong evidence that primary seat belt laws increase seat belt use.
Table 28. Effects of Primary Law Changes on Seat Belt Use and Occupant Fatalities
State Primary law date Seat belt use change Fatality change
percentage points
significance level percent significance
level Michigan April 2000 + 15.0 < .001 - 10.3 < .001 New Jersey May 2000 + 10.8 < .001 - 1.9 .065 Washington July 2002 + 17.4 < .001 - 4.7 .002 Delaware June 2003 + 18.9 < .001 + 1.2 .067 Illinois July 2003 + 11.9 < .001 ns ns Tennessee July 2004 + 6.3 .013 ns ns Seat belt use and fatalities: fatally injured passenger vehicle drivers and right-front passengers ns: not statistically significant
Statistically significant decreases in the number of front-seat passenger vehicle occupant fatalities were found in Michigan and Washington. New Jersey’s decrease was marginally significant.
There were no significant effects on fatalities in Illinois and Tennessee and a marginally significant increase in Delaware. These three States were the most recent to change their laws, so they had fewer months after the change in which to detect a possible effect. In addition, Delaware’s occupant fatalities vary substantially each month due to the State’s small size. It is possible that the law changes in these three States did reduce occupant fatalities but that the effect could not be detected using only data through 2005.
38
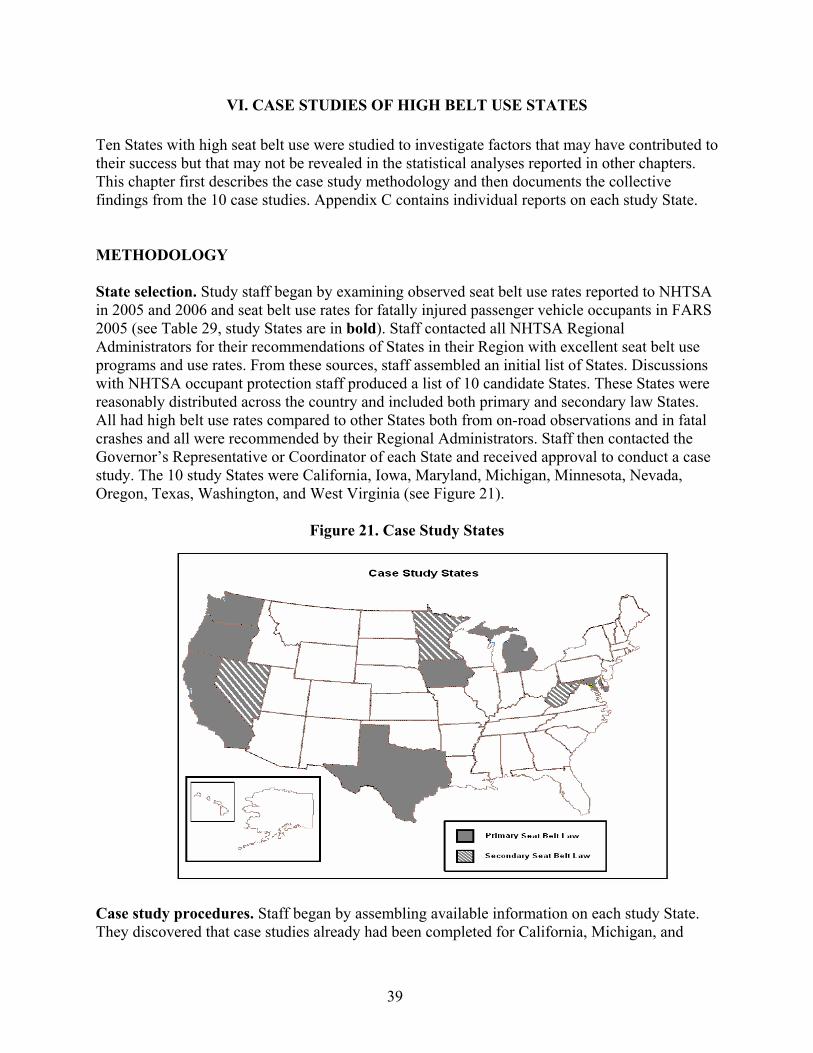
VI. CASE STUDIES OF HIGH BELT USE STATES
Ten States with high seat belt use were studied to investigate factors that may have contributed to their success but that may not be revealed in the statistical analyses reported in other chapters. This chapter first describes the case study methodology and then documents the collective findings from the 10 case studies. Appendix C contains individual reports on each study State.
METHODOLOGY
State selection. Study staff began by examining observed seat belt use rates reported to NHTSA in 2005 and 2006 and seat belt use rates for fatally injured passenger vehicle occupants in FARS 2005 (see Table 29, study States are in bold). Staff contacted all NHTSA Regional Administrators for their recommendations of States in their Region with excellent seat belt use programs and use rates. From these sources, staff assembled an initial list of States. Discussions with NHTSA occupant protection staff produced a list of 10 candidate States. These States were reasonably distributed across the country and included both primary and secondary law States. All had high belt use rates compared to other States both from on-road observations and in fatal crashes and all were recommended by their Regional Administrators. Staff then contacted the Governor’s Representative or Coordinator of each State and received approval to conduct a case study. The 10 study States were California, Iowa, Maryland, Michigan, Minnesota, Nevada, Oregon, Texas, Washington, and West Virginia (see Figure 21).
Figure 21. Case Study States
Case study procedures. Staff began by assembling available information on each study State. They discovered that case studies already had been completed for California, Michigan, and
39
Texas that documented activities through about 2000 (NHTSA 2001a, 2001b, 2001c) while Washington’s policies and programs through 2003 were thoroughly evaluated by Salzberg and Moffat (2004). Study staff only acquired information on recent activities for these four States. Staff conducted full case studies for the remaining six States.
Study staff visited each State between late February and late June 2007 and met with key individuals, recommended by the State’s Governor’s Representative or Coordinator, who were knowledgeable about the State’s seat belt program management, activities, communications, law enforcement, data, and research. In all States these included the Highway Safety Office’s people responsible for occupant protection and public affairs (specific titles vary by State) and the Governor’s Representative or Coordinator (except in Maryland, where the NHTSA Regional Administrator substituted). They typically included a law enforcement representative, often a researcher or data specialist, sometimes people from partner organizations or from the NHTSA Regional office. Some meetings were held with individuals separately; others were group discussions. In Texas, staff attended a regular meeting of the Texas Click It or Ticket Coalition. When key individuals were not available during the visit, discussions were conducted by telephone. From 3 to 13 people were interviewed in each State. Individuals in each State provided research studies, briefing papers, press releases, data summaries, and other written information relevant to each State’s seat belt use activities. Individuals interviewed and documents reviewed are listed at the end of each State report in Appendix C.
For discussions in each State, staff prepared a very general topic outline incorporating information on the State’s seat belt law, seat belt use, seat belt use history compared to neighboring States, and noting other available sources. Staff distributed this outline and a one-page study description at the beginning of each discussion (see Appendices D and E). The discussions then proceeded informally, with State participants responding to areas in the outline on which they had information to provide. Discussions typically concluded with open-ended questions on the most important reasons for the State’s high seat belt use rate and on advice to other States.
Study staff then drafted a report on each State. These reports all follow the same general format with emphasis on the factors that are most important for each State. Thus they attempt to tell each State’s story clearly and accurately rather than provide answers to a common set of predetermined questions. The reports cover each State’s activities through 2006 and their broad plans for 2007. Activities early in 2007 are included for a few States, but the reports do not attempt to document activities during the May 2007 mobilization. The study States’ 2007 observed seat belt use rates, from surveys in June 2007 as reported in October 2007, have been added to the reports and summary tables. Each draft report was reviewed for accuracy and completeness by staff in the State’s Highway Safety Office and was revised as appropriate. These reports are found in Appendix C.
40

RESULTS
Study State characteristics
The 10 study States (Figure 21) come from 6 of the 10 NHTSA Regions as they were constituted in spring 2007 and 7 of the 10 Regions after the October 2007 Regional realignment. Minnesota, Nevada, and West Virginia have secondary enforcement seat belt laws; the remaining seven have primary laws.
Tables 29, 30, and 31 show how the 10 study States (in bold) compare to others on their 2005 and 2006 observed seat belt use rates and on their 2005 use rates in fatal crashes. Table 29 presents the information alphabetically by State.
Table 30 presents the same information with the States arranged differently. It groups States first by law type and then in decreasing order of observed seat belt use in 2006. The study States include six of the seven primary law States with the highest observed seat belt use; the remaining study State is tenth. The secondary law study States have the first, third, and fifth highest observed seat belt use among the secondary States.
Table 31 presents the same information with the States grouped first by law type and then in decreasing order of seat belt use among fatally injured passenger vehicle occupants reported in the 2005 FARS. The seven primary law study States all are in the top eight. The secondary law study States include two of the top four, with the remaining study State a little above the median secondary State.
Table 32 provides data on several geographic and demographic characteristics for the study States. The States vary substantially on most measures. State populations range from California’s 36 million to West Virginia’s 1.8 million, land areas from 268,581 square miles in Texas to 12,407 in Maryland, and population densities from 573 per square mile in Maryland to 22 in Nevada. California has 2 cities exceeding one million in population, 54 between 100,000 and one million, and another 183 cities between 25,000 and 100,000, while West Virginia has only 5 cities exceeding 25,000 and none over 100,000. Texas has over 300,000 miles of public roads, Maryland has just over 30,000. Fewer than 10 percent of Iowa’s road miles are urban, while almost 55 percent of Maryland’s are urban. Texas has over 1,700 county and municipal law enforcement agencies, while Nevada has about 30.
Table 32 also illustrates how cultural and socioeconomic characteristics differ substantially across the 10 States. The proportion of residents classified as “white, not Hispanic” exceeds 90 percent in Iowa and West Virginia and is less than 50 percent in California and Texas. The proportion classified as black is almost 30 percent in Maryland and less than 2 percent in Oregon. The proportion over 65 years old ranges from about 10 percent in Texas to 15 percent in West Virginia. Median household incomes range from about $34,000 to $57,000. The proportion of adults over 25 who have bachelor’s degrees ranges from about 15 percent to 31 percent.
41

Table 32 provides data that the States reported to NHTSA from the 2007 Click It or Ticket May mobilization. Seat belt citations issued during the mobilization ranged from 0.5 per 1,000 population in Nevada to 4.1 in California.
Table 32 also lists each State’s 2007 seat belt law type (primary or secondary), citation costs (fine plus costs), observed seat belt use, its 2000 seat belt use, the seat belt use improvement from 2000 to 2007, and the unbelted conversion over this period. Citation costs range from a fine of $25 with no court costs in Maryland and West Virginia to over $100 in Minnesota, Oregon, and Washington. Unbelted conversion is the proportional reduction in the unbelted population; thus a 10-percentage-point increase in seat belt use from 60 percent to 70 percent reduces the unbelted population by one-quarter, or 25 percent, while a 10-percentage-point increase from 80 percent to 90 percent reduces the unbelted population by one-half, or 50 percent. All 10 States increased seat belt use substantially and all except Minnesota converted more than half of their unbelted populations from 2000 to June 2007. Minnesota passed this mark with its August 2007 seat belt use increase to 87.8 percent, which gives a conversion rate of 54 percent. Finally, 9 of the 10 States increased their already high observed seat belt use rate from 2006 to 2007, by an average of 1.4 percentage points, while seat belt use decreased in the remaining State by 0.3 percentage points. The 10 study States clearly have highly successful seat belt use programs.
Ten Effective State Seat Belt Programs
All 10 study State seat belt programs share five key characteristics: active year-round seat belt law enforcement highlighted by one or more high-visibility campaigns; strong relationships with State, county, and municipal law enforcement; effective and creative seat belt use publicity; a high priority for increasing seat belt use; and strong management that plans and implements a long-term seat belt use strategy. Within these, the States differ substantially in many respects. Table 33 summarizes a few of these features. This section summarizes similarities and differences in these characteristics across the 10 States. The individual reports in Appendix C describe each State’s program in some detail.
Enforcement. All 10 study States enforce their seat belt law on regular traffic patrols throughout the year. All States also conduct one or more high-visibility seat belt law enforcement campaigns annually to publicize and intensify this enforcement. Key features of each State’s campaign follow. See Table 33 for a brief summary and Appendix C for details.
• California conducts one statewide Click It or Ticket campaign in May.
• Iowa conducts two-week seat belt campaigns in May and September; one-week occupant protection campaigns in February, July, and November; and about five corridor campaigns at other times that include seat belts along with other priority traffic laws.
• Maryland uses a Chief’s Challenge promoting seat belt law enforcement for the full two months of April and May, without paid overtime.
• Michigan conducts a campaign in May using enforcement zones, continues enforcement zones at the county level throughout the summer, and includes seat belt law enforcement in an impaired driving campaign in September using saturation patrols.
42

• Minnesota conducts high-visibility campaigns in May and October under the Safe & Sober banner.
• Nevada conducts about a dozen multijurisdictional campaigns throughout the year, highlighted by statewide Click It or Ticket campaigns in May and November.
• Oregon conducts the “Three Flags” campaigns in cooperation with Washington and British Columbia, focusing on child occupant protection in February, seat belts in May, and seat belts, speed, and impaired driving in September.
• Texas conducts a campaign in May featuring both Click It or Ticket and Buckle Up in Your Truck.
• Washington conducts “Three Flags” campaigns in cooperation with Oregon and British Columbia focusing on child occupant protection in February, seat belts in May, and seat belts, speed, and impaired driving in September.
• West Virginia conducts one statewide Click It or Ticket campaign in May.
All study States except California conduct multijurisdictional activities involving some combination of municipal, county, and highway patrol officers. These sometimes extend across State borders in cooperation with adjoining States. Most States use saturation patrols in which many officers patrol a limited geographical area. A corridor patrol is similar to a saturation patrol conducted on one or two roads, sometimes for a substantial distance: Iowa conducts corridor patrols on the full length of highways crossing the State east-west or north-south. Several States use enforcement zones. These operate at fixed locations using a spotter who observes unbelted occupants and downstream officers who stop vehicles and issue citations. Several States use checkpoints.
In all study States, most municipal and county law enforcement agencies participate in one or more of the high-visibility enforcement campaigns. All study States except Maryland provide grants to some participating agencies to cover officer overtime and other campaign expenses. In some States, most participating agencies receive funding, while others have substantial participation by non-funded agencies. In Oregon, for example, “almost all agencies with traffic officers” participated in a “Three Flags” campaign in 2006. Oregon awarded grants to 72 municipal agencies out of 135 statewide, 27 county sheriffs out of 36, and about half of the Oregon State Police Area Commands. The State highway patrol is a leader in these high-visibility enforcement campaigns in almost all States. Some States encourage agency participation through awards or incentive programs and recognition banquets.
All study States have begun nighttime seat belt law enforcement during their high-visibility campaigns. A few States began nighttime activities in 2007, several are expanding their nighttime presence, and Washington conducted most of its 2007 campaign operations at night.
In secondary law States, officers on regular patrol, saturation patrols, or enforcement zones must observe another traffic violation before issuing a seat belt law citation. These requirements have not hindered high-visibility seat belt law enforcement in the three secondary law study States. Minnesota’s attitude is shared by all three: “If you’re not issuing seat belt citations, then everyone in your jurisdiction must be buckled up.”
43
Law enforcement relationships. All study States have excellent relations with law enforcement command and officers statewide, at all levels. These typically are both institutional relationships between the Highway Safety Office and law enforcement agencies and organizations and personal relationships between management and staff in the Highway Safety Office and individual agencies. These relationships have been developed over many years and involve many traffic safety program areas. They are key to law enforcement participation in seat belt law enforcement. All study State Highway Safety Offices work hard to continue these relationships, to involve law enforcement in planning seat belt law enforcement and publicity activities, and to thank and reward law enforcement for their efforts.
Publicity. All study States use extensive publicity to encourage seat belt use, advertise their seat belt use law, and advise motorists that unbuckled occupants can expect to be ticketed. But the States vary considerably on the messages and delivery mechanisms they use. Each State has quite creative media strategies, designed and implemented to take advantage of and be effective within the opportunities and constraints presented by the State’s media markets and cultural mix. All States have long-term communication goals and strategies that they review and adapt regularly as conditions change. Many States have worked with the same media specialists for many years.
All States except Oregon use paid media for their May campaign and perhaps one other statewide campaign. Seven States use the Click It or Ticket slogan; Michigan uses Buckle Up or Pay Up, Minnesota uses Safe & Sober, and Oregon uses various health and safety messages. California, Oregon, and Washington advertise their high seat belt law fines on road signs throughout the State. Michigan advertises its $65 fine on posters in locations frequented by people with lower seat belt use rates. Many States publicize major campaigns on Department of Transportation variable message signs. Some smaller States such as West Virginia produce different radio or television spots for local markets using local officers. Larger States typically use the same spots throughout the State; television spots and posters often include highway patrol, county, and municipal officers.
All States generate extensive earned media coverage of campaign events. Statewide campaign kickoffs or wrap-ups will attract statewide coverage while local press conferences or media events will be covered by local media.
All States have extensive seat belt communications through government, business, cultural, religious, educational, health, and other partners. These communications typically concentrate on health and safety messages. All States produce communication materials in languages with substantial representation in the State; California, for example, produces traffic safety material in 19 languages. Most States target low belt use groups such as young males or pickup truck drivers through message content and placement.
The following sample only hints at the variety of creative communication strategies and delivery mechanisms discussed in more detail in the individual State reports.
• California: commercial variable message signs, Internet, El Protector.
• Iowa: outdoor, movie theatres, 325 rural weekly newspapers.
44

• Maryland: Buckle Up Religiously, “donut” TV spots for local markets.
• Michigan: “50 bottles of pop or 1 seat belt ticket” posters in convenience stores.
• Minnesota: gas pump toppers, hunting and fishing season events.
• Nevada: Joining Forces earned media coverage every month.
• Oregon: health and safety messages such as “Life is good; buckle up.”
• Texas: May campaign kickoff events using visuals such as a giant seat belt wrapped around the Capitol or the Alamo.
• Washington: $101 seat belt ticket publicized on 650 road signs (now increased to $112).
• West Virginia: “donut” TV spots for localized cable distribution.
Priority, planning, and research. All 10 study States, both those with primary and secondary seat belt use laws, have made increasing seat belt use a high priority. It’s been a priority for many years in some States, such as California and Minnesota, while the priority has been more recent in others, such as Nevada and West Virginia. Maryland, Michigan, and Washington used the change from a secondary to a primary law to boost the priority of seat belt use. Some States, such as Minnesota and Washington, include seat belt use as a key priority in their Strategic Highway Safety Plans.
All 10 States have a long-term commitment to increase seat belt use. Many have explicit goals either for observed seat belt use or for occupant fatalities. Some have ambitious overall highway safety plans and goals in which increased seat belt use is a prominent strategy. All States emphasize continuous seat belt law enforcement, integrated into every officer’s daily patrol activities, with effective and creative publicity.
All States use data and research on seat belt use to develop, refine, and evaluate their programs. Most States have conducted seat belt use surveys for over 10 or 15 years, usually through the same organization, to provide consistent and long-term data on seat belt use levels and patterns. Several States conduct regular telephone surveys that include questions relevant to seat belt use knowledge, habits, publicity, and programs. States use these data to identify groups with lower seat belt use and to develop strategies to increase their seat belt use.
Management. Each State’s seat belt use program is managed by its Highway Safety Office, led by its Governor’s Representative or Coordinator (the generic term used in this report; the position may be administrator, chief, or director). All study States share several key management characteristics, as noted previously: high priority for increasing seat belt use, long-range strategic plans for achieving this, commitment to year-round seat belt law enforcement integrated into regular patrol activities, and excellent relations with law enforcement. As with enforcement and publicity, management structure varies across the States.
The Highway Safety Offices in the study States range in size from about 10 to about 35 full-time equivalent staff. Staffing differences may be misleading because activities conducted in-house by Highway Safety Office staff in some States are contracted out to individuals or organizations in others. These activities include law enforcement assistance through law enforcement liaisons,
45

public relations and communications development and delivery, data analysis and research, and community traffic safety program assistance. California manages its 270 mini-grants through a single contract with the University of California at Berkeley. West Virginia employs eight regional coordinators who manage all grants in their regions. Maryland provides assistance to its overall seat belt program through a contract with the Maryland Committee for Safety Belt Use.
Some States use funded or unfunded arrangements with other State government organizations in their seat belt program activities. As examples, Minnesota’s communications and public relations services are provided by staff in the Minnesota Department of Public Safety’s Office of Communications, funded by the Office of Traffic Safety. Public information officers in the three Nevada Highway Patrol district commands work closely with the Nevada Office of Traffic Safety on earned media for Nevada’s many Joining Forces enforcement campaigns. Oregon supports a full-time staff member in the Oregon police academy who incorporates traffic safety issues into law enforcement training. The Texas Traffic Safety Section works with a traffic safety specialist in each of the 25 Texas Department of Transportation’s District offices. Texas also receives substantial support from the NHTSA Region 6 office.
All study State Highway Safety Offices have experienced, dedicated, and highly professional staff; many have remarkably low turnover. A typical staff comment was that “It’s a good place to work.” This experience and stability provides a deep institutional memory for the State’s programs, institutions, and key individuals. Several offices have close personal contacts with command officers in almost all law enforcement agencies across the State. Several have similar personal contacts with key media outlets.
All 10 State Highway Safety Offices also have experienced and highly effective leaders as their Governor’s Representative or Coordinator. Within their SHSO, these leaders motivate and manage their staff to plan and implement effective seat belt use programs. They also work effectively with their State’s governor, other executive offices, and legislature to give traffic safety in general and seat belt use in particular the priority and resources needed to be effective.
46

Table 29. Seat Belt Use From Observations and FARS, Sorted by State
State NHTSA
Region 2005 Belt Use
Law 2005* % Belt Use
Observed 2005** % Belt Use
Observed 2006 % Belt Use FARS
2005 AK 10 S 78.4 83.2 58.1 AL 4 P 81.8 82.9 41.2 AR 6 S 68.3 69.3 33.4 AZ 9 S 94.2 78.9 42.9 CA 9 P 92.5 93.4 66.6 CO 8 S 79.2 80.3 43.8 CT 1 P 81.6 83.5 47.6 DC 3 P 88.8 85.4 36.8 DE 3 P 83.8 86.0 46.3 FL 4 S 73.9 80.7 42.2 GA 4 P 89.9 90.2 44.1 HI 9 P 95.3 92.5 54.0 IA 7 P 87.1 89.6 56.6 ID 10 S 76.0 79.8 43.0 IL 5 P 86.0 87.8 51.5 IN 5 P 81.2 84.3 48.9 KS 7 S 69.0 73.5 33.3 KY 4 S 66.7 67.2 34.6 LA 6 P 77.7 74.8 41.1 MA 1 S 64.8 66.9 33.2 MD 3 P 91.1 91.1 56.1 ME 1 S 75.8 77.2 43.1 MI 5 P 92.9 94.3 65.2 MN 5 S 83.9 83.3 47.2 MO 7 S 77.4 75.2 34.5 MS 4 S 60.8 73.6 27.3 MT 8 S 80.9 79.0 29.3 NC 4 P 86.7 88.5 52.9 ND 8 S 76.3 79.0 22.8 NE 7 S 79.2 76.0 33.0 NH 1 49.6 63.5 31.9 NJ 2 P 86.0 90.0 54.8 NM 6 P 89.5 89.6 52.6 NV 9 S 94.8 91.2 47.7 NY 2 P 85.0 83.0 59.5 OH 5 S 78.7 81.7 43.9 OK 6 P 83.1 83.7 41.1 OR 10 P 93.3 94.1 70.1 PA 3 S 83.3 86.3 37.9 RI 1 S 74.7 74.0 35.6 SC 4 S 69.7 72.5 32.3 SD 8 S 68.8 71.3 22.3 TN 4 P 74.4 78.6 39.3 TX 6 P 89.9 90.4 56.6 UT 8 S 86.9 88.6 50.3 VA 3 S 80.4 78.7 36.1 VT 1 S 84.7 82.4 43.2 WA 10 P 95.2 96.3 56.5 WI 5 S 73.3 75.4 39.3 WV 3 S 84.9 88.5 37.7 WY 8 S 70.1 63.5 30.9 median 81.6 82.9 43.0 study States in bold * P = Primary S = Secondary ** NH 2003, WY 2004 (NHTSA, 2007a)
47

Table 30. Seat Belt Use Sorted by Law Type and 2006 Observed Use
State NHTSA
Region 2005 Belt Use
Law 2005* % Belt Use
Observed 2005** % Belt Use
Observed 2006 % Belt Use FARS 2005
WA 10 P 95.2 96.3 56.5 MI 5 P 92.9 94.3 65.2 OR 10 P 93.3 94.1 70.1 CA 9 P 92.5 93.4 66.6 HI 9 P 95.3 92.5 54.0 MD 3 P 91.1 91.1 56.1 TX 6 P 89.9 90.4 56.6 GA 4 P 89.9 90.2 44.1 NJ 2 P 86.0 90.0 54.8 IA 7 P 87.1 89.6 56.6 NM 6 P 89.5 89.6 52.6 NC 4 P 86.7 88.5 52.9 IL 5 P 86.0 87.8 51.5 DE 3 P 83.8 86.0 46.3 DC 3 P 88.8 85.4 36.8 IN 5 P 81.2 84.3 48.9 OK 6 P 83.1 83.7 41.1 CT 1 P 81.6 83.5 47.6 NY 2 P 85.0 83.0 59.5 AL 4 P 81.8 82.9 41.2 TN 4 P 74.4 78.6 39.3 LA 6 P 77.7 74.8 41.1 NV 9 S 94.8 91.2 47.7 UT 8 S 86.9 88.6 50.3 WV 3 S 84.9 88.5 37.7 PA 3 S 83.3 86.3 37.9 MN 5 S 83.9 83.3 47.2 AK 10 S 78.4 83.2 58.1 VT 1 S 84.7 82.4 43.2 OH 5 S 78.7 81.7 43.9 FL 4 S 73.9 80.7 42.2 CO 8 S 79.2 80.3 43.8 ID 10 S 76.0 79.8 43.0 MT 8 S 80.9 79.0 29.3 ND 8 S 76.3 79.0 22.8 AZ 9 S 94.2 78.9 42.9 VA 3 S 80.4 78.7 36.1 ME 1 S 75.8 77.2 43.1 NE 7 S 79.2 76.0 33.0 WI 5 S 73.3 75.4 39.3 MO 7 S 77.4 75.2 34.5 RI 1 S 74.7 74.0 35.6 MS 4 S 60.8 73.6 27.3 KS 7 S 69.0 73.5 33.3 SC 4 S 69.7 72.5 32.3 SD 8 S 68.8 71.3 22.3 AR 6 S 68.3 69.3 33.4 KY 4 S 66.7 67.2 34.6 MA 1 S 64.8 66.9 33.2 WY 8 S 70.1 63.5 30.9 NH 1 49.6 63.5 31.9 median 81.6 82.9 43.0 study States in bold * P = Primary S = Secondary * * NH 2003, WY 2004 (NHTSA, 2007a)
48
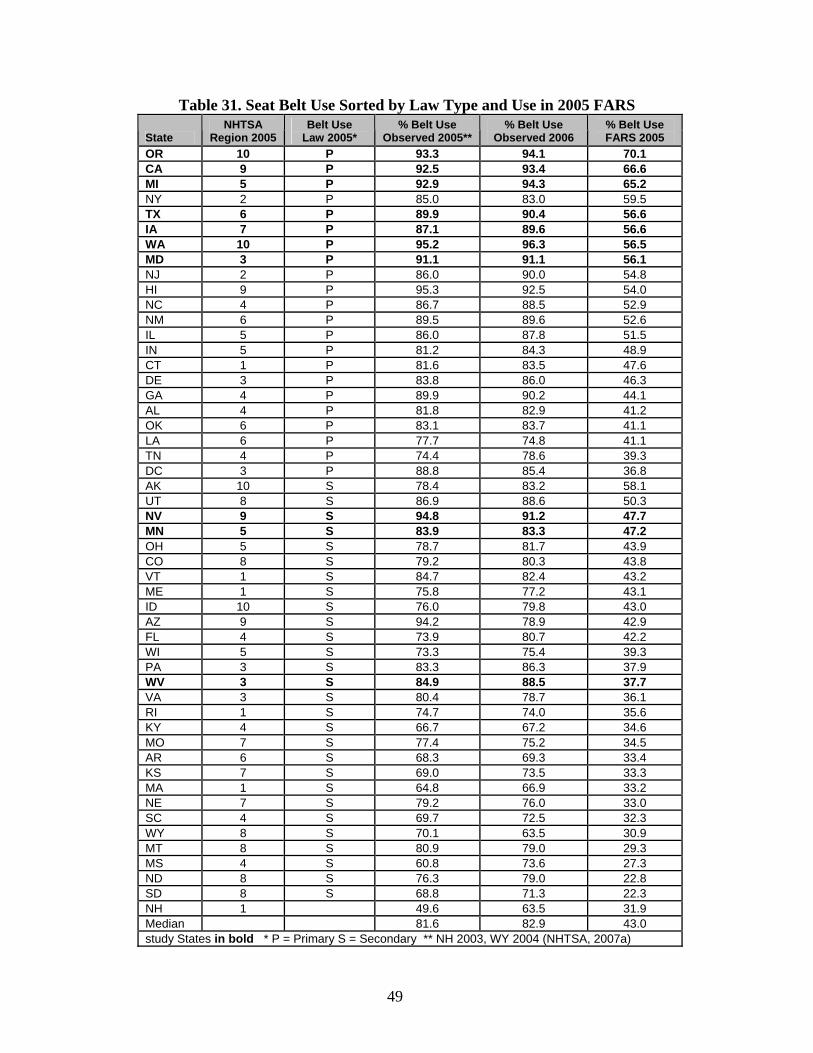
49
Table 31. Seat Belt Use Sorted by Law Type and Use in 2005 FARS
State NHTSA
Region 2005 Belt Use
Law 2005* % Belt Use
Observed 2005** % Belt Use
Observed 2006 % Belt Use FARS 2005
OR 10 P 93.3 94.1 70.1 CA 9 P 92.5 93.4 66.6 MI 5 P 92.9 94.3 65.2 NY 2 P 85.0 83.0 59.5 TX 6 P 89.9 90.4 56.6 IA 7 P 87.1 89.6 56.6 WA 10 P 95.2 96.3 56.5 MD 3 P 91.1 91.1 56.1 NJ 2 P 86.0 90.0 54.8 HI 9 P 95.3 92.5 54.0 NC 4 P 86.7 88.5 52.9 NM 6 P 89.5 89.6 52.6 IL 5 P 86.0 87.8 51.5 IN 5 P 81.2 84.3 48.9 CT 1 P 81.6 83.5 47.6 DE 3 P 83.8 86.0 46.3 GA 4 P 89.9 90.2 44.1 AL 4 P 81.8 82.9 41.2 OK 6 P 83.1 83.7 41.1 LA 6 P 77.7 74.8 41.1 TN 4 P 74.4 78.6 39.3 DC 3 P 88.8 85.4 36.8 AK 10 S 78.4 83.2 58.1 UT 8 S 86.9 88.6 50.3 NV 9 S 94.8 91.2 47.7 MN 5 S 83.9 83.3 47.2 OH 5 S 78.7 81.7 43.9 CO 8 S 79.2 80.3 43.8 VT 1 S 84.7 82.4 43.2 ME 1 S 75.8 77.2 43.1 ID 10 S 76.0 79.8 43.0 AZ 9 S 94.2 78.9 42.9 FL 4 S 73.9 80.7 42.2 WI 5 S 73.3 75.4 39.3 PA 3 S 83.3 86.3 37.9 WV 3 S 84.9 88.5 37.7 VA 3 S 80.4 78.7 36.1 RI 1 S 74.7 74.0 35.6 KY 4 S 66.7 67.2 34.6 MO 7 S 77.4 75.2 34.5 AR 6 S 68.3 69.3 33.4 KS 7 S 69.0 73.5 33.3 MA 1 S 64.8 66.9 33.2 NE 7 S 79.2 76.0 33.0 SC 4 S 69.7 72.5 32.3 WY 8 S 70.1 63.5 30.9 MT 8 S 80.9 79.0 29.3 MS 4 S 60.8 73.6 27.3 ND 8 S 76.3 79.0 22.8 SD 8 S 68.8 71.3 22.3 NH 1 49.6 63.5 31.9 Median 81.6 82.9 43.0 study States in bold * P = Primary S = Secondary ** NH 2003, WY 2004 (NHTSA, 2007a)

Table 32. Geographic, Demographic, CIOT, Seat Belt Law, and Seat Belt Use Data
State CA IA MD MI MN NV OR TX WA WV Population (2005) 36,132,000 2,966,000 5,600,000 10,121,000 5,133,000 2,415,000 3,641,000 22,860,000 6,288,000 1,817,000
Land area 163,696 56,272 12,407 96,716 86,939 110,561 98,381 268,581 71,300 24,230 Pop/sq mile 232 53 573 178 65 22 38 87 95 76
Counties 58 99 24 83 87 17 36 254 39 55 Cities over 1M 2 0 0 0 0 0 0 3 0 0 Cities 100K-1M 54 2 1 8 2 4 3 21 5 0 Cities 25-100K 163 15 6 37 24 2 9 44 16 5
Enforcement agencies ≈ 400 ≈ 400 ≈ 145 ≈ 600 ≈ 475 ≈ 30 ≈ 170 ≈ 1,700 ≈ 300 ≈ 245 Sworn officers 72,853 5,009 14,932 19,682 8,308 4,966 5,262 49,682 10,130 3,220
2005 census data % White not Hispanic 43.8% 91.5% 59.2% 77.9% 86.3% 60.0% 81.6% 49.2% 77.1% 94.4%
% Black 6.7% 2.3% 29.3% 14.3% 4.3% 7.7% 1.8% 11.7% 3.5% 3.2% % Asian 12.2% 1.4% 4.8% 2.2% 3.4% 5.7% 3.4% 3.3% 6.4% 0.6%
% Hispanic 35.2% 3.7% 5.7% 3.8% 3.6% 23.5% 9.9% 35.1% 8.8% 0.9% % age over 65 10.7% 14.7% 11.5% 12.4% 12.1% 11.3% 12.9% 9.9% 11.5% 15.3%
Median income $49,894 $42,865 $57,019 $44,409 $51,202 $47,231 $42,586 $41,645 $48,438 $33,993 % BA degree 26.6% 21.2% 31.4% 21.8% 27.4% 18.2% 25.1% 23.2% 27.7% 14.8%
2005 data Traffic fatalities 4,329 450 614 1,129 559 427 488 3,504 647 374 Drivers (000) 22,896 2,033 3,710 7,105 3,084 1,596 2,693 14,659 4,682 1,328
VMT (000,000) 329,267 31,060 56,319 104,052 56,904 20,776 35,282 235,170 55,476 20,523
Sources and notes
Population, land area: U.S. Census Bureau (2006), State and Metropolitan Area Data Book: 2006, Table A-1. www.census.gov/prod/2006pubs/smadb/smadb-06tablea.pdf.
Counties: U.S. Census Bureau (2007a), City and County Data Book www.census.gov/prod/2002pubs/00ccdb/cc00
City populations: U.S. Census Bureau (2007a), County and City Data Book, www.census.gov/prod/2002pubs/00ccdb/cc00_tabC1.pdf.
Enforcement agencies: County and municipal agencies excluding State highway patrol and special agencies such as college and university police; from interviews; totals approximate.
Sworn officers: Federal Bureau of Investigation, Crime in the United States 2005, Table 77. www.fbi.gov/ucr/05cius/data/table_77.html.
2005 census data: U.S. Census Bureau (2007b), State Quick Facts www.census.gov/ Median income for households; BA degrees for people over 25.
2005 traffic fatalities, drivers, VMT: NHTSA (2006), Traffic Safety Facts 2005. www-nrd.nhtsa.dot.gov/Pubs/TSF2005.PDF.
2005 road miles: FHWA (2006), Highway Statistics 2005, Table HM-20. www.fhwa.dot.gov/policy/ohim/hs05/.
CIOT 2007 data: NHTSA
2007 law status: P = primary enforcement, S = secondary enforcement.
Citation cost: fine plus court costs; court costs usually vary by jurisdiction.
2007 seat belt use: NHTSA.
Unbelted conversion: proportionate decrease in unbelted population from 2000 to 2007.
VMT/driver 14,381 15,278 15,180 14,645 18,451 13,018 13,101 16,043 11,849 15,454 Road miles 169,906 113,971 30,961 121,456 132,048 34,624 64,544 304,171 83,381 37,028
Percent urban 50.3% 9.8% 54.9% 29.2% 12.4% 20.0% 19.8% 27.4% 24.2% 11.3%
CIOT 2007 data Belt citations 146,957 2,362 7,806 18,572 9,385 1,317 3865 42,909 4,493 4,653
Citations / 1,000 pop 4.1 0.8 1.4 1.8 1.8 0.5 1.1 1.9 0.7 2.6
2007 belt law status P P P P S S P P P S Citation cost $80-91 $83-$88 $25 $65 $70-115 $25-67 $97 +costs $25 +costs $112 $25
2007 seat belt use 94.6% 91.3% 93.1% 94.0% 86.2% 92.2% 95.3% 91.6% 96.4% 89.7% 2000 seat belt use 88.9% 78.0% 85.0% 83.5% 73.4% 78.5% 83.6% 76.6% 81.6% 49.8%
Seat belt use gain 2007-2000 5.7 13.3 8.1 10.5 12.8 13.7 11.7 15.0 14.8 38.7 Unbelted conversion 54% 64% 48% 64% 71% 64% 80% 79%51% 60%
50

Table 33. Enforcement, Media, and Management CA IA MD MI MN NV OR TX WA WV
Enforcement
Mobilizations/year 1 May 5 belt/CSS 1 Apr-May 2 May, Sept 2 May, Fall 2 belt 3 Feb, May, 1 May 1 belt/CSS 1 May 5-6 corridor 10-12 other Sept 2 other
Highway patrol role major major major major major major major none major major Local participation high high high high high high high high high high Multijurisdictional no many many many many many many many many some Overtime funding yes yes no yes yes yes yes yes yes yes Incentives challenge,
grants grants
banquet, awards
challenge, awards
equipment, awards
banquet, awards
conference
agency awards
officer recognition
officer awards
Regular patrol plus Enforcement zones yes yes yes yes * Saturation patrols yes yes yes few * yes * yes yes yes Corridor patrols yes yes Checkpoints no yes few no no yes * no no no yes * Year-round 24/7 yes yes yes yes yes yes yes yes yes yes Nighttime some yes some some in 2007 some some no substantial demo Special programs 270
mini-grants Statewide corridors
Chief's Challenge
enforcement zones
Zero Death strategies
Joining Forces
3 Flags
Buckle Up in Truck
3 Flags
WV Lifesaver
Media Paid yes, no TV yes yes yes yes yes no yes yes yes Message CIOT
CIOT
CIOT
Buckle Up or Pay Up
Safe & Sober
CIOT
health and safety
CIOT
CIOT
CIOT
Localized paid radio/TV no no yes no no no no no yes yes Distinctive methods fine cost on outdoor, local radio, targeted sports, earned health and extensive fine cost on outdoor, road signs, movies, TV spots posters hunters, event each safety partners road signs variable internet,
variable weekly
newspaper pump
toppers month
no paid media
signs, yard signs
signs Management SHSO size ** ≈ 35 ≈ 11 ≈ 20 ≈ 25 ≈ 20 ≈ 12 ≈ 24 ≈ 13 ≈ 20 ≈ 10 Key features mini-grants
Statewide corridors
Chief's Challenge
enforcement zones
Zero Death strategies
Joining Forces
3 Flags
Buckle Up in Truck
3 Flags, Target Zero
WV Lifesaver
* secondary law State; seat belt citations can be issued when enforcing speed, DWI, and other laws ** approximate number of full-time equivalent staff, excluding contract assistance
51

VII. DISCUSSION AND RECOMMENDATIONS
STATISTICAL ANALYSES
The statistical analyses documented once again the very strong association between having a primary law and achieving higher seat belt use. Also, all six States that changed from a secondary to a primary law during the period 2000 to 2004 observed an immediate increase in seat belt use in fatal crashes.
The statistical analyses also provided useful information on two key seat belt program components; enforcement and publicity. Greater enforcement, as measured by CIOT citations, is associated with higher seat belt use, though it also is associated with a primary seat belt law. Regardless of the mechanism, strong enforcement is important. Paid media data showed a different result. Low belt use States spent just as much for media as the high belt use States. The implication of these findings is clear. High-visibility enforcement is key. Both primary and secondary law States can deliver the visibility. Primary law States can deliver the enforcement easily, while enforcement is more difficult for secondary law States. The case studies show how three secondary law States have overcome this obstacle.
SURVEYS
In the Spring 2007 CIOT Survey, most self-reported demographics did not differ between respondents in high and low belt use States. These demographics, most of which are related to seat belt use, include the respondent’s sex, education, ethnicity, and vehicle type. (Age did vary and so was controlled for in further analyses.) Beliefs about the value of seat belts also did not vary, including agreement with the statement that respondents would want to be belted if they were in a crash. However, respondents from high-use States more often agreed that seat belt law enforcement was important and that their personal risk of getting a ticket was high. Respondents from low belt use States reported a significantly lower perceived risk of getting a ticket.
In summary, both the statistical analyses and the survey findings suggest that the most important difference between the high and low belt use States is enforcement, not demographic characteristics, knowledge and beliefs about belt use, or dollars spent on media. Both the high and the low belt use States conducted CIOT enforcement campaigns. But enforcement was much more vigorous in the high belt use States, as shown by an average of twice as many belt law citations per capita during the campaign in the high belt use States. While it is possible to achieve high seat belt use with a secondary law, it is more difficult and, as discussed in the case studies, requires some effort and a secondary law that is straightforward to enforce.
CASE STUDIES OF HIGH BELT USE STATES
Each of the 10 case study States understands that its ultimate goal is for seat belt use to be completely normal and habitual, something every driver and passenger does on every trip without thinking. They also understand that the best way to accomplish this is for seat belt law
52
enforcement to be equally normal and habitual for all patrol officers – enforcement on all patrols, 24 hours each day, 7 days each week – with appropriate publicity to back up this enforcement. Finally, they understand what is necessary to reach this goal: high priority, strong management, active high-visibility enforcement, close law enforcement relations, and effective publicity for seat belts and for seat belt law enforcement. They differ in how they do it, in the specific activities and strategies they employ in each of these five areas. The differences reflect the various States’ geography, traffic laws, law enforcement organization and practices, media market structure, resources, social culture, and all the other features that make each State unique. The best way for a State to reach the common goal is to address each of the five key elements – priority, management, enforcement, relationships, and publicity – with methods that best fit its own resources and situation.
These conclusions and the other information obtained from the study States have several important consequences.
1) Management is crucial. Good Highway Safety Office management sets priorities and goals, allocates resources, establishes and sticks with long-term plans, designs and implements specific programs and activities to achieve these plans, establishes and maintains relations with law enforcement and many other partners, evaluates progress, and alters plans and activities as needed. Good management thinks and plans for the long term and the big picture. Good management works effectively with State officials and the legislature to give traffic safety the priority and resources needed to be effective. Without good management, highway safety programs too frequently are short term and small focus, accomplishing little.
2) There’s no simple high-visibility enforcement formula. Each State uses high-visibility enforcement, but the wide diversity of their high-visibility enforcement and publicity strategies demonstrates that many paths can lead to the same destination. Seat belt law mobilizations are useful, but some high belt use States conduct one each year while others conduct more than 10, and many States with low seat belt use also conduct mobilizations. A primary seat belt law is useful, but the three secondary law study States all had seat belt use above 87 percent in 2007 while several primary law States that were not studied had seat belt use below 80 percent. Some study States use checkpoints while others do not; some use enforcement zones while others do not. Each State should adopt the best-fitting mix of activities.
3) Plan for the long term. Not wearing a seat belt is a habit, and habits are hard to change. As seat belt use exceeds 90 percent, the remaining nonusers may well be increasingly resistant to change. Persistence is rewarded, as the study States have shown.
4) The goal is 100 percent seat belt use. Hawaii, Oregon, and Washington all had 2007 observed seat belt use rates over 95 percent while California and Michigan were very close to this level. It may be increasingly difficult to change the behavior of the remaining nonusers but it’s not impossible. The goal should be no unbelted occupants, in much the same sense that Minnesota and Washington have adopted long-term strategic plans with a goal of no highway deaths.
53

RECOMMENDATIONS
Based on these findings, States wishing to increase their seat belt use should consider the following actions.
1) Make seat belt use a high priority within the State and within the Highway Safety Office.
2) Set seat belt use goals and establish long-range plans to achieve these goals based on the State’s unbelted population, laws, law enforcement community, and other characteristics.
3) Provide adequate resources.
4) Upgrade secondary to primary enforcement laws.
5) Use high-visibility enforcement in the way that best fits the State’s resources and characteristics.
6) Strive for two ultimate goals: 100-percent seat belt use and 100-percent enforcement. All drivers and occupants will be buckled up all the time; all officers will enforce the State’s seat belt laws 24/7, on all patrols.
54
REFERENCES
Centers for Disease Control and Prevention. National Diabetes Surveillance System. www.cdc.gov/diabetes/statistics/prev/state/
Federal Bureau of Investigation. Crime in the United States, 2005. www.fbi.gov/ucr/05cius/index.html
FHWA. (2006). Highway Statistics 2005. Washington, DC: Federal Highway Administration. www.fhwa.dot.gov/policy/ohim/hs05/
Glassbrenner, D., & Ye, T. J. (2007). Traffic Safety Facts: Seat Belt Use in 2007 - Overall results. DOT HS 810 841. Washington, DC: National Highway Traffic Safety Administration.
IIHS. (2008). Safety belt use laws. Arlington, VA: Insurance Institute for Highway Safety. http://www.iihs.org/laws/SafetyBeltUse.aspx (accessed 2/13/2008).
National Climatic Data Center. (2007). Historical Climatography Series 4-3. www.ncdc.noaa.gov/oa/climate/normals/usnormals.html
NHTSA. (2001a). Keeping It Clicking in California: A Case Study of Sustained Success with a High Seat Belt Use Rate. Washington, DC: National Highway Traffic Safety Administration.
NHTSA. (2001b). Making It Click in Michigan: A Case Study of a Successful Campaign to Raise the Seat Belt Use Rate. Washington, DC: National Highway Traffic Safety Administration.
NHTSA. (2001c). Buckle Up Texas: A Case Study of Strong Partnerships that Raised the Seat Belt use Rate. Washington, DC: National Highway Traffic Safety Administration.
NHTSA. (2005). Traffic Safety Facts: Safety Belt Use in 2005 - Use Rates in the States and Territories. (2005). DOT HS 809970. Washington, DC: National Highway Traffic Safety Administration.
NHTSA. (2006). Traffic Safety Facts 2005. DOT HS 810 631. Washington, DC: National Highway Traffic Safety Administration.
NHTSA. (2007a). Traffic Safety Facts: Seat Belt Use in 2006 – Use Rates in the States and Territories. DOT HS 810 690. Washington, DC: National Highway Traffic Safety Administration.
NHTSA. (2007b). Traffic Safety Facts: Occupant Protection, 2006 Data. DOT HS 810 807. Washington, DC: National Highway Traffic Safety Administration.
55

NHTSA. (2007c). Summary of Vehicle Occupant Protection Laws, Eighth Edition. DOT HS 810 825. Washington, DC: National Highway Traffic Safety Administration.
NHTSA. (2007d). Data supplied by NHTSA.
NHTSA. (2008). Countermeasures That Work, Third Edition. DOT HS 810 891. Washington, DC: National Highway Traffic Safety Administration.
Nichols, J.L., & Ledingham, K.A. (2008). The Impact of legislation, enforcement, and sanctions on safety belt use. NCHRP Report 601. Washington, DC: Transportation Research Board.
O’Neill, B. (2001). Seat belt use: Where we’ve been, where we are, and what’s next. In ACTS (2001), 2001 Seat Belt Summit. Arlington, VA: Automotive Coalition for Traffic Safety.
Parada, M.A, Cohn, L.D., Gonzales, E., et al. (2001). The validity of self-reported seatbelt use: Hispanic and non-Hispanic drivers in El Paso. Accident Analysis and Prevention 33, 139-143.
Salzberg, P.M., & Moffat, J.M. (2004). Ninety-five percent: An evaluation of law, policy, and programs to promote seat belt use in Washington State. Journal of Safety Research 35, 215-222.
Shinar, D. (2007). Traffic Safety and Human Behavior. Oxford: Elsevier.
Shinar, D. (1993). Demographic and socioeconomic correlates of safety belt use. Accident Analysis and Prevention 25, 745-755.
Shults, R.A., Nichols, J.L., Dinh-Zarr, T.B., et al. (2004). Effectiveness of primary enforcement safety belt laws and enhanced enforcement of safety belt laws: A summary of the Guide to Community Preventive Services Systematic Reviews. Journal of Safety Research 35, 189-196.
U.S. Census Bureau. (2005). Density Using Land Area For States, Counties, Metropolitan Areas, and Places: 2000. www.census.gov./population/www/censusdata/density.html
U.S. Census Bureau. (2006). State and Metropolitan Area Data Book: 2006. www.census.gov/compendia/smadb/SMADBstate.html#pop
56

U.S. Census Bureau. (2007a). County and City Data Book: 2007. www.census.gov/prod/www/abs/ccdb07.html
U.S. Census Bureau. (2007b). State & County QuickFacts. quickfacts.census.gov/qfd/index.html
U.S. Census Bureau. (2007c). Population Estimates. www.census.gov/popest/estimates.php
Wells, J.K., Williams, A.F., & Farmer, C.M. (2002). Seat belt use among African Americans, Hispanics, and Whites. Accident Analysis and Prevention, 34, 523-529.
57

Appendix A. State Seat Belt Use Laws
Appendix A. State Seat Belt Use Laws Key Provisions for Adults as of January 1, 2008
A-1

Appendix A. State Seat Belt Use Laws
State Seat Belt Use Laws – Key Provisions for Adults as of January 1, 2008
State 2005 Use Rate
Initial Effective
Date
Law Type (Upgrade
Date) Fine * Points Coverage:
Persons Seats Vehicles Exempted
AL 81.8% 07.18.91 Primary (12.09.99) $25 n/a
Ages 6+ except medical reason or newspaper/mail delivery
Front
Vehicles for > 10 passengers, model year < 1965, vehicles driving in reverse
AK 78.4% 09.12.90 Primary (05.01.06) $15 n/a
All except medical reason or newspaper/mail delivery
All School buses, vehicles with no safety belts, emergency vehicles
AZ 94.2% 01.01.91 Secondary $10 n/a
All in front seat & ages 5-15 in rear, except medical reason or mail delivery
Front Vehicles for > 10 passengers, model year < 1972
AR 68.3% 07.15.91 Secondary $25 n/a All except medical reason or rural mail delivery
Front School, church, & public buses; model year <1968
CA 92.5% 01.01.86 Primary (01.01.93) $20 n/a
All except medical reason, newspaper/rural mail delivery, waste/recycling collection
All Emergency vehicles
CO 79.2% 07.01.87 Secondary $15 n/a
All except medical reason, delivery/pickup services; primary law if driver < 18
Front
Buses, ambulances, farm tractors, husbandry vehicles, vehicles not required to have belts
CT 81.6% 01.01.86 Primary $15 n/a
All in front seat and 4-16 in rear, except if medical reason or delivery service
Front Vehicles > 10,000 lbs, public vehicles, emergency vehicles
DE 83.8% 01.01.92 Primary (06.30.03) $25 n/a All except medical
reason, mail delivery All Tractors, off-road vehicles
DC 88.8% 12.12.85 Primary (10.01.97) $50 2 All except medical
reason All
Taxis, vehicles for >8 passengers, farm vehicles, model year < 1966
FL 73.9% 07.01.86 Secondary $30 n/a
All in front seat and 6-17 in rear, except medical reason or newspaper delivery
Front
Living space of RVs, school & public buses, farm tractors, trash trucks, trucks > 5,000 lbs.
GA 89.9% 09.01.88 Primary (07.01.96) $15 n/a
All in front seat, and 6-17 in rear, except medical reason or newspaper/rural mail delivery
Front
Pickup trucks, off-road vehicles, vehicles for > 10 passengers, emergency vehicles, vehicles making frequent stops, vehicles in reverse, model year < 1965
A-2

Appendix A. State Seat Belt Use Laws
State 2005 Use Rate
Initial Effective
Date
Law Type (Upgrade
Date) Fine * Points Coverage:
Persons Seats Vehicles Exempted
HI 95.3% 12.16.85 Primary $45 n/a All in front seat and 4-17 in rear, except medical reason
Front
Taxis, buses & school buses > 10,000 lbs, emergency vehicles, vehicles not required to have belts
ID 76.0% 07.01.86 Secondary $10 n/a
All, except if medical reason, all belts used, or mail delivery
All Vehicles > 8,000 lbs, emergency vehicles, husbandry vehicles
IL 86.0% 01.01.88 Primary (07.03.03) $25 n/a
All in front seat and 8-15 in rear, except medical reason or rural mail delivery
Front
Emergency vehicles, vehicles not required to have belts, vehicles in reverse
IN 81.2% 07.01.87 Primary (07.01.98) $25 n/a
All in front seat and 4-11 in rear, except medical reason or delivery service
All
Pickup trucks, buses, trucks, tractors, RVs, SUVs registered as pickup trucks
IA 87.1% 07.01.86 Primary $25 n/a
All in front seat and under 11 in rear, except medical reason, delivery service, or bus passenger
Front Emergency vehicles
KS 69.0% 07.01.86 Secondary $10 n/a
All in front seat and 4-14 in rear, except medical reason or newspaper/mail delivery
Front
Farm vehicles > 16,000 lbs, vehicles for > 10 people, trucks > 12,000 lbs, off-road vehicles
KY 66.7% 07.15.94 Primary (07.20.06) $25 n/a
All except medical reason or mail delivery
All
Farm vehicles > 2,000 lbs, vehicles for > 10 people, trucks > 12,000 lbs, model year < 1965
LA 77.7% 07.01.86 Primary (09.01.95) $25 n/a
All in front seat and 6-12 in rear, except medical reason or mail delivery
Front
Farm vehicles within 5 miles of farm, model year < 1981, vehicles for > 10 people
ME 75.8% 12.26.95 Primary (09.20.07) $50 n/a
All except medical reason or rural mail delivery
All Taxis, vehicles manufactured without belts
MD 91.1% 07.01.86 Primary (10.01.97) $25 n/a
All except medical reason or mail delivery
Front outboard
Taxis, vanpools, hearses, farm vehicles within 10 miles of farm, antique vehicles, emergency vehicles
MA 64.8% 02.01.94 Secondary $25 n/a All except medical reason or rural mail delivery
All
Taxis, buses, tractors, livery vehicles, trucks > 18,000 lbs, emergency vehicles
MI 92.9% 07.01.85 Primary (04.01.00) $25 n/a
All in front seat and 4-15 in rear, except medical reason or delivery service
Front
School buses, model year < 1965, vehicles not required to have belts
A-3
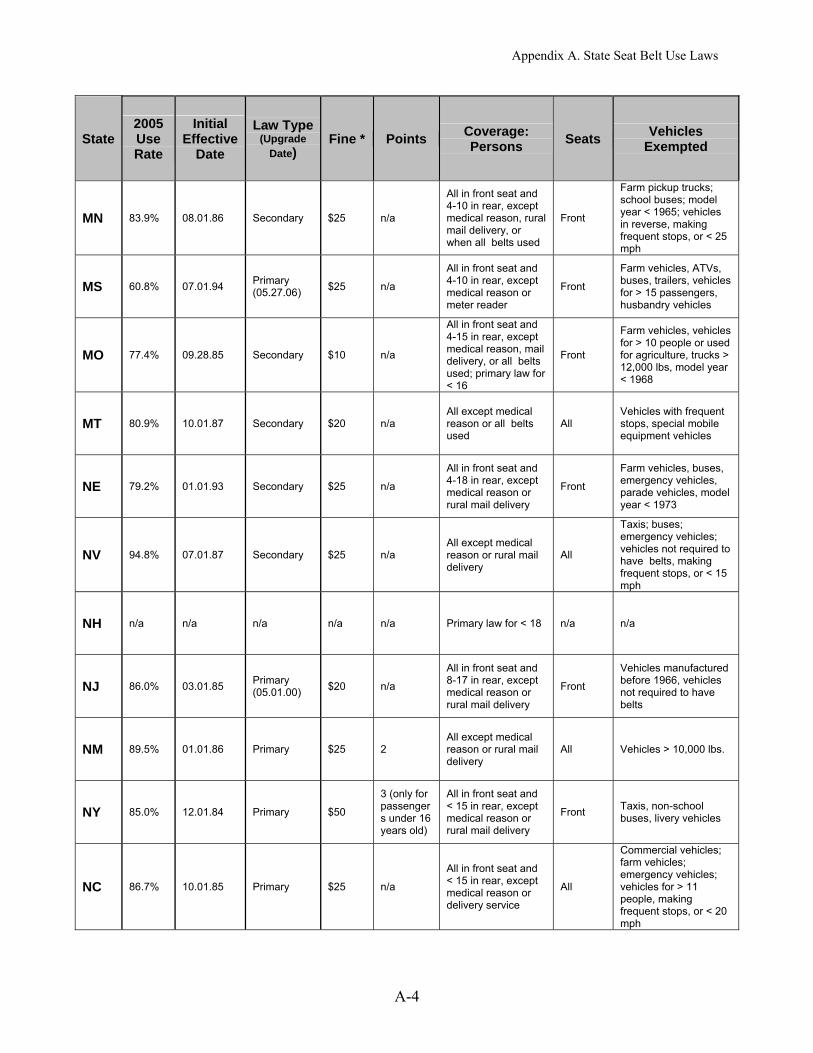
Appendix A. State Seat Belt Use Laws
State 2005 Use Rate
Initial Effective
Date
Law Type (Upgrade
Date) Fine * Points Coverage:
Persons Seats Vehicles Exempted
MN 83.9% 08.01.86 Secondary $25 n/a
All in front seat and 4-10 in rear, except medical reason, rural mail delivery, or when all belts used
Front
Farm pickup trucks; school buses; model year < 1965; vehicles in reverse, making frequent stops, or < 25 mph
MS 60.8% 07.01.94 Primary (05.27.06) $25 n/a
All in front seat and 4-10 in rear, except medical reason or meter reader
Front
Farm vehicles, ATVs, buses, trailers, vehicles for > 15 passengers, husbandry vehicles
MO 77.4% 09.28.85 Secondary $10 n/a
All in front seat and 4-15 in rear, except medical reason, mail delivery, or all belts used; primary law for < 16
Front
Farm vehicles, vehicles for > 10 people or used for agriculture, trucks > 12,000 lbs, model year < 1968
MT 80.9% 10.01.87 Secondary $20 n/a All except medical reason or all belts used
All Vehicles with frequent stops, special mobile equipment vehicles
NE 79.2% 01.01.93 Secondary $25 n/a
All in front seat and 4-18 in rear, except medical reason or rural mail delivery
Front
Farm vehicles, buses, emergency vehicles, parade vehicles, model year < 1973
NV 94.8% 07.01.87 Secondary $25 n/a All except medical reason or rural mail delivery
All
Taxis; buses; emergency vehicles; vehicles not required to have belts, making frequent stops, or < 15 mph
NH n/a n/a n/a n/a n/a Primary law for < 18 n/a n/a
NJ 86.0% 03.01.85 Primary (05.01.00) $20 n/a
All in front seat and 8-17 in rear, except medical reason or rural mail delivery
Front
Vehicles manufactured before 1966, vehicles not required to have belts
NM 89.5% 01.01.86 Primary $25 2 All except medical reason or rural mail delivery
All Vehicles > 10,000 lbs.
NY 85.0% 12.01.84 Primary $50
3 (only for passenger s under 16 years old)
All in front seat and < 15 in rear, except medical reason or rural mail delivery
Front Taxis, non-school buses, livery vehicles
NC 86.7% 10.01.85 Primary $25 n/a
All in front seat and < 15 in rear, except medical reason or delivery service
All
Commercial vehicles; farm vehicles; emergency vehicles; vehicles for > 11 people, making frequent stops, or < 20 mph
A-4
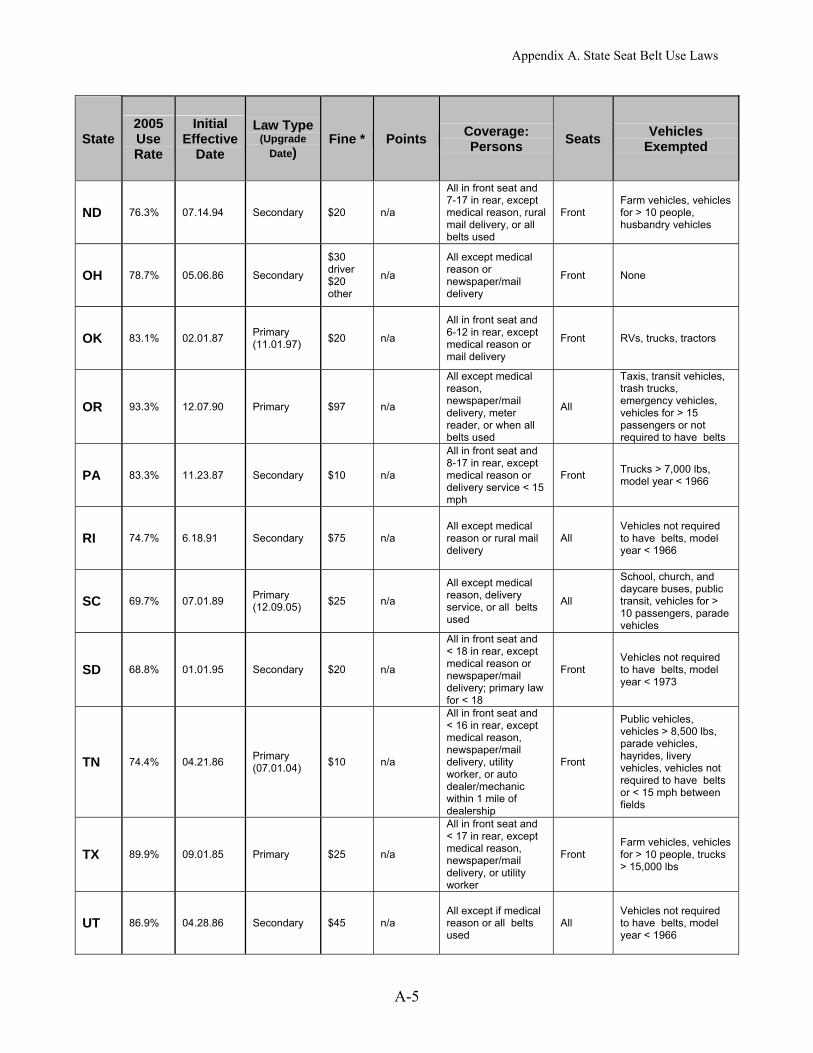
Appendix A. State Seat Belt Use Laws
State 2005 Use Rate
Initial Effective
Date
Law Type (Upgrade
Date) Fine * Points Coverage:
Persons Seats Vehicles Exempted
ND 76.3% 07.14.94 Secondary $20 n/a
All in front seat and 7-17 in rear, except medical reason, rural mail delivery, or all belts used
Front Farm vehicles, vehicles for > 10 people, husbandry vehicles
OH 78.7% 05.06.86 Secondary
$30 driver $20 other
n/a
All except medical reason or newspaper/mail delivery
Front None
OK 83.1% 02.01.87 Primary (11.01.97) $20 n/a
All in front seat and 6-12 in rear, except medical reason or mail delivery
Front RVs, trucks, tractors
OR 93.3% 12.07.90 Primary $97 n/a
All except medical reason, newspaper/mail delivery, meter reader, or when all belts used
All
Taxis, transit vehicles, trash trucks, emergency vehicles, vehicles for > 15 passengers or not required to have belts
PA 83.3% 11.23.87 Secondary $10 n/a
All in front seat and 8-17 in rear, except medical reason or delivery service < 15 mph
Front Trucks > 7,000 lbs, model year < 1966
RI 74.7% 6.18.91 Secondary $75 n/a All except medical reason or rural mail delivery
All Vehicles not required to have belts, model year < 1966
SC 69.7% 07.01.89 Primary (12.09.05) $25 n/a
All except medical reason, delivery service, or all belts used
All
School, church, and daycare buses, public transit, vehicles for > 10 passengers, parade vehicles
SD 68.8% 01.01.95 Secondary $20 n/a
All in front seat and < 18 in rear, except medical reason or newspaper/mail delivery; primary law for < 18
Front Vehicles not required to have belts, model year < 1973
TN 74.4% 04.21.86 Primary (07.01.04) $10 n/a
All in front seat and < 16 in rear, except medical reason, newspaper/mail delivery, utility worker, or auto dealer/mechanic within 1 mile of dealership
Front
Public vehicles, vehicles > 8,500 lbs, parade vehicles, hayrides, livery vehicles, vehicles not required to have belts or < 15 mph between fields
TX 89.9% 09.01.85 Primary $25 n/a
All in front seat and < 17 in rear, except medical reason, newspaper/mail delivery, or utility worker
Front Farm vehicles, vehicles for > 10 people, trucks > 15,000 lbs
UT 86.9% 04.28.86 Secondary $45 n/a All except if medical reason or all belts used
All Vehicles not required to have belts, model year < 1966
A-5

Appendix A. State Seat Belt Use Laws
State 2005 Use Rate
Initial Effective
Date
Law Type (Upgrade
Date) Fine * Points Coverage:
Persons Seats Vehicles Exempted
VT 84.7% 01.01.94 Secondary $25 n/a
All except if medical reason, rural mail delivery, or delivery < 15 mph
All Taxis, buses, farm tractors, emergency vehicles
VA 80.4% 01.01.88 Secondary $25 n/a
All in front seat and < 16 in rear, except medical reason, newspaper/rural mail delivery, meter reader, or parking enforcement
Front
Taxis, police vehicles, vehicles for > 10 passengers, municipal and delivery vehicles with frequent stops
WA 95.2% 06.11.86 Primary (07.01.02) $112 n/a
All except medical reason or all belts used
All
Farm vehicles, construction vehicles, vehicles for > 10 passengers, commercial vehicles with frequent stops
WV 84.9% 09.01.93 Secondary $25 n/a
All in front seat and < 17 in rear, except medical reason or rural mail delivery
Front Vehicles for > 10 passengers
WI 73.3% 12.01.87 Secondary $10 n/a
All in front seat and 4-15 in rear, except medical reason, newspaper/rural mail delivery, or land surveyor
All
Taxis, farm trucks, emergency vehicles, vehicles with frequent stops or not required to have belts
WY n/a 06.08.89 Secondary
$25 driver $10 other
n/a
All except medical reason, mail delivery, or all belts used
All Buses, emergency vehicles
A-6

Appendix B. State Seat Belt Funding Sources
Appendix B. State Seat Belt Funding Sources
B-1

Appendix B. State Seat Belt Funding Sources
State Seat Belt Funding Sources FY 2005
State Section
157 Safety Belt Use
Innovative
Section 157 Safety Belt
Use Incentive
Section 163 .08
BAC
Section 163 SES
Enforcement
Section 164 Repeat
Offender Transfer
Section 402 Formula
Section 405
Occupant Protection
Section 410
Impaired Driving
Section 154 Open
Container Transfer
Total Available in
FY 2005
AL $380,000 $0 $1,262,376 $0 $0 $2,610,624 $581,158 $0 $0 $4,834,158
AK $341,670 $147,514 $371, 756 $250,000 $4,384,865 $768,800 $167,282 $0 $4,384,864 $10,816,751
AZ $300,000 $1,947,054 $1,225,420 $250,000 $0 $2,534,198 $0 $631,474 $0 $6,888,146
AR $730,000 $0 $946,518 $0 $0 $1,957,422 $0 $522,215 $7,334,794 $11,490,949
CA $3,100,000 $10,932,321 $7,145,574 $1,134,904 $47,605,169 $14,777,233 $3,222,520 $4,653,696 $0 $92,571,417
CO $540,000 $632,575 $1,200,682 $0 $0 $2,483,039 $0 $666,016 $7,830,631 $13,352,943
CT $300,000 $0 $736,597 $0 $0 $1,523,300 $359,381 $455,831 $5,628,184 $9,003,293
DE $315,000 $106,815 $371,756 $0 $0 $768,800 $167,282 $212,177 $2,302,153 $4,243,983
DC $250,000 $166,280 $371,756 $0 $0 $768,800 $167,282 $0 $0 $1,724,118
FL $2,708,800 $0 $3,553,058 $562,562 $0 $7,347,812 $1,482,327 $1,880,327 $0 $17,535,023
GA $1,180,000 $1,926,784 $2,066,415 $327,985 $0 $4,273,398 $853,321 $2,164,669 $0 $12,792,572
HI $250,000 $365,102 $371,756 $0 $0 $768,800 $167,282 $241,575 $0 $2,164,515
ID $435,000 $290,039 $454,686 $0 $0 $940,302 $0 $316,940 $0 $2,436,967
IL $1,600,000 $2,807,827 $2,963,033 $0 $0 $6,127,626 $1,385,037 $1,756,752 $0 $16,640,275
IN $500,000 $1,712,125 $1,570,960 $0 $0 $3,248,783 $725,265 $1,047,367 $14,158,892 $22,963,392
IA $250,000 $663,059 $1,061,466 $0 $0 $2,195,137 $498,806 $632,675 $0 5,301,143
KS $275,000 $93,988 $1,113,206 $0 $0 $2,302,137 $0 $0 $0 $3,784,331
KY $1,130,000 $464,474 $1,107,706 $0 $0 $2,290,764 $505,276 $685,279 $0 $6,183,499
LA $525,000 $912,162 $1,116,023 $250,000 $7,623,313 $2,307,963 $530,526 $626,292 $7,623,313 $21,514,592
ME $533,000 $0 $371,756 $0 $0 $768,800 $167,282 $0 $0 $1,840,838
MD $450,000 $1,751,477 $1,136,107 $0 $0 $2,349,497 $522,468 $0 $0 $6,209,549
MA $587,000 $1,231,577 $1,356,527 $0 $7,423,771 $2,805,331 $643,927 $0 $0 $14,048,133
MI $1,100,000 $1,612,515 $2,422,177 $0 $0 $5,009,121 $1,138,331 $1,643,882 $0 $12,926,026
MN $1,100,000 $0 $1,519,676 $0 $8,526,232 $3,142,727 $0 $995,503 $0 $15,284,138
MS $280,000 $15,995 $869,036 $250,000 $0 $1,797,188 $0 $469,961 $6,956,802 $10,638,982
MO $350,000 $859,507 $1,623,724 $256,742 $0 $3,357,902 $0 $945,046 $12,483,564 $19,876,495
MT $400,000 $40,065 $482,011 $250,000 $0 $996,811 $219,486 $0 $5,705,183 $8,093,556
NE $320,000 $427,101 $741,169 $0 $0 $1,532,756 $342,258 $434,113 $0 $3,797,397
B-1

Appendix B. State Seat Belt Funding Sources
State Section
157 Safety Belt Use
Innovative
Section 157 Safety Belt
Use Incentive
Section 163 .08
BAC
Section 163 SES
Enforcement
Section 164 Repeat
Offender Transfer
Section 402 Formula
Section 405
Occupant Protection
Section 410
Impaired Driving
Section 154 Open
Container Transfer
Total Available in
FY 2005
NV $310,000 $0 $529,244 $0 $0 $1,094,489 $0 $245,583 $0 $2,179,316
NH $0 $0 $371,756 $0 $0 $768,800 $0 $197,478 $0 $1,338,034
NJ $825,000 $303,896 $1,760,864 $0 $0 $3,641,510 $819,429 $0 $0 $7,350,699
NM $420,000 $456,318 $630,126 $250,000 $6,163,754 $1,303,116 $271,743 $0 $0 9,495,057
NY $850,000 $2,728,567 $4,084,750 $0 $0 $8,447,363 $1,966,897 $0 $18,333,257 $36,410,834
NC $280,000 $2,512,562 $1,975,864 $0 $0 $4,086,135 $838,237 $1,063,203 $0 $10,756,001
ND $250,000 $3,563 $510,870 $0 $4,001,934 $1,056,492 $0 $303,649 $0 $6,126,508
OH $1,275,000 $1,934,464 $2,694,651 $423,999 $18,388,696 $5,572,605 $0 $1,738,605 $0 $32,028,020
OK $740,000 $704,233 $1,156,066 $0 $0 $2,390,773 $0 $0 $0 $4,991,072
OR $440,000 $1,070,840 $941,104 $0 $6,176,670 $1,946,227 $446,284 $605,272 $0 $11,626,397
PA $2,000,000 $1,213,049 $2,855,618 $453,722 $0 $5,905,489 $1,390,195 $1,885,448 $0 $15,703,521
RI $320,000 $101,114 $371,756 $0 $2,135,926 $768,800 $167,282 $197,478 $0 $4,062,356
SC 730,000 $0 $1,053,678 $250,000 $0 $2,179,032 $0 $0 $0 $4,212,710
SD $0 $43,629 $518,197 $0 $4,240,697 $1,071,645 $0 $0 $0 $5,874,168
TN $1,150,000 $38,482 $1,469,921 $0 $0 $3,039,832 $0 $876,355 $12,609,911 $19,184,501
TX $2,182,314 $4,175,674 $5,286,596 $840,076 $0 $10,932,810 $2,246,509 $0 $0 $25,663,979
UT $380,000 $293,523 $612,654 $0 $0 $1,266,983 $250,372 $339,566 $0 $3,143,098
VT $640,366 $21,300 $371,756 $0 $2,097,486 $768,800 $167,282 $241,575 $0 $4,308,565
VA $700,000 $267,077 $1,654,151 $0 $0 $3,420,824 $739,003 $0 $14,154,846 $20,935,901
WA $902,053 $3,125,104 $1,480,434 $0 $0 $3,061,574 $633,112 $969,917 $0 $10,172,194
WV $375,000 $106,973 $507,003 $250,000 $4,015,620 $1,048,495 $0 $332,347 $4,015,619 $10,651,057
WI $800,000 $210,304 $1,519,730 $0 $0 $3,142,840 $0 $950,150 $0 $6,623,024
WY $0 $0 $371,756 $0 $4,559,523 $768,800 $0 $0 $4,559,522 $10,259,601
NHTSA: TEA 21 Overall Highway Safety Funding / FY 2005 www.nhtsa.dot.gov/portal/site/nhtsa/menuitem.c5f2b2d02df83a9d304a4c4446108a0c/
B-2
Appendix C. State Case Studies
Appendix C. State Case Studies
C-1

Appendix C. State Case Studies
STATE CASE STUDIES: TABLE OF CONTENTS
Page California ................................................................................................................................... C-7
Summary Status in 2007 Background How California achieved 94.6% belt use
1975-2000: OTS and CHP establish belt use as a highway safety priority 2002: Mini-grants to law enforcement agencies 2003: Click It or Ticket
The California model: Belt use 24/7 for officers and for the public Law enforcement Publicity Outreach Research and data Highway safety management and culture Plans for 2007
Final thoughts References
Iowa .......................................................................................................................................... C-13 Summary Status in 2007 Background How Iowa achieved 91.3% belt use
1990s: STEPs and Corridor Enforcement Campaigns 1999: Steps expand with new funding 2002: Click It or Ticket
The Iowa model: High-visibility enforcement almost every month Law enforcement Publicity Outreach Research and data Highway safety management and culture Plans for 2007
Final thoughts References
Maryland ................................................................................................................................. C-20 Summary Status in 2007 Background How Maryland achieved 93.1% belt use
1986-1996: A decade with a secondary law 2003: Click It or Ticket
C-2

Appendix C. State Case Studies
2004-2007: Continuing to move forward The Maryland model: Year-round enforcement, two months of highly-publicized
enforcement in April and May, extensive local media, outreach to special populations
Law enforcement Chiefs’ Challenge Year-round seat belt law enforcement Enforcement zones
Publicity Outreach Research and data Highway safety management and culture Plans for 2007
Final thoughts References
Michigan .................................................................................................................................. C-28 Summary Status in 2007 Background How Michigan achieved 94.3% belt use
1986-2000: Enact and implement a primary belt use law 2002: First Click It or Ticket programs 2003: Enforcement zones and a new message 2004: The campaign for 90% 2005 and 2006: Continuing to move forward
The Michigan model: High-visibility enforcement using enforcement zones with the Buckle Up or Pay Up message
Law enforcement Publicity Outreach Research and data Highway safety management and culture Plans for 2007
Final thoughts References
Minnesota.................................................................................................................................C-39 Summary Status in 2007 Background How Minnesota achieved 87.8% belt use
1990s: Operation Buckle Down leads to Safe & Sober 2002: Click It or Ticket 2003-2006: Continuing to move forward
The Minnesota model: Year-round enforcement highlighted by two annual
C-3

Appendix C. State Case Studies
high-visibility campaigns Law enforcement Publicity Outreach Research and data Highway safety management and culture Plans for 2007
Final thoughts References
Nevada...................................................................................................................................... C-45 Summary Status in 2007 Background How Nevada achieved 92.2% belt use
1990s: Stagnant belt use rates 2001: Joining Forces 2002: Click It or Ticket
The Nevada model: High-visibility multi-jurisdictional enforcement throughout the year; numerous partnerships to promote belt use
Law enforcement Publicity Outreach Research and data Highway safety management and culture Plans for 2007
Final thoughts References
Oregon...................................................................................................................................... C-53 Summary Status in 2007 Background How Oregon achieved 95.3% belt use
1991-1992: Enforcement and publicity begin 1993-1999: Three Flags 2001-2006: Continue the strategy
The Oregon model: 95% with no checkpoints, no paid media, and positive messages Law enforcement Publicity Fine levels and alternative sentencing Research and data Highway safety management and culture Plans for 2007
Final thoughts References
C-4
Appendix C. State Case Studies
Texas......................................................................................................................................... C-61 Summary Status in 2007 Background How Texas achieved 91.8% belt use
1984-2000: Partnering to pass, publicize, and enforce the belt use law 2002: Click It or Ticket 2003-2004: Buckle Up in Your Truck 2005 and 2006: Progress resumes
The Texas model: Intensive CIOT publicity and enforcement campaign in May, special BUIYT messaging for pickup drivers, extensive community partners
Law enforcement Publicity Outreach Research and data Highway safety management and culture Plans for 2007
Final thoughts References
Washington.............................................................................................................................. C-70 Summary Status in 2007 Background How Washington achieved 96.4% belt use
1986-2001: 82% belt use with a secondary law 2002: Primary law, Click It or Ticket, and State Patrol priority 2003-2006: Continuing to move forward
The Washington model: Three annual campaigns to promote year-round enforcement Law enforcement Publicity Research and data Highway safety management and culture Plans for 2007
Final thoughts References
West Virginia........................................................................................................................... C-78 Summary Status in 2007 Background How West Virginia achieved 89.6% belt use
2000: Make belt use a priority 2002: Click It or Ticket
C-5
Appendix C. State Case Studies
2005 and 2006: Lifesaver Officer Campaign The West Virginia Model: High-visibility Click It or Ticket May campaigns, year-round
enforcement, and extensive localized publicity Law enforcement Publicity Outreach: McDonald’s corporate partnership Highway safety management and culture Plans for 2007
Final Thoughts References
C-6
Appendix C. California
California
Summary
• Belt use law: California enacted a secondary enforcement seat belt use law in 1986 and changed to primary enforcement in 1993. The cost of a citation is $80-91 depending on the jurisdiction.
• Belt use: California’s belt use rate has been above 90% since 2001. It reached 93.4% in 2006 and rose again to 94.6% in 2007.
• California’s strategies: Emphasize belt use 24/7 for officers and for the public. This is done by integrating belt law enforcement into every officer’s daily enforcement activities; publicizing this enforcement so pervasively that drivers and passengers cannot escape it; using a three week May mobilization to reinforce the message to both officers and drivers; and providing a vast array of educational and publicity materials directed to cultural, ethnic, and geographic audiences.
• Media and messages: In addition to regular earned and paid media, California has installed permanent seat belt use signs promoting the California CIOT logo and the $80-$91 fine every 50 miles on all State and county roads. California also publicizes belt use on both commercial and Department of Transportation fixed-location changeable message signs and on internet websites.
• Management: California has been a national leader in seat belt use for many years. Key elements include steady bi-partisan support for traffic safety from the legislature and governor, over 30 years of strong leadership in the California Highway Patrol (CHP) and the Office of Traffic Safety (OTS) and close working relationships between them; and experienced and talented OTS management and staff.
• Plans for 2007: California will continue the three week May mobilization, continue mini-grants, continue extensive publicity, and continue to encourage all officers to write belt law violation citations whenever they see an unbelted occupant.
Status in 2007
California’s primary enforcement belt use law covers all front and back seat occupants. The cost of a belt law citation is $80-91 depending on the jurisdiction. California’s belt use rate in 2006 was 93.4%, fourth highest of all States, and rose again to 94.6% in 2007. The belt use rate for front seat passenger vehicle occupant fatalities in FARS 2005 was 67%, second highest of all States.
C-7

Appendix C. California
Background
California enacted a secondary enforcement belt use law in 1986 and was the first State to upgrade its law to primary enforcement, effective January` 1, 1993. California always has had one of the highest belt use rates in the nation. In 1996 it became the first State to exceed 85% and in 2001 it was first to reach 90%. belt use has increased steadily over the last decade (Table 1).
NHTSA (2001) thoroughly documents California’s belt use programs through 2000. This report concentrates on activities since then that increased belt use even further to 93.4% in 2006.
Table 1. California belt use, 1996-2007
1996 1997 1998 1999 2000 2001 2002 2003 2004 2005 2006 2007 86.6 86.4 88.6 89.3 88.9 91.1 91.1 91.2 90.4 92.5 93.4 94.6
California is very large and very diverse. Its area of 163,696 square miles trails only Alaska and Texas and constitutes more than 5% of the total of the lower 48 states. It’s the most populous State with 36,132,000 residents in 2005, or 12% of the nation. California accounted for 10% of the nation’s traffic fatalities in 2005. There is no majority racial or ethnic group: the two largest in the 2005 Census estimates were 43% classified as white but not Hispanic and 36% Hispanic regardless of race (U.S. Census Bureau, 2005). Two cities have a population over one million and another 54 exceed 100,000. California has almost 170,000 miles of public roads, second only to Texas; half of the road miles are rural. California has 58 counties and 403 county and municipal law enforcement agencies in addition to the California Highway Patrol (CHP) and specialized agencies serving colleges and universities.
California’s traffic safety activities are managed by the Office of Traffic Safety (OTS), led by Director Chris Murphy. OTS is located within the California Business, Transportation, and Housing Agency, along with the Department Transportation (Caltrans), the CHP, and the Department of Motor Vehicles (DMV). OTS is quite large, with a staff of about 35.
How California achieved 94.6% belt use
1975-2000: OTS and CHP establish belt use as a highway safety priority. California began emphasizing belt use well before its 1986 secondary enforcement law. As examples, beginning in 1965 the CHP required all employees to wear seat belts when driving State vehicles and in 1972 the CHP conducted its first public information campaign promoting belt use.
belt use activities increased after the secondary law was enacted. Law enforcement agencies could not receive grants from OTS unless all officers were required to wear belts. Belt laws were included in cadet training at law enforcement academies. Officers in State, county, and municipal agencies were encouraged to write tickets for belt law violations. In 1988, the CHP set a goal of 70% belt use by 1992 (following the national “70 by 92” slogan) and began a four-year Safety Belt Awareness Campaign. To plan and implement the campaign, the CHP and OTS established the California Seat Belt Task Force with a broad range of partners. The Task Force in turn formed committees for law enforcement, media, community/employer, and medical programs.
C-8

Appendix C. California
Belt law enforcement increased rapidly: the CHP issued about 650,000 belt law citations in 1992 under the secondary law. The campaign succeeded: belt use reached 71% in 1992. See NHTSA (2001), from which much of this information is taken, for additional detail.
After the primary law was enacted, the Task Force set new goals, including reaching a belt use rate of 85% by 1996. OTS and CHP increased the priority of belt use in their traffic safety activities. Beginning in 1994, all law enforcement agencies receiving OTS grants for any purpose were required to include an occupant protection element for belt or child safety seat use in each grant. A Law Enforcement Liaison (LEL), a retired municipal officer, helped carry the belt law message to county and municipal agencies. Again, the goals were achieved: California’s 86.6% belt use in 1996 led the nation (Table 1).
Buckle Up America belt law mobilizations began in 1998, with 42 agencies participating in May and 128 in November. By May 2000, 348 agencies participated. Belt use continued to increase steadily. In 2001, California became the first State to break the 90% barrier with a use rate of 91.1%.
2002: Mini-grants to law enforcement agencies. To increase law enforcement activities in the May and November mobilizations, OTS awarded small and simple “mini-grants” to agencies for overtime enforcement. In November 2002, about $1 million was awarded to about 90 agencies, concentrating on agencies in low belt use areas, with an average grant slightly over $10,000. Funding increased substantially in 2004, and OTS was able to provide large enough grants to attract California’s larger agencies. In 2007, $5.6 million was awarded to 270 of California’s 403 county and municipal agencies, in amounts from $1,182 to $90,000 (www.ots.ca.gov/pressRoom/2007/default.asp).
2003: Click It or Ticket. California joined the national Click It or Ticket (CIOT) campaign in 2003 and used the CIOT slogan for its May and November mobilizations. California designed its own CIOT logo using the State blue and yellow colors: a blue belt with the CIOT slogan buckling up a yellow State map. California began using paid media to publicize the campaigns. The mobilizations increased in length from one week to two weeks. In 2005 the May mobilization expanded again, to three weeks.
The California model: belt use 24/7 for officers and for the public
California’s strategy, which it has followed consistently and persistently over the last 40 years, has four components: integrate belt law enforcement into every officer’s daily enforcement activities; publicize this enforcement so pervasively that drivers and passengers cannot escape it; use the May mobilization to reinforce the message to both officers and drivers; and provide a vast array of educational and publicity materials directed to individual cultural, ethnic, and geographic audiences.
C-9

Appendix C. California
Law enforcement. The CHP always has been at the heart of California’s belt use and belt law enforcement activities. The CHP’s primary mission is traffic safety and traffic law enforcement, unlike some other State patrols that have substantial non-traffic duties. The CHP’s main goal always has been to prevent crashes and injuries, so that increasing belt use has been a core part of the CHP’s mission for over 40 years. With about 7,600 sworn officers and a visible presence throughout California, the CHP helps carry the belt use and belt law enforcement messages to law enforcement agencies statewide. The CHP receives grant funding from OTS for belt law enforcement activities year-round as well as during the May mobilization.
The mini-grant program has been remarkably effective in recruiting other agencies to participate in the mobilizations and in using the mobilizations to emphasize that belt law enforcement is a year-round, 24/7 traffic enforcement priority. Mini-grants are extremely simple in all respects. They fund only one thing: officer overtime for belt law enforcement. While on mini-grant overtime, officers concentrate only on belt law enforcement and are not diverted to other issues except in emergency situations. Officers enjoy this overtime duty: they spend their time on the street and the traffic stops for belt use violations also lead to arrests for outstanding warrants, drugs, and other offenses. While no data are available, anecdotal evidence suggests that the overtime activity has increased belt law citations during regular patrols.
Enforcement activities use saturation patrols, corridor enforcement zones, and other less formal methods that put many officers on the street. Most enforcement is conducted in daylight hours. Checkpoints specifically for belt use are not used. Overtime funding is not restricted to traffic officers, again emphasizing that belt laws should be part of every officer’s standard enforcement repertoire. For example, community service officers participate in enforcement zone activities by noting unbelted occupants and radioing to traffic officers downstream to stop their vehicle.
Agencies apply for mini-grants using a one-page, fill-in-the-blank form. Agencies are required only to issue a press release for their local media (OTS supplies a template), train participating officers, and conduct 100-car pre and post surveys. These surveys provide officers an indication of the belt use rate in their jurisdiction and also show how the mobilization affected belt use at the same time and location.
Reporting is equally simple: hours of overtime worked, belt citations issued both on overtime and regular patrol, and local media coverage. OTS contracts with the University of California at Berkeley to manage the individual mini-grants. For details on the mini-grant program see www.ots.ca.gov/grants/CIOTMiniGrant.asp.
California participates in the IACP Chief’s Challenge to recognize agencies with outstanding programs to increase occupant protection and reduce impaired driving and speeding. Winning agencies receive bragging rights but no cash awards.
California does not conduct multi-jurisdictional belt use law enforcement activities.
Publicity. California uses a mix of paid and earned media to publicize belt use and CIOT. Because California’s television and radio media markets are both diverse and expensive, paid television and radio cannot have a major impact. (For example, it would take about $10 million –
C-10

Appendix C. California
the total national CIOT paid media budget for national ads – to buy an effective full campaign in the Los Angeles market.) As a result, a substantial portion of California’s paid media budget is used for other outlets. Commercial variable message signs along highways reach drivers on the road. Most are in full color; about half are animated. California also buys time to publicize CIOT on internet websites associated with passenger vehicle travel, such as Mapquest.
Earned media are driven by the 270 agencies participating in the mini-grants. Agencies in smaller jurisdictions generally get decent coverage. Large enforcement operations with good visuals and special newsworthy opportunities also generate coverage. As an example, in 2006 one officer in Oxnard announced before the three-week May mobilization that he expected to write 1,000 seat belt law tickets. Local newspapers and drive-time radio then started a “Stop Officer Ernie” campaign urging motorists to buckle up. But Ernie achieved his goal, issuing 1,013 tickets.
California has installed permanent seat belt use signs promoting the California CIOT logo and the $80-$91 fine every 50 miles on all State and county roads: about 1,000 signs statewide. During the May mobilization, Caltrans runs CIOT messages on its 325 changeable message signs that motorists see regularly. As one person remarked, “You can’t drive anywhere without seeing the CIOT message.”
Outreach. California conducts a dizzying array of outreach activities to serve its diverse geographic, cultural, and ethnic populations. The “El Protector” outreach to the Hispanic community has been active since 1988. NHTSA (2001) documented 26 community occupant protection programs and other outreach activities. California produces traffic safety education and information materials in 19 languages.
Research and data. California’s seat belt use surveys have been conducted by California State University at Fresno since 1992 using a sophisticated survey design (Piazza and Betancourt, 2006). The survey initially covered only passenger cars; other passenger vehicles were added in 1997. In recent years the survey has been conducted twice each year: in the spring, before the May mobilization, and in summer, after the mobilization. The spring survey is a half-sample, using half the sites and observations of the summer survey.
Highway safety management and culture. California has been a national leader in traffic safety overall and seat belt use in particular for many years. Key elements include steady bi-partisan support for traffic safety from the legislature and governor across both Republican and Democratic administrations; over 30 years of strong leadership in CHP and OTS and close working relationships between them; and experienced and talented OTS management and staff. Good management skills are absolutely necessary to operate California’s program: $92.5 million in SAFETEA-LU grant funding in 2006. It’s no surprise that OTS director Murphy has served as chair of the Governors Highway Safety Association since September 2006.
Plans for 2007. California plans no major changes in 2007. It will continue the three week May mobilization, continue mini-grants, continue extensive publicity, and continue to encourage all officers to write belt law violation citations whenever they see an unbelted occupant.
C-11

Appendix C. California
Final thoughts
California’s strategy is to have belt use a year-round, 24/7 issue for everyone.
• For officers: establish belt use laws as one of their enforcement priorities.
• For agencies: require use by all officers, include an occupant protection component in all grant activities, participate in mobilizations.
• For the public: it’s impossible to drive anywhere without seeing the CIOT message.
California’s 93.4% belt use in 2006 demonstrates how successfully this strategy has been implemented.
References
Interviews on June 20, 2007 with Michele Meadows, Assistant Director of Operations, Office of Traffic Safety Chris Cochran, Public Information Officer Donna Heppner, Occupant protection and CPS Don Uelman, Operations Coordinator Sgt. Stephen Valdez, CHP
Interview on June 29, 2007 with Raul Betancourt, CSU Fresno, California seatbelts survey project director (by phone)
NHTSA (2001). Keeping It Clicking in California: A Case Study of Sustained Success with a High Seat Belt Use Rate. Washington, DC: National Highway Traffic Safety Administration. www.nhtsa.dot.gov/people/injury/airbags/buckleplan/BUA_WEBSITE/Archive-04/Cases/California.html
Piazza, T. and Betancourt, R. (2006). Sample Design for the California Seatbelt Surveys. Fresno, CA: R. Betancourt.
U.S. Census Bureau (2005). American Community Survey: California Fact Sheet. factfinder.census.gov/home/saff/main.html?_lang=en
C-12

Appendix C. Iowa
Iowa
Summary
• Belt use law: Iowa has a primary enforcement belt use law. The fine is $25; the total cost of a belt use citation is $83-88 depending on the jurisdiction.
• Belt use: Iowa’s belt use rate in 2006 was 89.6%; its 2007 rate of 91.3% exceeded 90% for the first time. belt use has risen steadily from 74.8% in 1996.
• Iowa’s strategies: Iowa conducts a high-visibility enforcement campaign almost every month: two-week belt campaigns in May and at Labor Day, one-week campaigns in February, July 4, and Thanksgiving, and five or six corridor campaigns at other times.
• Media and messages: Iowa uses the same seat belt television, radio, and print spots statewide both as paid and PSA spots. The keys to good placement and high impact are to provide high-quality media materials, with good production values, based on meaningful and sensible messages, marketed to media using experience with Iowa’s media markets and personal relations developed and maintained over time.
• Management: Iowa’s Governor’s Traffic Safety Bureau has experienced and knowledgeable leadership, concentrates its program activities on proven strategies backed up by data, applies its high-visibility belt enforcement campaigns throughout the year and throughout the State, and has excellent relationships with law enforcement statewide.
• Plans for 2007: Iowa will conduct five statewide high-visibility seat belt enforcement campaigns and six one-day multi-agency corridor campaigns. Additional support for these campaigns will be provided by the NHTSA CIOT Next Generation demonstration program. Media will include Buckle Up in Your Truck materials directed at pickup drivers.
Status in 2007
Iowa has a primary belt use law covering all front seat occupants and all rear seat occupants under age 11. The fine is $25; the total cost of a citation is $83-88 depending on the jurisdiction. Iowa’s belt use rate was 89.6% in 2006 and rose again to 91.3% in 2007. The belt use rate for front seat passenger vehicle occupant fatalities in FARS 2005 was 56%.
Background
Iowa enacted a primary enforcement belt use law in 1986. The fine was $25; court costs added another $24. Court cost increases brought the total cost to $63 in 2005 and $83 in 2006, with some jurisdictions assessing an additional $5. belt use was 74.8% in 1996 and has increased steadily to 89.6% in 2006. This report examines Iowa’s activities over the last decade that produced this steady increase.
C-13

Appendix C. Iowa
Iowa is a mid-sized, largely agricultural State in America’s heartland. Its area of 56,272 square miles ranks 26th of the 50 States; its 2005 population of 2,966,000 ranks 30th. Iowa’s residents are very homogeneous, with over 91% classified as white and not Hispanic in 2005. Iowa has no large metropolitan areas: Des Moines is the largest city, with a population of 198,682 in 2000, and Cedar Rapids is the only other city over 100,000. Iowa has 99 counties, many small cities and towns, about 400 law enforcement agencies, and about 5,000 sworn officers.
Table 1. Iowa belt use, 1996-2007
1996 1997 1998 1999 2000 2001 2002 2003 2004 2005 2006 2007 74.8 74.9 76.9 78.0 78.0 80.9 82.4 86.8 86.4 87.1 89.6 91.3
Iowa’s traffic safety activities are managed by the Governor’s Traffic Safety Bureau (GTSB), led by Director J. Michael Laski until his retirement in 2007. GTSB is located within the Iowa Department of Public Safety. GTSB is relatively small, with about 11 full-time professional staff including one Law Enforcement Liaison (LEL) who assists with all GTSB’s law enforcement activities.
How Iowa achieved 91.3% belt use
1990s: STEPs and Corridor Enforcement Campaigns. Iowa began enforcing its belt law when it was enacted it 1986. Enforcement visibility increased in 1995 when Iowa conducted its first corridor enforcement initiative (NHTSA, 1998). Each corridor initiative is conducted along major highways passing through several jurisdictions, often one or two parallel north-south or east-west highways crossing the whole State. Law enforcement agencies along the corridor, together with the Iowa State Patrol, saturate the corridor with officers looking for belt use and other traffic violations.
Corridor enforcement campaigns have been conducted every year since 1995, about five or six each year since 2002. Plans for 2007 are described subsequently.
Special Traffic Enforcement Programs (STEPs) concentrating on belt use began in 1996. STEPs are short, intensive, high-visibility enforcement campaigns in which many agencies across the State emphasize belt use law enforcement at the same time. Most agencies participating in STEPs receive grants from GTSB; the funds may be used for equipment or officer overtime. About 20 agencies participated in the initial STEPs. Five or six have been conducted each year since 2002.
1999: STEPs expand with new funding. Beginning in 1999, GTSB used Section 157 funds to expand STEP grants. GTSB hired a full-time STEP coordinator in 2000. Section 157 funds expanded from $129,000 in 2000 to $456,000 in 2001 to $691,000 in 2002; Section 402 and 405 funds also were used. By 2006 about 240 agencies (including most of the larger agencies) participated in each of the five STEP waves: for two weeks in May and around Labor Day and for one week in February and around July 4 and Thanksgiving. Participation is particularly strong in northwest, north central, and south central Iowa, predominantly rural areas where belt use typically has been below the statewide average. Most participating agencies receive some
C-14

Appendix C. Iowa
federal funding for overtime operations during these waves. The Iowa State Patrol is a major partner in these waves. IA DOT’s MCSAP inspectors and officers from the Iowa Department of Natural Resources (DNR) also participate annually without any federal funding. DNR officers have the authority to search an entire vehicle if fishing or hunting equipment is evident. This sometimes leads to arrests for possession of drugs or other non-traffic offenses.
2002: Click It or Ticket. Iowa did not participate in the 2002 national Click It or Ticket (CIOT) demonstration but served as a comparison state, with no paid advertising supporting its usual May STEP wave. Iowa’s belt use increased by 1.6 percentage points from 81.4% before the wave to 83.0% afterwards, compared to an average 8.6 percentage point increase for the ten demonstration States (Solomon et al., 2002). In 2003 Iowa participated fully in the national May CIOT campaign, with paid advertising. belt use increased to 86.8%, almost four percentage points above the 2002 post-wave use rate and more than four percentage points above the reported 2002 rate of 82.4% (Solomon et al., 2004).
The Iowa model: High-visibility enforcement almost every month
Iowa has continued the same strategy since 2003. Five statewide high-visibility campaigns concentrate on seat belt and child safety seat enforcement for two weeks in May and around Labor Day and for one week in February and around July 4 and Thanksgiving. Five or six corridor enforcement campaigns throughout the year enforce seat belt use and other priority traffic laws. Thus there is a high-visibility belt enforcement campaign almost every month from February through November. All of these campaigns involve many jurisdictions and law enforcement agencies. All are highly publicized using both paid and earned media.
In addition, GTSB emphasizes occupant protection by requiring an occupant protection enforcement component in every grant to a law enforcement agency, including impaired driving and police traffic services activities.
Law enforcement. The key to Iowa’s strategy is the active cooperation of law enforcement throughout the State. GTSB has cultivated and maintained excellent relations with law enforcement for many years. GTSB Director Laski and Occupant Protection Manager Simpson both have previous experience in law enforcement. GTSB spends about 85% of its highway safety budget on law enforcement activities. The Iowa State Patrol has thoroughly embraced belt use as a key part of its mission. It goes the extra mile to participate in the corridor campaigns and STEPs. In 2007, the State Patrol will conduct nine CIOT surveys that together will record belt use before and after each STEP wave.
Enforcement methods include both checkpoints and saturation patrols. In 2006 Iowa conducted three large county-wide checkpoints that received extensive publicity. One corridor campaign conducted a checkpoint that stopped all southbound vehicles on an Interstate highway. Iowa incorporates vehicle safety checkpoints into some belt enforcement activities. These check to be sure that vehicles have properly-functioning safety equipment and that drivers are properly licensed. Iowa enforces belt use laws at night through regular patrol activities and occasional checkpoints but no saturation patrols.
C-15
Appendix C. Iowa
Publicity. Iowa has used the same firm for over 25 years to create, produce, and distribute its seat belt and other highway safety media products. For most of this time, these consisted of public service and earned media; paid media for seat belts were first used in 2003. The basic principles remain the same for paid and public service: provide high-quality media materials, with good production values, based on meaningful and sensible messages, and market the products using experience with Iowa’s media markets and personal relations developed and maintained over time. For paid media, the firm manages the media buy.
Television spots serve as Iowa’s principal media outlet. They appear on all Iowa’s television stations as both paid and public service spots. While total viewer impressions are not tracked, in the years before paid media it was estimated that the television PSAs were aired in donated time that was valued at ten times their production costs. With typical production costs of $35,000 per PSA, this translates to about $350,000 of donated time per PSA. Another anecdote illustrates Iowa’s success in placing its PSAs. Television and radio stations have an “emergency rack” with a few ads and PSAs that can be used quickly in emergency situations, such as when a connection to a live reporter in the field is lost. Highway safety PSAs regularly appear on these “emergency racks.”
Iowa also uses radio PSAs based on the television PSA messages and themes. Iowa converts some television PSAs for use in movie theatres. The two distribution chains that cover much of rural Iowa have donated time for these spots.
Iowa has about 350 newspapers, of which about 325 serve rural areas and are published weekly. Iowa produces “small space” print ads for these newspapers. Many will use them as space fillers, at no charge, when space is available. Iowa also uses billboards, purchasing space for one month, typically during the May mobilization, from the Iowa Outdoor Advertising Association. The billboards often stay up for additional months, at no charge, until someone else buys the space.
Iowa initially used health and safety themes for its seat belt messages. The first paid media in 2002-2003 used the message “Buckle Up or Pay Up: Seat Belt Tickets Save Lives.” The CIOT message and logo were adopted in 2004. Current messages highlight the belt use law and the $83 seat belt law fine.
Iowa uses the same radio, television, and print media throughout the State. With very small ethnic and cultural minority populations, Iowa uses no media targeted to special populations aside from some print materials which are produced in Spanish as well as English and the Buckle Up in Your Truck materials directed at pickup drivers and occupants. The corridor campaigns use whatever of the statewide seat belt media they wish, together with local earned media from press releases, press conferences, and new stories.
Outreach. GTSB funds the Iowa/Illinois Safety Council to conduct seat belt promotion activities for companies using NHTSA’s NETS (Network of Employers for Traffic Safety) program. NETS encourages large companies to survey their employees’ belt use and provides strategies and programs to assist companies with lower belt use. Iowa also works with the Iowa Health System to offer a Trauma Injury Program (TIPS)/Think First school assembly program, which
C-16

Appendix C. Iowa
promotes belt use to prevent spinal injuries. Another outreach program, funded through Farm Safety 4 Just Kids (FS4JK), uses the Buckle Up or Eat Glass (BUEG) program to promote belt use to rural youth groups. Both TIPS/Think First and BUEG use peer group speakers who have been injured in motor vehicle crashes.
Research and data. Iowa has conducted annual seat belt use surveys since 1986 using the same survey design. The surveys originally were conducted in August; they were shifted to June for consistency with other States. The State Patrol conducts the surveys and IA DOT reports and analyses the data (IA DOT, 2005). Iowa conducts occasional telephone surveys when information is needed on specific occupant protection issues.
Highway safety management and culture. The Iowa GTSB gets maximum value out of its small staff. The keys are:
• experienced leadership from Director Laski and key senior staff;
• concentrating budget and activities on proven strategies, backed up with hard data – as one indication, 85% of GTSB’s budget is used to support law enforcement activities;
• persistence in applying the proven high-visibility belt strategy year-round, not just during a single short campaign, and throughout the State, not just in major population centers;
• excellent relationships with law enforcement officers and agencies throughout Iowa, cultivated through many years of personal contacts, straightforward dealings, and remembering always to say thanks.
Iowa’s occupant protection activities and results reflect some typical Iowan characteristics: willing to take a challenge, willing to work hard to achieve results, willing to understand that it’s everyone’s responsibility to make things happen, willing to be a national leader – not boastfully but quietly: “They like being good.” Iowa’s political caucuses demonstrate this leadership and collective responsibility in a completely different arena. In traffic safety, Iowa’s traffic records system is a model for other States. It’s no surprise that Iowa has been a leader in belt use for over ten years. Iowa’s goal is to reach 95% seat belt use by 2008 (GTSB, 2006).
Plans for 2007. Iowa will conduct five statewide high-visibility seat belt enforcement campaigns, for two weeks each in May and around Labor Day and for one week each in February, near July 4 and near Thanksgiving. Each of these campaigns will use paid media. Some additional support for these campaigns will be provided by the NHTSA CIOT Next Generation demonstration program which assists Iowa and two other States in conducting multiple CIOT waves throughout the year. In Iowa, this demonstration will evaluate the effects of using paid media with every enforcement campaign. In May, immediately before the CIOT campaign, Iowa will conduct the final phase of a demonstration program to promote belt use in pickup trucks. Previous phases were conducted in May and November 2006.
Iowa also will conduct six one-day multi-agency corridor campaigns. All campaigns will target impaired driving, safety belt and child passenger restraint use, stop sign and stop light violations, excessive speed, and driving without a license. The current year’s plans and the previous year’s results are described in GTSB (2007).
C-17

Appendix C. Iowa
• March 15, Avenue of the Saints, from St. Louis MO to St. Paul MN, in cooperation with law enforcement in Missouri and Minnesota; in 12 counties in eastern Iowa along IA 27 and including portions of I 35 and I 380.
• May 24, Operation TNT; in 31 counties along the IA 2, IA 92 and US 34 corridors across southern Iowa from east to west.
• June 7, US 61 HEAT; in eight counties in eastern Iowa along US 61.
• July 19, Operation Double Aught, in 24 counties along the US 20 and US 30 corridors across central Iowa from east to west.
• August 30, Operation I’s, on I 35 and I 80; in 22 counties along the major north-south and east-west Interstates through Iowa; in cooperation with law enforcement in Minnesota, Missouri, Kansas, Oklahoma, and Texas on the I 35 campaign.
• October 4, Operation Northern Lights, in 32 counties along the IA 3, IA 9, and US 18 corridors across northern Iowa from east to west.
These campaigns involve many agencies and officers and produce substantial publicity, contacts with the driving public, and citations. As one example, the 2006 Operation Northern Lights involved 205 officers from 48 state, county, and municipal agencies. They contacted 2,057 drivers and issued 1,819 citations including 749 for speeding and 228 for failing to buckle up. They made 2 felony and 4 narcotics arrests and served 12 outstanding warrants (GTSB, 2007).
The seat belt and corridor campaigns use the same mix of enforcement strategies: a few checkpoints and many saturation patrols. All agencies, not just those in corridor campaign locations, are urged to participate in multi-agency activities during some of the campaigns. No nighttime enforcement campaign activities are planned.
Final thoughts
• All belts, all the time: twelve high-visibility enforcement campaigns in 2007, each covering the whole State or a substantial portion of it – the strategy that NHTSA is exploring in other States through its CIOT Next Generation demonstration.
• Multi-jurisdictional campaigns encourage smaller agencies to participate, promote both cooperation and friendly competition.
• Stable leadership and programs have produced steady belt use increases over more than a decade.
C-18

Appendix C. Iowa
References
Interviews on April 18, 2007 with J. Michael Laski, Director, Iowa Governor’s Traffic Safety Bureau (by telephone) Lu Simpson, Occupant Protection Manager Robert Thompson, Traffic Records and Statistics
Interview on June 29, 2007 with Bill Grismer, Integer Group (by telephone)
GTSB (2006). Iowa Highway Safety Plan 2007. Des Moines, IA: Iowa Governor’s Traffic Safety Bureau.
GTSB (2007). Corridor Enforcement Projects. Des Moines, IA: Iowa Governor’s Traffic Safety Bureau. www.dps.state.ia.us/commis/gtsb/GTSBcorridor.shtml
Iowa DOT (2005). 2005 Seat Belt Usage Survey. Des Moines, IA: Iowa Department of Transportation. www.iamvd.com/ods/survey.htm
NHTSA (1998) Iowa Coordinated Corridor Initiative. Traffic Safety Digest, Winter 1998. www.nhtsa.dot.gov/people/outreach/safedige/Winter1998/n5-34.html
Solomon, M.G., Ulmer, R.G.,and Preusser, D.F. (2002). Evaluation of Click It or Ticket Model Programs. DOT HS 809 498. Washington, DC: National Highway Traffic Safety Administration.
Solomon, M.G., Chaudhary, N.K., and Cosgrove, L.A. (2004). May 2003 Click It or Ticket Safety Belt Mobilization Evaluation. DOT HS 809 694. Washington, DC: National Highway Traffic Safety Administration.
C-19

Appendix C. Maryland
Maryland
Summary
• Belt use law: Maryland enacted a secondary enforcement belt use law in 1986 and strengthened the law to primary enforcement in 1997. The fine is $25.
• Belt use: Maryland’s belt use rose dramatically from 71.0% in 1997 to 82.6% in 1998 following the change to a primary law. Belt use has increased gradually since then, reaching 91.1% in 2006 and 93.1% in 2007.
• Maryland’s strategies: 24/7 belt law enforcement, with no paid overtime. Most law enforcement agencies issue seat belt law citations year-round during regular patrol activities. The Chiefs’ Challenge intensifies and publicizes this enforcement for a full two months in April and May, using enforcement zones, culminating in the 2-week Click It or Ticket (CIOT) mobilization.
• Media and messages: Both paid and earned seat belt publicity feature local law enforcement on radio and television spots and on signs and billboards.
• Outreach: Local activities planned and implemented by community traffic safety programs (CTSPs) and law enforcement agencies, encouraged by the Pacesetter program of activities and belt use surveys.
• Management: Close relationships with Maryland’s law enforcement agencies based on personal relationships and assisted by the Maryland Committee for Safety Belt Use (MCFSBU). Cooperative occupant protection activities including regional and statewide Chiefs’ Challenge workshops sponsored by the Maryland Highway Safety Office (MHSO), Maryland Chiefs of Police Association (MCPA) and MCFSBU and PSAs featuring local law enforcement officers provided to regional media outlets throughout the state.
• Plans for 2007: Continue year-round belt enforcement, Chiefs’ Challenge, and CIOT; increase nighttime and multi-jurisdictional enforcement; emphasize proper belt use.
Status in 2007
Maryland’s primary belt use law covers front seat outboard passengers over the age of 15. Occupants of taxis, vanpools, emergency vehicles, and farm vehicles within 10 miles of the farm are exempt. The fine is $25, with no additional court costs. Maryland’s belt use rate in 2006 was 91.1%, sixth highest of all primary law states, and rose again to 93.1% in 2007. The belt use rate for front seat passenger vehicle occupant fatalities in FARS 2005 was 56%, above the median for primary law states.
C-20

Appendix C. Maryland
Background
Maryland enacted a secondary enforcement belt use law in 1986 and strengthened the law to primary enforcement in 1997. Belt use was 71.0% in 1997, the last year under the secondary law Table 1). It increased dramatically to 82.6% in 1998 following the change to primary and has continued to increase since then, passing the 90% mark in 2005. This report examines Maryland’s activities from 1997 to 2006 that produced this steady increase.
Maryland is a small and highly diverse mid-Atlantic State. Its area of 12,407 square miles ranks 42nd of the 50 States. It extends from the rural western counties in the Appalachians, past the densely-populated corridor between Baltimore and Washington, DC, across the Chesapeake Bay to the Atlantic resort of Ocean City and beaches of Assateague. Its 2005 population of 5,600,000 ranked 19th and its population per square mile ranked fourth, after New Jersey, Rhode Island, and Massachusetts, three other small northeastern States. Maryland has 24 counties and 144 law enforcement agencies in addition to the Maryland Highway Patrol.
Table 1. Maryland belt use, 1996-2007
1996 70.0
1997 71.0
1998 82.6
1999 82.7
2000 85.0
2001 82.9
2002 85.8
2003 2004 2005 2006 87.9 89.0 91.1 91.1
2007 93.1
Maryland’s traffic safety activities are managed by the Maryland Highway Safety Office (MHSO), located within the Maryland Department of Transportation and led by Chief Vern Betkey, Jr. The MHSO has about 20 full-time professional staff. Three part-time Law Enforcement Liaisons (LELs) each devote about five hours per week to occupant protection training and outreach.
How Maryland achieved 93.1% belt use
1986-1996: a decade with a secondary law. Maryland laid the foundation for its success in the ten years before it enacted a primary law. After the 1986 secondary law was implemented, Maryland began serious efforts to enforce it. In particular, in 1988 the MCPA and MCFSBU developed and co-sponsored the Maryland Chiefs’ Challenge campaign to educate law enforcement agencies about occupant protection and to encourage them to enforce seat belt and child safety seat use laws during the Challenge months of April and May as well as throughout the year. The Chiefs’ Challenge program has been conducted every year since 1988 except for the three years 1995-97, when the legislature considered and enacted the primary enforcement law and when the Maryland Committee For Safety Belt Use (MCFSBU), the campaign’s coordinator, was conducting a Buckle Up Baltimore campaign and working to support the legislation. In 1992, the International Association of Chiefs of Police (IACP), National Sheriff’s Association (NSA), NHTSA, and the National Safety Belt Coalition developed a national Chiefs Challenge modeled after the Maryland Chiefs’ Challenge campaign. The current Chiefs’ Challenge program is described below.
Maryland’s efforts to enact the 1986 belt use law were assisted by the MCFSBU, a private organization funded in part by the automobile industry through Traffic Safety Now (TSN). After
C-21

Appendix C. Maryland
TSN ceased operating, the MCFSBU continued as a small independent organization devoted to adult occupant protection and child passenger safety. Now largely funded by the MHSO, the MCFSBU assists and works closely with the MHSO in planning and implementing belt use programs. In particular, the MCFSBU manages the Chiefs’ Challenge program. It also provides twenty years of experience with occupant protection activities in Maryland and has extensive personal relationships with law enforcement and other community leaders throughout the State. As a non-profit contractor for the MHSO, its Executive Director has the autonomy to contact legislators and others to support occupant protection issues. When Maryland’s primary enforcement legislation was being debated, legislative leaders and the bill’s sponsors requested that the MCFSBU serve as a technical advisor for the bill.
2003: Click It or Ticket. After the primary law was implemented in 1997, Maryland continued the Chiefs’ Challenge program with few changes; in particular, Maryland retained its relatively low-key earned media strategy and did not adopt a more confrontational “Click It or Ticket” message. Because the primary enforcement seat belt law had passed by only one vote in the House of Representatives, Maryland decided to maintain a positive and friendly approach using messages such as “Buckle Up Maryland” and “Together We Can Save Lives, Buckle Up, It’s Our Law.” Belt use in 2001 was 82.9%, essentially unchanged from the 1998 rate. In 2002, Maryland continued this strategy and did not participate in the 10-State national Click It or Ticket (CIOT) demonstration. Belt use rose to 85.8% in 2002. This was a gain of almost 3 percentage points from 2001 and was the highest level Maryland had ever recorded; however it was less than one percentage point above the 2000 rate.
In 2003 Maryland joined the national May CIOT mobilization. It incorporated the CIOT message and enforcement emphasis into the existing Chiefs’ Challenge structure so that the occupant protection enforcement during April and May ended with the two-week CIOT mobilization. CIOT provided additional funds – $600,000 in 2003 – which were used entirely for media because the Maryland legislature had expressed concerns over using paid overtime for enforcement activities concentrating on occupant protection. The combination of Chiefs’ Challenge and CIOT increased belt use to 87.9% in 2003.
2004-2007: Continuing to move forward. Maryland continued this combined Chiefs’ Challenge and CIOT strategy through 2006. CIOT funding continued to be used entirely for media, not for overtime enforcement. Belt use broke the 90% barrier in 2005 with a rate of 91.1%, remained at the same level in 2006, and rose again in 2007 to 93.1%.
The Maryland model: year-round enforcement, two months of highly-publicized enforcement in April and May, extensive local media, outreach to special populations
Law enforcement: Chiefs’ Challenge. The Maryland Chiefs’ Challenge program is sponsored by the Maryland Chiefs of Police Association, the MCFSBU, and the MHSO. It is open to all law enforcement agencies in the State, both those with and without traffic enforcement responsibilities (Beckett and Miller, 2006). Its goals are to educate the public on occupant protection, to integrate seat belt and child safety seat law enforcement into regular patrol activities, to increase enforcement during the challenge months of April and May, and to increase
C-22

Appendix C. Maryland
the belt use rate. Participating agencies first register for the Challenge and then submit a report on their April and May activities. Agencies compete with each other for recognition and awards. Agencies are evaluated by a panel of law enforcement representatives on their occupant protection enforcement, measured both by activities and by citations and warnings issued (for agencies with traffic responsibilities); public information; occupant protection training; special community events; and activities with community groups in the Pacesetter program described below.
All participating agencies are invited to an annual “steak and cake” gala awards banquet at which all agencies that submit a report are recognized and the highest-ranking agencies receive award plaques. In 2006, 80 of Maryland’s 144 county and municipal agencies, including almost all the large municipal agencies, participated in the Chiefs’ Challenge, as did almost all the Maryland State Police barracks. About 40 received awards. In addition, the MHSO and MCFSBU presented less formal awards to encourage agencies that came close to meeting the formal award standards. These are presented individually in the agency’s jurisdiction, at an appropriate occasion such as a city council meeting.
Agencies and barracks that submit a Chiefs’ Challenge entry also receive a supply of special promotional items with Child Passenger Safety and Buckle Up themes for use during National Child Passenger Safety Awareness week the following year. Many law enforcement coordinators tell the MHSO and MCFSBU how much they appreciate these supplies, because in most cases they are not able to purchase these items with their own funds.
The Chiefs’ Challenge has been remarkably successful in achieving its goals at very little cost: no paid CIOT overtime and no expensive awards. Participation has increased from about 25 agencies in 1988 to 80 agencies and 25 Maryland State Police barracks and divisions currently.
Year-round seat belt law enforcement. The Chiefs’ Challenge goal of regular belt law enforcement throughout the year has been met. Table 2 gives the data from 2005, in which totals for the Chiefs’ Challenge and full year periods have been adjusted for a small amount of missing data. It’s notable that the citation rate for the first six weeks of the Challenge exceeded the rate for the two-week CIOT period. Further, the Challenge citation rate was only slightly higher than three times the rate for the remainder of the year. Said another way, two-thirds of the annual seat belt law citations were issued during the ten months when there was no special seat belt enforcement activity.
Table 2. Maryland seat belt citations, 2005
Time period 2005 Belt law citations
Citations per 2 weeks
Citations per 2 weeks per
10,000 residents CIOT 2 weeks May 10,836 10,836 19 Chiefs’ Challenge 2 months, April-May 51,000 12,750 23 Other 10 months, 2005 94,000 3,917 7 Full year 2005 145,000 5,577 10
During the Chiefs’ Challenge, Maryland’s law enforcement officers issued 23 citations for every 10,000 Maryland residents every two weeks; the rate for the full year was 10 per 10,000 residents every two weeks and the rate for the ten months with no special enforcement activity
C-23

Appendix C. Maryland
was 7. In 2003, the combined citation rate for the 17 primary law States that reported data for the two-week May CIOT mobilization was 24 per 10,000 residents (Solomon et. al, 2004); in 2004 the combined rate for 23 primary law states was 30 (Solomon and Chaffe, 2005). So Maryland’s citation rate for the full two months of the Chiefs’ Challenge was similar to the citation rates of other primary law States during their two-week CIOT mobilizations, and Maryland maintained a citation rate of about one-third this level for the remainder of the year.
Enforcement zones. Maryland uses enforcement zones as its main strategy for intensified belt use law enforcement during the Chiefs’ Challenge period. A spotter detects unbuckled occupants in passing vehicles and radios vehicle descriptions to officers downstream who stop the vehicles and issue citations. Enforcement zones are advertised with temporary signs upstream of the spotter. The public is informed in advance that officers will be looking for unbuckled occupants but specific enforcement zone locations usually are not publicized. A few checkpoints may be conducted, but these are the exception.
Maryland recently began conducting some enforcement zones at night, in areas with ample light either from permanent sources or from construction zone lighting, using the same procedures as daytime enforcement zones. Nighttime enforcement receives additional credit toward Chiefs’ Challenge awards. These nighttime enforcement activities have been well accepted by the public, in contrast to an earlier nighttime enforcement demonstration program in Montgomery County using both checkpoints and night vision goggles which generated some unfavorable publicity.
Maryland’s 20 years of experience with seat belt law enforcement have convinced the public that unbuckled occupants can expect to be ticketed. Maryland’s relatively low belt law fine of $25, with no court costs, encourages officers to cite violators; 93% of the belt law citations are paid without being contested.
Publicity. Maryland has used earned media to publicize the annual Chiefs’ Challenge and other occupant enforcement activities since the 1980s. Paid media have been used since 2003, when a total of $600,000 was spent; subsequent media funding has varied between $420,000 and $480,000. About two-thirds of the total media funding is used for television, with the rest devoted to radio and billboards. Of the television funds, about two-thirds buys national spots in major media markets and the remaining third buys local spots on cable and radio.
The paid media spots use an enforcement-centered approach with a local flavor. All Chiefs’ Challenge agencies participate in a pre-Challenge regional meeting. At these meetings, officers from each agency record a radio spot and have footage taken for a “donut” television spot (in which an officer’s footage is inserted between a standard beginning and ending). Billboards use photos of officers from an agency close to the billboard’s location. The ability to buy media time has increased the belt use message penetration substantially. Previously, PSAs were shown quite frequently on cable, as many cable channels had space available. As cable programming and marketing has matured and cable advertising has increased, less free time is available for PSAs.
Earned media features local officers in press events and reporting. MHSO encourages and supports local earned media by providing law enforcement agencies and CTSPs with press kits, fact sheets, and idea samplers and by thanking agencies and CTSPs personally for earned media
C-24

Appendix C. Maryland
coverage. As is often the case, earned media can take advantage of chance events to produce memorable messages. For example, when a seat belt stop revealed that a driver was impaired by drugs, the news story’s lead was “Pothead 101: if you’re on drugs, then buckle up!”
Communications methods beyond television and radio include CIOT messages on MDOT’s variable message signs during April and May, parking lot signs for businesses, and billboards.
Special communications are directed to populations with low belt use.
• Pickup trucks: the Buckle Up Tough Guy campaign uses NASCAR imagery and builds on a pickup truck driver’s sense of safety in a big truck – “Maybe you don’t think will get hurt or killed in your big pickup truck, but if you’re not buckled up, you will get a ticket”
• Ethnic groups: most occupant protection materials are available in both Spanish and English. Paid spots and PSAs are run on Spanish-language radio and television stations.
• Buckle Up Religiously materials in Spanish and English are distributed to a wide group of religious organizations.
• Radio spots are purchased on stations and in time slots that will reach low belt use populations.
Outreach. Maryland’s outreach to community organizations is conducted through individual law enforcement agencies and community traffic safety programs (CTSPs). The Pacesetter program encourages law enforcement agencies to work with community organizations including schools, businesses, civic groups, and religious institutions. Participating agencies and organizations must conduct two unannounced belt use surveys of the organization’s drivers, for example in parking lots or driveways. Pacesetter awards are given if belt use is at least 92% in both surveys. Over 150 Pacesetter awards were made in 2006.
Using block grants, MHSO funds 24 CTSPs to conduct a variety of traffic safety activities. Each CTSP allocates its funds in accordance with MHSO priorities and its own problem identification analyses. Many of the CTSPs are operated by law enforcement agencies. Some CTSP funds may be used for enforcement activities, which may include overtime enforcement not directed specifically toward belt law violations. Overtime enforcement can issue belt law citations to violators observed in activities directed towards other traffic violations such as aggressive driving or speeding.
Research and data. Maryland’s belt use surveys are conducted by the local CTSP coordinators, many of whom are law enforcement officers or civilian staff. Oversight and analysis has been provided since 2002 by the National Study Center for Trauma and EMS (NSC) at the University of Maryland School of Medicine. Maryland uses the belt use rates from FARS to confirm the belt use trends in its surveys and to define the remaining unbelted occupant population.
Highway safety management and culture. Maryland has enjoyed strong statewide leadership on traffic safety issues for many years, from the governor on down. Governor Schaefer set the tone when the original secondary law was enacted, with the phrase “It’s a secondary law, but life
C-25

Appendix C. Maryland
is a primary issue.” Maryland Department of Transportation Secretaries and State Highway Administrators have been strong traffic safety advocates and have shown their support by appearing in person at traffic safety events. Members of the legislature, especially the sponsors of Maryland’s primary enforcement seat belt law, continue to be active supporters and spokespersons for safety belt use.
The MHSO works very closely with the NHTSA Region 3, helped by the Regional office’s location in Baltimore. Maryland participates in several multi-State Regional programs. A member of the NHTSA Region 3 office serves as a member of the annual Maryland Chiefs’ Challenge Board of Judges, participates or submits information for the quarterly meetings of the Occupant Protection Task Force and Safe Kids Maryland State Coalition, and provides information and assistance on grants, new technology, research, and products.
Plans for 2007. Maryland will continue its 2006 strategy: highly publicized belt law enforcement in April and May, culminating in the 2-week CIOT mobilization. Notable activities and emphasis areas will include:
• The 2007 CIOT kickoff event at Oriole Park in Baltimore;
• A celebration of the 10th anniversary of Maryland’s primary law;
• Increased nighttime enforcement;
• Border to Border multi-jurisdictional enforcement activities both within Maryland and with neighboring states;
• An emphasis on proper belt use, especially for women;
• Continuing child passenger safety activities with an emphasis on “family occupant protection” and providing information for occupants of all ages;
• More cable, with local spots, using cable’s ability to segment spots to specific audience locations.
• Radio campaigns targeted to low-use audiences in the Baltimore and Washington Metropolitan areas.
Maryland’s 2007 goal was to reach 92.5% belt use. It exceeded this goal with a 2007 use rate of 93.1%.
Final thoughts
• Law enforcement is the key: strong support for belt law enforcement throughout the year, especially from State Police and most county and municipal agencies, without CIOT paid overtime.
• Creating and maintaining law enforcement support requires personal relationships developed over a long time, constant communications, feedback, rewards, listening to and fixing problems, and simple thanks for jobs done well.
C-26
Appendix C. Maryland
References
Interviews on March 19, 2007, with Meg Miller, MHSO Occupant Protection Coordinator Barbara Beckett, Maryland Committee For Safety Belt Use Executive Director Beth Baker, Administrator, NHTSA Region 3 Valerie Gompf, Deputy Administrator Stephanie Hancock, Program Manager Bill Naff, Program Manager
Beckett, B.W. and Miller, M.G. (2006). 2006 Maryland Chiefs’ Challenge Idea Sampler. Hanover, MD: Maryland Highway Safety Office.
Solomon, M.G. and Chaffe, R.H.B. (2005). Evaluation of the May 2004 Mobilization: Programs to Increase Safety Belt Use. Final report, contract DTNH22-99-D-25099. Washington, DC: National Highway Traffic Safety Administration.
Solomon, M.G., Chaudhary, N.K, and Cosgrove, L.A. (2004). May 2003 Click It or Ticket Safety Belt Mobilization Evaluation. Final report, contract DTNH22-99-D-25099. Washington, DC: National Highway Traffic Safety Administration.
C-27

Appendix C. Michigan
Michigan
Summary
• Belt use law: Michigan enacted a secondary enforcement seat belt use law in 1985 and changed to primary enforcement in 2000. The fine is $25; other fees raise the total cost of a citation to $65.
• Belt use: Michigan’s belt use rate increased 13 percentage points to 83.5% in 2000, the first year of the primary law. After three years with little change, belt use then increased to 90.5% in 2004, 92.9% in 2005, 94.3% in 2006, and 94.0 in 2007.
• Michigan’s strategies: The belt use increases from 2004 on are due to extensive use of enforcement zones, Michigan’s high-visibility belt law enforcement strategy. In an enforcement zone, a spotter observes unbelted occupants and a downstream officer stops them and issues citations. In 2006, 55 counties that include over 90% of Michigan’s population conducted enforcement zones during the statewide May mobilization. Some counties conducted additional enforcement zones during the summer.
• Media and messages: Michigan uses paid media, targeted to the unbelted population (young males, teens, rural areas). The messages emphasize the likelihood of enforcement and the $65 cost of a ticket (Buckle Up or Pay Up). Message placement emphasizes media and locations focused on the target audiences such as convenience stores, auto parts shops, local drinking establishments and pizza restaurants.
• Management: Michigan’s Office of Highway Safety Planning sets explicit goals, develops strategies based on extensive belt use and demographic data, works closely with law enforcement and other partners to implement these strategies, evaluates results, and adjusts strategies and activities as needed. The Office is highly professional, well-staffed, and free from political influence.
• Plans for 2007: Michigan has set a goal of reducing traffic fatalities below 1,000 in 2007. Increasing belt use even further is the key strategy. The enforcement zone campaign, with paid media, will target young males and pickup truck drivers. Michigan will begin to conduct high-visibility enforcement during regular nighttime patrol operations.
Status in 2007
Michigan has a primary belt use law covering all front seat occupants and rear seat occupants aged 4-15. The fine is $25; other fees raise the total cost of a belt citation to $65. Michigan’s belt use rate in 2006 was 94.3%, second only to Washington’s 96.3%, and was essentially the same at 94.0% in 2007. The belt use rate for front seat passenger vehicle occupant fatalities in FARS 2005 was 65%, third behind Oregon’s 70% and California’s 66%.
C-28

1996 1997 1998 1999 2000 2001 2002 2003 2004 2005 2006 2007 66.1 66.9 69.9 70.1 83.5 82.3 82.9 84.8 90.5 92.9 94.3 94.0
Appendix C. Michigan
Background
In 1985, Michigan became the third State to enact a seat belt use law. It was a secondary enforcement law, covering all front seat passengers, with a $25 fine. By the late 1990s, belt use was inching up very slightly from year to year, finally reaching 70% in 1999 (see Table 1). In 2000, Michigan changed its belt law to primary enforcement, which increased belt use 13 percentage points to 83.5%.
Table 1. Michigan belt use, 1996-2007
From 2000 to 2002, belt use remained relatively stable in the low 80% range. It began to increase in 2003, jumped above 90% in 2004, and has continued to increase since then. Over this time period, Michigan’s traffic fatalities dropped from 1,382 in 2003 to 1,085 in 2006, a decrease of 21%. This report concentrates on Michigan’s activities from 2000 to 2006, after the primary law was implemented, that produced this increase. The activities in 1998 through 2000, when the primary law was enacted and implemented, are documented thoroughly in NHTSA (2001) and are summarized briefly below.
Michigan includes both the home of the nation’s automobile industry and extensive rural regions. Its area of 96,716 square miles ranks 11th of the 50 States; its 2005 population of 10,121,000 ranks 8th. The population is concentrated in the southern half of Michigan’s Lower Peninsula. The Upper Peninsula is very rural, containing one-third of Michigan’s land area but only 3% of its population and no cities exceeding 25,000. Detroit is Michigan’s largest city, with a population just under one million. Seven other cities exceed 100,000 and 37 have populations between 25,000 and 100,000. Michigan has 83 counties, over 600 law enforcement agencies in addition to the Michigan State Police (MSP), and over 19,000 sworn officers.
Michigan’s traffic safety activities are managed by the Office of Highway Safety Planning (OHSP), led by Michael Prince. OHSP is a Division within the MSP. The office has a staff of over 20 professionals and 5 support personnel.
How Michigan achieved 94.3% belt use
1986-2000: Enact and implement a primary belt use law. The efforts to change Michigan’s secondary law to primary took a dozen years of hard work. Key factors, documented in detail in NHTSA (2001), include consistent support from Governor Engler and effective legislative sponsors; a broad coalition with over 85 members; a consistent message that a “standard” law (just like all other traffic laws) will save lives, prevent injuries, and save taxpayer dollars; professional lobbying help in the legislature; and dealing directly with a key issue by requiring a three-year study of harassment complaints after the law change.
The primary law did not become effective until March 2000, ten months after it was enacted. OHSP worked very hard during this time to publicize the new law extensively to the public and
C-29

Appendix C. Michigan
to law enforcement. OHSP believes that their productive use of this lead time, followed by extensive publicity and enforcement during the law’s initial months, were key factors in the 13 percentage point belt use increase. Law enforcement activities included selling the importance of belt law enforcement through training, grants and incentives, peer-to-peer marketing, and joint enforcement operations. Publicity activities included a professionally-designed campaign; use of the Click It or Ticket message following focus group testing of several alternatives; use of paid, donated, and earned media; and participation of many partners. See NHTSA (2001) for further detail.
2002: First Click It or Ticket programs. In 2002, two years after the primary law was implemented, Michigan participated in the May national Click It or Ticket (CIOT) demonstration program as a “limited participation” state. The CIOT model consists of a short (typically two week) intense period of high-visibility seat belt law enforcement accompanied by extensive earned media and paid advertising. Michigan approached the CIOT model cautiously, for two reasons. First, Michigan’s primary belt law had been in effect for only two years. In passing and implementing the law, Michigan had been very careful to assure that the law would be enforced consistently and fairly. OHSP did not wish a CIOT program to be viewed as overly-aggressive enforcement that might in turn produce a backlash against the primary law itself. Second, Michigan does not allow checkpoints for seat belt, impaired driving, or other traffic law violations. CIOT enforcement programs needed to use methods that could never appear to be checkpoints. So Michigan’s CIOT enforcement used saturation patrols that concentrated on belt violations.
Michigan’s limited participation meant that paid advertising and citations both were lower than in full participation states. Michigan spent $650,000 on paid advertising, or about 6 cents per resident, while the ten full implementation states spent from 6 to 33 cents per resident, with a median expenditure of 14 cents. Michigan issued 5,463 citations during the program period, or 5 per 10,000 residents; the full implementation states issued from 9 to 40 citations per 10,000 residents, with a median of 20 (Solomon et al., 2002).
Michigan’s belt use fell from 82.3% before the CIOT program to 80.0% immediately afterwards. In telephone surveys, just over one-third of Michigan residents were aware of special belt law enforcement efforts, only slightly more than in states that did not participate in the CIOT program (Solomon et al., 2002). Michigan conducted its own evaluation that compared three counties where the CIOT enforcement and media activities were conducted to three other counties where they were not. Its surveys also concluded that the CIOT program “did not appear to have increased belt use in the experimental region” (Eby et al., 2002).
In the fall of 2002, 18 of Michigan’s most populous counties participated in the two-week Thanksgiving CIOT mobilization. More than 19,000 safety belt citations were written during the mobilization. Michigan’s surveys showed no change in statewide belt use after the mobilization. At best, the mobilization may have prevented belt use from decreasing as winter approached, as had been observed in previous years (Eby and Vivoda, 2003).
2003: Enforcement zones and a new message. The slight dip in belt use from 2000 to 2002 and the lack of impact of the 2002 CIOT mobilizations convinced OHSP that something more was
C-30
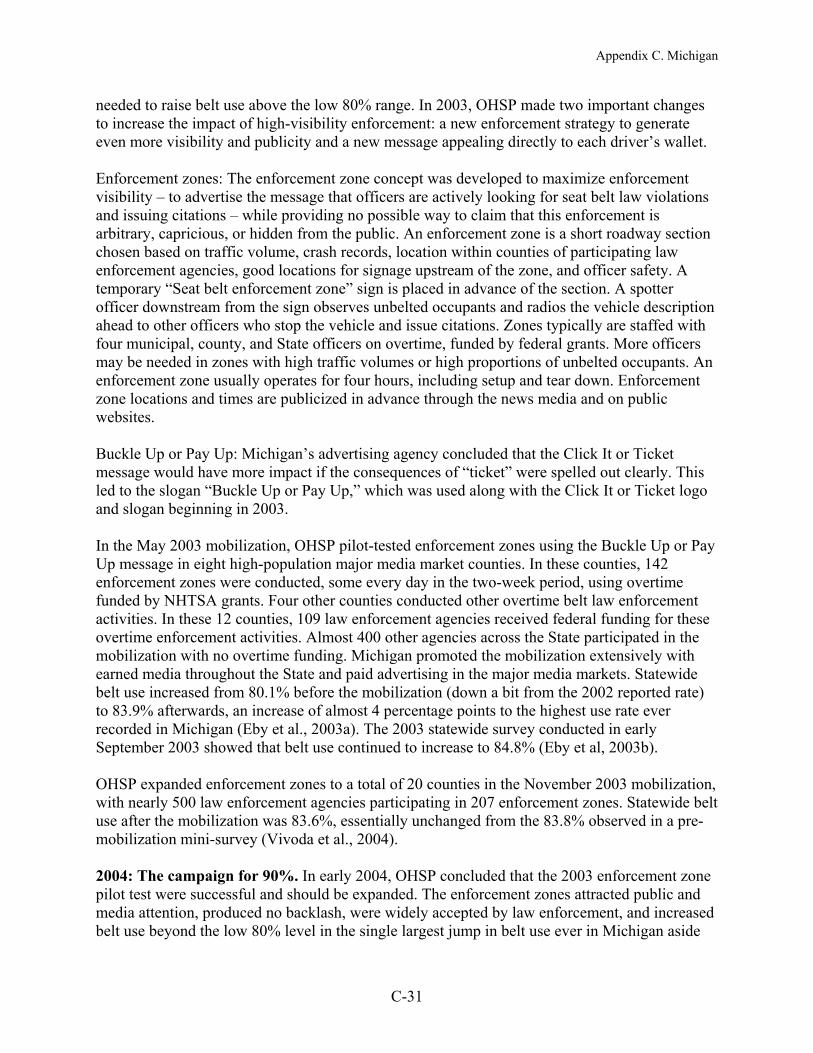
Appendix C. Michigan
needed to raise belt use above the low 80% range. In 2003, OHSP made two important changes to increase the impact of high-visibility enforcement: a new enforcement strategy to generate even more visibility and publicity and a new message appealing directly to each driver’s wallet.
Enforcement zones: The enforcement zone concept was developed to maximize enforcement visibility – to advertise the message that officers are actively looking for seat belt law violations and issuing citations – while providing no possible way to claim that this enforcement is arbitrary, capricious, or hidden from the public. An enforcement zone is a short roadway section chosen based on traffic volume, crash records, location within counties of participating law enforcement agencies, good locations for signage upstream of the zone, and officer safety. A temporary “Seat belt enforcement zone” sign is placed in advance of the section. A spotter officer downstream from the sign observes unbelted occupants and radios the vehicle description ahead to other officers who stop the vehicle and issue citations. Zones typically are staffed with four municipal, county, and State officers on overtime, funded by federal grants. More officers may be needed in zones with high traffic volumes or high proportions of unbelted occupants. An enforcement zone usually operates for four hours, including setup and tear down. Enforcement zone locations and times are publicized in advance through the news media and on public websites.
Buckle Up or Pay Up: Michigan’s advertising agency concluded that the Click It or Ticket message would have more impact if the consequences of “ticket” were spelled out clearly. This led to the slogan “Buckle Up or Pay Up,” which was used along with the Click It or Ticket logo and slogan beginning in 2003.
In the May 2003 mobilization, OHSP pilot-tested enforcement zones using the Buckle Up or Pay Up message in eight high-population major media market counties. In these counties, 142 enforcement zones were conducted, some every day in the two-week period, using overtime funded by NHTSA grants. Four other counties conducted other overtime belt law enforcement activities. In these 12 counties, 109 law enforcement agencies received federal funding for these overtime enforcement activities. Almost 400 other agencies across the State participated in the mobilization with no overtime funding. Michigan promoted the mobilization extensively with earned media throughout the State and paid advertising in the major media markets. Statewide belt use increased from 80.1% before the mobilization (down a bit from the 2002 reported rate) to 83.9% afterwards, an increase of almost 4 percentage points to the highest use rate ever recorded in Michigan (Eby et al., 2003a). The 2003 statewide survey conducted in early September 2003 showed that belt use continued to increase to 84.8% (Eby et al, 2003b).
OHSP expanded enforcement zones to a total of 20 counties in the November 2003 mobilization, with nearly 500 law enforcement agencies participating in 207 enforcement zones. Statewide belt use after the mobilization was 83.6%, essentially unchanged from the 83.8% observed in a pre-mobilization mini-survey (Vivoda et al., 2004).
2004: The campaign for 90%. In early 2004, OHSP concluded that the 2003 enforcement zone pilot test were successful and should be expanded. The enforcement zones attracted public and media attention, produced no backlash, were widely accepted by law enforcement, and increased belt use beyond the low 80% level in the single largest jump in belt use ever in Michigan aside
C-31
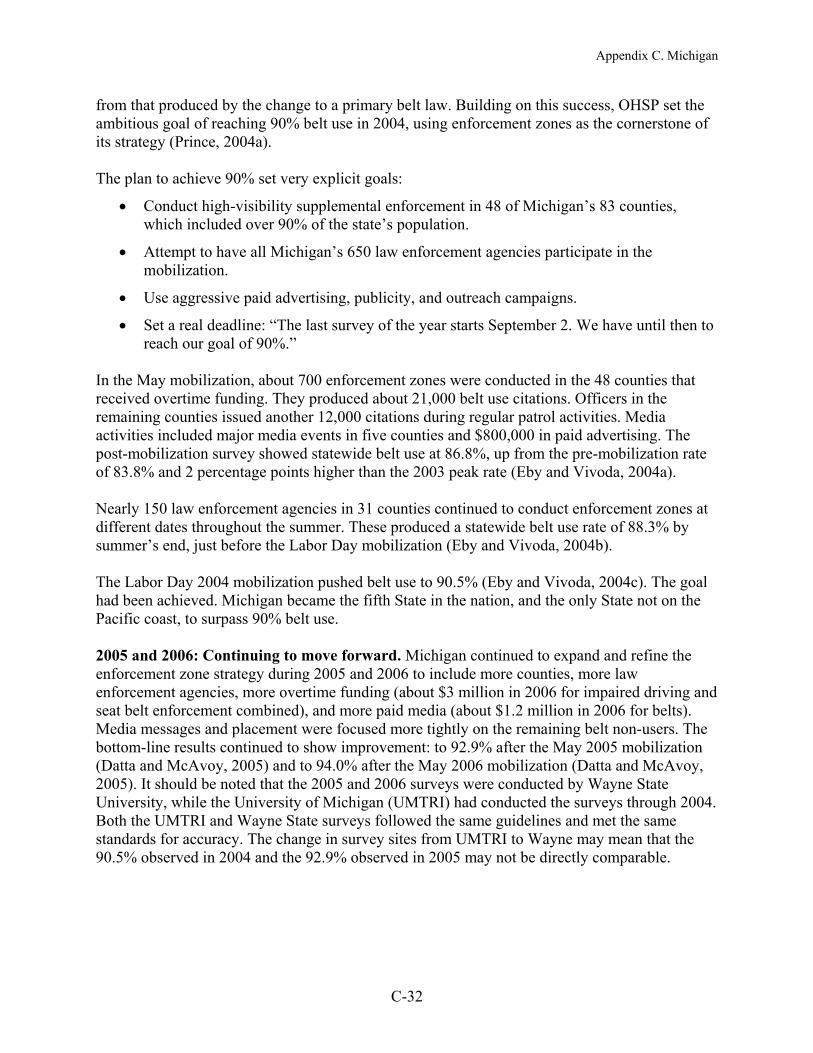
Appendix C. Michigan
from that produced by the change to a primary belt law. Building on this success, OHSP set the ambitious goal of reaching 90% belt use in 2004, using enforcement zones as the cornerstone of its strategy (Prince, 2004a).
The plan to achieve 90% set very explicit goals:
• Conduct high-visibility supplemental enforcement in 48 of Michigan’s 83 counties, which included over 90% of the state’s population.
• Attempt to have all Michigan’s 650 law enforcement agencies participate in the mobilization.
• Use aggressive paid advertising, publicity, and outreach campaigns.
• Set a real deadline: “The last survey of the year starts September 2. We have until then to reach our goal of 90%.”
In the May mobilization, about 700 enforcement zones were conducted in the 48 counties that received overtime funding. They produced about 21,000 belt use citations. Officers in the remaining counties issued another 12,000 citations during regular patrol activities. Media activities included major media events in five counties and $800,000 in paid advertising. The post-mobilization survey showed statewide belt use at 86.8%, up from the pre-mobilization rate of 83.8% and 2 percentage points higher than the 2003 peak rate (Eby and Vivoda, 2004a).
Nearly 150 law enforcement agencies in 31 counties continued to conduct enforcement zones at different dates throughout the summer. These produced a statewide belt use rate of 88.3% by summer’s end, just before the Labor Day mobilization (Eby and Vivoda, 2004b).
The Labor Day 2004 mobilization pushed belt use to 90.5% (Eby and Vivoda, 2004c). The goal had been achieved. Michigan became the fifth State in the nation, and the only State not on the Pacific coast, to surpass 90% belt use.
2005 and 2006: Continuing to move forward. Michigan continued to expand and refine the enforcement zone strategy during 2005 and 2006 to include more counties, more law enforcement agencies, more overtime funding (about $3 million in 2006 for impaired driving and seat belt enforcement combined), and more paid media (about $1.2 million in 2006 for belts). Media messages and placement were focused more tightly on the remaining belt non-users. The bottom-line results continued to show improvement: to 92.9% after the May 2005 mobilization (Datta and McAvoy, 2005) and to 94.0% after the May 2006 mobilization (Datta and McAvoy, 2005). It should be noted that the 2005 and 2006 surveys were conducted by Wayne State University, while the University of Michigan (UMTRI) had conducted the surveys through 2004. Both the UMTRI and Wayne State surveys followed the same guidelines and met the same standards for accuracy. The change in survey sites from UMTRI to Wayne may mean that the 90.5% observed in 2004 and the 92.9% observed in 2005 may not be directly comparable.
C-32
Appendix C. Michigan
The Michigan model: high-visibility enforcement using enforcement zones with the Buckle Up or Pay Up message
By 2007, the Michigan model had been further refined. It remains built around two statewide high-visibility mobilizations. The May occupant protection mobilization around Memorial Day uses enforcement zones; the September impaired driving mobilization around Labor Day uses saturation patrols. It has five key and mutually complementary components: law enforcement, publicity, outreach, research and data, and management.
Law enforcement. Participation in the enforcement zones was based on several principles.
• Mutual respect: Michigan’s OHSP enjoys great respect from law enforcement throughout the state, in part because OHSP is located within the Michigan State Police – OHSP shares the State Police values and professionalism – and in part because OHSP always has made law enforcement activities the heart of every year’s traffic safety programming (more than half of all OHSP-funded activities involve law enforcement in some manner). OHSP has a special relation with county sheriffs because OHSP manages a $14 million state-funded grant program to reduce crashes on secondary roads.
• Early buy-in: enthusiastic law enforcement participation is essential for any enforcement strategy. Michigan consulted closely with law enforcement throughout the State – State Police, county sheriffs, and municipal police – before launching the enforcement zone program. Michigan continues to involve law enforcement at all levels in planning each year’s campaign.
• Multi-agency participation: enforcement zones are staffed by municipal police, county sheriffs, and State Police officers.
• Breadth: enforcement zones are conducted in more than two-thirds of Michigan’s counties, which include over 90% of the state’s population.
• Funding: zones are staffed with overtime funding from the state, using NHTSA grant funds. In 2006 this provided about $3 million for both belt and impaired driving overtime enforcement.
• Law enforcement challenge: to encourage participation, Michigan operates a law enforcement challenge program. All agencies participating in at least one mobilization are invited to an annual banquet. All participating agencies are eligible for grants to purchase traffic safety equipment such as radar units or PBTs. In 2006, four $10,000 grants and one $35,000 grant were awarded.
• Local decision-making: while all agencies participate in the May and Labor Day mobilizations, counties may conduct other enforcement zone or saturation patrol operations based on local problem identification at times of their choosing during the summer.
• Regular communications: Michigan’s Law Enforcement Liaisons (LELs) work with all participating agencies to plan, conduct, evaluate, and revise all traffic safety enforcement activities, including the seat belt mobilizations and enforcement zones.
C-33
Appendix C. Michigan
Publicity. OHSP publicizes the enforcement zones with a mix of earned, paid, and partner-provided communications. Every enforcement zone is publicized locally through local media markets. Interest from the media continues to increase each year. In addition to press releases and planned events, publicity is generated through unplanned news events such as driver calls to local drive-time radio call-in shows (“They’re giving belt tickets at Fifth and Main this morning.”), anecdotes about unusual things observed during enforcement zone operations (the person driving away unbelted after committing a robbery who was stopped at an enforcement zone), and creative ways of operating an enforcement zone (a spotter officer on horseback). Paid media are used in major media markets only during the May and September mobilizations. $1.2 million was spent on paid media in 2006.
Everyone in Michigan now knows that seat belts prevent or reduce crash injuries and that belt use is required by law. There’s no need to repeat these facts, and there’s no need to continue to convince the more than 90% who buckle up regularly. This means that publicity is targeted to the unbuckled drivers and passengers, using messages that they will believe, delivered where they will be seen. The 2006 campaign again was directed at young males and, in conjunction with the NHTSA Region 5 Rural Demonstration project, Michigan placed special emphasis on its rural communities – the populations with the lowest belt use rates in Michigan’s surveys. The Buckle Up or Pay Up message was refined further for this audience to emphasize that the overall cost of a belt citation was $65, including fees as well as the $25 face value of the citation. Posters placed in locations frequently visited by young males illustrated this cost in terms appropriate to the location: “50 bottles of pop or 1 seat belt ticket” in convenience stores; “48 air fresheners or 1 seat belt ticket” in auto parts stores; “If you don’t wear your seat belt, you’ll be flushing 65 bucks” over urinals in bars. Stickers saying “$65 – it’s a lot of pizza or 1 seat belt ticket” were placed on pizza cartons.
Outreach. OHSP worked closely with many key constituencies when planning the first enforcement zone activities in 2003 and 2004 to allay potential concerns about overly-aggressive or targeted enforcement. These constituencies included the ACLU, NAACP, judges and magistrates, prosecutors, and special populations such as the Arab community in Dearborn. In subsequent years, OHSP involved a wide variety of partners to promote and publicize belt use overall and the Memorial Day and Labor Day mobilizations. Examples from 2004 include (Prince, 2004b):
• General Motors: banners at worksites.
• State Chamber of Commerce: article in magazine for members.
• University of Michigan: announcements at football stadium during fall games.
• State Welcome Centers: staff at booths wear CIOT shirts.
• State lottery: electronic messages on machines.
• 4-H: article and web link.
• Schools: PA announcements and TV spots.
C-34

Appendix C. Michigan
• Health and medical: materials to Hope Network, Brain Injury Association, Michigan Association of EMTs, Emergency Nurses CARE, Detroit Medical Center, Mott Children’s Hospital.
• Courts: newsletter article and meetings with court and prosecutor organizations.
• AAA: newsletter article.
• Consumer’s Energy: company-wide promotion with banners, flyers, key chains.
• Detroit Tigers: banners and announcements at field, special promotions before May and Labor Day mobilizations.
• Michigan State Fair: promotions.
Research and data. All Michigan’s highway safety activities, not just belt use programs, use data and research to identify problem areas, develop strategies, evaluate results, and refine strategies as needed. Michigan is favored with two world-class transportation research institutions at the University of Michigan Transportation Research Institute (UMTRI) and the Wayne State Transportation Research Group. UMTRI and Wayne State have conducted many studies for the SHSO over the past 20 years. UMTRI conducted 39 belt use surveys from 1984 to 2005 that provide a consistent and accurate measure of statewide belt use trends (Eby et al., 2005). Wayne State conducted the May mobilization evaluation surveys in 2005 and 2006. Both the UMTRI and Wayne State surveys identify belt use by geographic area, day of week, time of day within daylight hours (7 am to 7 pm), vehicle type, and occupant age, sex, race, and seating position. These data enable enforcement zone operations and publicity to target the unbelted occupants.
Michigan has used the same advertising agency for many years. The agency has extensive experience in social marketing – advertising to change behavior, not to sell a product. To develop belt use messages, such as “Buckle Up or Pay Up,” the agency first uses the survey data to identify the target population, uses its knowledge of this population to create potential messages, and pilot tests these messages in focus groups. Once the agency and the SHSO agree on the most effective and appropriate messages, the agency uses its experience to select how to place the messages most effectively to reach the target population.
The SHSO uses telephone surveys to measure the impact of its belt use and enforcement zone publicity both by assessing overall awareness of belt law enforcement and by measuring key factors such as the perceived risk of receiving a ticket for being unbelted (Price, 2004).
Highway safety management and culture. Perhaps because of the automobile industry’s role in the State, traffic safety has been a high priority in Michigan for many years. Michigan had a traffic safety commission in the 1940s. Richard Austin, Michigan’s Secretary of State from 1971 to 1994, strongly supported traffic safety activities.
Michigan’s OHSP is a Division within the Michigan State Police. This location provides both internal and external benefits. Externally, OHSP shares the credibility, respect, and freedom from political interference of the State Police. OHSP Director Prince is Michigan’s Governor’s Highway Safety Representative, a career position rather than a political appointment. Director
C-35

Appendix C. Michigan
Prince is only the sixth Governor’s Representative since the creation of the OHSP in 1969; the resulting leadership stability is recognized as one of the program’s strengths. Internally, OHSP has a strong history of long-range planning based on sound data and research; regular evaluation to measure success against defined objectives and adjust activities as needed; and the stability to follow through with these plans without having to react to a politically-driven “flavor of the month.”
OHSP has a highly-educated and dedicated staff of over 20 professionals and 5 support personnel. Staff turnover is very low. OHSP hired a full-time seat belt mobilization coordinator in 2003 to organize and oversee all plans, meetings, communications, media, and evaluations; now that mobilizations are more routine, the staff member has taken on other duties as well. OHSP has in-house analytical staff to provide quick responses to inquiries and requests for information from legislators, media, and others as well as to work on longer-term analytical projects. OHSP has a full-service communications staff including a communications manager, two communications specialists for earned media and marketing, a graphic artist, and support staff. OHSP has a coordinator for its Law Enforcement Liaisons (LELs).
Plans for 2007. OHSP isn’t content with the 2006 use rate of 94.3%. The data show why. First, observation surveys document clearly the occupants who still are unbelted: by county, day of week, time of day within daylight hours (7 am to 7 pm), vehicle type, and occupant age, sex, and race (Datta and McAvoy, 2006). Second, while belt use in surveys exceeds 90%, FARS data show that only 65% of fatally-injured front seat passenger vehicle occupants were belted in 2005; during nighttime hours, only 51% were belted. The remaining unbelted occupants are the most likely to be involved in serious crashes. This means that each percentage point increase in belt use, while increasingly more difficult to obtain, likely will produce increasingly larger reductions in traffic fatalities and serious injuries.
OHSP has set another goal: to reduce traffic fatalities below 1,000 in 2007. Increasing belt use is the key strategy to reach this goal, as it has been in the past. The 2007 enforcement zone campaign will continue to target young males and will add an emphasis on pickup truck drivers. In addition, Michigan will begin to target media messages at nighttime belt use and will back these up with high-visibility enforcement during regular nighttime traffic patrol operations.
Final thoughts
• Michigan’s enforcement zones provide highly visible belt law enforcement and generate extensive earned media.
• The Buckle Up or Pay Up message emphasizes the consequences of a belt law ticket. It’s delivered in creative ways directly to the key target audiences of young males and rural drivers.
• OHSP’s excellent relationships with law enforcement agencies throughout the State have produced widespread support for belt law enforcement with many multi-agency enforcement activities.
C-36

Appendix C. Michigan
• OHSP uses data and research to drive and evaluate its strategies, sets goals and tracks progress, and provides strong and consistent leadership.
References
Interviews on February 23, 2007 with Michael Prince, Administrator, Office of Highway Safety Planning Anne Readett, Manager, Communications Section Deborah Savage, Manager, Grants Unit
Datta, T.K. and McAvoy, D. (2005). Evaluation of the 2005 May Click It or Ticket Campaign. Detroit, MI: Wayne State University Transportation Research Group.
Datta, T.K. and McAvoy, D. (2006). Evaluation of the 2006 May Click It or Ticket Campaign. Detroit, MI: Wayne State University Transportation Research Group.
Eby, D.W., Kostyniuk, L.P., Sudharsan, Kl, Vivoda, J.M., and Spradlin, H.K. (2002). The Effects of Paid Media and Enforcement on Safety Belt use in Michigan. UMTRI-2002-27. Ann Arbor, MI: University of Michigan Transportation Research Institute.
Eby, D.W., St. Louis, R.M., and Vivoda, J.M. (2004c). Direct Observation of Safety Belt Use in Michigan: Fall 2005. UMTRI-2005-27. Ann Arbor, MI: University of Michigan Transportation Research Institute.
Eby, D.W. and Vivoda, J.M. (2003). An Evaluation of the “Click It or Ticket” Thanksgiving Mobilization Campaign. UMTRI-2003-05. Ann Arbor, MI: University of Michigan Transportation Research Institute.
Eby, D.W. and Vivoda, J.M. (2004a). A Study of Michigan Safety Belt Use Surrounding the May Mobilization, 2004. UMTRI-2004-24. Ann Arbor, MI: University of Michigan Transportation Research Institute.
Eby, D.W. and Vivoda, J.M. (2004b). Safety Belt use in Michigan Immediately Prior to the Labor Day Mobilization, 2004. UMTRI-2004-33. Ann Arbor, MI: University of Michigan Transportation Research Institute.
Eby, D.W. and Vivoda, J.M. (2004c). Direct Observation of Safety Belt Use in Michigan: Fall 2004. UMTRI-2004-33. Ann Arbor, MI: University of Michigan Transportation Research Institute.
Eby, D.W., Vivoda, J.M., and Spradlin, H.K. (2003a). An Evaluation of the “Click It or Ticket: Buckle Up or Pay Up” Mobilization Campaign. UMTRI-2003-21. Ann Arbor, MI: University of Michigan Transportation Research Institute.
C-37

Appendix C. Michigan
Eby, D.W., Vivoda, J.M., and Spradlin, H.K. (2003b). Direct Observation of Safety Belt Use in Michigan: Fall 2003. UMTRI-2003-40. Ann Arbor, MI: University of Michigan Transportation Research Institute.
NHTSA (2001). Making It Click in Michigan: A Case Study of a Successful Campaign to Raise the Seat Belt use Rate. Washington, DC: National Highway Traffic Safety Administration. www.nhtsa.dot.gov/people/injury/airbags/buckleplan/BUA_WEBSITE/Archive-04/Cases/michigancasestudy.html
Prince, M.L. (2004a). Michigan’s 90% by 2004 Safety Belt Campaign. Briefing package. Lansing, MI: Office of Highway Safety Planning.
Prince, M.L. (2004b). Michigan’s 90% by 2004 Safety Belt Campaign – Update. Briefing package. Lansing, MI: Office of Highway Safety Planning.
Solomon, M.G., Ulmer, R.G.,and Preusser, D.F. (2002). Evaluation of Click It or Ticket Model Programs. DOT HS 809 498. Washington, DC: National Highway Traffic Safety Administration.
Vivoda, J.M., Eby, D.W., and Spradlin, H.K. (2004). An Evaluation of the “Buckle Up or Pay Up: Click It or Ticket” November Safety Belt Mobilization. UMTRI-2004-04. Ann Arbor, MI: University of Michigan Transportation Research Institute.
C-38

Appendix C. Minnesota
Minnesota
Summary
• Belt use law: Minnesota has a secondary enforcement belt use law. The fine is $25; other costs bring the total expense of a citation to between $70 and $115 depending on the jurisdiction.
• Belt use: Minnesota’s belt use rate in 2006 was 83.3%. It rose to 86.2% in June 2007 and rose further to 87.8% in August 2007.
• State’s strategies: Minnesota enforces its secondary belt law year-round, highlighted by high-visibility campaigns in May and October or November under the Safe & Sober banner. Minnesota has followed this strategy consistently for over 15 years, with new messages and activities building on what has been successful.
• Media and messages: Minnesota’s communications are designed and implemented by staff in the Department of Public Safety. They use enforcement messages in paid ads and earned media during the two annual campaigns and social norming messages at other times. The enforcement messages use the CIOT slogan but retain the Safe & Sober logo.
• Management: The Minnesota Office of Traffic Safety is stable and committed. In 2001 Minnesota became one of the first states to embrace the concept of eliminating highway deaths and established the interagency Toward Zero Deaths partnership to plan and coordinate strategies and activities. By 2006 Minnesota already had achieved its 2008 interim goals for the highway fatality total and rate.
• Plans for 2007: Minnesota will add nighttime operations to its long-term strategy of high-visibility enforcement waves in May and October.
Status in 2007
Minnesota has a secondary belt use law covering all front seat occupants and all rear seat occupants under age 11. Farm vehicles used for farm purposes, vehicles making frequent stops, and vehicles traveling under 25 mph are exempt. The fine is $25, but other costs bring the total expense of a citation to about $115 depending on the jurisdiction. Officers in some jurisdictions also have the option of issuing “local administrative fees” instead of regular citations for many traffic violations, including failure to buckle up. These local fees go to the issuing jurisdiction rather than to the State and were instituted as a way to provide funds to local jurisdictions to replace reductions in State funding. Local administrative fee belt law violations are not reported to the State, so total belt law citations cannot be estimated accurately.
Minnesota’s belt use rate in 2006 was 81.9%, fifth highest of all secondary law states. The use rate increased to 86.2% in the June 2007 survey reported to NHTSA and to 87.8% in the August 2007 survey. The belt use rate for front seat passenger vehicle occupant fatalities in FARS 2005 was 47%, third highest of all secondary law States.
C-39

Appendix C. Minnesota
Background
Minnesota has had a secondary enforcement belt use law since 1986. The original law, with no fine for a violation, increased belt use from 20% in June 1986 to 33% in August 1986 after it became effective. The usage rate increased to 47% after a $10 fine was added in 1988 and increased again to 53% after the fine was raised to $25 in 1991 (Walseth and Hedger, 2006). Belt use rose to 65% in 1995, broke the 70% barrier in 1999, and jumped again to 80% in 2002. It has increased fairly steadily slightly since then, reaching 83.9% in 2005 and 86.2% in June 2007 (Table 1). A survey in August 2007 showed a further increase to 87.8%. This report concentrates on Minnesota’s activities since 2000 that produced the recent increases.
Table 1. Minnesota belt use, 1996-2007
1996 1997 1998 1999 2000 2001 2002 2003 2004 2005 2006 2007 64.0 64.8 64.2 71.5 73.4 73.9 80.1 79.4 82.1 83.9 83.3 87.8
Minnesota is a large upper midwest State. Its area of 86,939 square miles ranks 12th of the 50 States; its 2005 population of 5,133,000 ranks 21st. Over half of Minnesota’s residents live in the six counties centered on the Twin Cities of Minneapolis and St. Paul, Minnesota’s only cities over 100,000; outside a 50-mile radius of the Twin Cities, the State is quite rural. Minnesota has 87 counties, about 475 law enforcement agencies, and about 7,000 sworn law enforcement officers.
Minnesota’s traffic safety activities are managed by the Office of Traffic Safety (OTS). Kathryn Swanson directed the office from 1998 until her retirement on April 30, 2007; Cheri Marti became Director in summer 2007. OTS is located within the Minnesota Department of Public Safety (MN DPS). It has about 20 full-time staff. In addition, OTS has employed three full-time Law Enforcement Liaisons (LELs) since 1994 – the first State with permanent LELs – to assist with law enforcement activities statewide.
Legislation to upgrade to a primary belt use law has been introduced regularly and has been supported by a seat belt coalition but has failed to be enacted. In recent years the legislation has received strong support in the Senate but not in the House. In OTS surveys, about three-quarters of Minnesotans believe that the current law is already primary (74% in 2006) and approve of a primary law (70% in 2006). Upgrade legislation was again introduced in 2007 but again was not enacted.
How Minnesota achieved 87.8% belt use
Minnesota’s overall belt use strategy has been persistence: steady belt use publicity and enforcement for more than 15 years, with new messages and programs building on what’s proven to be successful and familiar. It’s a strategy of evolution, not revolution.
1990s: Operation Buckle Down leads to Safe & Sober. Minnesota began belt use law enforcement in 1988, when the $10 fine was implemented. Enforcement became more serious in the early 1990s under the Operation Buckle Down slogan. Overtime enforcement to supplement
C-40
Appendix C. Minnesota
regular patrols began in 1995 as part of the joint impaired driving and seat belt initiative Campaign Safe & Sober; overtime enforcement funding rose gradually from $107,130 in 1995 to $508,760 in 2007. In the 12 months October 1997 – September 1998, officers issued an estimated 42,269 seat belt citations, only 14% of which were written during overtime operations (Folch, 2004). Belt use rose from 53% in 1991 to 72% in 1999.
In November 1999 and May 2000, OTS strongly encouraged agencies to participate in the Operation ABC national mobilizations organized by the Air Bag & Seat Belt Safety Campaign and NHTSA, though Minnesota conducted its activities under the Safe & Sober slogan and logo. Seat belt citations for the year October 1999 – September 2000 increased by 50%, to an estimated 60,890, about one-quarter of which were written during paid overtime operations. In 2001, Minnesota used $100,000 to purchase its first paid media for seat belt programs. The paid media promoted health and safety messages, not the enforcement message that unbelted occupants would be ticketed.
2002: Click It or Ticket. In May 2002, Minnesota joined other Region 5 States in the May Click It or Ticket (CIOT) mobilization but continued to use the Safe & Sober slogan and logo. About 57% of Minnesota’s law enforcement agencies participated. Overtime enforcement grants increased to $429,560 and paid media to $350,000; the paid media continued to use health and safety messages. Belt use reached 80% for the first time.
2003 – 2006: Continuing to move forward. Through 2006, Minnesota continued to conduct two annual CIOT mobilizations in May and November, still under the Safe & Sober banner (the Minnesota Safe & Sober logo is displayed at the top of the OTS website www.dps.state.mn.us/ots/). Minnesota also continued Safe & Sober impaired driving campaigns; the CIOT mobilizations are “the seat belt waves of Safe & Sober.” The first paid media enforcement messages appeared in 2003 with the CIOT message but not the CIOT logo. Agency participation gradually increased so that in 2006 about two-thirds of Minnesota’s approximately 475 agencies participated in the mobilizations in some way and about 140 received funding for overtime enforcement.
The Minnesota model: year-round enforcement highlighted by two annual high-visibility campaigns
Law enforcement. The basic strategy remains the same as it has for the past 15 years: year-round enforcement of Minnesota’s secondary belt law, emphasized and publicized by two high-visibility campaigns in May and October (the fall campaign was shifted from November to October as of 2007 to separate it from the December impaired driving campaign). Checkpoints are not permitted in Minnesota. A few agencies use saturations patrols but most conduct their campaign activities by increasing their concentration on seat belt violations, especially when on paid overtime patrol. Minnesota’s secondary enforcement law requires officers to observe “another moving violation” before they can stop a vehicle with an unbelted occupant, but they can issue a belt citation without issuing another citation for the other violation. Minnesota does not accept the secondary law as an excuse for failing to issue belt citations: “If you’re not issuing belt citations, then everyone in your jurisdiction must be buckled up, and you don’t need a grant
C-41
Appendix C. Minnesota
to enforce the belt use law on your traffic patrols.” Minnesota issued 2.3 belt citations per 1,000 population in the May 2006 campaign, a rate comparable to many primary law States.
As in many States, some Minnesota officers were initially reluctant to issue belt citations, especially since the citation would cost the recipient at least $70. Minnesota used its customary persistence to overcome this attitude by convincing officers of the importance of belt use in reducing injuries and fatalities. Minnesota’s three LELs were key both in educating officers about belt use and in convincing agencies to participate in the annual campaigns.
Participation in the annual campaigns is extremely simple: agencies need only submit a straightforward application, conduct some form of seat belt enforcement activity, and report the number of citations issued. Each participating agency receives some inexpensive equipment such as flashlights or duty bags. Nine participating agencies, drawn at random, receive equipment valued at several thousand dollars, such as radar units. When smaller agencies receive these awards, they produce substantial local media coverage.
Publicity. OTS funds three full-time staff in the MN DPS Office of Communications. They provide OTS with the complete communications and public relations services for which most States must contract with a private agency. These services include campaign development and implementation, market research, message development and testing, product development (create and produce radio and television PSAs and ads, posters, gas pump toppers, news releases, fact sheets, talking points, and more), product placement, and evaluation. Their clever and effective creative work and high-quality products regularly win awards; for example, in 2007 the MN DPS won seven of the thirteen regional AAMVA PACE (Public Awareness and Consumer Education) Awards in categories ranging from radio and television PSAs to marketing campaigns. As another example, the October 2007 campaign kickoff was held in a Minneapolis high school gymnasium and featured cheerleaders performing a “spirited, high-energy ‘buckle up’ cheer.”
OTS and the DPS staff develop annual media and communications plans. Seat belt communications use enforcement messages during the two annual campaigns and social norming messages at other times. The enforcement messages use the CIOT slogan but not the CIOT logo. Minnesota does its own creative work for most products. Paid ads are used during the CIOT campaigns. In return for the paid ads, DPS receives additional on-air time for drive-time interviews or PSAs.
The same television spots are shown across the state. Earned media, interviews, and the like use local law enforcement officers. DPS is proactive in creating and taking advantage of news opportunities to get belt and other OTS messages out: “we make news.” Examples include common occasions such as holidays and the first day of school in the fall as well as more Minnesota-specific events such as the start of fishing and hunting seasons. DPS uses several methods to present seat belt messages to drivers while they are on the road, including drive time radio spots and interviews, gas pump toppers, and MN DOT’s changeable message signs.
To reach 18-34 year old males, DPS partners with the Minnesota Twins (baseball) and Minnesota Wild (hockey) professional teams to create seat belt, impaired driving, and speeding television and radio spots featuring managers, players, and broadcasters. These are used as both
C-42

Appendix C. Minnesota
paid ads and PSAs during sports programming and as in-stadium spots during games and at events such as high school basketball and hockey tournaments. Costs have been extremely low, with the teams and their television networks donating personnel and production costs. These and other materials are available on the OTS website www.dps.state.mn.us/ots/.
In 2006, Minnesota participated in the regional rural initiative, which provided additional paid media belt messages before the May CIOT campaign. Telephone surveys observed little effect from these messages.
Outreach. Minnesota’s seat belt outreach activities with businesses, schools, and organizations are relatively modest. NETS, the Network of Employers for Traffic Safety, provides programs and messages to businesses. Pizza Hut and Taco Bell encourage belt use through post-it notes on delivery packages and coupons for free food items that officers distribute to belted occupants during mobilizations as “Thanks for Buckling Up.” Annual mobilization kickoff events sometimes are held at major businesses such Home Depot or a grocery.
Research and data. Minnesota has conducted belt use surveys annually in August since 1986. The survey was modified in 1994 and was completely redesigned in 2003. In particular, starting in 2003 the survey observed vehicles at controlled intersections rather than in moving traffic. Its reported use rate is the ratio of estimated time on the road that front seat occupants are belted compared to the total time on the road for these occupants, not a simple ratio of observed belted occupants to total occupants (Walseth and Hedger, 2006). As a result, survey results before 2003 are not directly comparable to results from 2003 and afterwards.
Minnesota analyzes its data regularly (see for example Walseth and Hedger, 2006). It has conducted seat belt telephone surveys at least twice annually since 2003.
Highway safety management and culture. Minnesota has had a stable and committed highway safety staff. OTS has had only two directors for most of its 40-year history. In spring 2007, all but two OTS staff had at least five years’ experience. Only five persons have served in the three LEL slots since 1994 – the three current LELs are on a first-name basis with commanders and officers in virtually every Minnesota law enforcement agency. Using its experience and skill, OTS knows what works and what doesn’t work in Minnesota, develops strategies and programs for the long run, and has the experience and persistence to stick with them. OTS has had an occupant protection coordinator for more than 20 years and a full-time belt coordinator since 1999.
Minnesota establishes long-term highway safety goals and develops strategic plans to meet those goals. In 2003 Minnesota became one of the first states to embrace the concept of eliminating highway deaths. It formed Toward Zero Deaths (TZD), an interagency partnership led by the Department of Public Safety and the Department of Transportation, in cooperation with the State Patrol, the Federal Highway Administration, Minnesota county engineers, and the Center for Transportation Studies at the University of Minnesota. TZD’s mission is "To drive Minnesota toward zero deaths on our roads, using Education, Enforcement, Engineering, and Emergency Services" (www.tzd.state.mn.us). The annual TZD “4E” conference provides a focus for TZD programs. The first interim TZD goals were to reduce highway fatalities below 500 and the
C-43
Appendix C. Minnesota
fatality rate per 100 million miles of travel below 1.0 by 2008, starting from a baseline of 657 fatalities and a 1.21 fatality rate in 2002. These goals were achieved two years early. Fatalities dropped to 494 in 2006 (www.dps.state.mn.us/ots/). The fatality rate was 0.99 in 2005 (Walseth and Hedger, 2006) and 0.87 in 2006, among the lowest in the nation. Not content to rest on this success, TZD has established a new goal of reducing fatalities below 400 by 2010. Increasing seat belt use remains the top priority emphasis area in the 2007 update of Minnesota’s Strategic Highway Safety Plan (MnDOT, 2007).
Plans for 2007. Minnesota will continue its successful long-term strategy and will add nighttime operations to the May and October mobilizations.
Final thoughts
• Program stability and persistence: Minnesota has emphasized the same basic belt strategy for over 15 years: educate the public on the benefits of belts and back this up with year-round belt law enforcement highlighted by two annual high-visibility enforcement campaigns.
• Listen to law enforcement: Each annual TZD conference includes an hour and fifteen minute session where law enforcement officers from across the State tell OTS what they like and don’t like about current programs and suggest improvements. OTS takes these suggestions seriously and adjusts program operations as appropriate.
• Leadership and long-term planning: Minnesota’s strong highway safety leadership and experienced staff have established long-term strategic plans and followed through with them, adding and modifying as appropriate but keeping the core principles, strategies, and even logos.
References
Interviews on April 17, 2007 with Kathryn Swanson, Director, Minnesota Office of Traffic Safety Katherine Burke Moore, Associate Director Susan Palmer, grants and occupant protection Dennis Smith, Office of Communications, Minnesota Department of Public Safety
Folch, T. (2004). Belt Citations and Enforcement Programs. PowerPoint presentation. St. Paul, MN: Minnesota Office of Traffic Safety.
MnDOT (2007). Minnesota Strategic Highway Safety Plan Update. St. Paul, MN: Minnesota Department of Transportation. www.dot.state.mn.us/trafficeng/safety/shsp/index.html
OTS (2003). Surveys! Surveys! Surveys! Powerpoint presentation. St. Paul, MN: Minnesota Office of Traffic Safety.
Walseth, J. and Hedger, S. (2006). Minnesota Motor Vehicle Crash Facts 2005. St. Paul, MN: Minnesota Department of Public Safety.
C-44

Appendix C. Nevada
Nevada
Summary
• Belt use law: Nevada enacted a secondary enforcement belt use law in 1987 covering all occupants. The cost of a citation is up to $25, plus court costs, which vary by jurisdiction.
• Belt use: Nevada’s belt use rate in 2006 was 91.2%, highest of all secondary law states, and rose to 92.2% in 2007.
• Nevada’s strategies: Emphasize belt use through highly-publicized multi-jurisdictional Joining Forces traffic enforcement events throughout the year: 13 scheduled for 2007, highlighted by statewide CIOT mobilizations in May and November.
• Media and messages: Nevada uses paid media only in May and November. Earned media attract ample coverage for the Joining Forces events every month.
• Management: Nevada’s Office of Traffic Safety (OTS) uses good management skills and close personal relationships with law enforcement and other partners to multiply the effectiveness of its limited budget and staff.
• Plans for 2007: Nevada will continue to expand its successful strategies with more high-visibility enforcement events involving even more law enforcement agencies. In addition, Nevada is participating in NHTSA’s demonstration of strategies to increase teenagers’ belt use.
Status in 2007
Nevada enacted a secondary belt use law in 1987 covering all front and rear seat occupants. The fine is up to $25; additional court costs vary by jurisdiction. Nevada’s belt use rate in 2006 was 91.2%, highest of all secondary law states, and rose to 92.2% in 2007. The belt use rate for front seat passenger vehicle occupant fatalities in FARS 2005 was 48%, second highest of all secondary states.
Background
Nevada’s secondary enforcement belt use law has been in effect since 1987. The fine is up to $25, but court costs can be substantially more: $42 in Clark County (Las Vegas), bringing the total cost of a belt law violation to $67. Belt use was 75% in 2002 and then increased dramatically to 87% in 2004 and 95% in 2005 before falling off to 91% in 2006. This report examines Nevada’s activities from 2000 to 2006 that produced this dramatic increase.
Table 1. Nevada belt use, 1996-2007
1996 1997 1998 1999 2000 2001 2002 2003 2004 2005 2006 2007 70.1 69.4 76.2 79.8 78.5 74.5 74.9 78.7 86.6 94.8 91.2 92.2
C-45
Appendix C. Nevada
Nevada is a large arid State in the great basin between the Rocky Mountains and the Sierra Nevada. Its area of 110,561 square miles ranks 7th of the 50 States; its 2005 population of 2,415,000 ranks 35th. Most of the residents are clustered in six of Nevada’s 17 counties. Clark County, surrounding Las Vegas, at the State’s southern tip, contains 71% of the 2006 population and produces 64% of the annual vehicle miles of travel (AVMT). Washoe County, containing Reno and Sparks, along the northern edge of the western border, contributes 16% of the population and 16% of the AVMT (Vasudevan et al., 2007b). Four other counties within a reasonable commuting distance of Washoe contain another 9% of the population. Both population centers are growing very rapidly: the Las Vegas metropolitan area by 335,000, or 24%, from 2000 to 2005; the Reno area by 51,000, or 15% (Census, 2007).
The remaining 4% of Nevada’s population (97,000) is scattered across 11 counties containing no cities with more than 25,000 inhabitants. The combined geographical area of these 11 counties exceeds the size of 42 states. As another indication of the low population density outside the Las Vegas and Reno areas, Nevada contains 3.5% of the total area the lower 48 states but only 0.9% of the public road mileage.
Almost one-quarter of Nevada’s inhabitants are Hispanic. Nevada has 30 municipal and county law enforcement agencies, two university police departments at University of Nevada in Las Vegas (UNLV) and Reno (UNR), one junior college and four school district police departments, and the Nevada Highway Patrol (NHP), with about 5,500 sworn officers among all agencies.
Nevada’s traffic safety activities are managed by the Office of Traffic Safety (OTS), led by Chief Charles Abbott. OTS is a small office of about 12 full-time and contracted professional staff, located within the Nevada Department of Public Safety, along with the NHP.
A bill to upgrade Nevada’s seat belt use law to primary enforcement was approved by the Nevada Senate in 2007. While a majority of the Assembly supported the bill, one legislator prevented it from reaching the floor for a vote. The legislation is expected to be introduced again when the legislature next meets in 2009. Primary enforcement appears to have substantial support from the public, and in fact many residents believe that Nevada’s law already permits primary enforcement as do the laws in neighboring California and Oregon.
How Nevada achieved 94.8% belt use
1990s: Stagnant belt use rates. Throughout the 1990s, belt use fluctuated between 70 and 80%, falling back to 74% in 2001 (Table 1). Nevada did not have an occupant protection coordinator and did not participate in national occupant protection campaigns.
2001: Joining Forces. In 2000 OTS began planning multi-jurisdictional belt use law enforcement activities under the Joining Forces banner, with activities beginning in 2001. In 2001 Nevada also began to develop and implement a statewide system for accident reporting and electronic hand-held traffic citations, the Nevada Citation & Accident Tracking System
C-46
Appendix C. Nevada
(NCATS). Both NCATS and Joining Forces helped Nevada’s law enforcement agencies learn to work together and to appreciate the benefits of multi-jurisdictional cooperation and activities.
Joining Forces was modeled after the Three Flags campaigns which had been conducted in Oregon, Washington, and British Columbia since 1993 (NHTSA, 1996; see also the Oregon and Washington case studies in this report). In Joining Forces, agencies conduct simultaneous and frequent multi-jurisdictional high-visibility enforcement campaigns emphasizing belt use and impaired driving (speeding and pedestrian safety were added in 2007). Seven of Nevada’s 31 State, county, and municipal agencies participated in the first Joining Forces activities in 2001.
2002: Click It or Ticket. In May 2002, Nevada participated as a “full implementation” State in the national Click It or Ticket (CIOT) demonstration. Eleven of its law enforcement agencies took part. Because of its secondary enforcement law, Nevada did not adopt the CIOT slogan and logo. Instead, the 2002 campaign used the slogan “No Exceptions– No Excuses – Buckle Up, Nevada,” with the interesting acronym NENEBUN. To promote participation, in 2002 Nevada conducted its first statewide Joining Forces conference in April just prior to the campaign, again modeled after the Three Flags conferences held in Oregon and Washington. The conferences provide specific training and logistical information about upcoming enforcement activities, occupant protection and child passenger safety training for officers, and talks on a broad range of traffic law enforcement issues. Beginning in 2004, OTS held recognition banquets for participants in the northern and southern portions of the State shortly after the annual May mobilization. These no-uniform banquets, with spouses and partners, recognize officers for a variety of Joining Forces activities but do not provide cash or equipment awards. Smaller agencies in the rural areas of Nevada especially appreciate the opportunities these conferences and banquets provide to network with officers from around the State.
For the May 2002 campaign, Nevada spent approximately $290,000 for paid advertising, or about 14 cents per resident. Officers issued 3,570 seat belt law citations, or about 17 per 10,000 residents. Nevada’s belt use increased from 70.6% pre-campaign to 76.4% post-campaign (Solomon et al., 2002). This success encouraged Nevada to continue and expand Joining Forces. The CIOT slogan replaced NENEBUN in 2004. Law enforcement agency participation increased steadily to 23 in 2007 and 30 agencies already have agreed to participate in 2008.
The Nevada model: high-visibility multi-jurisdictional enforcement throughout the year; numerous partnerships to promote belt use
Law enforcement. The Joining Forces cooperative interagency campaigns are the centerpiece of Nevada’s high-visibility belt law enforcement activities. Thirteen separate statewide Joining Forces events will be conducted in 2007, with 14 planned for 2008. Agencies must participate in three mandatory events: the belt mobilizations in May and November and the DUI campaign over Labor Day. The rest are optional. In addition, agencies may conduct one optional local event that’s appropriate for local conditions and activities.
Each event lasts about a week and includes several different activities such as saturation patrols or DUI checkpoints. While each event has a specific theme – occupant protection, DUI, speed, or pedestrians – belt law enforcement is included in all. Participating officers are funded through
C-47

Appendix C. Nevada
paid overtime, with the overtime spread across different officers for different events. Agencies report their activities for each event online using a standard Nevada form that incorporates NHTSA’s reporting requirements (ots.state.nv.us/joining_forces_activity_report_f.shtml).
The officer recognition program has expanded in two directions. In 2007, for the first time, a single statewide banquet was held in September to recognize officers participating in all Joining Forces events throughout the year and also to provide training on traffic safety subjects. In addition, an agency recognition program was begun. Participating agencies earn points for activities such as participation in events, training, reporting, and media activities. One qualifying agency in each of three total point categories will be selected at random to receive an equipment award of $5,000, $10,000, or $15,000.
The NHP is a key participant in all Joining Forces events. Belt use has been a high priority for NHP for many years. In addition to its three district command headquarters, NHP has substations in most of Nevada’s rural counties. NHP frequently is the only other agency that can join in cooperative activities with small rural municipal and county law enforcement agencies that are separated from each other by substantial distances.
Nevada’s secondary law has not been an obstacle to enforcement activities. An officer must observe some other traffic law violation, which may be an equipment or other non-moving violation, before stopping a vehicle with an unbelted occupant. Once the vehicle is stopped, Nevada law requires that the belt citation be issued. A citation for the other violation also may be written or may be waived. The secondary law does not permit checkpoints specifically for belt use, but belt use law violations may be observed and cited at DUI checkpoints. Most belt enforcement activities use saturation patrols or enforcement zones (“wolfpacks”) to put many officers on the streets. Eleven participating agencies conducted some belt enforcement activities at night in 2007. Many vehicles in Nevada have tinted side windows and even windshields which make nighttime observations of belt use difficult.
Publicity. Nevada uses both paid and earned media to publicize its Joining Forces activities. Paid media are used only for the May and November seat belt campaigns and the Labor Day DUI campaign. The Las Vegas media market is both competitive and expensive, and the available paid media budget does not provide good penetration to the general Las Vegas television market. In the initial years of Joining Forces, OTS produced regional television spots using officers from each of the NHP’s three commands, along with local county and municipal agencies; in recent years it has produced a single spot for use statewide. Paid ads in Spanish are run on Spanish-language television and radio stations. All paid media are developed, produced, and marketed through the DPS media contractor.
Earned media probably reach a wider audience than paid media. Statewide kickoff events for the May mobilization are produced with attractive visuals and receive substantial coverage. Agencies participating in other Joining Forces events provide at least a press release and may also hold press conferences or events. Public information officers in the larger agencies and the three NHP district commands are especially effective in creating earned media opportunities and attracting coverage. Using their media contacts and experience they attract media every month for that month’s Joining Forces activities. As examples of recent earned media events:
C-48

Appendix C. Nevada
• In May 2007, OTS and NHP decided to add an additional press conference before the CIOT campaign to highlight the campaign’s importance in light of several recent unbelted fatalities. The decision was made on Wednesday; the press conference at 10:00 a.m. Friday featured officers from six agencies and attracted eight television cameras. The press conference ended at 11:00 and was covered in the noon news on four stations.
• To publicize legislation to upgrade Nevada’s seat belt law to primary enforcement, a press event featured 142 pairs of shoes, one pair for each of Nevada’s 142 unbelted occupant fatalities in 2006. The event was covered in 86 news stories.
In 2007, the Nevada DOT publicized Click it or Ticket events for the first time on its variable message signs across the State. Several municipal agencies also feature CIOT on their variable message signs.
Outreach. OTS works with some 45 different agencies and organizations on a variety of issues, with occupant protection, pedestrian safety, impaired driving, and teenage drivers predominating. Recent activities have included a poster campaign in memory of the 32 Nevada teens who would have graduated in 2007 if they had not died in traffic crashes and a belt use campaign with student-designed visuals using the slogan “Your clique won’t save your life; our click will.” For 2008, OTS is exploring a potential partnership with a major Las Vegas area employer to institute a safe driving campaign for employees, track the costs of their employees’ crashes involving both belted and unbelted occupants, and use the results to educate other major employers on the effects that increased belt use can have on their financial bottom line.
Almost one-quarter of Nevada’s population is classified as Hispanic. Many are recent immigrants from countries with no tradition of belt or child safety seat use and no laws requiring their use. Consequently, their belt and child seat use was lower than the statewide average rates. To address this issue, beginning in 2004 OTS engaged two regional CIOT Outreach coordinators for the months of April and May. The coordinators, recognized members of Nevada’s Hispanic community, promote seat belt and child safety seat use through talks and activities with community groups, in schools, at markets, during Cinco de Mayo festivities, and in other places where Nevada’s Hispanics gather. The coordinators’ activities undoubtedly helped raise belt use among Hispanic drivers from 71% in 2004, well below the statewide 86.6% rate, to 90% in 2005, much closer to the statewide 94.8% rate. The pre-mobilization surveys conducted in early May show that these increases largely persist from year to year. Needless to say, all Nevada’s belt and child safety seat materials are produced in both Spanish and English.
Research and data. The Transportation Research Center (TRC) of UNLV has conducted Nevada’s seat belt survey for over ten years. Since at least 1997 the survey has used the same 50 sites, 35 in Clark and Washoe Counties and 15 in five rural counties and the independent jurisdiction of Carson City (Vasudevan et al., 2007a). The survey was re-weighted in 1999 to meet NHTSA’s requirements. Until 2003, Nevada reported the combined use rate from its spring (pre-mobilization) and fall surveys. Beginning in 2003, for consistency with other States, it has reported only the rate from a June post-mobilization survey. Since spring pre-mobilization use rates typically are lower than post-mobilization rates (by about five percentage points in 2003-2005 (Vasudevan et al., 2006)), this means that Nevada’s reported use rates up through 2002 probably should be raised somewhat to be comparable to the reported rates from other States. For
C-49

Appendix C. Nevada
example, in 2002 the post-mobilization use rate was 76.4% (Solomon et al., 2002) while the reported rate for the year was 74.9% (Table 1). The reported use rates from 2003-2006 all use the same sites and same procedures, so that the use rate increases observed over this period should not be questioned.
The rapid growth of the Las Vegas and Reno metropolitan areas required the survey to be completely redesigned for 2007. New observation sites were selected; all are located only in Clark and Washoe Counties, which now contain over 87% of Nevada’s population and over 80% of its AVMT. The 2007 survey should give a more accurate estimate of Nevada’s current seat belt use rate but the 2007 use rates may not be directly comparable to the use rates from 2006 and previous years. The two use rates were in fact very similar – 91.2% in 2006 and 92.2% in 2007 (Table 1) – which suggests that there are no major discrepancies between the two survey designs.
Nevada consistently has observed higher belt use in rural than in urban areas, in contrast to most States (Table 2, from Vasudevan et al., 2006a). This may be due to Nevada’s geography and population distribution and to the location of the survey sites. Eight of the 22 rural sites used for the 2003-2006 surveys were on Interstates and most of the other rural sites either were in Clark or Washoe Counties or were on or near high-speed roads (Vasudevan et al., 2006b). So the rural belt use rates probably capture accurately the use rates on high-speed rural roads. That’s where most of Nevada’s rural travel occurs, unlike many other States in which more rural travel is on smaller and lower-speed roads.
Table 2. Nevada rural and urban belt use, 2003-2005
Pre-mobilization Post-Mobilization Year Rural Urban Rural Urban 2003 77.3 % 70.8 % 82.0 % 76.1 % 2004 83.9 % 80.0 % 87.1 % 86.1 % 2005 91.2 % 85.9 % 95.7 % 94.1 %
Highway safety management and culture. Charles Abbott took office as OTS Chief in 2002. He added the Office’s first law enforcement liaison in 2002 and the first police traffic services coordinator in 2004. He also established a Safe Communities coordinator in Las Vegas. Together with the police traffic services coordinator and the staff from the UNLV Transportation Research Center who conduct the seat belt surveys and analysis, these form what is in effect a branch OTS office in Las Vegas, home of almost three-quarters of Nevada’s population and 450 miles by road from the main OTS office in Carson City. Most of the current OTS staff joined the office since 2001. The programs and leadership provided by Abbott and his occupant protection, police traffic services, and safe communities staff undoubtedly were largely responsible for the rapid rise in belt use which began in 2003.
The NHP also has contributed substantially to Nevada’s belt use increase. The close relationships that have been developed between OTS and NHP, both of which are divisions within the Nevada DPS, allow both management and staff to work cooperatively on Joining Forces and other traffic safety activities involving law enforcement agencies statewide. Each of the 3 NHP Districts has an officer assigned to provide public affairs support. OTS is in contact with these officers on a
C-50

Appendix C. Nevada
daily basis, providing them statistics, releases, and funding to attend public information courses. This has resulted in daily news and television releases promoting safety belt and other traffic safety issues.
belt use is high priority throughout Nevada’s overall traffic safety activities. The Highway Safety Plan sets increasing belt use as one of the Plan’s five critical emphasis areas (Nevada DOT and DPS, 2006), with high-visibility enforcement the key strategy. The 2007 goals are to maintain an observed belt use rate above 90% and to reduce the proportion of unrestrained occupant fatalities from the 46% recorded in 2005 to 44% or less.
Plans for 2007. Nevada will continue and expand its successful strategies in 2007 and already is planning for 2008. Thirteen Joining Forces events will involve 23 agencies; a single recognition banquet and training conference will include all participating agencies; the first agency equipment awards will be presented. Outreach activities continue to expand. In addition, Nevada is participating in NHTSA’s 2008 demonstration of strategies to increase teenagers’ belt use.
Final thoughts
Nevada’s strategy is to emphasize belt use through highly-publicized multi-jurisdictional enforcement events throughout the year. Key elements are:
• Cooperative enforcement activities through Joining Forces.
• Activities year-round, not just in May and November; (13 in 2007, 14 in 2008).
• Excellent publicity, especially from earned media.
• Extensive outreach to youth and Hispanics.
• Good management that makes the most of limited budgets and staff.
References
Interviews on June 18 and 19, 2007 with Charles Abbott, Director, Nevada Office of Traffic Safety Traci Pearl, Occupant Protection Coordinator, OTS Valerie Evans, Law Enforcement Program Coordinator, OTS Erin Breen, Safe Communities Coordinator, OTS Vinod Vasudevan, Transportation System Analyst, Transportation Research Center, UNLV Sgt. Daniel Solow, Nevada Highway Patrol
Nevada DOT and DPS (2006). Nevada Highway Safety Plan. Carson City, NV: Nevada Department of Transportation. /www.nevadadot.com/reports_pubs/Safety_Plan/
NHTSA (1996). Traffic Safety Digest: Three Flags International Project. Washington, DC: National Highway Traffic Safety Administration. www.nhtsa.dot.gov/people/outreach/safedige/Spring96/Police/WOBC.html
C-51

Appendix C. Nevada
Solomon, M.G., Ulmer, R.G., and Preusser, D.F. (2002). Evaluation of Click It or Ticket Model Programs. DOT HS 809 498. Washington, DC: National Highway Traffic Safety Administration.
U.S. Census Bureau (2006). State and Metropolitan Area Data Book 2006. Metropolitan Area Rankings -- Population Indicators, Table E-13. Suitland, MD: U.S. Census Bureau. www.census.gov/compendia/smadb/SMADBrank.html
Vasudevan, V., Nambisan, S., and Pearl, T. (2006a). An Evaluation of the Effectiveness of Media and Enforcement Campaigns in Increasing Seat Belt Usage Rates in a State with a Secondary Seat Belt Law. Carson City, NV: Nevada Office of Traffic Safety.
Vasudevan, V., Nambisan, S., and Singh, A. (2006b). SafetyBelt Usage Surveys: Post-Media Campaign Surveys. Carson City, NV: Nevada Office of Traffic Safety.
Vasudevan, V., Nambisan, S., and Singh, A. (2007a). Proposal for Changes to observation Sites for the Seat Belt Surveys. Carson City, NV: Nevada Office of Traffic Safety.
Vasudevan, V., Singh, A., and Nambisan, S. (2007b). Nevada Observational Safety Belt Use Survey Methodology and Design. Carson City, NV: Nevada Office of Traffic Safety.
C-52

Appendix C. Oregon
Oregon
Summary
• Belt use law: Oregon enacted a primary enforcement belt use law in 1990, the only State belt use law to be passed in a public referendum. The fine is $97 plus costs, which vary widely by jurisdiction.
• Belt use: In 1991 Oregon became the first State to reach 70% belt use. belt use has increased steadily since then, reaching 94.1% in 2006 and 95.3% in 2007.
• Oregon’s strategies: Oregon publicizes and enforces its belt law year-round, with special emphasis during three annual high-visibility enforcement campaigns conducted in cooperation with Washington and British Columbia under the Three Flags banner. Most Oregon law enforcement agencies participate in the campaigns, using both paid overtime and regular patrol officers; enforcement during the rest of the year also uses both overtime and regular patrol. Oregon uses saturation patrols, not checkpoints.
• Media and messages: Oregon’s messages emphasize health and safety rather than tickets and fines. Road signs publicize the Click It or Ticket message and Oregon’s $97 belt law fine. Oregon uses no paid media.
• Alternative sentencing: Many Oregon judges will waive the belt law fine if violators attend a two-hour course. This low-cost alternative encourages officers to issue more citations and appears to be effective in increasing belt use.
• Management: Oregon has a large, experienced, and highly professional traffic safety staff, with remarkably low turnover. It has worked with the same research and public relations firms for over 20 years. Oregon prepares and implements long-term strategic plans based on solid data, tracks and evaluates results regularly, and adjusts and fine-tunes programs as needed.
• Plans for 2007: Oregon will continue its successful belt law enforcement activities, especially during the Three Flags mobilization periods, and will encourage more nighttime enforcement. Both communications and enforcement will emphasize booster seat use and proper adult belt use.
Status in 2007
Oregon’s primary belt law covers all seating positions and all vehicles except taxi drivers and commercial vehicles used for commercial purposes (a bill was introduced in the 2007 legislature to remove the commercial vehicle exemption). The fine is $97 plus costs, which vary widely by jurisdiction. Oregon’s belt use rate in 2006 was 94.1%, third highest of all states. It increased further to 95.3% in 2007. The belt use rate for front seat passenger vehicle occupant fatalities in FARS 2005 was 70%, highest of all States and more than three percentage points above the runner-up.
C-53
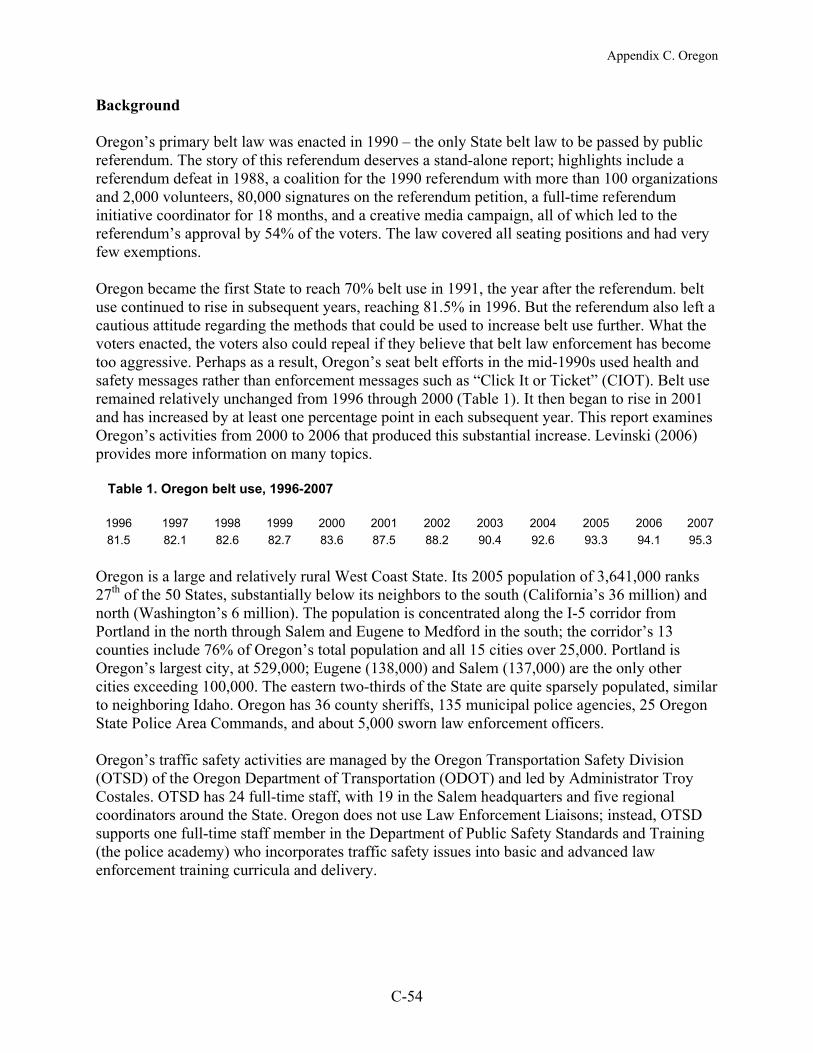
Appendix C. Oregon
Background
Oregon’s primary belt law was enacted in 1990 – the only State belt law to be passed by public referendum. The story of this referendum deserves a stand-alone report; highlights include a referendum defeat in 1988, a coalition for the 1990 referendum with more than 100 organizations and 2,000 volunteers, 80,000 signatures on the referendum petition, a full-time referendum initiative coordinator for 18 months, and a creative media campaign, all of which led to the referendum’s approval by 54% of the voters. The law covered all seating positions and had very few exemptions.
Oregon became the first State to reach 70% belt use in 1991, the year after the referendum. belt use continued to rise in subsequent years, reaching 81.5% in 1996. But the referendum also left a cautious attitude regarding the methods that could be used to increase belt use further. What the voters enacted, the voters also could repeal if they believe that belt law enforcement has become too aggressive. Perhaps as a result, Oregon’s seat belt efforts in the mid-1990s used health and safety messages rather than enforcement messages such as “Click It or Ticket” (CIOT). Belt use remained relatively unchanged from 1996 through 2000 (Table 1). It then began to rise in 2001 and has increased by at least one percentage point in each subsequent year. This report examines Oregon’s activities from 2000 to 2006 that produced this substantial increase. Levinski (2006) provides more information on many topics.
Table 1. Oregon belt use, 1996-2007
1996 1997 1998 1999 2000 2001 2002 2003 2004 2005 2006 2007 81.5 82.1 82.6 82.7 83.6 87.5 88.2 90.4 92.6 93.3 94.1 95.3
Oregon is a large and relatively rural West Coast State. Its 2005 population of 3,641,000 ranks 27th of the 50 States, substantially below its neighbors to the south (California’s 36 million) and north (Washington’s 6 million). The population is concentrated along the I-5 corridor from Portland in the north through Salem and Eugene to Medford in the south; the corridor’s 13 counties include 76% of Oregon’s total population and all 15 cities over 25,000. Portland is Oregon’s largest city, at 529,000; Eugene (138,000) and Salem (137,000) are the only other cities exceeding 100,000. The eastern two-thirds of the State are quite sparsely populated, similar to neighboring Idaho. Oregon has 36 county sheriffs, 135 municipal police agencies, 25 Oregon State Police Area Commands, and about 5,000 sworn law enforcement officers.
Oregon’s traffic safety activities are managed by the Oregon Transportation Safety Division (OTSD) of the Oregon Department of Transportation (ODOT) and led by Administrator Troy Costales. OTSD has 24 full-time staff, with 19 in the Salem headquarters and five regional coordinators around the State. Oregon does not use Law Enforcement Liaisons; instead, OTSD supports one full-time staff member in the Department of Public Safety Standards and Training (the police academy) who incorporates traffic safety issues into basic and advanced law enforcement training curricula and delivery.
C-54

Appendix C. Oregon
How Oregon achieved 94.1% belt use
1991-1992: Enforcement and publicity begins. Oregon began enforcing its seat belt law as soon as it was implemented in December 1990, using overtime enforcement in about 50 agencies with Section 153 funds. Oregon expanded its enforcement activities when it participated in the 1991-92 Operation Buckle Down. An advisory committee (LETS – Law Enforcement for Traffic Safety) helped plan Oregon’s seat belt activities cooperatively and helped select the 56 agencies that received overtime funding. All participating agencies received a two-hour Safety Belt Enforcement Training course covering Oregon’s law, enforcement methods, and other information. A law enforcement “spokesperson” was hired with Section 402 funds to encourage agencies to participate, oversee the overtime grants, and assist OTSD in planning and delivering training (Levinski, 2006). Enforcement followed the STEP (Selective Traffic Enforcement Program) model of high-visibility enforcement over a short period of time using saturation patrols, not checkpoints.
Oregon used several methods to motivate law enforcement agencies and officers both to use belts themselves and to enforce the belt law. The first step was to educate officers and command staff on the value of belts. Most officers agree that the assignment they dread is notifying a family that a loved one, especially a child, has been seriously injured or killed in a crash. Once officers saw how belt and child safety seat use could reduce these injuries and fatalities they were eager to increase belt use. Oregon’s data helped bring this message close to home by documenting the unbelted occupant injuries and fatalities for each county.
At first, some officers wouldn’t wear belts themselves because they believed that a belt would hinder their movements. To address this concern, units were included in basic officer training on how to use belts, how to access equipment quickly when belted, and how to belt prisoners and passengers. Information and discussions with agency risk management and command staff led to agency policies requiring belt use by officers and civilian staff.
1993-1999: Three Flags. In 1993, Oregon joined with Washington and British Columbia in the cooperative Three Flags enforcement campaign, funded with a Section 403 grant (NHTSA, 1996). All three jurisdictions conducted simultaneous two-week STEP enforcement blitzes about three times each year, using paid overtime. Three Flags began along the I-5 and US-97 north-south corridors in all three jurisdictions; it expanded to include all of Oregon in 1996. After Sec. 403 funding ended in 1997, Three Flags continued using a combination of Sec. 402, 405, and 157 funds. The program continued to expand. In 1999 a partnership of the Oregon State Sheriffs Association, the Oregon Chiefs of Police Association, and the Oregon State Police Patrol Division assumed responsibility for the campaign’s promotion and management, including management of all grants to individual agencies (Levinski, 2006).
2001-2006: Continue the strategy. Oregon did not participate in the 2002 Click It or Ticket (CIOT) demonstration program, but instead served as a comparison State while continuing Three Flags activities. It’s notable that Oregon’s pre-program belt use rate of 88.5% was the highest of all program States (ten with full CIOT implementation, four with partial implementation, and four comparison), and its post-program belt use of 87.8% trailed only Washington’s 89.5% (Solomon et al., 2002). For the full year, Oregon’s belt use rose from 87.5% in 2001 to 88.2% in
C-55

Appendix C. Oregon
2002. In 2003, Oregon conducted the May Three Flags campaign at the same time as the national CIOT mobilization and saw belt use break the 90% barrier at 90.4%. The same strategy carried belt use steadily upward to 94.1% in 2006 and 95.3% in 2007 (Table 1).
The Oregon model: 95% with no checkpoints, no paid media, and positive messages
Law enforcement. Three Flags continues to be the centerpiece of Oregon’s seat belt enforcement strategy. By 2006, almost all agencies with traffic officers participated in Three Flags. Overtime enforcement grants were awarded to 72 municipal agencies, 27 county sheriffs, and about half of the State Police Area Commands.
Three Flags now conducts three blitzes each year: in February, during Child Passenger Safety Week, concentrating on children; in May, during the CIOT mobilization, concentrating on belt use; and in September, addressing belts, speed, and alcohol-impaired driving. Before each blitz, participating agencies attend a statewide noon-to-noon workshop conducted by OTSD. In addition to providing administrative information and communications materials for the upcoming blitz, participants hear outside speakers discuss a variety of traffic safety issues and can attend two-hour training blocs on subjects such as Standardized Field Sobriety Tests (SFST). These workshops now draw over 180 officers and are especially popular with smaller agencies. They have become important opportunities for law enforcement agencies across the State to meet, learn new things, plan multi-jurisdictional activities, and share information.
The Three Flags blitzes themselves include pre- and post-blitz belt use surveys, local media, and high-visibility enforcement. Agencies that receive overtime funding also contribute matching overtime; some agencies participate without overtime funding. Agencies with overtime funding may use some of their overtime hours outside of the blitz periods. Each quarter, all participating agencies that receive overtime funding report their citations for various traffic offenses (belt use, child safety seat, DUII, speeding, etc.) issued on overtime. Many also report citations issued on regular patrol for the full quarter. During the first quarter of 2007, which included the February blitz, both county sheriff departments and municipal agencies collectively reported that more than half of their belt law citations were issued on regular patrol (data from OTSD).
All Oregon’s seat belt enforcement uses regular or saturation patrols but no checkpoints. Specific saturation patrol areas may or may not be announced in advance. Many of the saturation patrols are multi-agency activities involving municipal, sheriff, and State patrol units. Agencies with outstanding occupant protection performance (citations, innovative programs, extensive participation in the four-day child passenger safety training, etc.) receive Three Flags jackets at one of the annual Three Flags workshops (Levinski, 2006).
Publicity. Oregon’s seat belt communications strategies differ in two important respects from those of many other States: Oregon’s messages emphasize health and safety rather than tickets and fines and Oregon uses no paid media.
Oregon’s strategies have been developed and implemented by the three-way partnership extending over 20 years of the OTSD, the advertising and public relations firm of Gard and
C-56
Appendix C. Oregon
Gerber, and the survey research firm of Intercept Research. Brian Gard, president of Gard and Gerber, and Dean Bolon, president of Intercept Research, have led their firms’ seat belt work for the entire period; OTSD Administrator Costales and Occupant Protection Manager Levinski have worked closely with them for 10 years. This partnership has provided a long-term consistent communications strategy with specific messages and placement evolving to meet changing conditions.
The overall message strategy comes directly from the Oregon lifestyle that values health and safety. This suggested that positive messages emphasizing the benefits of belts would be more effective than negative messages emphasizing belt law enforcement, tickets, and fines. Public opinion surveys supported this strategy. So the messages immediately following the 1990 belt use law were strictly protective, providing information about the value of belts and encouraging their use in a positive manner. After belt use rose to the 80% level the messages began to be segmented to reach non-users such as drivers and passengers in rural areas, pickup truck occupants, professional women who felt that belts rumple their clothing, large and small people who find belt uncomfortable, and persons who don’t wear their belt properly. The messages continued to be positive: a typical message was “Life is good; buckle up.” Oregon believes that a person’s internal prompts – that you will be protected if you’re belted – motivate behavior change more effectively than external prompts – that you can be punished if you don’t buckle up – and that internal prompts are better at producing long-term behavior change. These messages portray law enforcement positively rather than negatively, as protective rather than punitive.
Oregon resisted the “Click It or Ticket” enforcement message for many years. Even in 2006 the CIOT message and logo were used only on road signs – 200 across the State, including all major highways at the State borders – and not in PSAs or other non-earned messages. The enforcement message is carried by the earned media generated by the Three Flags and CIOT enforcement campaigns and by national CIOT ads shown on Oregon outlets. Annual telephone surveys confirm this strategy: the public fully understands the CIOT message and Oregon’s $97 belt use law fine, with road signs named as the primary source of this information.
Specific communication methods include PSAs, billboards, newsprint ads, road signs, posters, and brochures. The goal is to provide steady placement of a consistent message using varied media. Funding of $100,000 - $150,000 annually is used for creative work and production. This generates about $500,000 annually in donated radio, television, and print media time and space for occupant protection messages. Through its long-standing relation with Oregon’s media outlets, Gard and Gerber negotiates effective placement for the PSAs and other publicity throughout the year, not just during enforcement campaign periods. Oregon believes that if it shifted to a paid media strategy it would require an annual budget of at least $2.5 million to achieve the same reach and results as its current strategy.
Oregon’s PSAs use municipal and county law enforcement officers as well as Oregon State Police. This practice evolved from Washington State’s ECAMM approach (Enrollment-Centered Approach to Media Marketing). Combined messages for the Three Flags campaigns also have included officers from Washington and British Columbia. Local agencies write their own press releases for enforcement campaigns and are featured in local earned media stories. Oregon no longer uses statewide or local press conferences to kick off enforcement campaigns: after 15
C-57

Appendix C. Oregon
years, they aren’t needed, and they aren’t news. Oregon’s print media are produced in Spanish and Russian as well as English. Under grants from OTSD, Trauma Nurses Talk Tough and THINK FIRST conduct traffic safety programs that include belt use in high schools in the Portland area. There are no corporate programs specifically concentrating on belt use.
Fine levels and alternative sentencing. Oregon’s high $97 belt law fine can be a strong incentive to buckle up if officers write citations consistently and courts uphold them. Especially in the law’s early years, this was not always the case. In rural areas, where officers and judges know belt law violators personally, or for elderly or low-income violators, officers may issue warnings instead of citations and judges may dismiss some citations. In response, Oregon began encouraging establishment of community-based alternative sentencing programs, starting in six courts in 1991 and spreading to over 40 by 2001 (Levinski, 2006).
In a typical alternative sentencing program, judges waive or substantially reduce the $97 fine if the violator attends a two-hour evening class on seat belts at a cost of $25-35. Judges see this as a way to educate and change the behavior of first-time offenders – repeat offenders usually are not offered this option. Law enforcement officers will write more belt law citations when they know that this lower-cost alternative is available. The course fees typically are used to cover course costs or for some other local traffic safety activity such as purchasing child safety seats.
Classes are taught by local law enforcement, emergency medical, or hospital personnel. The largest provider is Trauma Nurses Talk Tough (TNTT), a Portland organization that was conducting seat belt education programs in high schools before the belt law was enacted. TNTT now offers 10-12 seat belt courses monthly in the Portland area, including one in Spanish, and courses as needed in other jurisdictions. Each course includes both factual information on the belt law and the value of belt use, presented by a law enforcement officer, and information, stories, and videos illustrating the impact of unbelted occupants’ injuries on the occupants and their families, presented by a nurse or paramedic (TNTT, 2007).
Course fees cover all TNTT course costs and other TNTT overhead and program expenses. While the course has not been evaluated formally, student evaluations are very positive. In a survey sent 16 to 22 months after completing the course, 80% of participants reported that they buckled up more frequently than they did before taking the course (Fairchild, 2007). Judges like the course so much that they asked TNTT to develop courses for high-risk drivers and for pedestrian and bicycle violators (including pedestrians, bicyclists, and vehicle drivers), both of which TNTT now conducts.
Research and data. Oregon’s belt program – indeed, all Oregon traffic safety programs – are driven by data. Intercept Research has conducted Oregon seat belt observation and telephone surveys annually for over 20 years. Oregon conducts two separate observation surveys: one of drivers and right front passengers, following NHTSA procedures, and one of all passenger vehicle occupants in all seating positions. Telephone surveys conducted in May and August include a variety of traffic safety issues. Oregon also analyzes its fatal and injury crash data. From all three sources, Oregon evaluates progress, identifies who is still unbelted, and determines the public’s knowledge, awareness, and attitudes regarding seat belts. The information is used to fine-tune communications and enforcement strategies. Oregon has
C-58

Appendix C. Oregon
included belt use information on the “fatality template” that provides standard information on every traffic fatality for use by the media. This has encouraged the media to include belt use in their traffic fatality reporting.
Oregon’s legislature typically requires OTSD to evaluate the effects of new laws and programs and provides dedicated funding for these evaluations and for additional traffic safety research.
Highway safety management and culture. The Oregon Transportation Safety Division, while formally part of ODOT, enjoys cabinet-level authority. This gives OTSD full responsibility for its program. It works with the legislature and testifies on proposed bills, develops and implements its communications programs, conducts research, and evaluates its initiatives. OTSD is responsible for five of ODOT’s 25 performance measures, one of which is the seat belt use rate. About 40% of OTSD’s budget comes from the State, with the remaining 60% from federal sources. State traffic safety programs usually are supported and funded well by the legislature and governor, another reflection of Oregon’s healthy and safe lifestyle.
OTSD has a large, experienced, and highly professional staff, with remarkably low turnover. It has had only three Administrators since OTSD was formed in the 1960s and only two occupant protection managers in 25 years. As noted above, OTSD has worked with the same research and public relations firms – indeed, with the same people in these firms – for over 20 years. This consistency has allowed Oregon to prepare and implement long-term strategic plans based on solid data, to track and evaluate results regularly, and to adjust and fine-tune programs as needed.
West Coast traffic is quite transient along the I-5 corridor from California in the south through Oregon and Washington to British Columbia in the north. Drivers see the same belt use policies and practices in each jurisdiction: strong primary enforcement seat belt use laws, high fines, consistent belt law enforcement, and extensive publicity. It’s no surprise that belt use rates are well over 90% in each jurisdiction.
Plans for 2007. Oregon plans no major changes for 2007. Overtime enforcement will continue, especially during the Three Flags mobilization periods. OTSD is encouraging more nighttime enforcement; 11 agencies conducted some nighttime activities in the February 2007 mobilization. Both communications and enforcement will emphasize booster seat use and proper adult belt use – one message will be “Half Belted = Whole Ticket.”
Final thoughts
• Oregon has built its successful media strategy around Oregon’s health and safety lifestyle, using positive messages rather than more aggressive CIOT threats, and no paid media. The enforcement message is carried by earned media generated by the Three Flags blitzes, road signs publicizing the $97 belt law fine, and national CIOT media.
• Oregon has convinced its law enforcement agencies to enforce the belt law year-round. The foundation is provided by incorporating belt laws into basic and advanced law enforcement training. The Three Flags blitzes provide regular encouragement and incentives.
C-59

Appendix C. Oregon
• Oregon’s traffic safety management is talented and stable. It plans for the long term and regularly monitors programs and results. It conducts telephone surveys twice each year to identify issues and trends and fine-tune programs.
References
Interviews on April 23 and 24, 2007, with Troy E. Costales, Administrator, OTSD Carla Levinski, Occupant Protection Manager Dean Bolon, Intercept Research Joanne Fairchild, RN, Trauma Nurses Talk Tough Brian Gard, President, Gard and Gerber Luciana Trevisan Johnson, account manager, Gard and Gerber Mark Koberstein, chair, Oregon Traffic Safety Commission John Tongue, MD, former chair, Oregon Traffic Safety Commission
Fairchild, J.M. (2007). The TNTT Safety Belt Diversion Class: It Works! Portland, OR: Trauma Nurses Talk Tough.
Levinski, C. (2006). How Oregon Achieved 96% Safety Belt Use. Salem, OR: Oregon Department of Transportation.
NHTSA (1996). Traffic Safety Digest: Three Flags International Project. Washington, DC: National Highway Traffic Safety Administration. www.nhtsa.dot.gov/people/outreach/safedige/Spring96/Police/WOBC.html
Solomon, M.G., Ulmer, R.G.,and Preusser, D.F. (2002). Evaluation of Click It or Ticket Model Programs. DOT HS 809 498. Washington, DC: National Highway Traffic Safety Administration.
TNTT (2007). Safety Belt Class. Portland, OR: Trauma Nurses Talk Tough. www.legacyhealth.org/body.cfm?id=1019.
C-60

Appendix C. Texas
Texas
Summary
• Belt use law: Texas enacted a primary enforcement belt use law in 1985, one of the first States to do so. The fine is not less than $25, plus court costs, which vary by jurisdiction.
• Belt use: Texas’s seat belt use rate first exceeded 80% in 2002; in 2006 it reached 90.4% and in 2007 it increased again to 91.8%.
• Texas strategies: The belt use increases from 2002 to 2007 are largely attributed to vigorous participation in the annual May Click It or Ticket (CIOT) mobilization using both paid overtime and regular patrol law enforcement officers, extensive paid and earned media, and a wide variety of corporate and organizational partners. Belt law enforcement does not use checkpoints or enforcement zones but relies on regular traffic patrol combined with heavy and targeted CIOT publicity.
• Pickup trucks: Texas emphasizes belt use in pickups, which produce the majority of the passenger vehicle occupant fatalities but have lower belt use. The Buckle Up In Your Truck (BUIYT) campaign complements regular CIOT activities.
• Media and messages: CIOT and BUIYT campaigns emphasize the likelihood of a citation for unbelted occupants but also use messages that demonstrate how belts protect wearers in a crash.
• Management: Texas’s highly professional but small highway safety office uses two key strategies. First, direct personal relationships – with management and staff in the 25 Texas Department of Transportation (TxDOT) district offices, with the NHTSA Region 6 office, and with many organizational partners – expand its reach and influence substantially. Second, the NHTSA Region 6 office works very closely with Texas to provide on-the-ground support.
• Plans for 2007: Texas will build on its successful activities from 2006 with a goal of pushing belt use further into the 90% range.
Status in 2007
Texas has a primary belt use law covering all front seat occupants and all rear seat occupants under age 17. The fine is not less than $25, plus court costs, which vary by jurisdiction; the fine for child passenger restraint violations can exceed $200. The Texas belt use rate in 2006 was 90.4%, above the median for primary law States; the use rate increased to 91.8% in 2007. The belt use rate for front seat passenger vehicle occupant fatalities in FARS 2005 was 57%, also above the primary State median.
C-61

Appendix C. Texas
Background
Texas enacted a primary enforcement belt use law in 1985, one of the first States to do so. From the mid-90s through 2001, observed belt use hovered at about 75% (Table 1). In 2002 belt use rose 5 percentage points, to 81.1%; it rose almost 6 percentage points in 2005 to 89.9%, passed the 90% mark in 2006, and increased again to 91.8% in 2007. This report concentrates on Texas’s activities from 2001 to 2007 that produced this belt use increase. Activities from 1985 to 2000 are documented in NHTSA (2001) and are summarized briefly below.
Table 1. Texas belt use, 1996-2007
1996 1997 1998 1999 2000 2001 2002 2003 2004 2005 2006 2007 74.0 74.6 74.4 74.0 76.6 76.1 81.1 84.3 83.2 89.9 90.4 91.8
Texas is large and diverse. Its area of 268,581 square miles is second only to Alaska and includes 9% of the land area of the lower 48 States. Its 2005 population of 22,860,000 is 8% of the nation, second only to California. One-third of its inhabitants in the 2000 census were classified as Hispanic. Texas produced 8% of the nation’s traffic fatalities in 2005, again second only to California. Three cities exceed one million in population and another 21 exceed 100,000, but vast areas of West Texas are very thinly populated. Texas has 254 counties, by far the most of any State, and over 1,700 county and municipal law enforcement agencies. It contains 7.6% of the nation’s roadway miles, by far the most of any State; three-quarters of the roadway mileage is rural.
Texas’s traffic safety activities are managed by the Traffic Safety Section (TxTSS), led by Director Terry A. Pence, located within the Traffic Operations Division of the Texas Department of Transportation (TxDOT). TxTSS is small for a State the size of Texas, with about 13 full-time professionals in its Austin office. The TxTSS also employs four or five full-time Law Enforcement Liaisons (LELs), a prosecutorial liaison, and a judicial liaison.
TxDOT itself is organized into 25 District offices across the State, each led by a District Engineer. Each District has a traffic safety specialist, most of whom have other duties as well: a public affairs officer, an engineer, or even a secretary. These District traffic safety specialists serve as the TxTSS’s field staff. But they report to their District Engineer, who in turn reports to the TxDOT Executive Director. This means that TxTSS has no direct authority over the District traffic safety specialists.
How Texas achieved 91.8% belt use
1984-2000: Partnering to pass, publicize, and enforce the belt use law. The Texas legislature enacted a child passenger safety law during a special session in 1984. Encouraged by this success, the Texas Automobile Dealers’ Association and the Texas PTA led a coalition of thirty-five public and private groups to support a seat belt law. After the primary enforcement law was enacted in 1985, the coalition was reconstituted to guide the law’s implementation. The Texas Safety Association took over as the coalition’s leader. State Departments – TxDOT, Public Safety, and Health – and private organizations joined. The coalition formed a law enforcement
C-62

Appendix C. Texas
advisory committee. It helped publicize the new law with the message “This law is going to be enforced.”
Over the following years many partners assisted in bringing the safety belt message to Texas’s large and diverse population. A few examples follow. See NHTSA (2001), from which this information is taken, for additional detail and many other examples.
• Messages: Traffic Safety Now created a statewide speakers bureau and provided model speeches and visual materials. TxDOT placed belt use road signs at all entry points and rest areas. The Texas Safety Association led a “One Deathless Day” campaign to achieve a day with no traffic fatalities statewide, against an average of 9 fatalities each day throughout the year. The campaign succeeded in its second year.
• Insurance: A year after the law was effective, medical insurance claims dropped. The State Board of Insurance reduced insurance rates and made it clear that the reductions were due to increased belt use. The Dallas and Houston auto dealers associations emphasized the message that belt use saves costs by offering $5 incentives for buckling up.
• Schools: The Texas Education Agency created a study unit on seat belt use for schools that 275 Texas schools adopted.
• Health: The Texas Department of State Health Services, Texas Medical Association, and Medical Auxiliary all created and delivered health-related messages and materials.
• Rural: The Texas Agricultural Extension Services created programs for children, parents, and older drivers and implemented them through County Extension agents in all 254 Texas counties. Belt use in pickup trucks received special emphasis.
• Urban: By 2000, 33 Safe Community programs featured belt use activities.
• Hispanic population: belt use messages and materials were delivered in Spanish and English. The “Buckle the Border” campaign was launched in 1999 with bilingual signs on both sides of the Texas-Mexico border, bilingual information sheets distributed at entry points, increased belt use law enforcement, and extensive publicity.
2002: Click It or Ticket. In 2002, Texas participated in the May national Click It or Ticket (CIOT) mobilization as one of NHTSA’s ten demonstration states. The CIOT model consists of a short (typically two week) intense period of high-visibility seat belt law enforcement accompanied by extensive earned media and paid advertising. Due to the size of Texas, it restricted the enforcement and publicity activities in 2002 to its 10 largest cities, which included about 80% of the State’s population. Texas spent $1,045,800 on paid advertising in May 2002, or about 16 cents per resident of these cities. Law enforcement officers issued 27,260 seat belt law citations during the mobilization in these cities, or about 40 per 10,000 residents, the highest citation rate of any of the ten demonstration States. Belt use increased to 86.4% in these cities immediately after the mobilization, up from 80.5% immediately beforehand. Statewide belt use, measured by the annual surveys, increased from 76.1% in 2001 to 81.1% in 2002 (Solomon et al., 2002).
C-63

Appendix C. Texas
2003 and 2004: Buckle Up in Your Truck. The 2002 CIOT results convinced TxTSS that the CIOT model was successful and should be continued. Texas participated fully in the 2003 May national mobilization, expanded both publicity and enforcement to other areas of the State, and increased belt use another 3 percentage points, to 84.3%.
However, Texas and the other states of NHTSA’s Region 6 realized that additional efforts were needed to reach pickup truck drivers. About two-thirds of the Region’s passenger vehicle fatalities in 2002 were pickup truck occupants, but belt use in pickup trucks was lower than in other passenger vehicles: in Texas, pickup truck belt use in 2002 was 75.7% compared to 82.7% in other passenger vehicles (NHTSA, 2007a).
The Buckle Up in Your Truck (BUIYT) campaign was planned in 2003 and implemented in 2004. Its initial goal was to counteract a common belief that pickup truck occupants don’t need to wear seat belts because pickups are safer than other passenger vehicles due to their size and height. The campaign’s message was simple: “Pickup trucks roll over twice as often as cars. Wearing your seat belt can increase your chances of surviving a pickup rollover crash by up to 80%.” This message was promoted for two weeks in May 2004 and followed by two weeks of the regular CIOT mobilization. Texas spent $250,000 for paid BUIYT media in 2004 and another $1,595,000 for CIOT media (NHTSA, 2007a). The campaign also generated extensive earned media through press conferences, news releases, and community events. The campaign was repeated in November 2004, before the November CIOT mobilization.
The November BUIYT campaign was evaluated in Amarillo, which received intense BUIYT publicity, using Wichita Falls, which received no BUIYT publicity, as a comparison. The campaign increased the proportion of pickup drivers who had heard something about safety belts and pickup trucks by 21 percentage points in Amarillo, measured through driver surveys, while the proportion in Wichita Falls decreased by 3 percentage points. In surveys taken before and after the campaign, observed belt use in pickups increased by 12 percentage points in Amarillo and by 5 percentage points in Wichita Falls (NHTSA, 2007a; Solomon and Chaffe, 2005). However, belt use statewide decreased slightly, from 84.3% in 2003 to 83.2% in 2004. It should be noted that widespread flooding across most of Texas during the second week of the 2004 CIOT mobilization reduced the time law enforcement could devote to writing seat belt tickets.
2005 and 2006: progress resumes. In 2005, TxTSS continued the basic strategy of intensive CIOT mobilizations and publicity, proceeded by and combined with specific BUIYT messaging for pickup occupants. But the BUIYT messaging changed from education alone (you’re safer in a pickup when you’re belted) to education plus enforcement (CIOT means pickups, too). This, coupled with extensive outreach to law enforcement agencies throughout Texas, brought results: belt use statewide rose to 89.9% in 2005 and again to 90.4% in 2006. It should be noted that the Texas survey sampling plan was revised in 2005 to be based on populations from the 2000 census; previous surveys had been based on the 1990 census. This change means that the 2005 survey should produce a more accurate estimate of belt use than the 2004 survey did, though the two results may not be directly comparable.
C-64
Appendix C. Texas
The Texas model: Intensive CIOT publicity and enforcement campaign in May, special BUIYT messaging for pickup drivers, extensive community partners
Law enforcement. The basic CIOT strategy of high-visibility enforcement during the two-week mobilization in May continues to expand and to be increasingly successful in gaining attention from the media and the public. Seat belt law enforcement uses four complementary strategies: overtime enforcement during the May CIOT mobilization, overtime enforcement at other times, increased regular patrol enforcement during the May mobilization, and regular traffic enforcement throughout the year. Texas does not operate single-focus enforcement activities directed at seat belt law violators, such as seat belt checkpoints or enforcement zones. Seat belt law enforcement occurs during saturation patrols, in which a geographic area is “saturated” with patrol officers looking for all traffic violations, and during regular patrol. This means that seat belt law enforcement will raise belt use only if it is publicized effectively, so that drivers and passengers learn to associate the sight of a police car with the CIOT message. Texas does not conduct special nighttime belt law enforcement activities but includes belt law enforcement as part of regular nighttime traffic enforcement operations. It’s also notable that other duties have prevented Texas State Troopers from participating in CIOT mobilizations and other activities.
In 2006, 76 agencies received grants for overtime enforcement during the CIOT mobilization and another 180 agencies participated without a grant. These agencies issued 55,659 seat belt and 6,833 child passenger safety citations during the CIOT mobilization: more than 27 citations per 10,000 residents in the entire State, not just per resident in the areas served by the participating agencies (Pence, 2007).
The CIOT equipment incentive program is open to all law enforcement agencies in Texas. Participating agencies must conduct increased seat belt and child safety seat enforcement during the May mobilization, conduct at least one earned media event, and report their enforcement and media activities using the Buckle Up Texas website. In 2006, twenty agencies were selected at random to receive $4,000 awards: ten agencies that received TxDOT enforcement grant funds and ten agencies that did not receive an enforcement grant. The awards are presented at an annual banquet to which all participating agencies are invited. They may be used for law enforcement equipment or training (Blanton, 2007). Awards to some smaller agencies gave them both equipment and incentive to increase traffic enforcement substantially. Information on the 2007 equipment incentive program is available at the Buckle Up Texas website (www.buckleuptexas.com). In 2006, the agencies participating in the equipment incentive program wrote about 20% of the belt law citations during the CIOT mobilization, while the awards were less than 10% of the CIOT enforcement budget.
Other enforcement: additional grants are awarded to agencies for overtime enforcement at other times of the year. These activities also are reported on the Buckle Up Texas website. Finally, many agencies have incorporated seat belt law enforcement into their regular traffic patrol activities.
Tammy Ryden has provided additional encouragement and incentive for the BUIYT program. Ms. Ryden’s 15 year old daughter was riding unbelted in a pickup when it crashed; she was ejected and died. Ms. Ryden has turned her grief into positive action by campaigning for belt use
C-65

Appendix C. Texas
in pickups at media events, school programs, and other occupant protection activities. She is featured in a law enforcement roll call video. In 2006 she conducted shift change briefings at every law enforcement substation in Ft. Worth and many in Dallas, Arlington, and other cities to personally promote CIOT enforcement for pickups.
Publicity. Texas uses virtually every imaginable way to publicize both CIOT and BUIYT. Notable publicity for 2006 included (Pence, 2007):
• The 2006 CIOT kickoff with a huge seat belt across the front of the State Capitol building.
• Press events in 13 of the 25 TxDOT Districts.
• Earned media produced 440 television, 360 radio, and 743 print media stories.
• 24,979 radio and 23,543 television PSAs.
• CIOT promotion before movies in 361 theatres.
• 194 CIOT billboards across Texas; 320 gasoline pump toppers.
• CIOT Nights at minor league baseball games across Texas.
• A “safe in the back seat” poster contest for elementary school children in Lubbock.
• “Buckle the Border” activities along the Mexican border.
• CIOT messages on TxDOT variable message signs across Texas.
• Faith-based messages and materials.
• Most materials in both Spanish and English. Many are available at the TxDOT CIOT website: www.dot.state.tx.us/services/traffic_operations/clickit_ticket.htm.
BUIYT messaging moved to increasingly pointed enforcement messages directed at pickup truck drivers and passengers. See the television ads “Bubba’s Last Stand” on the TxDOT CIOT website.
Outreach. TxTSS has an extensive array of partners with whom it works on seat belt promotion activities. Examples include:
• Safe Riders, a Texas organization responsible for child safety seat activities, promotes belt use at the same time.
• Texas Cooperative Extension, part of the Texas Department of Agriculture, promotes CIOT through its extension agents in each of Texas’s 254 counties.
• The Texas Department of State Health Services promotes CIOT to its employees and to auto dealers.
• The Texas Municipal Police Association conducts surveys, promotes the law enforcement agency challenge, and works with six statewide municipal law enforcement organizations.
C-66

Appendix C. Texas
• The Texas Chiefs of Police Association manages the LEL program, and promotes belt law enforcement throughout the State.
• Texas colleges and universities promote CIOT at athletic events,
• AAA Texas promotes CIOT to its millions of members statewide.
Research and data. The Texas Transportation Institute (TTI) at Texas A&M University has conducted the annual statewide belt use survey since 1992. These surveys provide information on belt use by geographic area, vehicle type, and occupant age and sex that help TxTSS target its occupant protection program. TTI also conducts mini-surveys in 10 cities in April (before CIOT), May (during CIOT), and June (after CIOT), special observation surveys for projects such as the Amarillo BUIYT demonstration, and special telephone surveys.
Highway safety management and culture. TxTSS’s small staff manages its extensive array of occupant protection activities – 108 separate projects in 2006 (TxDOT, 2007) – with skill and efficiency. The key is excellent personal working relations that cross organizational and bureaucratic lines, using an open and cooperative style. These personal relationships are especially important in working with other arms of TxDOT and with NHTSA.
• TxDOT Districts: the District engineers support the goal of increasing seat belt use and have incorporated occupant protection into their highway engineering activities; most District traffic safety specialists provide valuable assistance in planning and conducting occupant protection activities.
• NHTSA’s Region 6: NHTSA staff work very closely with TxTSS. The Regional staff with responsibility for Texas oversee TxTSS activities that use NHTSA grant funds, but also work cooperatively with TxTSS in planning and implementing occupant protection activities and sometimes provide direct resources to TxTSS, for example by speaking or participating in events (Regional staff attended almost all the 13 District CIOT press events in 2006) or by providing media services. NHTSA Regional staff have developed close personal relations both with TxTSS and also with the District traffic safety specialists. NHTSA Regional staff meet annually with all the District traffic specialists and TxTSS to plan and discuss the year’s traffic safety activities. At the March 2007 CIOT planning meeting, NHTSA Regional staff presented a list of 23 separate CIOT support activities for the 2007 mobilization (NHTSA, 2007b).
The same cooperative and personal style is used when working with the array of partners discussed above.
TxTSS has organized a CIOT planning group that meets monthly from February through June to plan and organize the year’s CIOT activities. The group includes TxTSS management and staff, NHTSA Regional staff, and key organizational partners including media and evaluation contractors. These meetings allow all partners to share their thoughts and coordinate their activities.
Plans for 2007. Texas will build on its successful activities from 2006 to push belt use further into the 90% range: the 2007 goal is 91.8%. The total CIOT budget is $4,594,000, with $1,280,000 for enforcement, $3,264,000 for media and materials, and $50,000 for surveys and
C-67

Appendix C. Texas
analysis. Law enforcement activities again will include both overtime enforcement, funded through grants, and regular patrol enforcement, encouraged by agency incentives. Media will continue the two-phased approach of BUIYT messages in early May followed by CIOT messages during the two-week mobilization period. Additional media and programs will support special groups, such as materials for a variety of faith-based organizations, sports events, county extension agents, employers, and many others. The mobilization will kick off with a statewide press and media event in San Antonio in which the world’s largest seat belt will be wrapped around Texas’s most famous landmark, the Alamo. This will be followed by a statewide media tour in 17 media markets and press events in about 15 of the 25 TxDOT Districts.
Final thoughts
• Management is key in such a large State with many independent counties, cities, and towns. Management is built on personal relationships and trust, both within TxDOT and with many partners.
• The cooperative relations among TxTSS, other TxDOT arms, and NHTSA’s Region 6 maximize the effectiveness of staff in all three organizations.
• BUIYT messaging helps convince pickup truck drivers and passengers that CIOT applies to them as well as to other passenger vehicles. The two-phase media campaign, with BUIYT followed by CIOT, appears to be effective in reaching both audiences.
• Many partners are critical in reaching specific audiences in such a large and diverse State.
References
Meeting on March 8, 2007, of Texas CIOT 2007 participants including Terry Pence, Director, Traffic Safety Section, TxDOT Jim Hollis, Deputy Director Frank Saenz, Program Director, Occupant Protection Susan Warren, Occupant Protection Tracie Mendez, Program Director, Driver Programs Scott Blanton, Program Director, Police Traffic Services Ken Smith, Texas Municipal Police Association Dannah Peck, Sherry Matthews Advocacy Marketing Katie Womack, Texas Transportation Institute Ashley Kelm, AAA Texas Bruce Shults, NHTSA Region 6 Ken Copeland, NHTSA Region 6 Ann Streetman, NHTSA media contractor
Blanton, S. (2007). Click It or Ticket Incentive Award Program. Briefing papers. Austin, TX: Texas Department of Transportation.
C-68
Appendix C. Texas
NHTSA (2001). Buckle Up Texas: A Case Study of Strong Partnerships that Raised the Seat Belt use Rate. Washington, DC: National Highway Traffic Safety Administration. www.nhtsa.dot.gov/people/injury/airbags/buckleplan/BUA_WEBSITE/Archive-04/Cases/Texas.html
NHTSA (2007a). Regional Pickup Truck Demonstration Project. Unpublished report. Ft. Worth, TX: NHTSA Region 6.
NHTSA (2007b). 2007 Regional Support for CIOT Activities in Texas. Briefing paper. Ft. Worth, TX: NHTSA Region 6.
Pence, T.A. (2006). 2006 TxDOT Short Course. PowerPoint presentation. Austin, TX: Texas Department of Transportation.
Solomon, M.G. and Chaffe, R.H.B. (2005). Evaluation of the May 2004 Mobilization: Programs to Increase Safety Belt Use. Final report, contract DTNH22-99-D-25099. Washington, DC: National Highway Traffic Safety Administration.
Solomon, M.G., Ulmer, R.G.,and Preusser, D.F. (2002). Evaluation of Click It or Ticket Model Programs. DOT HS 809 498. Washington, DC: National Highway Traffic Safety Administration.
TxDOT (2007). Texas Traffic Safety Annual Report: 2006. Austin, TX: Texas Department of Transportation.
C-69

Appendix C. Washington
Washington
Summary
• Belt use law: Washington enacted a secondary enforcement belt use law in 1986 and strengthened it to primary enforcement in 2002. The fine was $101 in 2006, highest in the nation, and increased to $112 in 2007.
• Belt use: Washington’s belt use rose to 92.6% in 2002 after the primary law was enacted. In 2006 Washington led the nation with a belt use rate of 96.3%; the 2007 use rate increased further to 96.4%.
• Washington’s strategies: Washington uses three annual high-visibility campaigns, conducted jointly with Oregon and British Columbia under the Three Flags banner, to promote its year-round belt law enforcement. To target the remaining unbuckled occupants, Washington recently began emphasizing nighttime enforcement.
• Media and messages: Paid and earned media carry a strong enforcement message. Radio spots frequently use local law enforcement officers. Washington employs an “air buy” firm to purchase and manage all paid media and an earned media coordinator to promote its messages in news stories, talk shows, op-ed pieces, and other media opportunities.
• Management: The Washington Traffic Safety Commission is a high-profile agency, reporting directly to the Governor. It has a large, experienced, and enthusiastic staff, with low turnover. It enjoys excellent relations and cooperation with State law enforcement at all levels. It establishes long-term strategic plans based on solid data and research, sets goals, monitors progress, and adjusts activities as needed.
• Plans for 2007: Washington will continue well-publicized high-visibility belt law enforcement, with all overtime enforcement activities conducted at night.
Status in 2007
Washington has a primary belt use law covering all occupants. The fine of $101, already the highest in the nation, rose to $112 in July 2007 as part of an overall increase of all traffic violation fines. Washington’s belt use rate in 2006 was 96.3%, again highest in the nation and two percentage points above second-ranking Michigan’s 94.3%. The rate increased to 96.4% in 2007. The belt use rate for front seat passenger vehicle occupant fatalities in FARS 2005 was 56%.
Background
Washington enacted a secondary enforcement belt use law in 1986; prior to the law 36% of occupants buckled up. Belt use rose steadily to 80% in 1995 but then stagnated through 2001 (Table 1). Washington strengthened the law to primary enforcement in 2002. The new law’s publicity and enforcement, combined with participation in the national Click It or Ticket (CIOT)
C-70

Appendix C. Washington
mobilization, raised belt use ten percentage points, from 82.6% in 2001 to 92.6% in 1992, the highest in the nation at that time. Belt use increased even further in the following four years. This report concentrates on Washington’s activities from 2002, when the primary law was implemented. Activities through 2003 are documented thoroughly by Salzberg and Moffat (2004).
Table 1. Washington belt use, 1996-2007
1996 1997 1998 1999 2000 2001 2002 2003 2004 2005 2006 2007 79.0 77.3 79.1 81.1 81.6 82.6 92.6 94.8 94.2 95.2 96.3 96.4
Washington is a mid-sized and quite diverse State in the Pacific Northwest. Its area of 71,300 square miles ranks 18th of the 50 States; its 2005 population of 6,288,000 ranks 14th. The National Parks, Forests, and Wilderness Areas of the Cascade Mountains and the Yakima Indian Reservation bisect Washington from north to south. Two-thirds of the population resides in the eight counties of the Puget Sound area, from Olympia in the south through Tacoma and Seattle to Bellingham in the north; the eastern two-thirds of the State are quite rural. Washington has 39 counties, about 300 law enforcement agencies, of which about 160 enforce traffic laws regularly, and about 10,000 sworn law enforcement officers.
Washington’s traffic safety activities are managed by the Washington Traffic Safety Commission (WTSC), led by Director Lowell Porter. The WTSC director reports directly to the Governor. The Commission is chaired by the Governor and includes the directors of the Washington State Department of Transportation (WSDOT), State Patrol, Department of Motor Vehicles, and State social and health agencies. The associations of Washington cities and counties and the judiciary are also represented on the Commission. WTSC has about 20 full-time staff.
How Washington achieved 96.3% belt use
1986-2001: 82% belt use with a secondary law. After the secondary law was implemented in 1986, Washington publicized the new law and informed and trained law enforcement officers on the safety benefits of belts. Belt law enforcement activities were quite low-key initially. In the late 1980s and early 1990s a few agencies began to increase belt law enforcement using the STEP (Selective Traffic Enforcement Program) model of high-visibility enforcement. All belt enforcement activities were conducted as part of regular traffic enforcement operations or as saturation patrols; checkpoints were not used.
In 1993, Washington joined with Oregon and British Columbia in the cooperative Three Flags enforcement campaign, funded with a Section 403 grant (NHTSA, 1996). All three jurisdictions conducted simultaneous two-week STEP enforcement blitzes about three times each year. Unlike Oregon, Washington used no paid overtime for Three Flags enforcement activities. Three Flags began along the I-5 and US-97 north-south corridors in all three jurisdictions; it subsequently expanded throughout Washington. After Sec. 403 funding ended in 1997, Three Flags continued using other funds. Three Flags generated substantial local earned media featuring local law enforcement officers.
C-71

Appendix C. Washington
The Washington State Patrol emphasized belt law enforcement throughout the 1990s and participated in Three Flags and other multi-jurisdictional belt law enforcement activities. By the end of the decade, about half of Washington’s county sheriffs and municipal law enforcement agencies were enforcing the belt law regularly; together with the State Patrol they were issuing 4,000-5,000 belt law citations monthly. Nevertheless, belt use, which broke the 80% barrier in 1995, made little further progress through 2001.
2002: Primary law, Click It or Ticket, and State Patrol priority. Three events in 2002 combined to raise belt use a full ten percentage points, to 92.6% (Salzberg and Moffat, 2004):
• The belt law was strengthened to primary enforcement, effective June 13, 2002;
• The Chief of the Washington State Patrol made belt enforcement one of the agency’s four core missions; and
• Washington participated in the national Click It or Ticket (CIOT) demonstration program.
Washington already had agreed to participate in the CIOT demonstration, as a secondary law state, before the legislature considered and enacted the primary law. The combination of CIOT and the new law brought both opportunities and potential problems. Washington used $450,000 of the CIOT funding for paid media to reinforce the earned media created by the law’s passage. The publicity emphasized enforcement, again using local Chiefs and Sheriffs to bring the message close to home. An additional $450,000 was used for paid overtime enforcement by the State Patrol and about one-third of the county and municipal agencies. The enforcement was aimed more at supporting the belt message than at issuing citations, especially since the primary law was not yet in effect. Perhaps as a result, Washington issued nine citations per 10,000 residents during the May mobilization, tied with Mississippi for the lowest rate among the ten demonstration states and less than half the rate of most other states (Solomon et al., 2002). Officers enhanced the campaign’s impact by using several enforcement strategies, including saturation patrols, motorcycle officers, and officers at the roadside, but not checkpoints. Many CIOT enforcement activities were multi-jurisdictional. “Anecdotal reports indicate that it was impossible to drive on Washington highways during late May and early June 2002 without seeing a police vehicle and, typically, an officer in the process of issuing a traffic citation” (Salzberg and Moffat, 2004).
The CIOT publicity and enforcement did produce a small backlash against the primary law, but far less than some had feared. A “Click It Stick It” campaign to repeal the primary law in spring 2003 failed to produce enough signatures to place a repeal on the ballot for the next election. In retrospect, the repeal campaign served only to generate additional publicity for the law.
Washington continued to use high-visibility belt publicity and enforcement through the summer of 2002. Three activities stand out. First, Washington installed approximately 650 roadway signs across the State with the CIOT logo and the message “Seat Belts Must Be Worn – $86 Fine – Click-It Or Ticket,” with the Click-It or Ticket line in fluorescent yellow. Second, Washington developed an incentive program for officers and agencies to continue belt law enforcement after the CIOT overtime funding had ended. County and municipal officers who wrote 40 belt law
C-72
Appendix C. Washington
citations (on regular patrol, not CIOT overtime) received a scale-model police car painted to match the officer’s own patrol car. During the summer of 2002, 325 cars were awarded; two officers each received 15 cars. Agencies that issued 100 belt law citations received a $1,000 grant which could be used for traffic safety equipment or activities. This produced 140 grants to 60 different agencies. Finally, Washington conducted a second CIOT mobilization around Labor Day 2002 (Salzberg and Moffat, 2004).
Washington’s belt use rose from 80.8% immediately before the May 2002 mobilization to 89.5% immediately afterwards (Solomon et al., 2003). The continued emphasis on belt law publicity and enforcement throughout the summer, together with the primary law implementation, pushed the use rate observed in mini-surveys to 91.2% in July and 92.1% in August. The use rate observed after the Labor Day mobilization was 92.6% (Salzberg and Moffat, 2004).
2003 to 2006: Continuing to move forward. Washington continued to conduct CIOT campaigns using paid media and overtime in May as part of the national mobilization and also emphasized belt enforcement during Three Flags campaigns in February and September in cooperation with Oregon and British Columbia. An additional publicity opportunity arose when the legislature increased traffic fines across the board on July 1, 2003, which raised the belt law fine to an eye-catching $101. WTSC promptly changed all the CIOT highway signs, which generated media attention.
The Washington model: three annual campaigns to promote year-round belt law enforcement
Law enforcement. Washington’s law enforcement agencies – municipal, county sheriffs and the State Patrol – have integrated belt law enforcement into their traffic enforcement activities, using the CIOT and Three Flags campaigns for special emphasis. As elsewhere, some agencies initially were reluctant to see belt law enforcement as “real police work.” The State Patrol’s early commitment to the belt law helped bring other agencies on board, as the State Patrol is active and widely respected statewide. WTSC and the State Patrol worked with chiefs and sheriffs to convince them of the usefulness of belt law enforcement. One selling point was to compare traffic fatalities to homicides: it is law enforcement’s responsibility to protect the public, and it’s relatively easy to prevent a traffic fatality by buckling up. A second was to show how belt enforcement, and other traffic enforcement, produces a substantial number of other criminal arrests. WTSC Director Porter calls this the “Oh, by the way” byproduct of traffic enforcement: bad guys drive cars, so traffic stops will catch some bad guys. Multi-jurisdictional belt law enforcement activities under Three Flags and CIOT emphasize that belt enforcement is important and that most agencies are participating. They also provide smaller agencies an opportunity to meet with their peers across the State. Finally, outstanding officers and agencies are recognized with certificates, plaques, or commemorative medals.
As in many States, the Washington State Patrol is a leader in traffic law enforcement. The State Patrol sets goals for traffic enforcement activities, such as citations, and outcomes, such as crashes, in each of its eight Regions. The State Patrol projects activities and outcomes in advance for each month. Each Region monitors its activities and outcomes against the projections and
C-73

Appendix C. Washington
reports on the reasons for achieving or falling short of the projections. For belt use, the State Patrol monitors and reports on use observed on the road and in fatal crashes. After leaving the State Patrol, some officers subsequently join municipal agencies or sheriff departments, often as chiefs or in other command positions, where they continue to stress the importance of belt law enforcement.
In 2005, Washington began to encourage nighttime operations during Three Flags and CIOT belt enforcement campaigns and conducted pilot projects in 2005 and 2006. WTSC’s motivation was that belt use is substantially lower at night: for example, 63% of occupant fatalities were belted during the daytime hours of 6 a.m. to 6 p.m. in the years 2001-2005 while only 42% were belted during the nighttime hours of 6 p.m. to 6 a.m. (Porter, 2007). Crash rates are substantially higher at night, so that additional belted occupants at night will have a greater effect on injuries and fatalities than additional belted occupants during the day.
Nighttime operations follow the enforcement zone model, in which an officer in a safe and well-lighted location observes unbelted occupants and radios ahead to an officer downstream who stops the vehicle and issues belt citations. Nighttime enforcement often produces even more criminal arrests than daytime enforcement. For example, the pilot nighttime belt enforcement operation in Vancouver WA in November 2005 stopped 48 vehicles, of which 33 drivers had outstanding warrants or other criminal charges (WTSC, 2007). Nighttime belt law enforcement was criticized by a radio talk show host as a poor use of law enforcement resources. After WTSC presented the data on the criminal arrests, the criticism stopped.
Publicity. Washington’s media markets and strategies are changing rapidly, requiring more sophisticated media development and placement. Stations are no longer required to air PSAs; cable outlets no longer offer free or very inexpensive time. These considerations encouraged Washington to begin using paid ads with the 2002 CIOT campaign despite some initial misgivings on whether paid ads would be effective or whether they would eliminate all free PSA time.
To create its paid ads, Washington worked with an advertising and market research firm to explore how an enforcement message could best be presented. Focus groups and intercept surveys using existing and concept ads yielded three principles: make the messages serious, not humorous; show real people in real scenes, not actors on a set; and localize the messages as much as possible, with local chiefs and sheriffs. Washington continues to follow these principles. In 2006, Washington began directing belt use messages to pickup truck occupants.
To place the ads, WTSC hired an “air buy” firm to purchase all paid media: television, cable, radio, billboards, and bus panels. This firm negotiated to place the messages in effective times and locations. In addition, it obtained a 15% discount on paid media fees, which more than covered the firm’s fee, and also received a two for one match of free time and space for all paid media. As noted above, WTSC worked with WSDOT to place 650 CIOT road signs throughout the State.
WTSC also hired a public relations professional to promote and coordinate its earned media. She contacts newspapers and television and radio stations through calls, emails, and visits to place
C-74
Appendix C. Washington
WTSC’s messages in news stories, talk shows, editorial and op-ed pages, and in PSAs. She offers talking points, data, photos, B-roll, and other material, all produced attractively and effectively by a graphic design firm. She develops special opportunities: for example, in 2006 she promoted programs in high schools that attracted substantial media attention. Her “pit bull operations” have generated the equivalent of $30 in earned media for each $1 of paid advertising.
Research and data. WTSC has conducted regular belt use surveys since 1986. It regularly analyzes its survey and crash data to identify the occupants who are still unbuckled. As one example, Beard and Salzberg (2005) analyzed a sample of persons – primarily drivers – who had received a traffic ticket during three months in 2003, comparing those who had received a belt citation with those who had received some other citation (typically for speeding). Compared to the other violators, those receiving belt citations were more frequently male, riding in pickups, older, and had poorer driving records. These findings supported Washington’s emphasis on nighttime enforcement, when drivers with poorer records are more prevalent and crash rates are higher. They also supported belt law publicity directed to all males, not just young males.
Another interesting study investigated the effect of the Washington-Idaho border on belt use (Salzberg and Moffat, 2005). Idaho has a secondary enforcement belt law, a $10 fine, and far less belt law enforcement than Washington; in 2005, when the study was conducted, Idaho’s statewide belt use rate was 76.2% compared to Washington’s 95.2%. The study observed belt use in matched pairs of cities close to the border in Idaho and Washington in vehicles with either an Idaho or Washington license plate. It found that drivers of Washington vehicles had slightly lower belt use when in Idaho than in Washington, while drivers of Idaho vehicles had substantially higher belt use in Washington than in Idaho. For example, passenger car driver belt use in Idaho vehicles was 83.9% in Idaho and 93.8% in Washington. These findings suggest that belt use in Washington has become habitual, not dependent on the law. The study also suggests that many Idaho drivers buckle up when they cross the border because they understand Washington’s belt law, high fine, and enforcement activities.
Highway safety management and culture. WTSC is a high-profile agency in Washington, reporting directly to the Governor, not buried in a larger bureaucracy. It has a large, experienced, and enthusiastic staff, with very low turnover: as one person remarked, “It’s a great place to work.” WTSC may be unique among all State highway safety offices in usually having at least two full-time researchers on its staff. WTSC has established and supports county-level traffic safety task forces in 25 of Washington’s 39 counties, including one Native American task force. These task forces serve as WTSC’s field staff, established for the long haul, concentrating on the major issues such as alcohol, belt use, and speed. They conduct WTSC’s outreach activities to schools, businesses, and other local organizations.
WTSC establishes long-term strategic plans based on solid data and research, sets goals, monitors progress, and adjusts activities as needed. These goals and plans are part of Washington’s overall highway safety planning. In 2000, Washington established an overall “Target Zero” goal of no traffic fatalities and no disabling injuries by 2030. This has been incorporated as the goal of Washington’s strategic plan (WSDOT, 2007). In the plan, increasing belt use is the top Priority Two area, behind the two Priority One areas of impaired driving and speed.
C-75

Appendix C. Washington
WTSC enjoys excellent relations and cooperation with law enforcement at all levels: municipal agencies, county sheriffs, and the State Patrol. The current and previous WTSC Administrators both were career law enforcement officers from high-profile command positions. Relations with law enforcement also are facilitated by WASPC, the Washington Association of Sheriffs and Police Chiefs. No other State has such an association in which municipal chiefs, sheriffs, State Patrol command, and FBI all participate. WASPC’s traffic safety committee, co-chaired by a chief and a sheriff, plans multi-jurisdictional activities including seat belt and child safety seat campaigns. WTSC regularly funds many traffic enforcement activities, some through WASPC and some directly with individual agencies.
West Coast traffic is quite transient along the I-5 corridor from California in the south through Oregon and Washington to British Columbia in the north. Drivers see the same belt use policies and practices in each jurisdiction: strong primary enforcement seat belt use laws, high fines, consistent belt law enforcement, and extensive publicity. It’s no surprise that belt use rates are well over 90% in each jurisdiction.
Plans for 2007. Washington will continue its proven strategy of high-visibility enforcement with a new twist: all the overtime enforcement will be conducted at night. WTSC will use both CIOT funds and Sec. 403 demonstration funds from NHTSA. WTSC presented nine four-hour training sessions to agencies across the State in January and February 2007 (WTSC, 2007). Many officers were skeptical about nighttime enforcement on their way into the sessions but had become enthusiastic participants on their way out. Operations will be conducted in May and October 2007 and May 2008. Dunlap and Associates will conduct a formal evaluation, with a report scheduled for late 2008.
Final thoughts
• WTSC provides dynamic leadership, experienced and stable staff, excellent relations with law enforcement, and data-driven strategic planning.
• Law enforcement, led by the State Patrol and WASPC, has incorporated belt law enforcement into regular traffic operations and participates enthusiastically in CIOT and Three Flags campaigns.
• Effective communications, especially the 650 highly-visible road signs publicizing the CIOT message and the $101 belt law fine, keep the belt law message constantly before the public.
• 96% is not enough: Washington continues to identify and direct programs to the remaining unbelted occupants, in particular through nighttime enforcement.
C-76

Appendix C. Washington
References
Interviews on April 25, 2007 with Lowell Porter, Director, WTSC Jonna Van Dyk, WTSC Occupant Protection Manger
Angie Ward, previous WTSC Occupant Protection Manger Phil Salzberg, WTSC research Jim LaMunyan, Deputy Director, Washington Sheriffs and Police Association Chief Brian Ursino, Director of Operations, Washington State Patrol
Beard, M.M. and Salzberg, P.M. (2005). The Last Five Percent: Who Are the Non-users of Seat Belts in Washington State? Olympia, WA: Washington Traffic Safety Commission.
NHTSA (1996). Traffic Safety Digest: Three Flags International Project. Washington, DC: National Highway Traffic Safety Administration. www.nhtsa.dot.gov/people/outreach/safedige/Spring96/Police/WOBC.html
Porter, L.M. (2007). Washington/NHTSA Nighttime Seat Belt Enforcement Demonstration Project. Presentation at the Transportation Research Board Annual Meeting.
Salzberg, P.M. and Moffat, J.M. (2004). Ninety five percent: An evaluation of law, policy, and programs to promote seat belt use in Washington state. Journal of Safety Research 35, 215-222.
Salzberg, P.M. and Moffat, J.M. (2005). Seat Belt Use Rates in a Primary Law State Compared to a Neighboring Secondary Law State. Olympia, WA: Washington Traffic Safety Commission.
Solomon, M.G., Ulmer, R.G., and Preusser, D.F. (2002). Evaluation of Click It or Ticket Model Programs. DOT HS 809 498. Washington, DC: National Highway Traffic Safety Administration.
WSDOT (2007). Target Zero: Washington State’s Strategic Highway Safety Plan. Olympia, WA: Washington Department of Transportation. www.wsdot.wa.gov/planning/SHSP.htm
WTSC (2007). Take the Fight to the Night. Olympia, WA: Washington Traffic Safety Commission.
C-77

Appendix C. West Virginia
West Virginia
Summary
• Belt use law: West Virginia was one of the last states to enact a belt use law: a secondary enforcement law which became effective in 1993. The fine is $25, with no other court costs.
• Belt use: West Virginia’s belt use rate exceeded 60% in the early 1990s, after the law became effective, but then declined to 49.8% in 2000. Since then, belt use has risen dramatically to 71.6% in 2002, 84.9% in 2005, and 88.5% in 2006, the third highest rate of the 24 secondary law states. Belt use continued to increase in 2007, to 89.7%.
• West Virginia’s strategies: Convince officers that belt law enforcement is a high priority; encourage belt law citations through the Lifesaver incentive program for individual officers – in 2006, one-third of all patrol officers wrote belt law citations year-round (in a secondary law state); publicize this enforcement heavily during May mobilizations.
• Context is critical: West Virginia is a small, relatively rural State with no large metropolitan areas, so enforcement and media are decentralized and local.
• Media and messages: Saturate the State during May with localized media.
• Management: West Virginia’s management is informal and very efficient, based on personal relationships and face-to-face contacts. Eight regional coordinators provide direct contacts and management across the State.
• Plans for 2007: Build on the successes of 2006, increase officer participation, increase local media.
Status in 2007
West Virginia has a secondary belt use law covering all front seat occupants and all rear seat occupants under age 18. The fine is $25, with no other court costs. West Virginia’s belt use rate in 2006 was 88.5%, third highest of all secondary law states behind Nevada’s 91.2% and Utah’s 88.6%, and it rose further in 2007 to 89.6%. The belt use rate for front seat passenger vehicle occupant fatalities in FARS 2005 was 37%, about average for secondary states.
Background
West Virginia enacted a secondary enforcement belt use law in 1993, one of the last States to do so. belt use reached 66.1% in 1997 but then dropped steadily to 49.8% in 2000, which at the time was the second-lowest use rate in the nation, exceeding only North Dakota’s 47.7%. Since then, belt use has increased dramatically to 71.6% in 2002, 84.9% in 2005, and 88.5% in 2006. In 2006, West Virginia reported the third highest rate of the 24 secondary law states, behind only
C-78

Appendix C. West Virginia
Nevada’s 91.2% and Utah’s 88.6%. This report examines West Virginia’s activities from 2000 to 2006 that produced this belt use increase.
West Virginia is a small, relatively rural State in the Appalachian mountains. Its area of 24,230 square miles ranks 41st of the 50 States; its 2005 population of 1,817,000 ranks 37th. It has no large metropolitan areas: Charleston is the largest city, with 53,421 inhabitants in 2000, and only four other cities exceeded 25,000. It has 55 counties, each with a sheriff department or police agency, many small towns, and 190 city and town law enforcement agencies, many with only a few officers.
Table 1. West Virginia belt use, 1996-2007
1996 1997 1998 1999 2000 2001 2002 2003 2004 2005 2006 2007 63.2 66.1 57.7 51.9 49.8 52.3 71.6 73.6 75.8 84.9 88.5 89.6
West Virginia’s traffic safety activities are managed by the Governor’s Highway Safety Program (GHSP), led by Coordinator Bob Tipton. GHSP is located within the West Virginia Division of Motor Vehicles, which in turn is part of the Department of Transportation. GHSP is relatively small, with about ten full-time professional staff. One Law Enforcement Liaison (LEL) covers the whole State. In addition, GHSP employs eight regional coordinators located across the state, funded by grants from NHTSA. These coordinators serve as field staff to GHSP, managing all grants in their regions.
Legislation to upgrade to a primary belt use law has been introduced regularly but has received little support from the governor or from key legislators and has died quickly. West Virginia’s success in achieving 88.5% belt use with its secondary law may have weakened the case for a primary law. A primary law is unlikely in the near future unless necessary to avoid federal sanctions.
How West Virginia achieved 89.7% belt use
2000: Make belt use a priority. In 2000, GHSP determined to make belt use a priority and reverse the declining belt use trend. GHSP also realized that the first target must be law enforcement officers. Many did not wear belts themselves. Many did not believe that belt use was important or that the belt use law was a “real law” that should be enforced: “If the legislature had intended the law to be taken seriously, then they would have made it primary enforcement.” GHSP used its strong working relations with law enforcement across the State to change these attitudes. When working with law enforcement in TOPS (Traffic Occupant Protection Strategies) and CPS (Child Passenger Safety Technician) training, in other contacts with law enforcement by the LEL and other GHSP staff, the word went out: “We think the law is important, and you should, too.” It was a big sales job, and it took four or five years, but by 2005 most officers had become belt users; as described below, many were issuing belt use law citations regularly.
2002: Click It or Ticket. In 2002, West Virginia participated in the national May Click It or Ticket (CIOT) program as one of NHTSA’s ten demonstration states. The CIOT model consists of a short (typically two week) intense period of high-visibility seat belt law enforcement
C-79

Appendix C. West Virginia
accompanied by extensive earned media and paid advertising. West Virginia also participated in the November CIOT mobilization and a February 2003 mobilization during Child Passenger Safety Week on its own, without demonstration funding.
CIOT works only if law enforcement agencies and officers participate enthusiastically. GHSP used its excellent relations with law enforcement throughout West Virginia to gain this participation. GHSP coordinator Tipton has a law enforcement background, as do four of the eight regional coordinators. LEL Meadows was an officer for 25 years and “knows every officer in West Virginia personally.” As a result, GHSP has close personal relations with management in virtually every one of West Virginia’s 190 law enforcement agencies and with many individual officers. In a small State, with many law enforcement agencies that must be approached individually, and with a tradition of achieving cooperation on new programs and policies through personal contacts rather than bureaucratic directives, these close and personal relations are critical. GHSP has a similarly strong and close relationship with the 600-officer West Virginia State Police, built and maintained in the same way: “Meet, greet, eat.” The State Police always can be counted on to participate in GHSP programs. They can be especially useful in some rural areas when local officers are not available.
To encourage law enforcement participation, GHSP used two strategies. First, it used demonstration funds for overtime enforcement grants to selected agencies. GHSP directs all overtime grants – no grants are awarded competitively. GHSP selected agencies serving high-population jurisdictions, the locations where the overtime enforcement would have the greatest impact. Using its personal relations, GHSP first convinced the agency chiefs that CIOT participation was a good idea and then worked closely with mid-level agency managers to sell the program. As a result, all selected agencies participated. With some officer salary levels below $7 per hour, overtime enforcement funds in West Virginia can buy a substantial amount of effort.
The second strategy, the Click It or Ticket Challenge, was directed at all law enforcement agencies, with the goal of having all agencies participate in the CIOT mobilizations (GHSP, 2003). To participate, an agency must
• have a written seat belt use policy for its officers and employees;
• participate in the designated CIOT mobilizations (in 2002-03 these were November 2002 and February and May 2003); and
• conduct pre and post belt use surveys for each mobilization, at least one hour at one intersection.
Agencies competed for prizes in six categories based on type (State Police, municipal, and sheriff) and size (number of sworn officers). Criteria included officer training, seat belt checkpoints conducted, seat belt citations (not warnings) written during mobilization periods, earned media, community presentations, and child passenger safety clinics. Awards to agencies in each category ranged from $1,500 to $10,000 and could be used to purchase highway safety related equipment, to fund overtime highway safety enforcement, or for other highway safety purposes. The awards were presented at a banquet to which all participating agencies were invited. The awards totaled $117,000 in 2003. In 2003, 206 of West Virginia’s 305 law enforcement agencies and State Police districts participated in the Challenge.
C-80

Appendix C. West Virginia
West Virginia’s secondary belt use law did not hinder enforcement but did require some creative techniques. At a checkpoint, an officer could issue a belt use ticket only if another violation was observed; if not, the driver could be given a seat belt warning flyer. Some agencies would observe speeders at a location but only stop those that were unbelted and give them both a speeding and a belt use citation. West Virginia’s belt use fine of $25, with no court costs, also was not an obstacle. At this fine level, officers were willing to issue both a belt use and another traffic citation; if the belt use fine were higher, they might issue fewer belt use tickets. Also, many West Virginians don’t want to be stopped by law enforcement; driving or riding unbelted just provides an obvious reason to look for another violation and stop the vehicle.
In 2002, West Virginia spent $250,000 on paid advertising during the May mobilization, or about 14 cents per resident, typical for the ten demonstration states. West Virginia issued 3,104 citations during the program period, or 17 per 10,000 residents, typical of the other secondary enforcement demonstration states. Belt use increased to 71.6% immediately after the May CIOT mobilization, up from 52.3% in 2001 and 56.2% in 2002 immediately before the mobilization (Solomon et al., 2002).
2005 and 2006: Lifesaver Officer Campaign. After three or four years, the Click It or Ticket Challenge became less effective. The same agencies were winning the prizes each year. These agencies “had nothing left to buy,” while other agencies thought they had little chance of winning. In most agencies, a few officers were doing much of the seat belt enforcement work of participating in community events and issuing citations but they weren’t being rewarded. So the West Virginia Lifesaver Officer Campaign was born (GHSP, 2005; Jones, 2007).
The campaign is extremely simple. Any officer in West Virginia can participate by signing up and then by faxing in a form each month with his or her name, agency, and the number of seat belt and child restraint citations written that month. When the officer’s accumulated citations reach specified levels, he or she receives an award. At the first level, officers can choose from awards such as a cap, shirt, briefcase, and jacket (all with the Lifesavers – Click It or Ticket logo); higher level awards include a spotlight, watch, pocketknife, cooler, and currently top out at a $225 leather jacket.
The Lifesaver program has several key features:
• Any officer can participate.
• Officers compete only with themselves.
• Officer award levels are lower for officers from smaller agencies than from larger agencies, to provide a level playing field for all officers.
• Officers don’t know the award levels, so there’s a constant incentive to issue citations but no quotas. The award levels and prizes change over time.
• There are no time restrictions or limits: the program encourages year-round belt and child restraint law enforcement, and an officer’s citation counts never expire.
C-81
Appendix C. West Virginia
• The program’s administrator, Roland Jones, contacts officers as soon as their citations exceed an award level and mails awards immediately.
• Agencies also receive awards based on the citations from all their participating officers, with award levels again weighted by agency size.
• At an annual award banquet for all participating officers, the top performers for the year are recognized.
In 2006, over 900 officers, or about one-third of all patrol offices in West Virginia, participated in the Lifesavers campaign. Total campaign costs were about $40,000, compared to over $150,000 in the last year of the Click It or Ticket Challenge for agencies.
The West Virginia model: high-visibility Click It or Ticket May campaigns, year-round seat belt law enforcement, and extensive localized publicity
By 2007 the West Virginia model has further evolved. Only one large-scale mobilization is conducted, in May. This serves as a focus for belt law enforcement and publicity, but both activities continue year-round. The Lifesaver campaign continues to expand. Earned and paid media are increasingly localized. A highly successful corporate partnership with McDonald’s restaurants provides additional local contacts at a very low cost.
Law enforcement. The basic strategy remains the same as in 2006 – “If it ain’t broke, don’t fix it” – with a few additions and changes. Overtime enforcement will be funded during the May CIOT mobilization period. The Lifesaver program will continue to encourage all law enforcement officers to issue belt law citations all year. Law enforcement also is planning some “Border to Border” programs across county and jurisdiction borders and along major roads. These will encourage cooperation among law enforcement agencies with adjoining or overlapping jurisdictions and also will send a message to the public that belt law enforcement is a State priority with local enforcement. While GHSP has encouraged nighttime belt law enforcement, little has been done so far. A nighttime enforcement demonstration program will be conducted in Charleston in 2007; the results will influence whether nighttime enforcement will be emphasized more actively.
Publicity. West Virginia’s media markets are small. This has three consequences: first, that radio, television, and cable spots are relatively cheap; second, that many media outlets are required to cover the whole State; and third, that small markets allow messages to be localized. GHSP’s public affairs administrator works regularly with eight major newspapers, seven or eight television stations, three cable networks, and many of the 54 radio stations. As with law enforcement, close personal relationships with management and staff at these media outlets pay large dividends.
While the Click It or Ticket messages are the same across all the media throughout the State, radio and print messages have been personalized using local law enforcement officers. As with most of GHSP’s activities, this relies both on cooperation and personal relations. For radio, the public affairs administrator prepares a script, the LEL records a local officer reading the script
C-82
Appendix C. West Virginia
with his or her name and agency featured prominently, and the public affairs administrator uses her personal contacts with the radio stations to get the spots aired at key times. In 2007, the same technique is being considered for television, using “donut” spots in which footage of a local officer can be inserted into a standard beginning and ending. Cable will be used more extensively in 2007 to take advantage of cable’s ability to localize its ads. While broadcast radio and television send the same ad to all listeners or viewers at a given time, cable can send different spots to subscribers in specific locations.
To completely saturate West Virginia with Click It or Ticket messages in May, GHSP uses several other methods. CIOT billboards go up at the beginning of May; some stay all year, if the space isn’t rented by others. (West Virginia spent 55,000, or 20% of its CIOT publicity budget, on billboards in 2006, an amount exceeded by only two States). West Virginia DOT puts CIOT messages on its variable message signs, including 11 permanent message boards on the West Virginia Turnpike. Over 200 “Click It or Ticket” road signs are placed along all Interstates entering West Virginia, at all rest stops along the Interstates, and on State and local roads. Bright CIOT stickers appear on major newspapers during the mobilization. CIOT car magnets and CIOT license plates are used on law enforcement vehicles. These reinforce the message that officers are looking for seat belt law violators all the time. Even CIOT yard signs sprout up along the roads across the State – a cheap way to reach drivers on lightly-traveled roads. GHSP begins its media blitz at the beginning of May, two weeks before law enforcement’s CIOT mobilization.
Outreach: McDonalds corporate partnership. In 1992, the owner of a McDonalds restaurant in the Huntington area started a simple seat belt reward program (GHSP, 2006). In 2006, the program had spread to 33 McDonalds in the tri-State Kentucky-Ohio-West Virginia area that share the same ad agency. On a chosen day, volunteers from local law enforcement, medical, fire, or rescue staff observe customers entering the restaurant’s drive-through line. All customers who are buckled up receive a coupon for food at McDonalds. All drivers receive a seat belt information flyer and a gentle warning that belt use is required by law. In the space of two hours, on the Friday before Memorial Day during the CIOT mobilization, 5,319 coupons valued at over $12,000 were distributed. The program was covered by 18 television and 10 radio stations and two newspapers, with over one million viewers, listeners, and readers. The only cost to GHSP was to print the information flyers. Aside from the McDonalds program, corporate outreach is not a priority in the belt use program.
Highway safety management and culture. GHSP’s management style is informal and very efficient, based on personal relationships and face-to-face contacts. One example illustrates how it can get things done quickly and efficiently: in seven days following the meeting to develop its concept, a new television PSA was scripted, shot, edited, and reproduced; the media funding was approved, the media buy was made, and the PSA was delivered to the stations.
GHSP conducts its own seat belt use surveys through its eight regional coordinators. It does not conduct additional research on belt use issues through universities or other outside organizations.
Plans for 2007. West Virginia will continue its successful strategies of intensive publicity and enforcement during the May CIOT mobilization together with year-round enforcement
C-83

Appendix C. West Virginia
encouraged through the Lifesaver campaign for officers. Publicity will continue to be localized and will make greater use of segmented cable programming and delivery.
Final thoughts
• Law enforcement is key: officers must believe that seat belt use is important and must issue seat belt use citations, not just during mobilizations but all year.
• Saturation publicity: get the message out to everyone that officers are citing unbelted occupants.
• Local media: personalize these messages with local law enforcement officers.
• Personal relationships: the best way to get things done.
• Down to the hard core: with belt use approaching 90%, high-visibility enforcement is even more important to convince the remaining unbelted occupants to buckle up.
References
Interviews on March 21, 2007 with Bob Tipton, Coordinator, Governor’s Highway Safety Program Natalie Harvey, Public Affairs Administrator Barbara Lobert, Occupant Protection Manager J.D. Meadows, LEL
GHSP (2003). West Virginia 2003 Click It or Ticket Challenge. Charleston, WV: Governor’s Highway Safety Program.
GHSP (2005). West Virginia ‘Lifesaver’ Officer Campaign. Charleston, WV: Governor’s Highway Safety Program.
GHSP (2006). McDonald’s / Highway Safety Program / Buckle Up America / Seat Belts Pay Off Campaign. Briefing materials, program planner, and evaluation data. Charleston, WV: Governor’s Highway Safety Program.
Jones, R.S. (2007). Keeping Officers Motivated to Enforce Safety Belt Laws. Presentation at Lifesavers 2007 Conference, Chicago, IL.
Solomon, M.G., Ulmer, R.G.,and Preusser, D.F. (2002). Evaluation of Click It or Ticket Model Programs. DOT HS 809 498. Washington, DC: National Highway Traffic Safety Administration.
C-84

Appendix D: Brief Case Study Description
Appendix D. Brief Case Study Description
D-1

Appendix D: Brief Case Study Description
Case studies of states with high seat belt use rates The Preusser Research Group, under contract to NHTSA
Background: Seat belt use rates vary widely across the 50 states and DC, from 64% to 96% in the 2006 surveys. While belt use law type – primary, secondary, or none – influences belt use, other factors also must be important, because in 2006 belt use in primary law states ranged from 67% to 96% and in secondary law states from 64% to 91%. NHTSA wishes to understand the factors that contribute to high belt use and identify strategies that other states could employ to increase belt use.
The study: The overall study will analyze and document the reasons why some states have achieved higher belt use rates than others. One part of the study will use statistical analyses to investigate the influence of external factors such as a state’s geography, demographics, and vehicle mix. The second part of the study will conduct case studies of about ten high belt use states, both those with primary and secondary laws, to examine the reasons why their belt use is higher than similar states.
Method: Interviews by phone or in person with highway safety officials, law enforcement officers, communications specialists, and others in each state, together with analyses of relevant supporting information such as highway safety plans and project reports.
Information sought:
• background: geography, culture, vehicle mix, political climate, and other factors that may affect belt use
• history: laws, enforcement, publicity, special programs, leadership
• current activities: leadership, priority, enforcement, publicity, public perception, funding
• special situations or programs • plans for 2007 and beyond
Reports:
• a summary report on each state (a draft will be sent to each state for review) • an overall study report containing the statistical analyses, a synthesis of the information
obtained from all study states, and overall conclusions and recommendations
Audience: States interested in strategies that may help raise belt use.
For more information: Jim Hedlund
607-263-5645 [email protected]
D-2
Appendix E: California Discussion Outline
Appendix E. California Case Study Discussion Outline
E-1
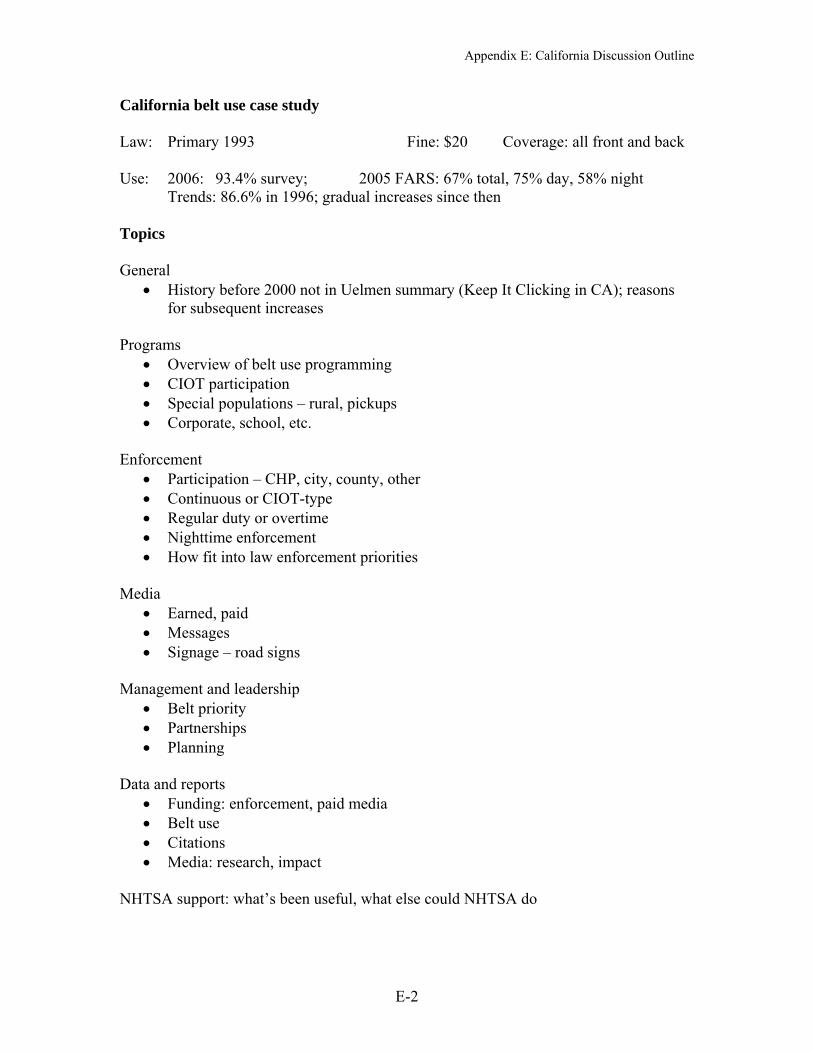
Appendix E: California Discussion Outline
California belt use case study
Law: Primary 1993 Fine: $20 Coverage: all front and back
Use: 2006: 93.4% survey; 2005 FARS: 67% total, 75% day, 58% night Trends: 86.6% in 1996; gradual increases since then
Topics
General • History before 2000 not in Uelmen summary (Keep It Clicking in CA); reasons
for subsequent increases
Programs • Overview of belt use programming • CIOT participation • Special populations – rural, pickups • Corporate, school, etc.
Enforcement • Participation – CHP, city, county, other • Continuous or CIOT-type • Regular duty or overtime • Nighttime enforcement • How fit into law enforcement priorities
Media • Earned, paid • Messages • Signage – road signs
Management and leadership • Belt priority • Partnerships • Planning
Data and reports • Funding: enforcement, paid media • Belt use • Citations • Media: research, impact
NHTSA support: what’s been useful, what else could NHTSA do
E-2

Appendix E: California Discussion Outline
Last words • Keys to success • Advice for other states • Contact for further questions, review of draft report
Belt use data
STATE 1996 1997 1998 1999 2000 2001 2002 2003 2004 2005 2006 LAW AZ 55.9 63.2 61.5 71.1 75.2 74.4 73.7 86.2 95.3 94.2 78.9 S CA 86.6 86.4 88.6 89.3 88.9 91.1 91.1 91.2 90.4 92.5 93.4 P HI 78.3 80.0 80.5 80.3 80.4 82.5 90.4 91.8 95.1 95.3 92.5 P NV 70.1 69.4 76.2 79.8 78.5 74.5 74.9 78.7 86.6 94.8 91.2 S AK 53.0 56.0 57.0 60.6 61.0 62.6 65.8 78.9 76.7 78.4 83.2 S ID 50.0 49.0 57.3 57.9 58.6 60.4 62.9 71.7 74.0 76.0 79.8 P OR 81.5 82.1 82.6 82.7 83.6 87.5 88.2 90.4 92.6 93.3 94.1 P WA 79.0 77.3 79.1 81.1 81.6 82.6 92.6 94.8 94.2 95.2 96.3 P
Percent of US Rank of all states Land area 163,696 5.2 % (exc. AK, HI) 2 Population (2005) 36,132,000 12.2 % 1 Counties 58 Road miles 169,906 4.3% 2 Percent urban 50.3 % 8 Enforcement agencies Sworn officers 72,853 .
E-3
DOT HS 810 962 August 2008