how should colleges treat multiple admissions test scores?...a recent report by the national...
TRANSCRIPT

How Should Colleges Treat Multiple Admissions Test Scores?
ACT WORKING PAPER 2017-4
Krista Mattern, PhD Justine Radunzel, PhD ACT Maria Bertling Andrew Ho, PhD Harvard University May 2017
ACT Working Paper Series ACT working papers document preliminary research. The papers are intended to promote discussion and feedback before formal publication. The research does not necessarily reflect the views of ACT.

Krista Mattern, a principal research scientist in the Statistical and Applied Research Department, works on the validity and fairness of assessment scores, as well as more general higher education issues, such as enrollment, persistence, and graduation.
Justine Radunzel, a principal research scientist in the Statistical and Applied Research Department, works on postsecondary outcomes research and validity evidence for The ACT®.
Andrew Ho is Professor of Education at the Harvard Graduate School of Education. He is a psychometrician whose research aims to improve the design, use, and interpretation of test scores in educational policy and practice.
Maria Bertling is a PhD student in education at Harvard University, where she studies education policy and program evaluation. Her primary research aim is to advance psychometric and statistical models to better inform educational policies and practices.
The authors would like to thank Wayne Camara, Senior Vice President of Research at ACT, for his review and helpful feedback on an earlier draft of the manuscript.
R1638

2
Abstract
The percentage of students retaking college admissions tests is rising (Harmston & Crouse,
2016). Researchers and college admissions offices currently use a variety of methods for
summarizing these multiple scores. Testing companies, interested in validity evidence like
correlations with college first-year grade-point averages (FYGPA), often use the most recent test
score available (Allen, 2013; Mattern & Patterson, 2014). In contrast, institutions report using a
variety of composite scoring methods for applicants with multiple test records, including
averaging and taking the maximum subtest score across test occasions (“superscoring”). We
compare four scoring methods (average, highest, last, and superscoring) on two criteria. First, we
compare correlations between scores from each scoring method and FYGPA. We find them
similar (𝑟𝑟 ≈ .40). Second, we compare scores from each scoring method based on whether they
differentially predict FYGPA across the number of testing occasions (retakes). We find that
retakes account for additional variance beyond standardized achievement and positively predict
FYGPA across all scoring methods. We also find that superscoring minimizes this differential
prediction—although it may seem that superscoring should inflate scores across retakes, this
inflation is “true” to the extent that it accounts for the positive effects of retaking for predicting
FYGPA. Future research should identity what factors, such as academic motivation and
socioeconomic status, are related to retesting and consider how these should be considered in
college admissions.

3
How should colleges treat multiple admissions test scores?
The ACT and SAT are nationally recognized, standardized measures of academic
achievement; both are commonly used in higher education to assist in the college admission
decision process. A recent report by the National Association for College Admission Counseling
indicated that nearly 90% of colleges rated admission test scores as of “considerable” or
“moderate” importance in the admission process (Clinedinst, 2015). In particular, standardized
admission test scores are used to evaluate students’ levels of readiness for college level work and
thus their likelihood of being successful in college if admitted. Validity evidence is essential to
justify these uses and interpretations of admission test scores (AERA/APA/NCME, 2014).
To that end, a good deal of research has been conducted illustrating the validity of test
scores for predicting college outcomes (Allen, 2013; Allen & Sconing, 2005; Kobrin, Patterson,
Shaw, Mattern, & Barbuti, 2008; Radunzel & Noble, 2013; Sanchez, 2013). A moderate
relationship between test scores and first-year college grade point average (FYGPA) has been
repeatedly demonstrated in the literature (Kobrin et al., 2008; Westrick, Le, Robbins, Radunzel,
& Schmidt, 2015; Sanchez, 2013). Typically, once corrected for restriction of range, the
correlation between test scores and FYGPA tends to be around 0.5.
These authors estimated these correlations using students’ most recent available scores.
This is logically the retest occasion with the highest correlation given the temporal proximity of
the score to the outcome of interest. The College Board and ACT make similar decisions in their
release of annual test results (ACT, 2015; College Board, 2015). However, individual colleges
and universities do not generally use the most recent score (College Board, 2010). How they
combine scores from multiple testing records for an individual applicant varies across

4
institutions, with many taking the highest subtest score across all testing occasions and creating a
composite known colloquially as a “superscore.”
In this paper, we evaluate the predictive accuracy of different scoring policies and
investigate how these interact with student sociodemographic characteristics. Based on existing
retesting patterns by student demographics (Harmston & Crouse, 2016), different score use
policies may further exacerbate college access disparities that exist by socioeconomic status.
Given this variability in retesting behavior and instructional score use policies, we evaluate the
validity and predictive accuracy of various scoring methods and discuss how these can support
valid and equitable inferences.
Validity Evidence by Different Composite Scoring Methods
Over the last fifty years, researchers have debated the best method for treating multiple
scores across a variety of assessment programs including the ACT, SAT, and LSAT (Boldt,
Centra, & Courtney, 1986; Linn, 1977). Boldt et al.’s review of the previous literature observed
that this research question has mainly been addressed in terms of differential validity. The
reviewed studies asked whether the strength of the relationship between test scores and future
success (e.g., college or law school GPAs) varies by scoring method, and if so, which scoring
method shows the strongest relationship with the outcome of interest. An exception would be a
study by Boldt (1977) that used additional criteria to evaluate different composite methods,
including error of prediction, standard deviation of residuals, and mean residuals. The research
has indicated that the different methods are similarly predictive of subsequent grades with some
studies citing a slight advantage for using the average score. Based on these findings, the authors
recommended the use of the average score given the ease of which it could be implemented and
understood by various audiences.

5
Boldt et al. (1986) expanded this validity argument to consider both correlations for
various scoring methods and also predictive accuracy for those who took the test once, twice,
and more. Similar to previous findings, a slight advantage for the average method was observed;
the correlation between average SAT composite score and FYGPA for students who tested twice
and three times was .01 to .02 higher than other scoring methods (last, highest, superscore). On
the other hand, Boldt et al. (1986) found that the average method resulted in greatest amount of
underprediction of FYGPA. They defined underprediction using an ad hoc approach of 1) fitting
a regression model for FYGPA for students who only take the test once, and 2) assessing the bias
of these predictions when composite scores are plugged into the fitted regression equation. All
methods resulted in underprediction of FYGPA for those who retake; however, the superscoring
method resulted in the least amount of underprediction whereas the average score method
resulted in the greatest amount of underprediction. Intuitively, this is because the added benefit
imparted by superscores to retakers more accurately captures the higher predicted FYGPA of
retakers. They conclude that the preferable method depends on whether an institution values
maximizing validity or minimizing prediction error.
Given content changes to the SAT in 2005 along with changes in College Board’s score
sending policies in 2009 that introduced variability across applicants by giving test takers much
more autonomy in what scores a college would receive, Patterson, Mattern and Swerdzewski
(2012) reexamined the validity of various scoring methods. Specifically, in 2009, the College
Board implemented SAT Score Choice, which allowed examinees to decide which test
administrations would be included when requesting that their scores be sent to a particular
college. Previously, when examinees had requested that their scores be sent to a particular
college, all of the examinees’ scores were sent. Given this change, Patterson et al. (2012) were

6
interested in examining the validity of various scoring methods (first, last, highest, average,
superscore) for students who retest to determine if the new SAT Score Choice policy would
negatively impact the validity of test scores. Based on roughly 150,000 students, the results
indicated that the different methods were similarly predictive of FYGPA with correlations
ranging from .34 for a student’s first test score to .36 for a student’s average test score. As was
the case with previous findings, the average score was slightly more predictive of FYGPA than
the other methods. Last, highest, and superscoring methods all correlated .35 with FYGPA.
When corrections for restriction of range were applied, last, average, highest, and superscoring
methods all correlated .54 with FYGPA, whereas using the first score remained the least
predictive method, with a correlation coefficient of .52.
When estimating the combined predictive strength of SAT scores and high school grade-
point average (HSGPA) by scoring method; last, average, highest, and superscores all correlated
.45 with FYGPA whereas first scores remained the least predictive with a correlation coefficient
of .44 (Patterson et al., 2012). After restriction of range corrections were applied, the superscores
showed a slight advantage of .01 to .02 over the other scoring methods. The authors concluded
that the new SAT Score Choice policy would not undermine the validity of test scores as all
methods had nearly identical predictive strength. Unfortunately, the study only examined the
predictive validity of the various scoring methods; the extent to which differential prediction
occurred by scoring method was not evaluated.
Supplementing the findings of Patterson et al. (2012), Roszkowski and Spreat (2016)
recently examined the impact of retesting and scoring methods in terms of validity and prediction
accuracy using archival data from a single institution. Based on SAT data, they found that the
validity coefficients varied minimally across scoring methods (first, last, lowest, highest, and
7
average) with the average method showing a slight advantage, which corresponds with previous
findings. For example, among students who took the SAT two times, the correlation between the
SAT Verbal section and cumulative GPA ranged from .29 for last score to .31 for average score.
The results for the SAT Mathematics section were similar, ranging from .29 for last and highest
score to .30 for average score. However, when results were combined across all students who
took the SAT more than once to create a single retesting group, the results for average and
highest scores were nearly identical.
Roszkowski and Spreat (2016) followed the same methodology employed by Boldt et al.
(1986), where prediction models regressing GPA on SAT Verbal and Math scores were
estimated for each of the five scoring methods (first, last, lowest, highest, and average) based
only on students who took the SAT one time. The regression coefficients from those models
were applied to students who took the SAT more than once in order to obtain predicted GPAs for
retesters. Predicted GPA values were compared to actual GPA values to evaluate the extent to
which over- or underprediction occurred by scoring method and number of testing occasions.
Since the models were developed on students who did not retest, the difference between
predicted and actual GPA was 0 for all scoring methods for non-retesters. For retesters, all
scoring methods resulted in the underprediction of GPA, which is consistent with the Boldt et al.
(1986) findings. As for the results by scoring method, underprediction was smallest for highest
and largest for the lowest score. Underprediction also increased by number of testing occasions
where students who retested more often earned increasingly higher GPAs than what the model
predicted. Roszkowski and Spreat (2016) examined predictive strength and accuracy of the SAT
Verbal and Math sections, separately, allowing detection of differential prediction across

8
subjects but preventing interpretation of the composite score that is most commonly used in
admissions procedures (College Board, 2010).
Current Study
This study extends previous research in this area in at least four substantive ways. First,
the majority of research in this area has relied on SAT test data that typically forms a composite
from only two subscores. This study extends findings to the ACT, a different testing program
that uses four subscores and may thus afford greater power to detect differences between
superscoring and other scoring methods. Second, prediction accuracy analyses in previous
studies have assumed that non-retesters were accurately predicted and examined differential
prediction only for retesters. This study extends this research by explicitly testing for differential
prediction by the number of retests (0, 1, 2, and 3 or more) and by different composite score
methods. Third, admission decisions are rarely, if ever, based solely on test scores; rather,
multiple pieces of information are considered when evaluating applicants. Therefore, we
evaluate the impact of retesting and scoring methods on validity and prediction accuracy based
on ACT scores, alone and in combination with HSGPA. Finally, given that research has shown
that students with low socioeconomic status are less likely to retest (Boldt et al., 1986; Harmston
& Crouse, 2016), we evaluate the diversity implications for an admitted class based on
employing different scoring methods.
Data Source
Four-year postsecondary institutions that have provided first-year college grade data to
ACT comprise the sample used in the current study. These data were matched to official ACT
records. The sample was limited to students from the 2009 through 2012 college freshman
cohorts who had valid FYGPA, HSGPA and ACT scores. Additionally, students who took the

9
ACT as part of a state or district program were excluded from the sample due the fact that many
students would not have taken the ACT at all if not mandated by their state or district (Allen,
2015b); therefore, their inclusion may downwardly biased estimates of retesting.1 Based on these
parameters, the sample consisted of 277,551 ACT-tested students from 221 four-year
postsecondary institutions.
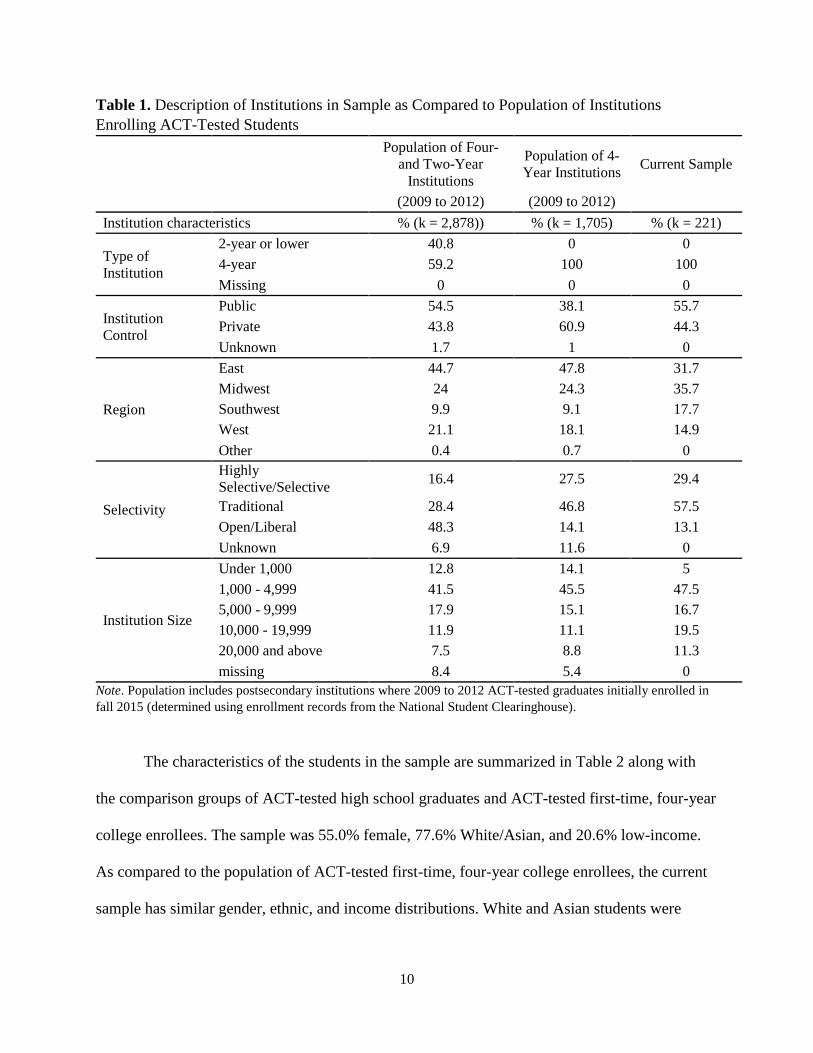
As summarized in Table 1, the institutions included in the sample were diverse in terms
of institutional control (55.7% public; 44.3% private), selectivity (29.4% highly
selective/selective; 57.5% traditional; 13.1% liberal/open admissions policies), undergraduate
enrollment size (52.5% had less than 5,000 undergraduates; 36.2% had 5,000 to under 20,000
undergraduates; 11.3% had 20,000 or more undergraduates) and location (31.7% from Eastern
region; 35.7 % from Midwest region; 17.7% Southwest region; 14.9% West region).2 Given that
this is a sample of convenience, Table 1 also includes a description of the population of
institutions enrolling ACT-tested students to evaluate the representativeness of the current
sample. As compared to the population of four-year institutions, public institutions, institutions
located in the Midwest and Southwest, and traditional institutions were over-represented whereas
private institutions, institutions located in the East and West, and small institutions were under-
represented in the current sample.
1 Additionally, we were required by law to exclude some students who tested via statewide or district administration due to data privacy laws and/or contractual agreements. In addition to the concerns raised above, we were also concerned that including some students from statewide and district testing but not others would potentially confound the results. Therefore, we decided to remove all students who took at least one ACT as part of a statewide or district administration. Follow-up analyses that included statewide records not restricted by data privacy laws and/or contractual agreements indicated that the removal of these cases had no impact on the findings. 2 Characteristics for the postsecondary institutions were obtained from IPEDS, except for admissions selectivity. Admission selectivity was self-reported by institutions on the ACT Institutional Data Questionnaire (IDQ) as defined by the typical high school class ranks of their accepted freshmen: The majority of freshmen at highly selective schools are in the top 10%, selective in the top 25%, traditional in the top 50%, liberal in the top 75% of their high school class. Institutions with open admissions policies accept all high school graduates to limit of capacity.
10
Table 1. Description of Institutions in Sample as Compared to Population of Institutions Enrolling ACT-Tested Students
Population of Four-
and Two-Year Institutions
Population of 4-Year Institutions Current Sample
(2009 to 2012) (2009 to 2012) Institution characteristics % (k = 2,878)) % (k = 1,705) % (k = 221)
Type of Institution
2-year or lower 40.8 0 0 4-year 59.2 100 100 Missing 0 0 0
Institution Control
Public 54.5 38.1 55.7 Private 43.8 60.9 44.3 Unknown 1.7 1 0
Region
East 44.7 47.8 31.7 Midwest 24 24.3 35.7 Southwest 9.9 9.1 17.7 West 21.1 18.1 14.9 Other 0.4 0.7 0
Selectivity
Highly Selective/Selective 16.4 27.5 29.4
Traditional 28.4 46.8 57.5 Open/Liberal 48.3 14.1 13.1 Unknown 6.9 11.6 0
Institution Size
Under 1,000 12.8 14.1 5 1,000 - 4,999 41.5 45.5 47.5 5,000 - 9,999 17.9 15.1 16.7 10,000 - 19,999 11.9 11.1 19.5 20,000 and above 7.5 8.8 11.3 missing 8.4 5.4 0
Note. Population includes postsecondary institutions where 2009 to 2012 ACT-tested graduates initially enrolled in fall 2015 (determined using enrollment records from the National Student Clearinghouse).
The characteristics of the students in the sample are summarized in Table 2 along with
the comparison groups of ACT-tested high school graduates and ACT-tested first-time, four-year
college enrollees. The sample was 55.0% female, 77.6% White/Asian, and 20.6% low-income.
As compared to the population of ACT-tested first-time, four-year college enrollees, the current
sample has similar gender, ethnic, and income distributions. White and Asian students were

11
slightly over-represented. Differences in regional distribution were also observed. As compared
to academic preparation, ACT scores and HSGPA were similar for the sample as compared to
the larger four-year college enrollment population. The starkest difference was in the frequency
of retesting. In the sample, only 29.1% tested only once as compared to 49.3% in the college
population.3 The current sample and the college population had higher scores, HSGPAs, and
higher retesting rates as compared to the high school population, as would be expected.
3 The differences in retesting rates may be in part due to the regional differences observed between the sample and the population of four-year college enrollees. Specifically, students in the Midwest and Southwest are more likely to retest and are overrepresented in the current sample. On the other hand, students from the East and West regions are less likely to retest and are underrepresented in the current sample. Retesting trends by region are likely a function of the popularity of the SAT among students living on the East and West coasts as opposed to the ACT for students in the Midwest.

12
Table 2. Description of Students in Sample as Compared to ACT-Tested High School Graduates and ACT-Tested First-Time Four-Year College Enrollees Populations
ACT-Tested High School Graduates
(2009 to 2012)
ACT-Tested First-Time Four-
Year College Enrollees
(2009 to 2012) Current Sample
Student Characteristics % (N=4,393,388) % (N=2,644,951) % (N=277,551)
Gender Male 44.2 42.9 45.0 Female 55.7 57.0 55.0 Missing 0.1 0.1 0.0
Ethnicity White/Asian 65.7 70.4 77.6 Minority 26.8 22.3 17.3 Missing 7.5 7.3 5.1
Income
< $36,000 23.4 17.7 20.6 $36,000 to $80,000 26.2 25.4 32.8 > $80,000 23.8 29.2 30.8 Missing 26.7 27.8 15.8
Region
East 38.3 38.9 22.5 Midwest 25.5 26.6 34.9 Southwest 16.2 14.6 28.0 West 20.0 19.9 14.6 Missing 0.1 0.0 0.1
Times Tested
1 Time 56.1 49.3 29.1 2 Times 28.4 31.5 35.3 3 Times 10.2 12.5 20.2 4 or more Times 5.3 6.8 15.4 Mean 1.7 1.8 2.3
Mean Mean Mean
Academic Performance
Last ACT Composite Score 21.4 23.0 22.6 Mean ACT Composite Score 21.3 22.8 22.2 Highest ACT Composite Score 21.6 23.2 22.9 Superscore ACT Composite Score 21.9 23.5 23.3 HSGPA 3.27 3.42 3.40
Measures
ACT Composite Scores. ACT tests scores – English, mathematics, reading, and science –
from all testing administrations were obtained from the student’s official ACT record. For each
student in the sample, four different composite scores were calculated:

13
1. Last ACT Composite score. This composite score reflects the score that the student
earned on the last, or most recent, time they took the ACT. For example, for ACT
Composite scores submitted in chronological order (20, 24, 23), the last score would
be the 23.
2. Average ACT Composite score. This composite score is the average of all ACT
Composite scores earned across test administrations/attempts, rounded to the nearest
whole number. Using the same example as above, if a student took the ACT three
times and earned a 20 on her first attempt, a 24 on her second attempt, and a 23 on
her third attempt, her Average ACT Composite score would represent the average
score across the three attempts–in this example, a 22.
3. Highest ACT Composite score. This composite score represents the highest ACT
Composite score earned during a single administration. For the example of the
student who took the ACT three times and earned a 20, 24, and 23, her Highest ACT
Composite score is a 24.
4. Superscored ACT Composite score. This composite score takes the highest ACT
subject test score (English, reading, mathematics, and science) across administrations
and then computes the ACT Composite score for those highest subject test scores. For
example, consider a student who took the ACT twice and earned the following scores
on his first attempt: 20 on English, 21 on reading, 21 on math, and 22 on science. On
his second attempt, he earned a: 21 on English, 20 on reading, 20 on math, and 23 on
science. For this example, the Superscored ACT Composite score would be based on
his reading and math scores from his first attempt and on his English and science

14
scores from his second attempt – which translates to a Superscored ACT Composite
score of 22.
Number of ACT Administrations. This variable is a simple count of the number of times
a student took the ACT during their sophomore through senior year of high school. This variable
was classified into four levels: 1 time, 2 times, 3 times, and 4 or more times. On average for this
sample of college-going examinees, students took the ACT 2.3 times: 29.1% took the ACT once,
35.3% took it twice, 20.2% took it three times, and 15.4% took it four or more times. We group 4
and more together given the rapidly diminishing number of examinees who took the ACT 5 or
more times. In particular, the breakdown of 15.4% of students who took the ACT 4 or more
times was as follows: 9.1% (n = 25,141) for four times, 3.8% (n = 10,626) for five times, 1.6%
(n = 4, 336) for six times, <1.0% (n = 2,658) for seven of more times.
High School Grade Point Average (HSGPA). HSGPA was obtained from responses to
ACT registration form, which asks students to self-report the coursework they have taken in
English, mathematics, social studies, and science, and the grades earned in those courses (M =
3.40, SD = 0.50). Research has shown that students tend to reliably report their coursework
grades (Sanchez & Buddin, 2015).
First-Year Grade Point Average (FYGPA). First-year grade point average (FYGPA) was
provided by participating colleges and universities (M = 2.73, SD = 0.95).
Methods
A series of analyses were conducted to evaluate the predictive accuracy of scoring
methods across retesting conditions. We begin with the bivariate correlation between composite
scoring method and FYGPA. Then, to test for differential prediction by number of testing
occasions, moderated multiple regression was employed (Cleary, 1968). As a test of differential

15
prediction, we fit a series of regression models and evaluate the change in R2. The first model
regressed the outcome measure (FYGPA) on only the predictor (e.g., test scores). Next, the
variable defining the subgroup of interest – in this case, the number of testing occasions – was
added to the model. If adding number of testing occasions to the predictor-only model
significantly increases the amount of variance accounted for (ΔR2), then the test is said to exhibit
differential intercepts. For the current study, three dummy variables were created based on the
number of times a student took the ACT: 2 times, 3 times, or 4 or more times and added to the
model to test for differential intercepts. Students who took the ACT only one time served as the
reference group. If the subgroup membership variable(s) were significant, then subgroup
membership by predictor interaction terms were added to the model. A test is said to exhibit
differential slopes if the ΔR2 is significant when the interaction between the group membership
variable and the predictor is added to the model that already includes the predictor and group
membership variable. For the current study, three interactions terms were computed, which
represented the interaction between each of the three retesting dummy variables and composite
score.
To account for students being nested within postsecondary institutions, we fit hierarchical
linear regression models to predict FYGPA from composite score, the number of times tested
indicators, and the interaction terms between composite score and the number of times tested
indicators, with random effects for postsecondary institution. The GLIMMIX procedure in SAS
9.2 with the identity link and normal distribution was used to fit the models. In the initial models,
all parameter estimates were allowed to vary across institutions; that is, random slope and
intercept models were estimated. The variability estimates for the interaction terms were not
significantly different from 0 (each p > 0.05). Therefore, the models were re-estimated using

16
fixed effects for the interaction terms; that is, their corresponding slope estimates were not
allowed to vary across institutions. Results for the interaction terms and for the other predictors
were similar when the interaction terms were modeled as random effects as compared to fixed
effects; results based on fixed effects for the interaction terms are reported. R2 estimates were
calculated from the correlations between predicted and actual FYGPA values. In supplemental
analyses as a sensitivity check, fixed-effect models that included dummy variables for each
institution, instead of using random effects and hierarchical regression models, were estimated.
Results from this alternative modeling approach were similar to those reported.
Additional models were estimated that included HSGPA as another predictor of FYGPA
given that most institutions tend to use this information in addition to test scores when
determining admission decisions. The extent to which differential prediction is mitigated by the
inclusion of HSGPA was evaluated. The slope estimate for HSGPA was allowed to vary across
institutions.
To evaluate the diversity implications of employing various scoring methods on the
makeup of an admitted class, students in the sample were rank-ordered based on their predicted
FYGPA from the overall model that included ACT Composite score and HSGPA for each of the
four methods. The demographic makeup of a hypothetical admitted class (gender, ethnicity,
household income) was estimated for three levels of selectivity (admit the top 15%, top 50%, top
85%) based on students in the sample. Such analyses can shed light on whether using different
scoring methods (e.g., last versus superscoring) would result in the admittance of more or less
students from a particular subgroup of interest (e.g., low-income students). Institutions often
have to balance competing agendas, such as maximizing validity versus increasing diversity

17
(Sackett, 2005); such analyses can help inform how test scores are used to satisfy these
competing goals.
Results
Descriptive Statistics and Predictive Validity
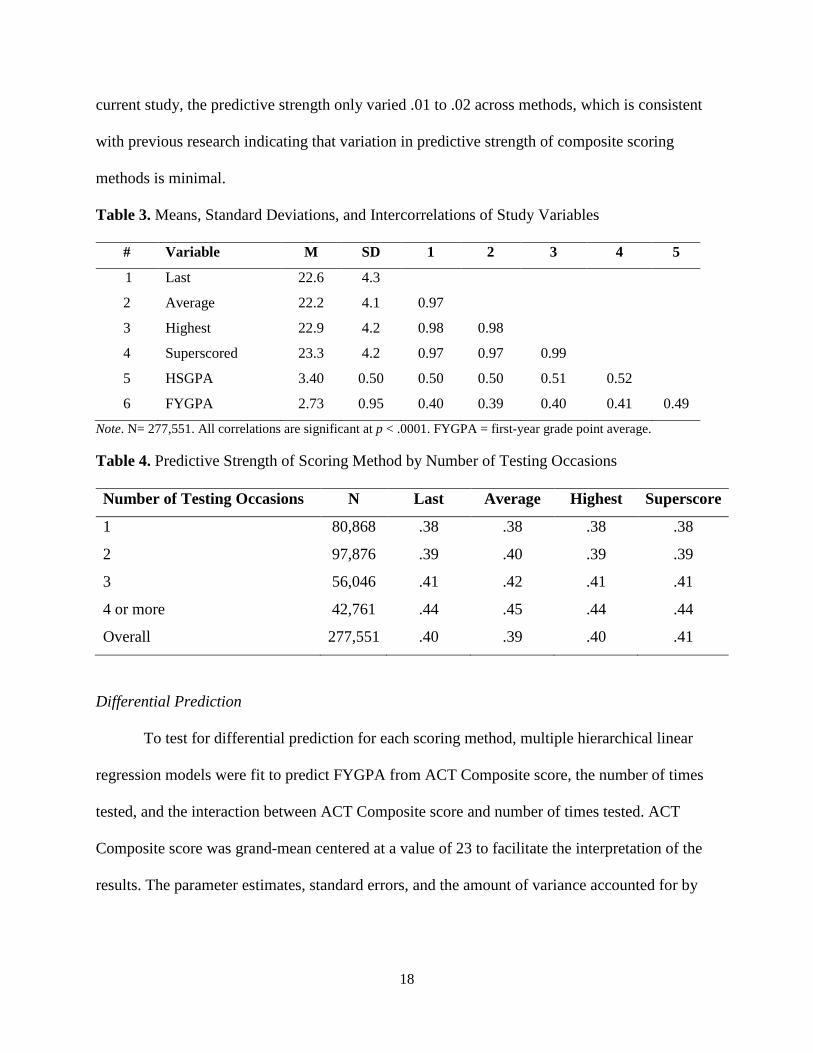
In Table 3, the means, standard deviations, and intercorrelations of study variables are
provided. As expected, superscored ACT Composite scores were the highest (M = 23.3)
followed by highest ACT Composite scores (M = 22.9). Average ACT Composite scores were
the lowest (M = 22.2). Another finding to note is that the four scoring methods were highly
correlated (rs ranging from .97 to .99). Finally, the predictive strength of the four scoring
methods were similar (rs ranging from .39 to .41) with the superscored ACT Composite score
showing the strongest relationship with FYGPA (r = .41). Unlike previous research, the average
method had the weakest relationship with FYGPA among the four methods examined. As for
results pertaining to HSGPA discussed later, it was also the case that the multiple correlation was
highest when HSGPA was combined with superscored ACT Composite scores (as compared to
the other four scoring methods).
The correlations were recomputed by number of testing occasions to determine if this
would impact the relative rank ordering of the scoring methods in terms of predictive strength.
The results are presented in Table 4. For students who tested the same number of times, the
average score was slightly more predictive of FYGPA than the other three scoring methods.
However, admission officers have to consider the academic qualifications of applicants who vary
in their retesting behavior and–to our knowledge–do not consider number of retests as a predictor
or source of information in the admission process, suggesting that the superscoring method may
be the best scoring method to employ. Despite the difference between previous findings and the
18
current study, the predictive strength only varied .01 to .02 across methods, which is consistent
with previous research indicating that variation in predictive strength of composite scoring
methods is minimal.
Table 3. Means, Standard Deviations, and Intercorrelations of Study Variables
Note. N= 277,551. All correlations are significant at p < .0001. FYGPA = first-year grade point average.
Table 4. Predictive Strength of Scoring Method by Number of Testing Occasions
Differential Prediction
To test for differential prediction for each scoring method, multiple hierarchical linear
regression models were fit to predict FYGPA from ACT Composite score, the number of times
tested, and the interaction between ACT Composite score and number of times tested. ACT
Composite score was grand-mean centered at a value of 23 to facilitate the interpretation of the
results. The parameter estimates, standard errors, and the amount of variance accounted for by
# Variable M SD 1 2 3 4 5
1 Last 22.6 4.3
2 Average 22.2 4.1 0.97
3 Highest 22.9 4.2 0.98 0.98
4 Superscored 23.3 4.2 0.97 0.97 0.99
5 HSGPA 3.40 0.50 0.50 0.50 0.51 0.52
6 FYGPA 2.73 0.95 0.40 0.39 0.40 0.41 0.49
Number of Testing Occasions N Last Average Highest Superscore
1 80,868 .38 .38 .38 .38
2 97,876 .39 .40 .39 .39
3 56,046 .41 .42 .41 .41
4 or more 42,761 .44 .45 .44 .44
Overall 277,551 .40 .39 .40 .41

19
slope- and intercept-differences for the full model for the four scoring methods are provided in
Table 5.
Table 5. HLM Parameter Estimates and Standard Errors for the ACT Model
HLM - Full Model
Scoring Methods for ACT Composite Score
Estimate (Standard Error)
Last Average Highest Superscore
Intercept
2.6071
(0.0177)
2.6084
(0.0177)
2.6074
(0.0177)
2.6071
(0.0177)
ACT Composite
0.0792
(0.0016)
0.0797
(0.0016)
0.0793
(0.0016)
0.0793
(0.0016)
Times Tested (2)
0.2037
(0.0093)
0.2241
(0.0097)
0.1768
(0.0093)
0.1410
(0.0090)
Times Tested (3)
0.3483
(0.0138)
0.4185
(0.0146)
0.3089
(0.0137)
0.2542
(0.0133)
Times Tested (4 or more)
0.4676
(0.0182)
0.5545
(0.0191)
0.4132
(0.0179)
0.3390
(0.0175)
ACT Composite * Times Tested (2)
0.0026
(0.0011)
0.0077
(0.0011)
0.0042
(0.0011)
0.0044
(0.0011)
ACT Composite * Times Tested (3)
0.0041*
(0.0013)
0.0121
(0.0013)
0.0072
(0.0013)
0.0073
(0.0013)
ACT Composite * Times Tested (4 or more)
0.0067
(0.0014)
0.0162
(0.0015)
0.0106
(0.0014)
0.0104
(0.0014)
∆R2 due to differential prediction 0.0189 0.0295 0.0132 0.0072
Note: p values for parameter estimates are < 0.0001 unless noted otherwise: * p value ≤ 0.01; nonsignificant p values are bolded. ACT Composite score was centered at 23. Hierarchical linear regression models were estimated to predict FYGPA from ACT Composite score, the number of times tested (categorized as shown in table), and the interaction between ACT Composite score and number of times tested. Hierarchical models provide two general types of estimates: (1) the fixed effects, which estimate the values of the parameters at a typical institution, and (2) the variance estimates, which describe the variability of the parameter estimates across institutions. The fixed effects are presented in the table. The variance estimates for the parameter estimates ranged from 0.0632 to 0.0635 for the intercepts; from 0.00034 to 0.00037 for ACT Composite score; from 0.0099 to 0.0122 for the Times Tested (2) indicator, from 0.0241 to 0.0308 for the Times Tested (3) indicator, and from 0.0395 to 0.0500 for the Times Tested (4 or more) indicator.
Last ACT Composite Score. To evaluate the extent to which using a student’s last ACT
Composite score results in differential prediction, we first entered their last ACT score in a HLM

20
model of FYGPA. Last ACT Composite score was a significant predictor of FYGPA (t = 52.36,
p <.0001) accounting for 15.6% of the variance. In the next step, the three retesting variables
were added to the model. All parameter estimates were significant at p <.0001 and the variance
accounted for increased to 17.5%. In other words, differences in intercepts by the number of
times a student retested accounted for an additional 1.9% of variance in FYGPA. In particular,
the parameter estimate was 0.2009 for students who took the ACT twice, 0.3447 for students
who took the ACT three times, and 0.4634 for students who took the ACT four or more times. In
other words, holding constant last ACT Composite scores, a student who took the ACT four or
more times is predicted to earned a FYGPA that is 0.4634 points higher (on a 4.0 scale) than a
student who took the ACT only once. A model that is based on students’ last ACT score and
does not take into account retesting behavior will result in the underprediction of FYGPA for
students who retest more often.
In the third step, the three interaction terms were added to the model. The results for the
full model are summarized in Table 5. The slope of the regression line for students who took the
ACT twice was not significantly different than students who took the ACT only one time.
However, there were significant slope differences for students who took the ACT at least three
times as compared to non-retesters. The full model accounted for 17.5% of the variance in
FYGPA, suggesting that slope differences did not account for an appreciable amount of variance.
Overall, differential prediction for retesters based on last ACT Composite score accounted for
1.9% of the variance in FYGPA.
Average ACT Composite Score. The second set of analyses evaluated the degree to which
using students’ average ACT Composite score results in differential prediction. In the first step,
students’ average ACT Composite score was entered in a model of FYGPA. As was the case

21
with the last ACT Composite score model, average ACT Composite score was a significant
predictor of FYGPA (t = 51.5, p <.0001) accounting for 14.9% of the variance. In the next step,
the three retesting subgroup indicators were added to model. All three subgroup retesting
indicators parameter estimates were positive and significant at p <.0001, indicating that students
who retest more often are predicted to earn higher grades in college than students who retest less,
holding constant average ACT Composite score. In particular, the parameter estimate was 0.2158
for students who took the ACT twice, 0.4043 for students who took the ACT three times, and
0.5358 for students who took the ACT four or more times. The percentage of variance accounted
for increased to 17.9%, or ΔR2 of 3%.
In the third step, the three interaction terms were added to the model; all were significant
at p <.0001. The results for the full model of average ACT Composite score are summarized in
Table 5 in the second column of results. The full model accounted for 17.9% variance in
FYGPA, suggesting that slope differences account for a negligible amount of variance in
FYGPA. As compared to last ACT Composite score, predictions based on average ACT
Composite score resulted in more differential prediction by number of retesting occasions.
Highest ACT Composite Score. Next, the extent to which using students’ highest ACT
Composite score results in differential prediction was evaluated. In the first step, students’
highest ACT Composite score was entered in a model of FYGPA. As was the case with last and
average ACT Composite score, highest ACT Composite score was a significant predictor of
FYGPA (t = 51.9, p <.0001) accounting for 16.1% of the variance. In the next step, the three
retesting variables were added to model. The parameter estimates for all three subgroup retesting
indicators were positive and significant at p <.0001, indicating that students who retest more
often are predicted to earn higher grades in college than students who retest less, holding

22
constant highest ACT Composite score. In particular, the parameter estimate was 0.1724 for
students who took the ACT twice, 0.3043 for students who took the ACT three times, and 0.4105
for students who took the ACT four or more times. The inclusion of the three subgroup
indicators increased the variance accounted for to 17.5%.
In the third step, the three interaction terms were added to the model; all were significant
at p <.0001. The results for the full model of highest ACT Composite score are summarized in
Table 5 in the third column of results. The full model accounted for 17.5% variance in FYGPA,
indicating trivial slope differences. In sum, differential prediction by retesting based on highest
ACT Composite score accounted for an additional 1.3% of the variance in FYGPA. As compared
to last and average ACT Composite score, predictions based on highest ACT Composite score
resulted in less differential prediction by number of retesting occasions.
Superscored ACT Composite Score. The final composite method evaluated for
differential prediction by testing occasions was superscored ACT Composite score. In the first
step, students’ superscored ACT Composite score was entered in a model of FYGPA. As was the
case with the other ACT Composite score methods, superscored ACT Composite score was a
significant predictor of FYGPA (t = 52.3, p <.0001) accounting for 16.8% of the variance.
Across the four composite methods examined, superscored ACT Composite score accounted for
the largest percentage of variance. In the next step, the three retesting subgroup indicators were
added to model. All three parameter estimates were positive and significant at p <.0001,
indicating that students who retest more often are predicted to earn higher grades in college than
students who retest less, holding constant highest ACT Composite score. In particular, the
parameter estimate was 0.1366 for students who took the ACT twice, 0.2516 for students who

23
took the ACT three times, and 0.3414 for students who took the ACT four or more times. The
percentage of variance accounted for increased to 17.5%, or ΔR2 of 0.7%.
In the third step, the three interaction terms were added to the model; all were significant
at p <.0001. The results for the full model of superscored ACT Composite score are summarized
in Table 5 in the fourth column of results. The full model accounted for 17.5% variance in
FYGPA, suggesting that slope differences accounted for a negligible amount of variance in
FYGPA. As compared to the other ACT Composite scores, predictions based on superscored
ACT Composite score resulted in the least amount of differential prediction by number of
retesting occasions. Specifically, differences in intercepts and slopes only accounted for 0.7%
additional variance. On the other hand, the average ACT Composite score resulted in the most
differential prediction accounting for 3% of the variance in FYGPA. This pattern of results is
consistent with previous findings.
Despite accounting for a small fraction of the variance, the results indicate that among
students with the same ACT Composite score, those who retested more had higher expected
FYGPAs than students who retested fewer times, even for the superscoring method. Figure 1
illustrates the magnitude of differential prediction for the four scoring methods, underscoring
that the regression lines by number of testing occasions were closest together for the
superscoring and furthest apart for the average ACT Composite score. For each plot in Figure 1,
the regression line for the total group is also provided to illustrate under- and overprediction of
FYGPA by the number of times a student tests. Across scoring methods, students who take the
ACT twice are accurately predicted as the regression line for the total group and for students who
tested twice are similar. For students who test once, FYGPA is overpredicted across the score
scale range. That is, the regression line for students who test once falls below the total line;

24
Figure 1. Differential prediction by ACT Composite scoring method and number of retesting occasions.
00.5
11.5
22.5
33.5
44.5
1 3 5 7 9 11 13 15 17 19 21 23 25 27 29 31 33 35
Pre
dict
ed F
YGP
A
Last ACT Composite Score
1 Time 2 Times 3 Times
4 or More Times Total group
00.5
11.5
22.5
33.5
44.5
1 3 5 7 9 11 13 15 17 19 21 23 25 27 29 31 33 35
Pre
dict
ed F
YGP
A
Average ACT Composite Score
1 Time 2 Times 3 Times
4 or More Times Total group
0
0.5
1
1.5
2
2.5
3
3.5
4
4.5
1 3 5 7 9 11 13 15 17 19 21 23 25 27 29 31 33 35
Pre
dict
ed F
YGP
A
Highest ACT Composite Score
1 Time 2 Times 3 Times4 or More Times Total group
0
0.5
1
1.5
2
2.5
3
3.5
4
4.5
1 3 5 7 9 11 13 15 17 19 21 23 25 27 29 31 33 35
Pre
dict
ed F
YGP
A
Superscore ACT Composite Score
1 Time 2 Times 3 Times
4 or More Times Total group

25
therefore, predictions based on the total group would overpredict their FYGPA relative to a
subgroup-specific regression line. On the other hand, FYGPA of students who test 3 or more
times is underpredicted, i.e., the regression lines fall above the total group regression line. These
findings diverge from previous research; this topic is discussed in detail in the discussion section.
Again, the extent of over- and underprediction is minimized when predictions are based
on the superscoring method. As illustrated in Figure 2, the difference between one’s predicted
FYGPA that takes into consideration number of testing occasions and one’s predicted FYGPA
based only on one’s ACT Composite score is visually presented. The values are based on an
ACT Composite score of 23 for the four scoring methods. For example, among students who
take the ACT 4 or more times, the magnitude of underprediction of FYGPA is 0.26, 0.32. 0.23,
and 0.19 when using last, average, highest, and superscoring methods, respectively. It should be
pointed out that at higher ACT values, the prediction error becomes more pronounced,
particularly for the average method. For example, for an ACT Composite of 26 (75% percentile),
the magnitude of underprediction of FYGPA is 0.27, 0.35. 0.24, and 0.19 when using last,
average, highest, and superscoring methods, respectively.
ACT Composite score and HSGPA models. Prior to running the differential prediction
analyses, one may have predicted that the superscoring method would result in the least valid
scores as that has the potential to capitalize on measurement error by cherry picking the highest
score across administrations. Moreover, if superscores represent an inflated estimate of one’s
academic preparation then you would expect that predicted FYGPAs based on superscores would
be overpredicted, particularly for students who retest more often; however, the results suggest
exactly the opposite. In fact, the degree to which FYGPA is underpredicted by number of testing
occasions is minimized by using superscores as compared to the other three methods. An

26
alternative explanation is that superscores and number of retesting occasions reflect not only
academic preparation but also a motivational component. Specifically, the student who is willing
to forgo multiple Saturdays to sit for a three-hour test with the hope of maybe increasing their
score is also the student who is likely to ask questions in their college courses, visit their
professor during office hours, and take advantage of any extra credit opportunities to ensure the
best possible grade. These various academic behaviors may all reflect behavioral manifestations
of the latent construct of academic motivation (Camara, O’Connor, Mattern, & Hanson, 2015).
In a similar vein, it has been suggested that HSGPA does not represent simply one’s level of
academic mastery but is also a conglomeration of cognitive and noncognitive components
(Mattern, Allen, & Camara, 2016).
Figure 2. Magnitude of differential prediction by number of testing occasions and four composite scoring methods when ACT Composite score is held constant at the sample mean of 23. Prediction error is calculated by subtracting one’s expected FYGPA based on the overall model from the expected value based on the model that includes retesting subgroup indicators and the interaction between the ACT Composite score and retesting indicators (parameter estimates are provided in Table 3).
-0.20
0.00
0.14
0.26
-0.23
-0.01
0.19
0.32
-0.18
-0.01
0.13
0.23
-0.15
-0.01
0.10
0.19
-0.30
-0.20
-0.10
0.00
0.10
0.20
0.30
0.40
1 Time 2 Times 3 Times 4 or More Times
Pre
dict
ion
Err
or
Number of Testing Occassions
Last Average Highest Superscore
27
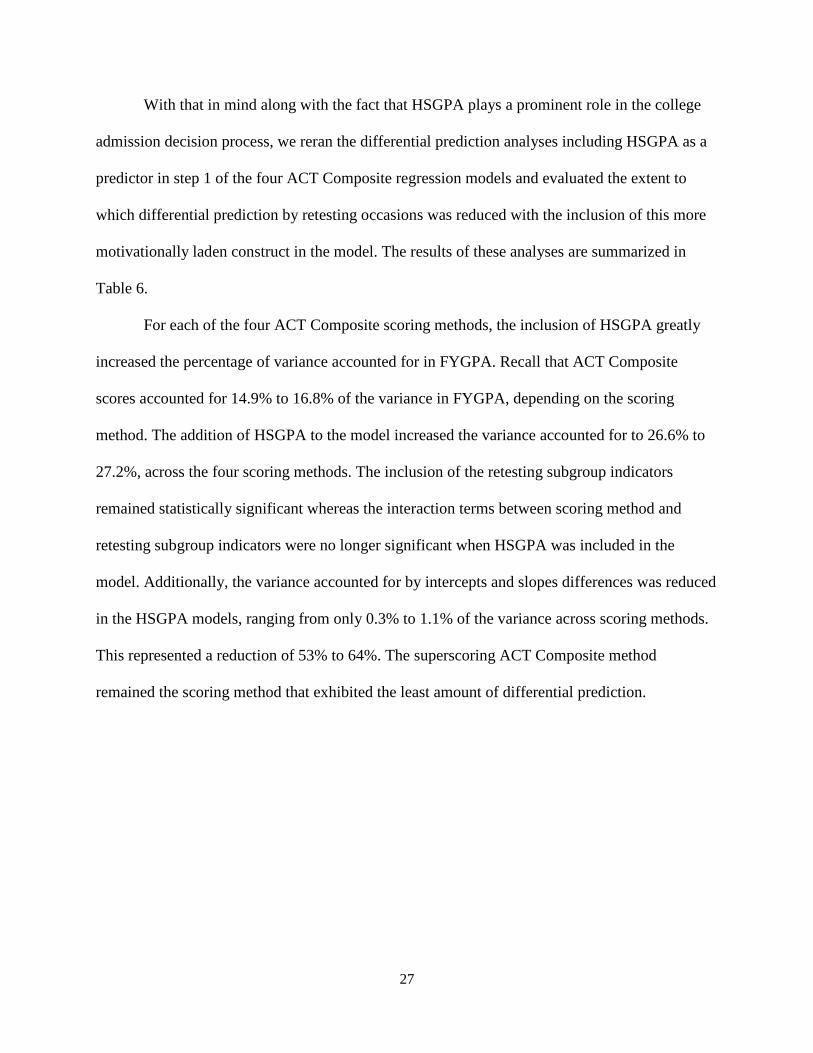
With that in mind along with the fact that HSGPA plays a prominent role in the college
admission decision process, we reran the differential prediction analyses including HSGPA as a
predictor in step 1 of the four ACT Composite regression models and evaluated the extent to
which differential prediction by retesting occasions was reduced with the inclusion of this more
motivationally laden construct in the model. The results of these analyses are summarized in
Table 6.
For each of the four ACT Composite scoring methods, the inclusion of HSGPA greatly
increased the percentage of variance accounted for in FYGPA. Recall that ACT Composite
scores accounted for 14.9% to 16.8% of the variance in FYGPA, depending on the scoring
method. The addition of HSGPA to the model increased the variance accounted for to 26.6% to
27.2%, across the four scoring methods. The inclusion of the retesting subgroup indicators
remained statistically significant whereas the interaction terms between scoring method and
retesting subgroup indicators were no longer significant when HSGPA was included in the
model. Additionally, the variance accounted for by intercepts and slopes differences was reduced
in the HSGPA models, ranging from only 0.3% to 1.1% of the variance across scoring methods.
This represented a reduction of 53% to 64%. The superscoring ACT Composite method
remained the scoring method that exhibited the least amount of differential prediction.
28
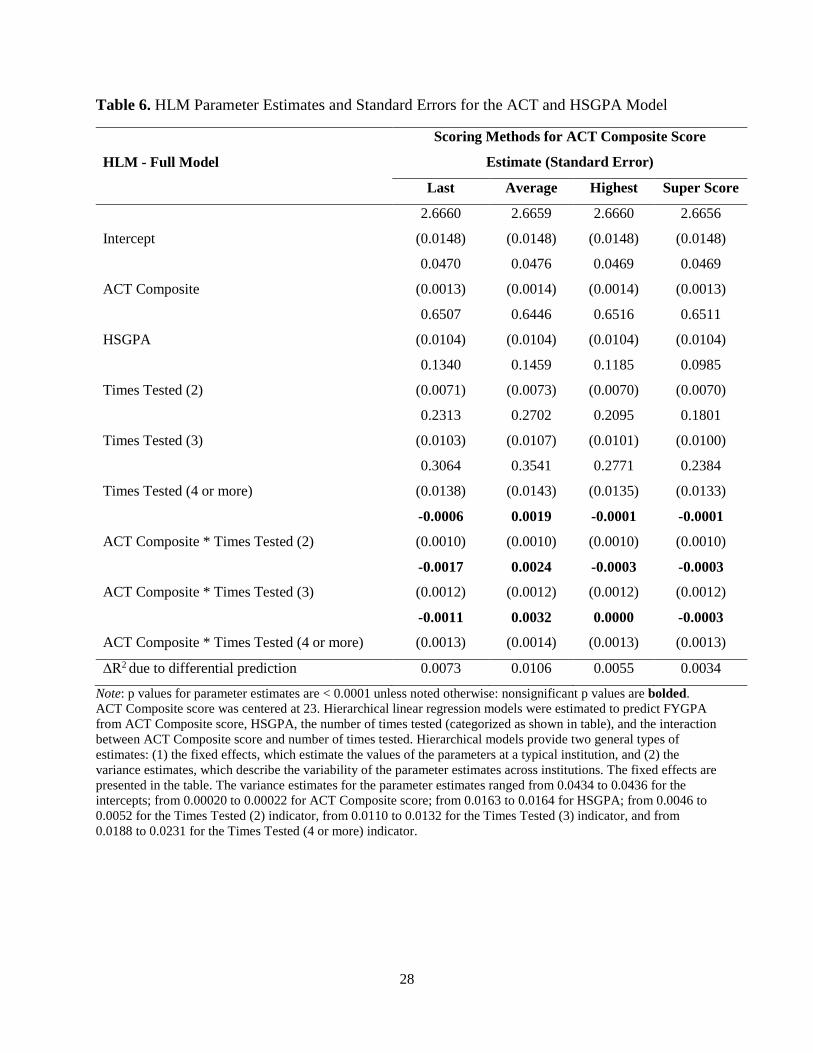
Table 6. HLM Parameter Estimates and Standard Errors for the ACT and HSGPA Model
HLM - Full Model
Scoring Methods for ACT Composite Score
Estimate (Standard Error)
Last Average Highest Super Score
Intercept
2.6660
(0.0148)
2.6659
(0.0148)
2.6660
(0.0148)
2.6656
(0.0148)
ACT Composite
0.0470
(0.0013)
0.0476
(0.0014)
0.0469
(0.0014)
0.0469
(0.0013)
HSGPA
0.6507
(0.0104)
0.6446
(0.0104)
0.6516
(0.0104)
0.6511
(0.0104)
Times Tested (2)
0.1340
(0.0071)
0.1459
(0.0073)
0.1185
(0.0070)
0.0985
(0.0070)
Times Tested (3)
0.2313
(0.0103)
0.2702
(0.0107)
0.2095
(0.0101)
0.1801
(0.0100)
Times Tested (4 or more)
0.3064
(0.0138)
0.3541
(0.0143)
0.2771
(0.0135)
0.2384
(0.0133)
ACT Composite * Times Tested (2)
-0.0006
(0.0010)
0.0019
(0.0010)
-0.0001
(0.0010)
-0.0001
(0.0010)
ACT Composite * Times Tested (3)
-0.0017
(0.0012)
0.0024
(0.0012)
-0.0003
(0.0012)
-0.0003
(0.0012)
ACT Composite * Times Tested (4 or more)
-0.0011
(0.0013)
0.0032
(0.0014)
0.0000
(0.0013)
-0.0003
(0.0013)
∆R2 due to differential prediction 0.0073 0.0106 0.0055 0.0034
Note: p values for parameter estimates are < 0.0001 unless noted otherwise: nonsignificant p values are bolded. ACT Composite score was centered at 23. Hierarchical linear regression models were estimated to predict FYGPA from ACT Composite score, HSGPA, the number of times tested (categorized as shown in table), and the interaction between ACT Composite score and number of times tested. Hierarchical models provide two general types of estimates: (1) the fixed effects, which estimate the values of the parameters at a typical institution, and (2) the variance estimates, which describe the variability of the parameter estimates across institutions. The fixed effects are presented in the table. The variance estimates for the parameter estimates ranged from 0.0434 to 0.0436 for the intercepts; from 0.00020 to 0.00022 for ACT Composite score; from 0.0163 to 0.0164 for HSGPA; from 0.0046 to 0.0052 for the Times Tested (2) indicator, from 0.0110 to 0.0132 for the Times Tested (3) indicator, and from 0.0188 to 0.0231 for the Times Tested (4 or more) indicator.

29
As shown in Figure 3, the regression lines for the superscoring method with the inclusion
of HSGPA are closer together as compared to what is plotted in Figure 1, particularly at the top
end of the score scale where admission decisions are more likely to occur. Additionally, by
plotting the regression line for the total group, the extent to which a student’s FYGPA is over- or
underpredicted by number of testing occasions can be examined. As was the case with the ACT
only model, students who take the ACT twice are accurately predicted since the regression line
for the total group and for students who tested twice are similar. For students who test once,
FYGPA is overpredicted across the score scale range. That is, the regression line for students
who test once falls below the total group line. On the other hand, FYGPA of students who test 3
or more times is underpredicted. Despite a similar pattern of results, the magnitude of the
prediction error is reduced when HSGPA is included in the model.
Figure 3. Differential prediction by ACT Composite scoring method, HSGPA, and number of retesting occasions. HSGPA is held constant at the sample mean of 3.4.
0
0.5
1
1.5
2
2.5
3
3.5
4
4.5
1 3 5 7 9 11 13 15 17 19 21 23 25 27 29 31 33 35
Pred
icte
d FY
GPA
Superscore ACT Composite Score
1 Time 2 Times 3 Times 4 or More Times Total group

30
Specifically, Figure 4 illustrates the magnitude of differential prediction by number of
testing occasions for the superscored ACT Composite model versus the superscored ACT
Composite and HSGPA model; prediction error is estimated at the sample mean of 23. The
results clearly indicate that prediction error is reduced when HSGPA is added to the model. For
example, for students who have a superscored ACT Composite score of 23 based on taking the
ACT 4 or more times, FYGPA is underpredicted by 0.19 for the ACT only model as compared
0.14 for the ACT and HSGPA model. A similar pattern of results is evident for students who
retest less often.
Figure 4. Magnitude of differential prediction by number of testing occasions for the Superscore ACT Composite model versus the Superscore ACT Composite and HSGPA model when ACT Composite score is held constant at the sample mean of 23. Prediction error is calculated by subtracting one’s expected FYGPA based on the overall model from the expected value based on the model that includes retesting subgroup indicators and the interaction between the ACT Composite score and retesting indicators
-0.15
-0.01
0.10
0.19
-0.10
-0.01
0.08
0.14
-0.30
-0.20
-0.10
0.00
0.10
0.20
0.30
0.40
1 Time 2 Times 3 Times 4 or More Times
Pre
dict
ion
Err
or
Number of Testing Occassions
Superscore Superscore and HSGPA

31
(parameter estimates are provided in Table 3 for the Superscore ACT Composite model and Table 4 for the Superscore ACT Composite and HSGPA model).
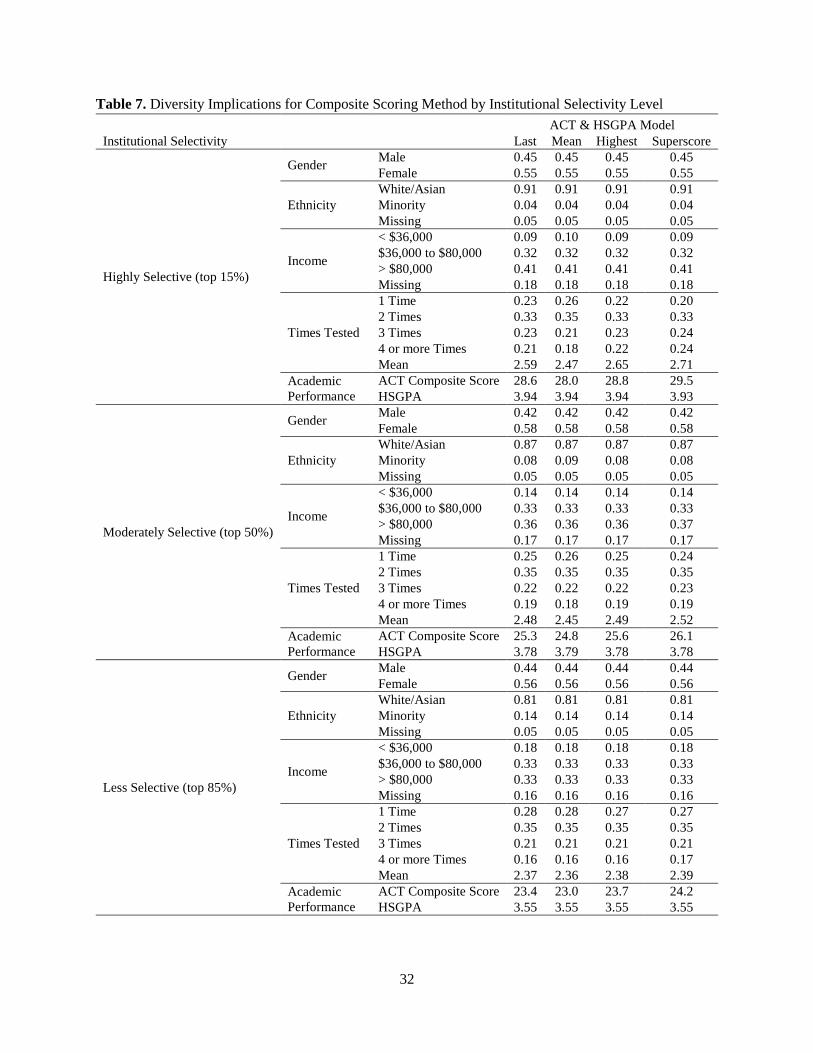
Diversity Implications. Table 7 provides the diversity implications of employing different
scoring methods at three levels of selectivity (admittance rate: top 15%, top 50%, top 85%).
Interestingly, the gender, ethnic, and income makeup is unaffected by the choice of scoring
method. For example, for scenarios where institutions can be highly selective and only admit the
top 15% of applicants, all scoring methods (last, average, highest, superscore) resulted in an
admitted class that was 45% male, 4% minority, and 9-10% low-income. The only variables that
varied by scoring method was number of times tested and academic performance. In particular,
the superscoring method led to the admittance of students who retested more often; however, the
retesting differences by scoring method decreased as institutional selectivity decreased.
Similarly, the average ACT Composite score of admitted students was highest for the
superscoring method and lowest for the average method; mean HSGPA of an admitted class was
unaffected by scoring method.
32
Table 7. Diversity Implications for Composite Scoring Method by Institutional Selectivity Level ACT & HSGPA Model Institutional Selectivity Last Mean Highest Superscore
Highly Selective (top 15%)
Gender Male 0.45 0.45 0.45 0.45 Female 0.55 0.55 0.55 0.55
Ethnicity White/Asian 0.91 0.91 0.91 0.91 Minority 0.04 0.04 0.04 0.04 Missing 0.05 0.05 0.05 0.05
Income
< $36,000 0.09 0.10 0.09 0.09 $36,000 to $80,000 0.32 0.32 0.32 0.32 > $80,000 0.41 0.41 0.41 0.41 Missing 0.18 0.18 0.18 0.18
Times Tested
1 Time 0.23 0.26 0.22 0.20 2 Times 0.33 0.35 0.33 0.33 3 Times 0.23 0.21 0.23 0.24 4 or more Times 0.21 0.18 0.22 0.24 Mean 2.59 2.47 2.65 2.71
Academic Performance
ACT Composite Score 28.6 28.0 28.8 29.5 HSGPA 3.94 3.94 3.94 3.93
Moderately Selective (top 50%)
Gender Male 0.42 0.42 0.42 0.42 Female 0.58 0.58 0.58 0.58
Ethnicity White/Asian 0.87 0.87 0.87 0.87 Minority 0.08 0.09 0.08 0.08 Missing 0.05 0.05 0.05 0.05
Income
< $36,000 0.14 0.14 0.14 0.14 $36,000 to $80,000 0.33 0.33 0.33 0.33 > $80,000 0.36 0.36 0.36 0.37 Missing 0.17 0.17 0.17 0.17
Times Tested
1 Time 0.25 0.26 0.25 0.24 2 Times 0.35 0.35 0.35 0.35 3 Times 0.22 0.22 0.22 0.23 4 or more Times 0.19 0.18 0.19 0.19 Mean 2.48 2.45 2.49 2.52
Academic Performance
ACT Composite Score 25.3 24.8 25.6 26.1 HSGPA 3.78 3.79 3.78 3.78
Less Selective (top 85%)
Gender Male 0.44 0.44 0.44 0.44 Female 0.56 0.56 0.56 0.56
Ethnicity White/Asian 0.81 0.81 0.81 0.81 Minority 0.14 0.14 0.14 0.14 Missing 0.05 0.05 0.05 0.05
Income
< $36,000 0.18 0.18 0.18 0.18 $36,000 to $80,000 0.33 0.33 0.33 0.33 > $80,000 0.33 0.33 0.33 0.33 Missing 0.16 0.16 0.16 0.16
Times Tested
1 Time 0.28 0.28 0.27 0.27 2 Times 0.35 0.35 0.35 0.35 3 Times 0.21 0.21 0.21 0.21 4 or more Times 0.16 0.16 0.16 0.17 Mean 2.37 2.36 2.38 2.39
Academic Performance
ACT Composite Score 23.4 23.0 23.7 24.2 HSGPA 3.55 3.55 3.55 3.55

33
Discussion
When admission officers evaluate applicants based on their academic preparation, it is
clear that consideration of how to treat multiple scores has been given a good deal of thought as
evidenced by research on validity of various scoring methods (Boldt et al., 1986; Patterson et al.,
2012; Roszkowski & Spreat, 2016) in addition to surveys on the prevalence of different practices
(College Board, 2010). In general, the results suggest that the various scoring methods have
similar validity coefficients. However, it appears that less attention has been given to the number
of retesting occasions and its interaction with scoring method. The current study indicates that as
retesting increases, the magnitude of underprediction increases. However, the magnitude of
underprediction is minimized when superscoring methods are employed along with inclusion of
HSGPA in the prediction model.
The current study extends on previous findings by including the number of retests as a
predictor in the regression model rather than developing a regression model for non-retesters and
applying those results to retesters to evaluate differential prediction. We contend that the method
used in the current study is more accurate for at least two reason. First, taking the ACT on
multiple occasions has become common practice and has only increased in prevalence over time
(Harmston & Crouse, 2016). For example, in 2009, 41% of ACT-tested students took the ACT
more than once. By 2015, the percentage had increased to 45%. This increasing trend is even
more impressive in light of all the states adopting the ACT statewide, which include students
who are not college bound and thus not likely to retest (Allen, 2015b). The proportion of students
who retest that are college-bound is significantly higher; 70% of the current sample took the
ACT more than once. Therefore, a model based on single testers is not likely to be representative
of the larger population of interest. Secondly, the methods employed in the current study are

34
more likely to mirror what happens in practice. That is, admission officers would likely develop
models on all of their applicants; not on single testers and then apply to retesters. By comparing
an overall model to a model that explicitly took into account the number of retests, the results
suggest that an overall model overpredicts how students who took the ACT only once would
perform in college. Previous research had assumed that they were accurately predicted.
Another contribution of this study is the evaluation of the diversity implications of
employing one scoring method versus another. Interestingly, despite the fact that underserved
students are less likely to retest (Harmston & Crouse, 2016), the superscoring method did not
result in a less diverse admitted class as compared to the other three methods. In fact, the gender,
racial, and parental income distributions were identical across the four scoring methods. These
analyses were based on students who were already admitted to college. Future research should
evaluate whether these findings hold on a sample of high school students rather than college
students. Follow-up analyses based on 4.3 million 2009-2012 ACT-tested high school graduates
also indicated no diversity benefits for one scoring method over another.
There are several limitations of the current study worth noting. First of all, we only had
access to ACT records. Students have the option to take both the ACT and SAT, and it has been
speculated that the prevalence of taking both exams has increased over time (Thomas, 2004). It
would be interesting to evaluate whether the pattern of results would differ if all ACT and SAT
records were available for each student. Such a study may be feasible given that there is a
concordance relating SAT and ACT scores; however, differences in content specifications, such
as the ACT including a science test, would require some assumptions to be made prior to
converting scores to a single metric. Future research should evaluate retesting patterns as it

35
relates to both testing programs in conjunction and the impact of various scoring methods on
validity and access related issues.
Another limitation of the study deals with the changing landscape of statewide adoption
of ACT testing (Allen, 2015a). Since 2011, many states have decided to implement statewide
testing of the ACT to all public high school students within their state. Such practices increase
access to testing and thus reduce at least one barrier or requirement of most college applications.
This is particularly true for underserved students who are less likely to take the ACT. Since
many students would not have taken the ACT at all if not for statewide testing (Allen, 2015b),
the current study removed all students who took the ACT as part of a statewide administration
from the sample. Follow up analyses indicate that the removal of these students had no impact on
the findings of the current study. However, as more and more states adopt the ACT statewide,
the ability to examine retesting behavior, not confounded by statewide policies, will become
more complicated.
Finally, the measure of HSGPA used in the current study was based on self-reported
information. Even though research has found that students tend to accurately report their high
school grades (Kuncel, Credé, & Thomas, 2005; Sanchez & Buddin, 2015), it would have been
preferable if actual transcript data were available. Even though the inclusion of HSGPA reduced
the magnitude of differential of FYGPA by retesting occasions, it did not completely eliminate it.
Future research should examine whether differential prediction would be completely eliminated
if actual transcript information was used. Moreover, future research should explore whether the
pattern of results observed in the current study hold for other measures of college performance
such as college credits earned, retention, and graduation.

36
In a similar vein, there were no pure measures of academic discipline or motivation
available in the current dataset. If such information was available, one could test the hypothesis
of whether motivation explains why FYGPA is underpredicted for students who retest more
often. Interestingly, a study examining the relationship between personality factors and retesting
behavior found that conscientiousness was not significantly related to retesting; however,
neuroticism was (Zyphur, Islam, & Landis, 2007). Future research should evaluate whether these
findings replicate for other samples. It may also be useful to explore the relationship between
retesting behavior and lower-order or facets of personality traits (e.g. achievement striving) that
may be better aligned or theoretically related to motivation and sustaining effort than global traits
such as conscientiousness and neuroticism.
In sum, the current study adds to the literature on the validity and diversity implications
of various scoring methods as it pertains to college admissions. The results suggest that
superscoring may be the most valid method for treating multiple scores. Additionally,
understanding what factors, such as academic motivation, are related to retesting seems like a
fruitful research endeavor, potentially shedding light on the development of new noncognitive
admission measures.

37
References
ACT (2015). The condition of college and career readiness 2015. Iowa City, IA: ACT.
AERA, APA, and NCME. (1999). Standards for educational and psychological testing.
Washington, DC: American Educational Research Association, American Psychological
Association, National Council on Measurement in Education.
Allen, J. (2013). Updating the ACT college readiness benchmarks. Iowa City, IA: ACT.
Allen, J. (2015a). Anticipated changes in ACT scores and participation rates with ACT
statewide adoption. Iowa City, IA: ACT.
Allen, J. (2015b). How many students use ACT state and district testing to take their sole
ACT test? Iowa City, IA: ACT.
Allen, J. & Sconing, J. (2005). Using ACT assessment scores to set benchmarks for college
readiness. Iowa City, IA: ACT.
Boldt, R. F. (1977). Evaluation of Three Methods for Treating Repeaters' Scores. Princeton,
N.J.: Law School Admission Council.
Boldt , R. F., Centra, J. A., & Courtney, R. G. (1986). The validity of various methods of treating
multiple SAT® scores. New York, NY: College Board.
Camara, W., O’Connor, R., Mattern, K., & Hanson, M. A. (2015). Beyond academics: A
holistic framework for enhancing education and workplace success. Iowa City, IA: ACT.
Cleary, T. A. (1968). Test bias: Prediction of grades of Negro and White students in integrated
colleges. Journal of Educational Measurement, 5(2), 115-124.
Clinedinst, M. E. (2015). NACAC state of college admission 2014. Arlington, VA: National
Association for College Admission Counseling.
The College Board. (2015). 2015 college-bound seniors total group profile report. New

38
York: The College Board.
The College Board. (2010). SAT® score-use practices by participating institution. Retrieved
from http://professionals.collegeboard.com/profdownload/sat-score-use-practices-list.pdf.
Harmston, M. & Crouse, J. (2016). Multiple testers: What do we know about them? Iowa City,
IA: ACT.
Kobrin, J. L., Patterson, B. F., Shaw, E. J., Mattern, K. D., and Barbuti, S. M. (2008). Validity of
the SAT® for predicting first-year college grade point average. New York, NY: The
College Board.
Kuncel, N. R., Credé, M., & Thomas, L. L. (2005). The validity of self-reported grade point
averages, class ranks, and test scores: A meta-analysis and review of the
literature. Review of Educational Research, 75(1), 63-82.
Linn, R. L. (1977). On the Treatment of Multiple Scores for Law School Admission Test
Repeaters. Princeton, N.J.: Law School Admission Council.
Mattern, K., Allen, J., & Camara, W. (2016). Thoughts on a multidimensional middle school
index of college readiness. Educational Measurement: Issues and Practice, 35(3), 30-34.
Mattern, K. & Patterson, B. (2014). Synthesis of recent SAT validity findings: Trend data over
time and cohorts. New York: The College Board.
Patterson, B., Mattern, K., & Swerdzewski, P. (2012). Are the best scores the best scores for
predicting college success? Journal of College Admission, 217, 34-45.
Radunzel, J., & Noble. J. (2013). Differential effects on student demographic groups of using
ACT® College Readiness Assessment Composite score, ACT Benchmarks, and high
school grade point average for predicting long-term college success through degree
completion. Iowa City, IA: ACT.

39
Roszkowski, M., & Spreat, S. (2016). Retaking the SAT may boost scores but this doesn’t hurt
validity. Journal of the National College Testing Association, 2(1), 1-16.
Sackett, P. R. (2005). The performance-diversity tradeoff in admission testing. In W. J. Camara
& E. W. Kimmel (Eds.), Choosing students: Higher education admissions tools for the
21st century (pp. 109-125). Mahwah, NJ: Lawrence Erlbaum Associates, Inc.
Sanchez, E. (2013). Differential effects of using ACT® College Readiness Assessment scores
and high school GPA to predict first-year college GPA among racial/ethnic, gender,
and income groups. Iowa City, IA: ACT.
Sanchez, E. I. & Buddin, R. (2015). How accurate are self-reported high school courses,
course grades, and grade point average? Iowa City, Iowa: ACT.
Westrick, P. A., Le, H., Robbins, S. B., Radunzel, J. M., & Schmidt, F. L. (2015). College
performance and retention: A meta-analysis of the predictive validities of ACT®
scores, high school grades, and SES. Educational Assessment, 20(1), 23-45.
Zyphur, M. J., Islam, G., & Landis, R. S. (2007). Testing 1, 2, 3, ...4? The personality of repeat
SAT test takers and their testing outcomes. Journal of Research in Personality, 41(3),