how race counts for hispanic americans john r. logan...
TRANSCRIPT

How Race Counts for Hispanic Americans
John R. Logan Lewis Mumford Center
University at Albany
July 14, 2003
Mumford Center research assistants Hyoung-jin Shin and Jacob Stowell contributed to the analyses reported here.
Hispanics are now the largest minority group in the U.S. They are also quite diverse. A previous Mumford Center report analyzed differences among Hispanics by national origin. This report assesses racial differences among Hispanics. Census data do not allow us to measure how people are actually perceived in the neighborhoods where they live and work and go to school. They do enable us to count Hispanics with different racial identifications, compare them in terms of social and economic background, evaluate their residential integration with whites, blacks, and other Hispanics, and assess whether other characteristics of their neighborhoods are more similar to the neighborhoods where whites, blacks or other Hispanics live. Since 1970 the U.S. Census has asked all Americans to identify their race and, separately, whether they are Hispanic. This means Hispanics can be of any race. It is widely understood that there is a small black minority among Hispanics. Less well known is that only about half of Hispanics in Census 2000 identified themselves in standard racial categories such as white, black, or Asian on their census form. Nearly as many people instead wrote in their own term, most often “Latino,” “Hispanic,” or a similar word. Many of these people might be perceived by non-Hispanics as “white” – but apparently they do not see themselves in that way. In this report they are referred to as “Hispanic Hispanics.” We find substantial differences among these Hispanic racial groups:
• Hispanic Hispanics are the fastest growing segment, and very likely they will soon be an absolute majority of Hispanic Americans.
• There are nearly a million black Hispanics. These people have a socioeconomic profile much more similar to non-Hispanic blacks than to other Hispanic groups, and their neighborhoods have nearly as many black as Hispanic residents. Many black Hispanic children have a non-Hispanic black mother or father.
• A very small share of Mexicans identifies as black. Still, there are nearly a quarter million black Mexicans in the United States. Dominicans and Puerto Ricans are most likely to identify as black. Cubans, in contrast, mostly identify as white.

• White Hispanics have the highest socioeconomic standing, they live in closest proximity to non-Hispanic whites, and their neighborhoods have a more affluent class composition than those of other Hispanic groups.
• A strong predictor of racial identification of Hispanics is the racial mix of the metropolitan region where they live. Among metros with the largest Hispanic populations, Miami has the highest share of white Hispanics; New York has the highest share of black Hispanics. In California and Texas, Hispanic Hispanics generally are the majority of Hispanics.
Technical issues: measuring race among Hispanics The Census Bureau treats race and Hispanic origin as distinct concepts, although often users of census data and the Bureau itself combine them to compare information about non-Hispanic blacks and Hispanics. Background information about the Bureau’s approach can be found at: http://www.census.gov/population/www/socdemo/compraceho.html. Census 2000 switched the order of the “Is this person Spanish/Hispanic/Latino?” question and the race identification question, asking the Hispanic origin question before the race question. This change may have affected Hispanics’ response to the race question. One source of information for this report is microdata from the 1980, 1990, and 2000 censuses (Public Use Microdata Samples, or PUMS). These data files allow maximum flexibility in the creation of categories of race and Hispanic origin, and they make it possible to tabulate many social and economic characteristics of Hispanics by their self-reported race. However they are sample data, and they are most reliable at the national level. For information on specific metropolitan regions and census tracts within them, we rely on pre-tabulated summary files from Census 2000 (SF1 and SF3). Use of these files is complicated by the fact that people were able to report multiple races in this census, but summary files available at this time report data for only a few of the possible combinations. For the purposes of this study, we classify Hispanics into the following categories:
• Hispanic Hispanics. Persons who identified as “other race” (most often writing in “Hispanic” or a similar term) alone or in combination with another specific race. The census refers to these people as “some other race” Hispanics.
• Black Hispanics. Persons who identified as “black” alone or in combination with
another race. There is some overlap in the summary file data between this category and the Hispanic Hispanic category. About 120,000 Hispanic Hispanics also identified themselves as black.
• White Hispanics. Persons who identified neither as “other race” nor as “black.” A more
complete label for this group would be “white, Asian, or Native American.” However analysis of microdata shows that 96% in this category identified only as white.
2

Size and characteristics of Hispanic racial subgroups Table 1 shows the evolution of the Hispanic population of the United States by race for 1980, 1990, and 2000 (calculated from PUMS data for each year). The Hispanic population more than doubled in this period. The category that we call “white Hispanic” is still the largest. It included nearly two thirds of Hispanics in 1980, declining to a 54% share in 1990, and now just below half in 2000. In 1970, only 700,000 Hispanics identified themselves as “some other race.” Since then, however, this group that we call Hispanic Hispanics has risen to about a third in 1980, 44% in 1990 and 47% in 2000. A small but steady share of Hispanics identified as black in all three years, just under 3%. Though a small percentage, the number of black Hispanics has grown from under 400,000 to over 900,000 in the period.
Table 1. Racial composition of the Hispanic population of the U.S., 1980-2000
Growth 1980 1990 2000 1980-1990 1990-2000Hispanic Hispanic 4,979,240 33.7% 9,426,634 44.2% 16,700,055 47.4% 89.3% 77.2% Black Hispanic 388,240 2.6% 633,516 2.9% 939,471 2.7% 63.2% 48.3% White Hispanic 9,397,240 63.7% 11,776,701 53.9% 17,601,942 49.9% 25.3% 49.5% Hispanic Total 14,764,720 100% 21,836,851 100% 35,241,468 100% 47.9% 61.4% Who among Hispanics identifies as black or Hispanic rather than white? Table 2 shows that black Hispanics are very distinctive. They are much less likely to be immigrants compared to the average Hispanic (28% compared to 41% for all Hispanics), and much less likely to speak a language other than English at home (61% compared to 79%). They have an advantage in education (with a mean of 11.7 years, nearly a high school level, compared to 10.5 years for all Hispanics). On the other hand their actual economic performance is worse, with a lower median household income ($3500 below the Hispanic average), higher unemployment (more than 3 percentage points above the Hispanic average), and a higher poverty rate (31.5% compared to 26.0%).
Table 2 also allows a comparison of Black Hispanics to non-Hispanic Blacks. Like black Hispanics, non-Hispanic blacks had a lower median income ($34,300), higher unemployment rate (11.0%), and higher rate of poverty (29.7%) than did the average Hispanic. Compared to black Hispanics, non-Hispanic blacks were slightly poorer but had lower rates of unemployment and poverty and higher education. The main differences between them were related to nativity. Non-Hispanic blacks in 2000 were much less likely to be foreign-born (6.7%). In this respect, black Hispanics fall in between African
3

Americans (all born in the U.S.) and Afro-Caribbeans, a majority of whom are foreign-born.
White Hispanics have the highest incomes and lowest rates of unemployment and poverty. The table shows that Hispanics who identified themselves as “other race” in the census – those we call Hispanic Hispanics – fall squarely between white Hispanics and black Hispanics in their income, unemployment and poverty levels. However they are the Hispanic group with the highest proportion of foreign-born members and they are most likely to hold onto the Spanish language.
Table 2. Socioeconomic characteristics of Hispanic groups and blacks, 2000 Foreign Speak other Years of Median Below born language education income Unemployed poverty
White Hispanic 38.8% 75.7% 11.0 $39,900 8.0% 24.1% Hispanic Hispanic 43.8% 82.6% 9.9 $37,500 9.5% 27.7% Black Hispanic 28.2% 60.8% 11.7 $35,000 12.3% 31.5% Hispanic Total 40.9% 78.6% 10.5 $38,500 8.8% 26.0% Non-Hispanic Black 6.4% 6.3% 12.5 $34,000 11.0% 29.7%
We can also use PUMS data to classify the Hispanic racial groups by national origin, as reported by the census. Table 3 shows that Cubans are most likely to identify as white; Dominicans are least likely. Dominicans are the most likely to identify in the other two categories. The highest share of black Hispanics is found among Dominicans (12.7%). There are about 100,000 black Dominicans, who are especially prominent in New York City. Puerto Ricans also have a higher than average share of black Hispanics (8.2%), and the highest number of black Hispanics are Puerto Rican (more than a quarter million). Though a very small percentage of Mexicans are black Hispanics, this group still includes nearly a quarter million persons.
Table 3. National origins of Hispanics by race, 2000
White Hispanic Hispanic Hispanic Black Hispanic Total
Mexican 10,324,597 49.3% 10,406,214 49.7% 221,905 1.1% 20,952,716 Puerto Rican 1,661,577 49.0% 1,450,124 42.8% 277,765 8.2% 3,389,466 Cuban 1,071,596 85.4% 123,427 9.8% 59,341 4.7% 1,254,364 Dominican 197,939 24.3% 514,185 63.1% 103,361 12.7% 815,485 Central American 746,847 42.1% 956,540 53.9% 72,823 4.1% 1,776,210 South American 854,785 61.1% 522,762 37.4% 21,956 1.6% 1,399,503 All Others 2,744,601 48.6% 2,726,803 48.2% 182,320 3.2% 5,653,724 Total 17,601,942 49.9% 16,700,055 47.4% 939,471 2.7% 35,241,468
4

More detailed analysis shows that about half of black Hispanics are children under the age of 18. What is the role of racially mixed parentage in the identification of these children as black Hispanics? This question cannot be fully answered, because the majority of black Hispanic children do not live with both parents. However, based on those cases where both parents are present, the microdata allow us to tabulate the race of the child along with the race of each parent. Table 4 presents the results for all Hispanic children under 18 who live with both parents. A large majority of white Hispanic children have parents who are both white Hispanic (over 70%). An even higher share of Hispanic Hispanic children have parents who are both Hispanic Hispanic (85%). In contrast, it is rare that a black Hispanic child has two black Hispanic parents (only 31%). For nearly half the black Hispanic children, one of the parents is non-Hispanic black. In many of the remaining cases, one parent is identified as black Hispanic, while the other parent is white Hispanic or Hispanic Hispanic. This result suggests that intermarriage is the most important source of the black Hispanic population, with a strong likelihood of having a non-Hispanic black parent. Research using non-census data sources would be required to assess to what degree the same is true for older black Hispanics.
Table 4. Hispanic children living with both parents, by their own race and race of their parents, 2000
Total white Hispanic children 3,355,395 100%Both parents white Hispanic 2,407,052 71.7%One parent non-Hispanic white 650,477 19.4%Other combinations 297,866 8.9% Total Hispanic Hispanic children 3,310,500 100%Both parents Hispanic Hispanic 2,798,957 84.6%One parent white Hispanic or black Hispanic 195,863 5.9%Other combinations 315,680 9.5% Total black Hispanic children 133,500 100%Both parents black Hispanic 40,700 30.5%One parent non-Hispanic black 60,394 45.2%Other combinations 32,406 24.3%
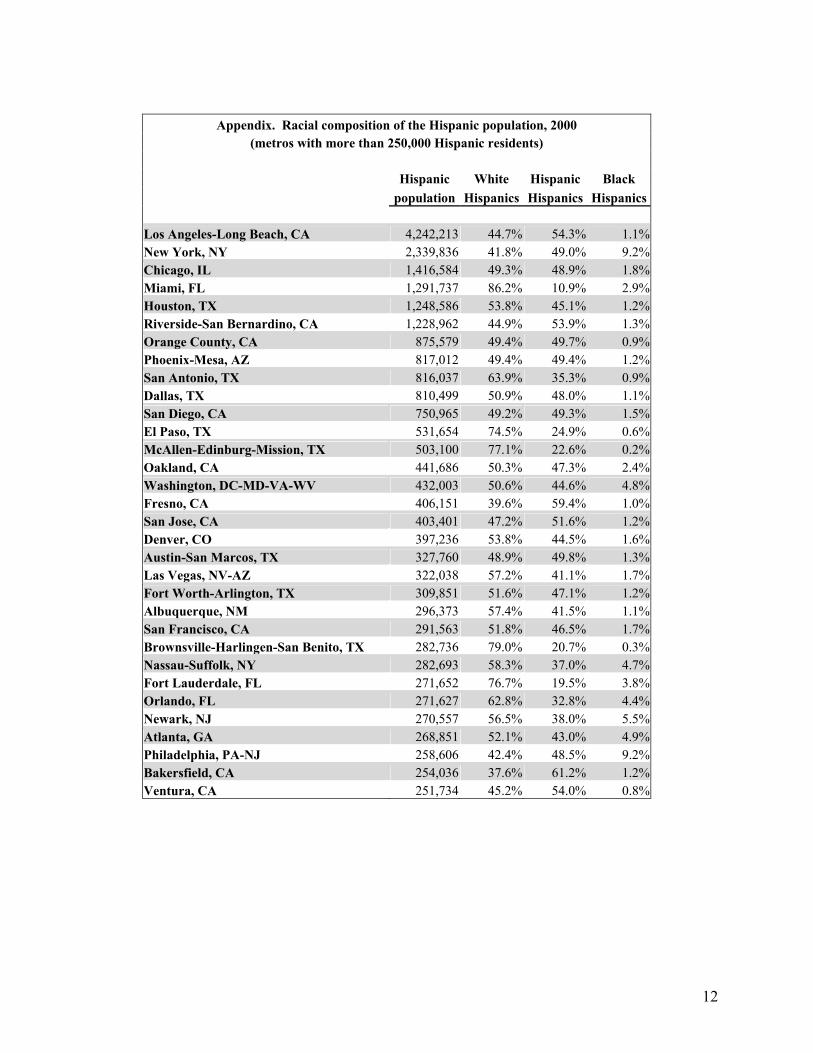
Geographic distribution As would be expected – if only because of the differences by national origin – the Hispanic racial groups are unevenly distributed around the country. Table 5 lists the six metropolitan regions with more than a million Hispanics and shows their racial composition (a more complete list of those with over 250,000 Hispanics is provided in the Appendix).
5

Miami stands out with nearly 90% white among its Hispanic residents. New York, reflecting in part its Puerto Rican and Dominican communities, is unusual with nearly 10% black Hispanics.
Table 5. Racial composition of the Hispanic population, 2000 (metros with more than 1,000,000 Hispanic residents)
Hispanic White Hispanic Black Total Hispanic Hispanic Hispanic Los Angeles-Long Beach, CA 4,242,213 44.7% 54.3% 1.1% New York, NY 2,339,836 41.8% 49.0% 9.2% Chicago, IL 1,416,584 49.3% 48.9% 1.8% Miami, FL 1,291,737 86.2% 10.9% 2.9% Houston, TX 1,248,586 53.8% 45.1% 1.2% Riverside-San Bernardino, CA 1,228,962 44.9% 53.9% 1.3%
There is a more general phenomenon operating here. The racial composition within the Hispanic population is closely related to the area’s overall racial and ethnic mix. Metropolitan regions with large non-Hispanic white populations tend to have a larger share of white Hispanics; those with larger Hispanic populations tend to have more Hispanic Hispanics; and those with larger non-Hispanic black populations have more black Hispanics. This pattern is demonstrated in Table 6.
• In metros that are less than 70% non-Hispanic white, the white share among Hispanics is only 53%. In those that are more than 85% white, the white share among Hispanics is 60%.
• Where Hispanics are less than 5% of the population, Hispanic Hispanics are only 35% of
this group. Where they are above 10% of the population, Hispanic Hispanics have a 45% share.
• Where the population is less than 5% black, black Hispanics have only a 3% share of all
Hispanics, but this rises to 7% in places where more than 10% of residents are black. This pattern is consistent with two kinds of processes that could influence people’s racial identification. First, there is the phenomenon of intermarriage, already mentioned above. The racial mix of an area directly influences the odds that a given Hispanic person will marry another Hispanic, or a non-Hispanic white, or a black person. This choice may affect their own racial identity and certainly will influence that of their offspring. Second, there may be a broader cultural process by which people assume an identity more consistent with the larger community where they live. This would help explain what leads white Hispanics and Hispanic Hispanics to different racial choices, despite the overall similarities in their social and economic position.
6

Table 6. Racial composition of the Hispanic population according to the overall racial mix of the metropolitan region, 2000
Metro percent white White Hispanic Hispanic Hispanic Black Hispanic Less than 70% 53.0% 42.0% 5.0% 70-85% 53.9% 41.0% 5.0% More than 85% 59.8% 35.5% 4.6% Total 55.6% 39.5% 4.9% Metro percent Hispanic White Hispanic Hispanic Hispanic Black Hispanic Less than 5% 58.3% 35.2% 6.5% 5-10% 51.7% 44.0% 4.3% More than 10% 52.7% 45.2% 2.0% Total 55.6% 39.5% 4.9% Metro percent black White Hispanic Hispanic Hispanic Black Hispanic Less than 5% 57.3% 39.6% 3.1% 5-10% 54.7% 40.9% 4.4% More than 10% 54.4% 38.5% 7.0% Total 55.6% 39.5% 4.9%
Neighborhood characteristics of Hispanics by race A final comparison of Hispanics with different racial identification is in terms of the kinds of neighborhoods where they live. Specifically, how segregated are these Hispanic subgroups from whites and blacks who are non-Hispanic? What are their neighborhoods like with respect to class composition and nativity of residents? The relevant information is shown in Tables 7-8, which are based on a weighted average of all metropolitan regions in the nation (counting regions more heavily if more members of the particular Hispanic subgroup live there). Neighborhood characteristics are based on the census tract where people live. (Recall that the categories of race and Hispanic origin from the summary file data partially overlap with one another; the sum of the categories is greater than the Hispanic total.) The degree to which two groups live together in the same neighborhoods or in separate neighborhoods is one of the best indicators of social connections between them. In this respect there is a very clear and consistent contrast between white Hispanics and black Hispanics. White Hispanics are less segregated from non-Hispanic whites (D=45.5) than from non-Hispanic blacks (D=50.3). They typically live in neighborhoods that are almost as white (39.6%) as they are Hispanic (43.8%), and where only a small share of the population is non-Hispanic black (9.3%). Black Hispanics are the most segregated from whites (D=61.8), and their segregation from blacks is unusually low (D=35.0). They live in neighborhoods where there are nearly as many black (28.2%) as white residents (34.0%).
7

Black Hispanics and non-Hispanic blacks have very similar segregation from whites. Non-Hispanic blacks on average live in metropolitan regions where their segregation from non-Hispanic whites is 65.0. The typical non-Hispanic black person’s neighborhood is 33% white. The difference, of course, is that black Hispanics live in much more Hispanic environments than do blacks.
Hispanic Hispanics are as segregated from blacks as are white Hispanics, but at the same time they are more segregated from whites.
Table 7. Residential pattern of metropolitan Hispanic groups and blacks, 2000 White Hispanic Black Non-Hispanic Hispanic Hispanic Hispanic Black Segregation (Index of Dissimilarity) from: Non-Hispanic whites 45.5 57.3 61.8 64.6 Non-Hispanic blacks 50.3 49.1 35.0 0.0 White Hispanics 0.0 17.3 34.1 55.0 Hispanic Hispanics 17.6 0.0 30.7 54.1 Black Hispanics 31.5 30.4 0.0 33.7 In average group member's neighborhood: % non-Hispanic white 39.6 34.1 34.0 33.3 % non-Hispanic black 9.3 11.5 28.2 51.0 % Hispanic 43.8 46.7 31.1 11.4 % White Hispanic 26.2 22.5 15.2 5.5 % Hispanic Hispanic 19.1 25.9 15.9 5.8 % Black Hispanic 0.8 1.0 2.2 0.9 Total population (SF1 definitions) 18,027,799 15,324,344 972,892 30,381,389
Compared to other Hispanic groups, black Hispanics’ neighborhoods have the lowest median income, the highest share of poor residents, and the lowest share of homeowners. Finally – partly reflecting their own relatively low proportion of foreign-born – they live in neighborhoods with the lowest percentage of immigrants and neighbors who speak a language other than English in their homes.
Again a comparison with non-Hispanic blacks is useful. Their typical neighborhood has a median income of $36,200 and a poverty rate of 20.4% -- almost the same as black Hispanics, and quite distinct from white Hispanics. However, their neighborhoods have higher levels of homeownership (52.8%) and lower shares of immigrants and non-English-language speakers.
8
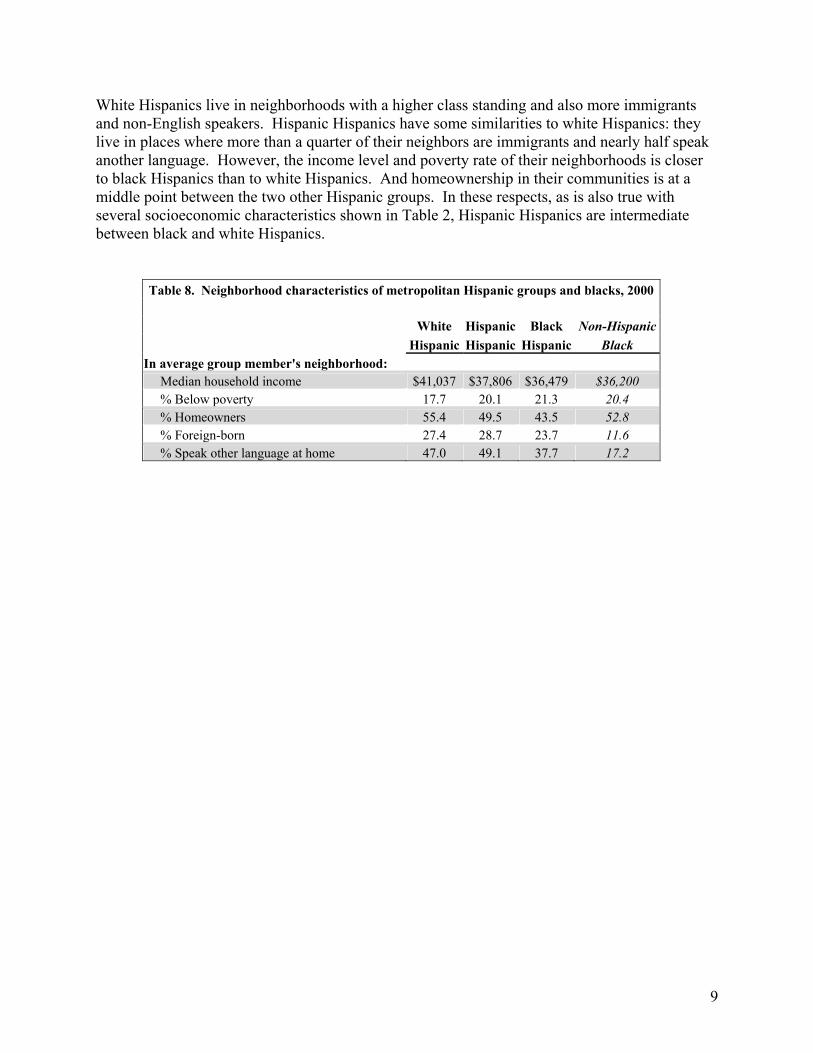
White Hispanics live in neighborhoods with a higher class standing and also more immigrants and non-English speakers. Hispanic Hispanics have some similarities to white Hispanics: they live in places where more than a quarter of their neighbors are immigrants and nearly half speak another language. However, the income level and poverty rate of their neighborhoods is closer to black Hispanics than to white Hispanics. And homeownership in their communities is at a middle point between the two other Hispanic groups. In these respects, as is also true with several socioeconomic characteristics shown in Table 2, Hispanic Hispanics are intermediate between black and white Hispanics.
Table 8. Neighborhood characteristics of metropolitan Hispanic groups and blacks, 2000 White Hispanic Black Non-Hispanic Hispanic Hispanic Hispanic Black In average group member's neighborhood: Median household income $41,037 $37,806 $36,479 $36,200 % Below poverty 17.7 20.1 21.3 20.4 % Homeowners 55.4 49.5 43.5 52.8 % Foreign-born 27.4 28.7 23.7 11.6 % Speak other language at home 47.0 49.1 37.7 17.2
9

Conclusions: Race counts for Hispanic Americans Whether Hispanics choose to identify their race as white, Hispanic, or black is not a matter of purely personal preference – it reflects the social position of group members. This is most evident in the case of the smallest group, black Hispanics. Their individual characteristics such as income and unemployment make them in many ways more similar to non-Hispanic blacks than to other Hispanic groups. Whether Hispanics identify themselves as black is directly responsive to the size of the black community where they live. Nearly half of black Hispanic children have a non-Hispanic black mother or father. Black Hispanics have a very low level of segregation from non-Hispanic blacks. And they live in neighborhoods with very similar class composition to non-Hispanic blacks. Users of census data have been reluctant to classify black Hispanics together with non-Hispanic blacks, perhaps because of the distinctive linguistic background and national origins of black Hispanics. However, there is considerable diversity within the non-Hispanic black community, and groups such as Africans and Afro-Caribbeans are quite distinctive in their socioeconomic composition and neighborhood patterns. Haitians and some African-born blacks are not native English speakers. And in fact the typical level of segregation between African Americans and Afro-Caribbeans is greater than that between non-Hispanic blacks and black Hispanics.
Black Hispanics potentially provide a bridge between the black and Hispanic communities. On the basis of social similarity, if it is necessary to combine them with another group, there are now better reasons to classify black Hispanics as black than as Hispanic.
Legally there is no obstacle to treating black Hispanics as both black and Hispanic. Federal policy is enunciated in a statement by the Department of Justice’s Civil Right Division, 1/11/2001:
As in the past, the Department will analyze Hispanic voters as a separate group for purposes of enforcement of the Voting Rights Act. If there are significant numbers of responses which report Hispanics and one or more minority races (for example, Hispanics who list their race as Black/African-American), those responses will be allocated alternatively to the Hispanic category and the minority race category. (http://www.usdoj.gov/crt/voting/sec_5/fedregvoting.pdf )
This means that black Hispanics may be counted as both Hispanics and as blacks. More specifically, when evaluating complaints about civil rights violations, federal agencies are instructed to categorize data in the way that is most meaningful for that complaint (e.g., if the complaint is about Hispanic political representation, black Hispanics would be counted as Hispanics). This study shows that the question needs to be taken seriously. Routinely treating all Hispanics as a single separate group may seriously misrepresent the social reality in a given place.
10

Because of their numbers – now more than 16 million, and growing more rapidly than other Hispanic groups – it is even more important to be aware of the distinctiveness of Hispanics who identify neither as black nor as white. These are the newest Hispanics, in terms of the share who are foreign-born or speak Spanish in their homes. Hispanic Hispanics are intermediate between white and black Hispanics on several of the measures studied here. They are unlikely to be “black” in the sense of having a non-Hispanic black parent. But they are clearly less advantaged in many respects than are Hispanics who identify themselves as white.
Federal policy does not require that this Hispanic group be separately identified. Indeed, for some purposes its members are routinely reclassified into another racial category. For example, the Census Bureau’s post-census population estimates “impute” a race such as black, white, or Asian to people who identify as “some other race.” This practice is justified by the fact that other vital statistics on which estimates are based do not distinguish “Hispanic Hispanics.” It does conform to the Office of Management and Budget’s minimum requirements for race reporting (White; Black; American Indian and Alaska Native; Asian; and Native Hawaiian and Other Pacific Islander). But the distinctiveness and explosive growth of this segment of the Hispanic community in the United States make it important to understand what it represents.
Possibly white Hispanics reflect an assimilationist tendency within the Hispanic community, a tendency for those who are somewhat more advantaged and who live in metropolitan areas with smaller Hispanic populations to become more integrated with the white majority. To some extent they are also rooted in intermarriage between Hispanics and non-Hispanic whites. Still, their socioeconomic standing is considerably lower than that of non-Hispanic whites, they are moderately to highly segregated from non-Hispanic whites, and they live in less advantaged neighborhoods. The rise of Hispanic Hispanics may represent a different social tendency that is consistent with the continuing gaps between Hispanics of any race and non-Hispanic white majority. Though Hispanics are undoubtedly aware of the black-white color line in American society, this report offers evidence that they increasingly reject these racial categories and assert a distinct Hispanic ethnic identity. It makes sense that such a development would draw more heavily on immigrants and find more resonance in parts of the country where there is a more substantial Hispanic presence. The recent rapid growth of a Hispanic population that is not fully integrated into the mainstream economy offers conditions that support such a cultural turn and suggests that it will deepen in coming years.
11
12
Appendix. Racial composition of the Hispanic population, 2000
(metros with more than 250,000 Hispanic residents)
Hispanic White Hispanic Black population Hispanics Hispanics Hispanics Los Angeles-Long Beach, CA 4,242,213 44.7% 54.3% 1.1% New York, NY 2,339,836 41.8% 49.0% 9.2% Chicago, IL 1,416,584 49.3% 48.9% 1.8% Miami, FL 1,291,737 86.2% 10.9% 2.9% Houston, TX 1,248,586 53.8% 45.1% 1.2% Riverside-San Bernardino, CA 1,228,962 44.9% 53.9% 1.3% Orange County, CA 875,579 49.4% 49.7% 0.9% Phoenix-Mesa, AZ 817,012 49.4% 49.4% 1.2% San Antonio, TX 816,037 63.9% 35.3% 0.9% Dallas, TX 810,499 50.9% 48.0% 1.1% San Diego, CA 750,965 49.2% 49.3% 1.5% El Paso, TX 531,654 74.5% 24.9% 0.6% McAllen-Edinburg-Mission, TX 503,100 77.1% 22.6% 0.2% Oakland, CA 441,686 50.3% 47.3% 2.4% Washington, DC-MD-VA-WV 432,003 50.6% 44.6% 4.8% Fresno, CA 406,151 39.6% 59.4% 1.0% San Jose, CA 403,401 47.2% 51.6% 1.2% Denver, CO 397,236 53.8% 44.5% 1.6% Austin-San Marcos, TX 327,760 48.9% 49.8% 1.3% Las Vegas, NV-AZ 322,038 57.2% 41.1% 1.7% Fort Worth-Arlington, TX 309,851 51.6% 47.1% 1.2% Albuquerque, NM 296,373 57.4% 41.5% 1.1% San Francisco, CA 291,563 51.8% 46.5% 1.7% Brownsville-Harlingen-San Benito, TX 282,736 79.0% 20.7% 0.3% Nassau-Suffolk, NY 282,693 58.3% 37.0% 4.7% Fort Lauderdale, FL 271,652 76.7% 19.5% 3.8% Orlando, FL 271,627 62.8% 32.8% 4.4% Newark, NJ 270,557 56.5% 38.0% 5.5% Atlanta, GA 268,851 52.1% 43.0% 4.9% Philadelphia, PA-NJ 258,606 42.4% 48.5% 9.2% Bakersfield, CA 254,036 37.6% 61.2% 1.2% Ventura, CA 251,734 45.2% 54.0% 0.8%