how prevalent were racially restrictive covenants in 20th ......during the early 20th century,...
TRANSCRIPT

Discussion PaperHow Prevalent Were Racially Restrictive Covenants in 20th Century Philadelphia? A New Spatial Data Set Provides Answers
Larry SantucciFederal Reserve Bank of Philadelphia Consumer Finance Institute
DP 19-05November 2019https://doi.org/10.21799/frbp.dp.2019.05

1
How Prevalent Were Racially Restrictive Covenants in 20th Century Philadelphia? A New Spatial Data Set Provides Answers
Larry Santucci*
Federal Reserve Bank of Philadelphia
November 2019
Abstract
One of the tools used by early 20th century developers, builders, and white homeowners to prevent African Americans from accessing parts of the residential real estate market was the racially restrictive covenant. In this paper, we present a newly constructed spatial data set of properties in the city of Philadelphia with deeds that contained a racially restrictive covenant at any time from 1920 to 1932. To date, we have reviewed hundreds of thousands of property deeds and identified nearly 4,000 instances in which a racial covenant had been included in the deed. The covenanted properties formed an invisible barrier to less densely populated areas sought after by white residents and around predominantly white neighborhoods throughout the city. We present the data in a series of geospatial maps and discuss plans for future enhancements to the data set.
Keywords: racially restrictive covenants, exclusionary zoning, segregation, race, property, Philadelphia
JEL Classification Numbers: J15, K11, K25, R12
* Federal Reserve Bank of Philadelphia, Ten Independence Mall, Philadelphia, PA 19106-1574; email: [email protected]. The author thanks Erik Ebinger and Caleb Hoover for their research assistance, and Julia Cheney, Kyle DeMaria, J.M. Duffin, Amy Hillier, Bob Hunt, Jeffrey Lin, and James Wolfinger for their feedback and suggestions. Special thanks to James Leonard and Irene Macchia at the City of Philadelphia Department of Records for facilitating this research. Disclaimer: This Philadelphia Fed Discussion Paper represents preliminary research that is being circulated for discussion purposes. The views expressed in these papers are solely those of the author and do not necessarily reflect the views of the Federal Reserve Bank of Philadelphia or the Federal Reserve System. Nothing in the text should be construed as an endorsement of any organization or its products or services. No statements here should be treated as legal advice. Any errors or omissions are the responsibility of the author. Philadelphia Fed discussion papers are free to download at: https://philadelphiafed.org/consumer-finance-institute/publications.

2
I. Introduction
One of the tools used by early 20th century developers, builders, and white homeowners to
prevent African Americans from accessing parts of the residential real estate market was the
racially restrictive covenant (racial covenant). Racial covenants were obligations inserted into
property deeds that typically forbade the premises from being occupied or owned by persons not
of Caucasian descent.1 The covenants were most often written into the deeds by private
developers but enforced through the courts. Evidence of racial covenants is present in cities
throughout the country, including Baltimore; Boston; Charlotte, NC; Hartford, CT; Kansas City,
MO; Los Angeles; St. Louis, MO; and Sacramento. Researchers have compiled databases and
interactive maps of properties with racial covenants in Chicago; Minneapolis, MN; Portland, OR;
Richmond, VA; Seattle, and Washington, D.C. There is some evidence that property developers
in Philadelphia also used racial covenants to prevent African Americans and other minority
ethnic groups from owning, renting, or residing in homes constructed in more desirable parts of
the city (Gottlieb, 2015). References to “restricted sections” of the city in real estate
advertisements from as early as 1911 demonstrate that builders were not only imposing
restrictions on new homes, but the restrictions were a primary selling point (see Figure 1). And
careful searches through handwritten deeds of the time reveal the presence of covenants, stating
that land shall not be occupied by persons “other than those of the Caucasian Race” (see Figure
2).
While much work has been done to document the existence of racial covenants, relatively
little is known about their effects. This is beginning to change. Recent work by Sood, Speagle,
and Ehrman-Solberg (2019) presents evidence that racial covenants placed on properties during
the 1940s had significant and persistent effects on home prices (measured as of 2007) and
African American spatial concentrations and homeownership rates in the Minneapolis area
(measured as of 2010). Their results add to a growing body of economic research that includes
Aaronson, Hartley, and Mazumder (2017), who find long-lasting effects of redlining during the
1930s, and Aliprantis, Carroll, and Young (2018), who find that, conditional on income and
1 Although the terms have been used interchangeably for many years, white and Caucasian share no etymological resemblance; white refers to skin tone, while Caucasian describes a taxon of people indigenous to Europe, Asia, and certain parts of Africa.
3
wealth, household racial composition predicts large differences in neighborhood racial
composition. Their result is consistent with the hypothesis that a legacy of racial segregation
created persistent differences in neighborhood outcomes.
It is against this backdrop that we undertook an effort to discover the full extent to which
racial covenants had been used to restrict homeownership in Philadelphia, the largest city in the
Third Federal Reserve District and one of the most residentially segregated cities in the country.2
With the help of the City of Philadelphia Department of Records (DOR), we began to develop a
spatial database of racial covenants in Philadelphia property deeds. To date, we have reviewed
hundreds of thousands of property deeds written from 1920 to 1932 and identified nearly 4,000
instances in which a racial covenant was included in a property deed.
We are able to make a number of interesting observations with our data. First, visual
pattern analysis suggests that properties with racial covenants were not randomly distributed
throughout the city. Instead, the dispersion pattern suggests the covenants were put in place to
restrict the movement of African Americans into new developments and predominantly white
neighborhoods.3
Second, analyzing the location of covenanted properties in relation to smaller
geographical units sheds more light on the patterns of neighborhood segregation and racial
covenants than does analysis at higher levels of aggregation. While this may seem intuitive,
researchers have only recently been able to examine residential segregation prior to 1950 at civil
divisions smaller than the city ward. Studies conducted at the enumeration district (ED) level, as
noted in Logan et al. (2015), have generated results that cast doubt on longstanding beliefs about
the patterns and timing of residential segregation.4 For reasons we discuss in Section III, we
initially report the locations of covenanted properties at the ward level and conduct a ward-level
2 Massey and Denton (1988) define residential segregation as, “the degree to which two or more groups live separately from one another, in different parts of the urban environment.” In 2000, the Philadelphia metropolitan area ranked 18th out of 318 in terms of black/white segregation, ahead of cities such as Kansas City (37), Pittsburgh (38), Baltimore (44), and Atlanta (67). Source: http://www.censusscope.org/us/rank_dissimilarity_white_black.html. 3 The spatial pattern of racial covenants may also reflect the preferences of particular developers and the properties they chose to purchase and develop during that period. 4 The 1950 Decennial Census was the first to capture information at the tract level. Logan et al. (2015), revisiting work by Cutler, Glaeser, and Vigdor (1999), show that segregation was much higher in the early 20th century than previously reported, when measured at the enumeration district level. Massey and Denton (1993) also underestimate the extent of residential segregation by race.

4
analysis with census data from 1920. However, with some additional work, we were able to
identify approximate latitude and longitude coordinates for many of the covenanted properties
and map them against demographic data at the ED level.5 Analysis at the ED level paints a much
richer picture of the dynamics at play between property developers and owners, as well as the
perceived threat posed by neighboring African American communities.
Third, there is a weak relationship between the location of covenanted properties and the
neighborhood grades subsequently assessed by the federal government’s Home Owners’ Loan
Corporation (HOLC) in 1937. Racial covenants can be found in areas of every grade, from A to
D, with more than 80 percent located in midgrade areas (see Figure 4). This suggests that the
racial composition of an area may have been an important factor in determining whether an area
would receive a B or a C grade. Racial covenants were probably not needed to discourage most
African Americans from relocating into grade A areas; the barrier of home prices was sufficient
(Kaul, 2019). Thus, only 4 percent of covenants were found in grade A areas. In addition, the
presence of covenants in the lowest graded areas could have resulted from developers, including
boilerplate racial covenants into all of their property deeds.
The paper proceeds as follows. In the next section, we discuss the origins of racial
covenants. In Section III, we explain the process of creating the spatial database. We present
some geographic information system (GIS) images and the results of preliminary analyses in
Section IV and conclude with thoughts for future research in Section V.
II. Racial Zoning and Racial Covenants
In the early 20th century, a confluence of factors instigated a large and extended migration of
African Americans from southern states to northern cities, a movement commonly referred to as
“the first Great Migration.” From 1915 until 1940, hundreds of thousands of poor, rural African
Americans left the southeastern United States for the northern cities of Baltimore, Chicago,
Detroit, New York City, and others. Where the 1910 Census indicated that 90 percent of African
Americans resided in the South, the rate had fallen by 13 percentage points by 1940 (Gibson and
Jung, 2002).
5 Enumeration districts are smaller than census tracts and typically contain fewer than 2,000 residents.
5
The influx of African Americans into northern cities had the effect of magnifying
existing racial disparities and residential segregation patterns. Logan et al. (2015) find evidence
of residential segregation in northern cities as early as 1880, a time when few African Americans
lived in the northern states.6 Those who resided in the north tended to work as servants and
housekeepers for wealthy white families and often resided near their place of employment.
However, while white families lived along main streets, African American residences were often
clustered along side streets and back alleys.
During the early 20th century, African American neighborhoods grew larger and more
homogeneous. The question of how these early segregation patterns evolved is a topic of debate
among researchers. It was certainly the result of both sorting (residents choosing to collocate in
neighborhoods predominantly populated by people of similar race or ethnicity) and steering
(individuals of a certain race or ethnicity made to reside in less-desirable areas than they would
have otherwise chosen). While the distinction between sorting and steering is not always clear
(the expectation of discrimination may induce sorting via a preference for avoiding conflict),
African American migrants, having ventured northward at the urging of northern friends and
family members, were likely to live in or near existing African American communities.7 And as
African American communities grew, nearby white residents may have chosen to move toward
the outer limits of cities and neighboring suburbs, foreshadowing the white flight of the 1950s
and 1960s.8
Urban whites used a variety of tactics to prevent African American migrants from settling
in predominantly white neighborhoods. Early methods of deterrence were both physical and
economic. Violence against African Americans was common in low-income neighborhoods,
while home prices and the imposition of various fees and dues created an economic barrier in
upper-income neighborhoods. In many ways, steering practices became institutionalized. For
example, for more than 30 years, real estate brokers followed a code that urged them to maintain
neighborhood racial composition. Until 1956, the National Association of Real Estate Boards’
6 Their study includes data for 10 cities: Boston, Brooklyn (a separate city in 1880), Cincinnati, Chicago, Cleveland, Detroit, New York, Philadelphia, Pittsburgh, and St. Louis. 7 This process is often referred to as chain migration; see Boustan (2017). 8 Shertzer and Walsh (2016) examine white flight in the prewar era, and Boustan (2010) does so in the postwar era.

6
code of ethics instructed member agents to never be instrumental in introducing into a
neighborhood “members of any race or nationality, or any individuals whose presence will
clearly be detrimental to property values in that neighborhood” (National Association of Real
Estate Boards, 1928).
Over time, the tactics of residential discrimination also relied more heavily on local
government and law enforcement (Rose, 2013). In an early use of the legal system to exclude
African Americans from white neighborhoods, white plaintiffs argued that the mere presence of
African Americans in a neighborhood constituted a nuisance because it could reduce the value of
their home (Rose, 2013). More often, plaintiffs bundled a racially motivated case with
complaints of noise or congestion. In the end, the courts tended to side with the opinion that a
person’s race — “a natural condition not in any way traceable to human activity” — could not
constitute a nuisance (Freund, 1904).
While the tactic of using a nuisance law to execute residential segregation was mostly
unsuccessful, the concept of using the legal system as a means of restricting the free movement
of African Americans took hold. The next facet of governance to be appropriated in the pushback
against integration was the zoning ordinance.
A. Zoning Ordinances
By the early 20th century, zoning began replacing urban planning as the primary means of
regulating land use. Zoning ordinances dictated what activities property owners could engage in,
what structures they could erect, and where on the property the structures could be erected.
Brought to the United States from Germany in the 1890s, zoning ordinances were an efficient
means of improving the harmony of urban spaces by separating factories and businesses from
residences (Hirt, 2014). But by 1910, zoning ordinances were being used to exclude African
Americans from purchasing homes in majority white neighborhoods. In response to middle-class
African American families moving out of crowded, predominantly same-race neighborhoods into
more affluent, less-crowded white neighborhoods, the city of Baltimore passed the nation’s first
racial zoning ordinance in 1910 (Brooks and Rose, 2013). The ordinance prohibited African
Americans from buying homes on majority white blocks and vice versa (New York Times, 1910).
The use of zoning ordinance to segregate neighborhoods garnered widespread use in the early
7
20th century, with southern cities including Atlanta,
Birmingham, Miami, Charleston, Dallas, Louisville, New
Orleans, Richmond, and St. Louis following Baltimore’s lead.
In the 1917 case of Buchanan v. Warley, the Supreme
Court ruled that municipally mandated racial zoning was
unconstitutional. The court opinion notes that the 14th
Amendment prevents state interference with property rights,
except by due process of law, and that the amendment
protects all U.S. citizens, regardless of color or race.9 Despite
the ruling, cities including Atlanta, Austin, Birmingham,
Richmond, and West Palm Beach continued to adopt and
enforce racial zoning ordinances. Such ordinances were again
held unconstitutional in 1927; yet, the ordinances were
enforced in some cities well into the 1980s.10
With racial zoning now illegal, property developers
turned to restrictive covenants in property deeds (see sidebar
on page 7) as the primary means of establishing residential
segregation.
B. Racially Restrictive Covenants
In the same way deed restrictions were used to insulate new
residential subdivisions from the potential harm of industrial use, it became popular to use
restrictions to insulate predominantly white subdivisions from African American buyers. Clauses
typically put into deeds by land developers, racial covenants restricted the sale of new properties
to whites only and prevented future generations of homeowners from selling or renting the
property to African Americans.
The first restrictive covenant to restrict the sale of a property on the basis of race or
ethnicity appeared in Brookline, MA, in 1843, where deeds from the Linden Place subdivision
9 See Buchanan v. Warley, 245 U.S. 60 (1917). 10 See Harmon v. Tyler, 273 U.S. 668 (1927).
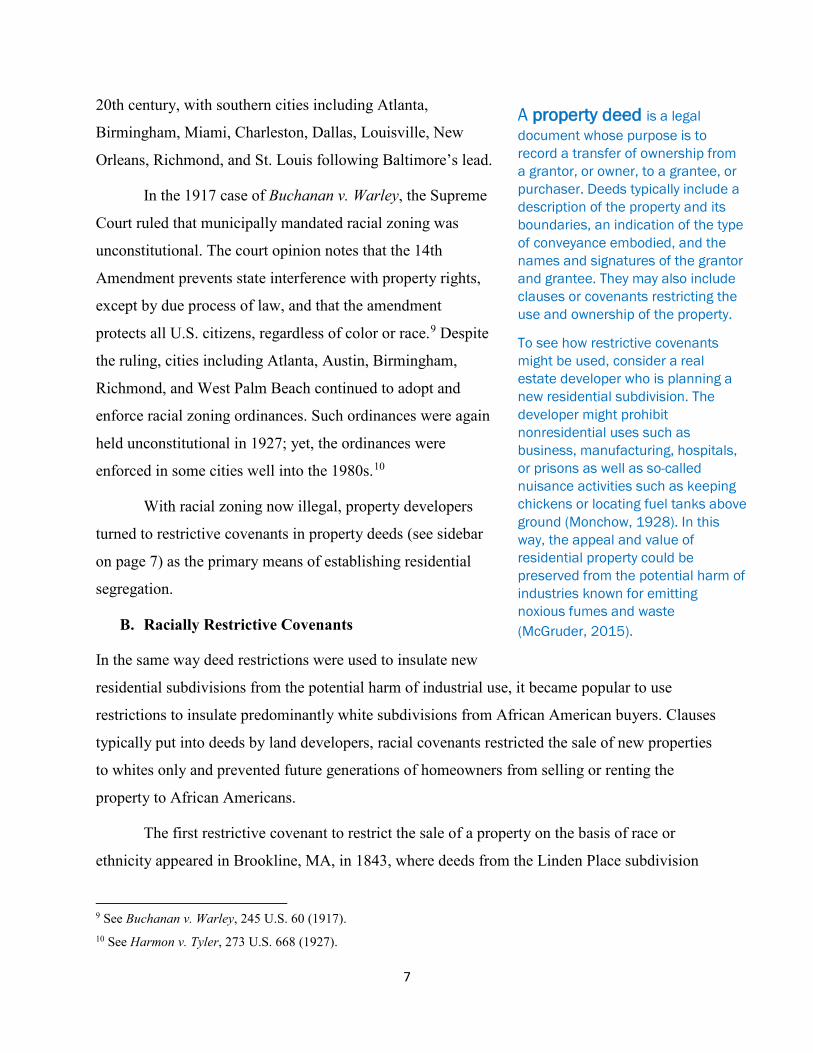
A property deed is a legal document whose purpose is to record a transfer of ownership from a grantor, or owner, to a grantee, or purchaser. Deeds typically include a description of the property and its boundaries, an indication of the type of conveyance embodied, and the names and signatures of the grantor and grantee. They may also include clauses or covenants restricting the use and ownership of the property.
To see how restrictive covenants might be used, consider a real estate developer who is planning a new residential subdivision. The developer might prohibit nonresidential uses such as business, manufacturing, hospitals, or prisons as well as so-called nuisance activities such as keeping chickens or locating fuel tanks above ground (Monchow, 1928). In this way, the appeal and value of residential property could be preserved from the potential harm of industries known for emitting noxious fumes and waste (McGruder, 2015).
8
included a clause stating that the residences could not be sold to “any Negro or native of Ireland”
(McGruder, 2015). The pace of deed restrictions accelerated rapidly through the 1910s and
1920s. A 1926 Supreme Court decision may have accelerated the spread of racial covenants
throughout the country. In the matter of Corrigan v. Buckley, the Supreme Court found that,
while states could not engage in racial zoning, nothing prohibited private individuals from
agreeing not to sell their homes to people of designated races, ethnicities, or nationalities (Brooks
and Rose, 2013).
One study found that, from 1910 to 1920, the number of properties with racial covenants
in Minneapolis, MN, increased by almost 500 percent, from 1,436 in 1910 to 8,534 in 1920.11 By
1950, there were approximately 17,500 racial covenants on Minneapolis properties. Racially
restrictive covenants remained enforceable in state courts until 1948, when the U.S. Supreme
Court ruled that, while not illegal in and of themselves, racial covenants could not be enforced
through the state court system.12
Racial covenants (and the less familiar but closely related racially restrictive condition)
tended to fall into one of three categories (Monchow, 1928; and Scanlan, 1949). The first
category includes covenants that restricted ownership, more specifically the sale, lease,
conveyance to, or ownership by any member of a certain racial or ethnic group. The second
category includes covenants that prohibited use or occupancy by any member of such a group,
and the third prohibited both ownership and occupancy. Once a deed restriction was in place, it
might remain with the property for decades. This was often achieved by way of one or more
workarounds to the rule against perpetuities (RAP), a common law doctrine that was intended to
prohibit property restrictions from remaining in place for more than one generation (about 21
years; Brooks and Rose, 2013). Thus, many deed restrictions were written with an explicit
duration of 20 or 21 years, particularly around the turn of the 20th century.13 Real estate
developers could also circumvent the RAP doctrine by structuring their purchase agreements to
retain a reversionary interest in the property. A reversionary interest could be established by
11 See https://www.mappingprejudice.org/index.html. 12 See Shelley v. Kraemer, 334 U.S. 1 (1948). 13 In our data, covenants with an explicit (and finite) duration tended to be for 10, 25, and 30 years. More often, the covenant was said to extend “hereafter forever.”

9
stating that, if one of the covenants is violated, the property would revert back to the developer.
Thus, maintaining a residual ownership interest in the property was another way to circumvent
the RAP doctrine and extend deed restrictions for many decades (Brooks and Rose, 2013).
A 1928 survey of 84 deeds found that deed restrictions typically contained a stated
duration as well as a set of conditions under which the restrictions could be extended (Monchow,
1928). Some restrictions were designated to renew automatically at the frequency of the original
term, unless certain conditions were met. For example, some deeds specified that either a
majority or supermajority (e.g., two-thirds) of owners in the development had to agree in writing
to terminate the automatic extension. Automatic renewals and high thresholds for termination
may help to explain why racial covenants remain on deeds throughout the country, having
followed properties through many generations of ownership (WOSU Public Media, 2017).
The use of racial covenants was promoted by trade groups, including the National
Association of Real Estate Brokers (NAREB), the national trade group for white real estate
brokers (Jones-Correa, 2000). In 1924, NAREB adopted an amendment to its member code of
ethics that required brokers to practice racial steering or risk expulsion. A model real estate
licensing act, adopted by 32 states, authorized state real estate commissions to revoke licenses of
agents who violated the NAREB code of ethics (Plotkin, 2001). In 1927, in conjunction with the
U.S. Department of Commerce, NAREB drafted a model racial covenant (see sidebar on page
10).14 Restrictions based on the NAREB model were inserted into deeds across the country.
NAREB also encouraged local real estate boards to partner with homeowner associations to
spread the model covenant (Roithmayr, 2014).
14 See http://wbhsi.net/~wendyplotkin/DeedsWeb/philpott.html for additional information.

10
At their core, racial covenants served the purpose of maintaining separate residential
areas for persons of different ethnic groups. In suburban areas where residential real estate
development was just beginning and in urban areas where aging housing stocks were being
replaced with new homes and subdivisions, racial covenants were a means of introducing social
norms into places where none existed
previously, or of codifying social norms already
in place. Since they were embedded in deeds,
racial covenants were contractual, and since they
were entered into by private businesses and
citizens, they were not explicitly actions of the
state and thus not public policy. However, the
responsibility for enforcing racial covenants
ultimately fell upon the judicial system, a public
institution. It was on this basis that, in 1948,
racial covenants were challenged in court and
deemed unenforceable. In Shelley v. Kraemer,
the U.S. Supreme Court ruled that any court that
enforced a racial covenant violated the equal
protection clause of the 14th Amendment, which
prohibits states from denying a person within its
jurisdiction the equal protection of the law.15
The court’s decision meant that enforcing a
racial covenant through the court system was
akin to the state taking action against citizens,
violating their 14th Amendment rights (Brooks and Rose, 2013). Still, the court ruling did not
prevent racial covenants from being written into deeds. It was not until 1968 when Title VIII of
the Civil Rights Act made racial covenants illegal.16
15 See https://constitutioncenter.org/interactive-constitution/amendments/amendment-xiv/the-equal-protection-clause/clause/20 for more information. 16 See Pub L. No. 90–284, 82 Stat. 73 (1968). Title VIII of the Civil Rights Act is known as the Fair Housing Act.
Model Racial Covenant (NAREB, 1927) 1. No part of said premises shall in any manner be used or occupied directly or indirectly by any negro or negroes, provided that this restriction shall not prevent the occupation, during the period of their employment, of janitors' or chauffeurs' quarters in the basement or in a barn or garage in the rear, or of servants' quarters by negro janitors, chauffeurs or house servants, respectively, actually employed as such for service in and about the premises by the rightful owner or occupant of said premises. 2. No part of said premises shall be sold, given, conveyed or leased to any negro or negroes, and no permission or license to use or occupy any part thereof shall be given to any negro except house servants or janitors or chauffeurs employed thereon as aforesaid.
11
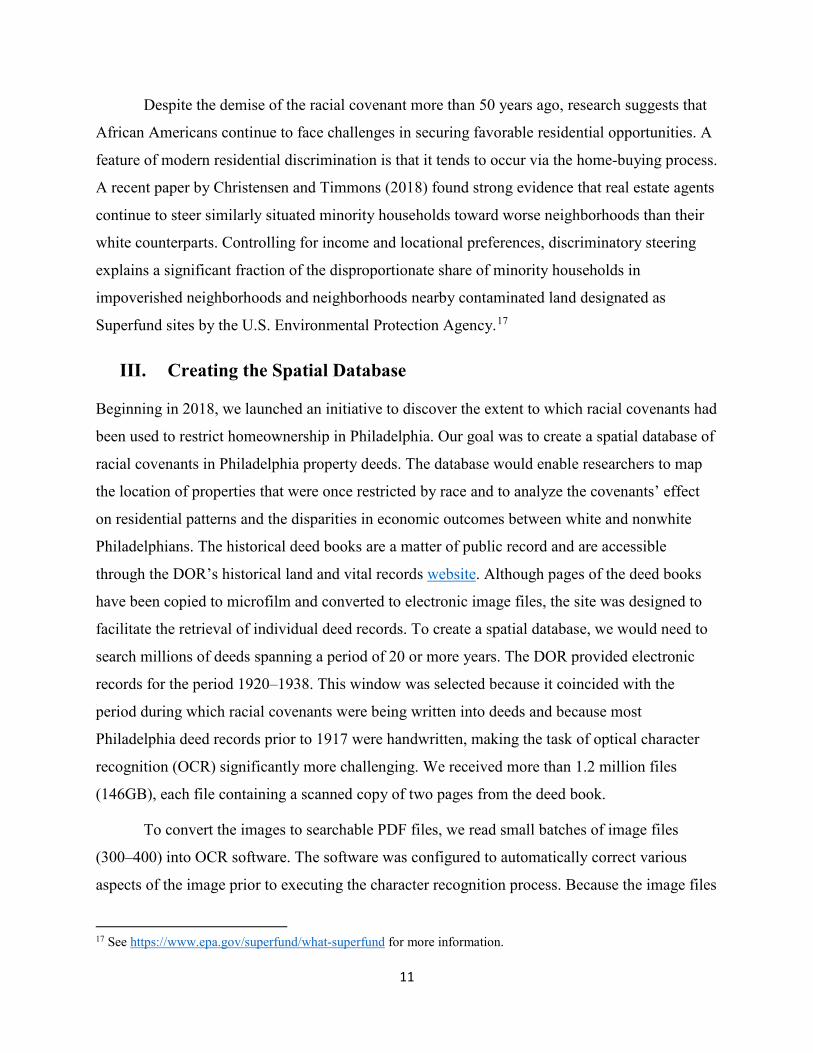
Despite the demise of the racial covenant more than 50 years ago, research suggests that
African Americans continue to face challenges in securing favorable residential opportunities. A
feature of modern residential discrimination is that it tends to occur via the home-buying process.
A recent paper by Christensen and Timmons (2018) found strong evidence that real estate agents
continue to steer similarly situated minority households toward worse neighborhoods than their
white counterparts. Controlling for income and locational preferences, discriminatory steering
explains a significant fraction of the disproportionate share of minority households in
impoverished neighborhoods and neighborhoods nearby contaminated land designated as
Superfund sites by the U.S. Environmental Protection Agency.17
III. Creating the Spatial Database
Beginning in 2018, we launched an initiative to discover the extent to which racial covenants had
been used to restrict homeownership in Philadelphia. Our goal was to create a spatial database of
racial covenants in Philadelphia property deeds. The database would enable researchers to map
the location of properties that were once restricted by race and to analyze the covenants’ effect
on residential patterns and the disparities in economic outcomes between white and nonwhite
Philadelphians. The historical deed books are a matter of public record and are accessible
through the DOR’s historical land and vital records website. Although pages of the deed books
have been copied to microfilm and converted to electronic image files, the site was designed to
facilitate the retrieval of individual deed records. To create a spatial database, we would need to
search millions of deeds spanning a period of 20 or more years. The DOR provided electronic
records for the period 1920–1938. This window was selected because it coincided with the
period during which racial covenants were being written into deeds and because most
Philadelphia deed records prior to 1917 were handwritten, making the task of optical character
recognition (OCR) significantly more challenging. We received more than 1.2 million files
(146GB), each file containing a scanned copy of two pages from the deed book.
To convert the images to searchable PDF files, we read small batches of image files
(300–400) into OCR software. The software was configured to automatically correct various
aspects of the image prior to executing the character recognition process. Because the image files
17 See https://www.epa.gov/superfund/what-superfund for more information.

12
varied widely in fidelity, some text was well reproduced from the images, while images that
were blurred, too dark, or too light tended to generate long string of nonsense characters.
Once a batch of deeds had been converted from images to searchable text, we began the
process of identifying deeds containing racial covenants. To do so, we searched for keywords
such as: Caucasian, Negro, white, black, descent, and occupied. One way we attempted to
overcome the image fidelity and clarity challenges was to search for keyword fragments. For
example, we searched for the word Caucasian as well as cau, cauc, asian, and ian. This
approach yielded many more hits than searching by keyword alone.
As of the writing of this paper, our search has yielded more than 3,800 distinct properties
with racial covenants, spanning the period 1920–1932.18 Properties that appeared more than one
time in the deeds data set were entered into the spatial database as different records, but only
enter the final tally once. In most instances, this occurred when a property changed hands. For
example, the property at 1031 Flanders Road in the 34th Ward was sold by Edward Hoopes in
April 1928, and by Albert Simon in February 1930. In some instances, we observed a property
transferring hands twice in one day, as on April 15, 1920, when the property at 3833 Walnut
Street was bought and sold both by George E. Outhette and William Alexander Brown.
Since the deed records are not marked with a chronological identification number, we
were unable to compute the exact number of deed records searched. We estimate that a total of
600,000 to 1.2 million deed records were searched, since most of the 1.2 million image files
contained a left- and right-hand page, and a single deed record tended to be between two and
four pages in length.
Upon locating a keyword or keyword fragment, we noted the location of the deed in the
electronic records, as well as the following information:
• Date of deed
• Race-related search term identified in the text
• First seller listed
• Location of plot(s)
• Ward number
18 We found 15 racial covenants in deeds that were dated 1919.

13
With additional resources, we would have recorded several additional pieces of
information for each deed containing a racial covenant, including the exact text of the covenant,
the stated covenant duration, and the first listed buyer. This — and other areas for future work —
will be discussed in the final section.
A. Two Important Caveats
In a world where searching is as easy as typing a word into a search bar, it is worth noting that
the process of converting pictures of documents into machine readable text is not as precise. In
this section, we discuss two important caveats for readers. The first is that our findings should be
interpreted as a lower bound on the true number of racial covenants added to properties from
1920 until 1932. We can say with certainty that there are zero instances in which our algorithm
identified a covenant where one did not exist (i.e., Type I error). However, we are less certain
that our algorithm found all covenanted properties (i.e., Type II error). The second caveat directs
attention to the additional work needed to enhance the precision of our coordinate estimates.
1. A Lower Bound
First, our tally likely underestimates the number of racial covenants present in the data sample.
As noted previously, varying image quality affected the OCR software’s ability to translate
images into words. The typewritten deed records also varied in type spacing and horizontal
alignment. Lines of text sometimes drift down the page and letters of the same word are often not
on the same horizontal plane. All of these factors created challenges in converting the images to
searchable documents. We attempted to mitigate the effects of these and other challenges by
searching for word fragments, but it is unlikely our process identified all racial covenants. In
addition, deeds are not required to be immediately recorded in the county deed books. Thus,
although we reviewed files from the deed books corresponding to the period 1920–1932, our
sample contained some deeds written before 1920 and probably excluded some that were not
recorded until after 1932. Last, some deed writers might have used uncommon or obscure words
to refer to African Americans or persons of another religion or ethnicity. For example, other
analyses of racial covenants have found African Americans broadly referred to as Ethiopians, a
word that was initially on our search list but was dropped for the sake of efficiency when it did
not appear to be yielding hits.

14
2. Imprecise Coordinate Estimates
Second, we were unable to ascertain the exact location of most properties on the basis of
information provided in the deed itself. Plots of land in the city of Philadelphia have historically
been identified by a metes-and-bounds description — a surveying methodology that identifies a
piece of land by placing it in relation to nearby landmarks — rather than by parcel number or
other unique identifier. Philadelphia County was very much under development during the first
half of the 20th century; thus, many of the deeds in our sample convey plots of land to
developers who would then go on to subdivide the property and build streets and homes. After
1927, we observed more deeds being associated with a particular address (or addresses). Thus,
the need to match metes-and-bounds descriptions to addresses may diminish as we progress
further into the deeds data.19
When a street address was available, we used a geocoding application programming
interface (API) to generate latitude and longitude coordinates. Likewise, for a small number of
deeds, we were able to easily determine the street address based on the metes-and-bounds
description and could then retrieve its coordinates from the API.
When a street address was unavailable, we approximated the property location to either
the nearest street intersection or the intersection that marked the beginning of the metes-and-
bounds description. In the first case, we leveraged the order imposed by central Philadelphia’s
gridiron-style layout; in instances where a north-to-south running numbered street intersected an
east-to-west running named street (e.g., 18th Street and Walnut Street), the property was
assigned the coordinates of the first even-numbered property on the block (e.g., 1800 Walnut
Street). In the second case, if a metes-and-bounds description began at the corner or intersection
of two streets, we approximated the property location with the set of coordinates corresponding
to the center of the intersection.
19 Today, each property in Philadelphia has a unique, nine-digit parcel number, initially created by the Board of Revision of Taxes. Since 2010, the process has been administered by the Office of Property Assessment; however, current Philadelphia County document recording requirements state that properties must only be identified by the metes-and-bounds description and street address.

15
IV. Preliminary Observations
A. Ward-Level Analysis
As noted in Section III, most deeds from the 1920s referenced properties that did not yet have
street addresses. In other cases, an address might not have been provided. Fortunately, each deed
included a reference to the ward in which the property was situated.20 Thus, our most
geographically accurate representation of the new data is at the ward level. Column (b) of Table
1 lists the number of covenanted properties found in each of Philadelphia’s 48 wards.21 We use
data from the 1920 census to calculate the number of covenants per thousand dwellings in
column (c).
For the period 1920–1932, the largest number of covenants were found in Ward 22, an
area of northwest Philadelphia with a population that was 7.8 percent African American in 1920,
just above the overall rate of 7.4 percent. The 877 covenanted properties in Ward 22 account for
about 23 percent of the total covenants in the 1920–1932 subsample. The next largest shares of
covenanted properties were found in Wards 34 and 42, with 593 and 434 covenants, respectively.
Taken together, Wards 22, 34, and 42 contained nearly 50 percent of all covenants in the sample.
The remainder of covenanted properties were found in another 20 wards, while no properties
with covenants were found in 20 of the 48 wards. The 20 wards in which no covenants were
found mostly fall along the Delaware River on the city’s eastern shore line.
At the ward level, there is evidence that racial covenants could have reduced the inflow
of African Americans into particular wards. The percentages of ward residents identified as black
in 1920 and 1930 are found in columns (d) and (e) of Table 1. The correlation between racial
covenants per thousand dwellings and the change in the percentage of African American
residents from 1920 to 1930 is -0.258, suggesting that the relationship is directionally within
expectations. In addition, the percentage of African Americans in wards in which 0 to 10
20 The Census Bureau did not adopt the census tract as an official geographic entity until the 1940 census. See https://www.census.gov/history/www/programs/geography/tracts_and_block_numbering_areas.html. 21 The city had 48 wards from 1914 until 1932. Today it is divided into 66 wards. See https://www.philadelphiavotes.com/en/resources-a-data/political-maps.

16
covenants were located grew by 8.1 percent, compared with 2.3 percent in wards with 10 or
more covenants.22
The 22nd Ward, with 877 covenanted properties, lies in the northwestern part of the city
and includes the neighborhoods of Germantown, Mount Airy, and Chestnut Hill. These
neighborhoods were initially home to middle class and wealthy Philadelphians seeking to avoid
the congestion of Center City. As development expanded outward and more areas became
accessible by streetcar, the area became increasingly accessible to working-class citizens
traveling along the old 23 streetcar line that ran from Chestnut Hill to South Philadelphia.23
Situated between Chestnut Hill and Germantown, Mount Airy is better known for its intentional
efforts to be an integrated community throughout the 1950s and 1960s (Rolland and DeMaria,
2016; and Ferman, Singleton, and DeMarco, 1998).
Similarly, Ward 34 in West Philadelphia, containing 593 covenanted properties, began as
a getaway for upper-class Philadelphians. In the second half of the 19th century, its location on
the western banks of the Schuylkill River made it attractive to developers who built country
homes for middle-class buyers. Shortly after its incorporation in 1902, Philadelphia Rapid
Transit began construction of electric streetcar lines to West Philadelphia, earning the area the
moniker of streetcar suburb.24 By the 1920s, many of the 19th century homes were demolished
to make way for the construction of large, four- or five-story apartment houses.25
The number of covenanted properties in a ward is, in part, a function of the residential
construction occurring there. Thus, we would expect to see fewer covenants in wards that
experienced very little construction. As late as 1937, much of the far northeast, from Pennypack
Park to Bucks County, still contained vast swaths of farmland.26 Figure 3 shows that, on a per-
dwelling basis, the areas of the city with the most covenanted properties were in Wards 35 and
22 Calculations weighted by population totals from the 1920 census. 23 See http://www.phillytrolley.org/1923map/1923_prt_map_z1.html. 24 In 1998, the West Philadelphia Streetcar Suburb Historic District was placed on the National Register of Historic Places. 25 See http://www.uchs.net/HistoricDistricts/wpsshd.html. 26 Source: HOLC Residential Security Map for Philadelphia, PA, available at https://dsl.richmond.edu/panorama/redlining/#loc=12/40.038/-75.12&city=philadelphia-pa.

17
41 in the northeast and far northeast (dark red), respectively.27 While sparsely populated in 1920
— combined, these two wards had a density of 866 persons per square mile, much lower than the
overall county density of 14,000. By 1930, the populations of the two wards had grown by 314
percent and 95 percent, respectively. Thus, if much of the new residential construction that
occurred in the greater northeastern part of the city during the 1920s was covered by racial
covenants, we would indeed expect to see a high concentration of covenants per thousand
dwellings, as Figure 3 suggests.
B. HOLC Map Analysis
Next, we replace the ward-level map with HOLC’s 1937 residential security map of
Philadelphia. HOLC was established by Congress in 1933, with a mandate to refinance
residential mortgages in default.28 Beginning in 1935, HOLC staff created maps of cities
throughout the country as a reference to assist in the collection and disposition of the mortgage
debt it had purchased from lenders. Areas shaded in green (grade A) were expected to be racially
homogeneous and have space for new construction (Aaronson, Hartley, and Mazumder, 2017).
Those shaded in blue (grade B) were similar to green but no longer had space for new residential
construction. Areas shaded in yellow (grade C) were declining and might be racially or
ethnically mixed or have the potential to become mixed. Red areas (grade D) were undesirable
and often had high concentrations of Jewish or African American residents.
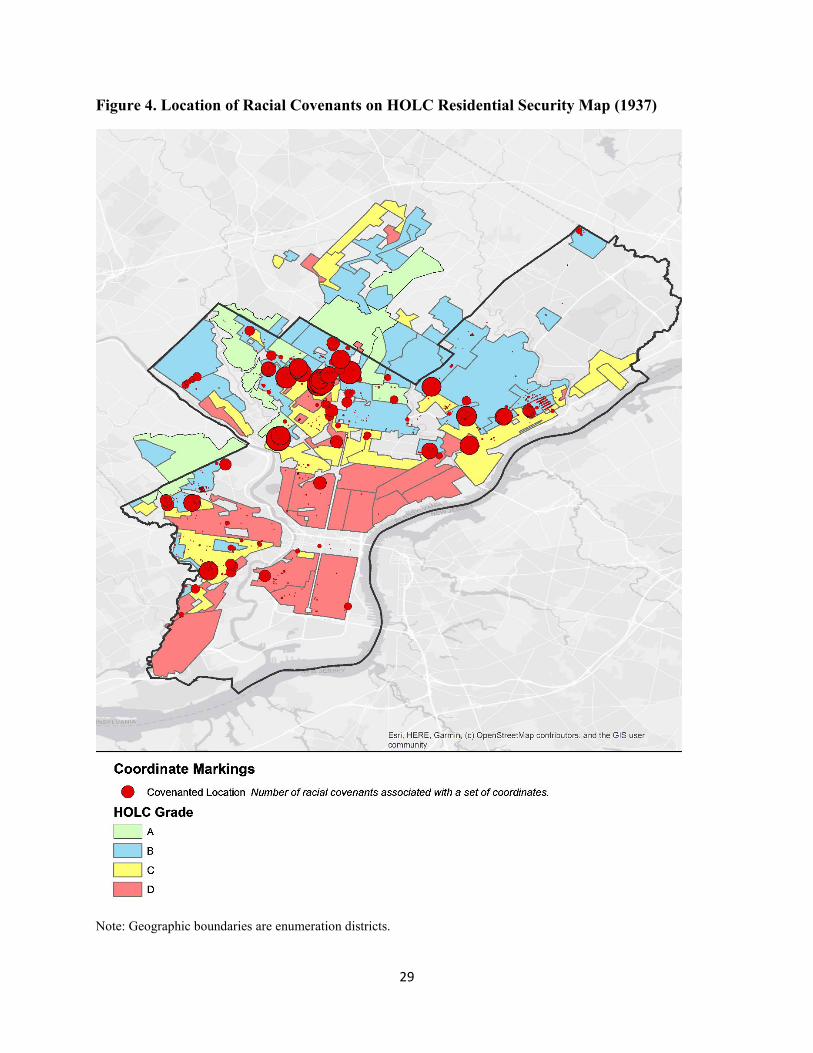
Figure 4 shows where covenanted properties fell on the HOLC map, bearing in mind that
the covenants were written several years prior to the HOLC map and were certainly considered
by HOLC staff when grading an area. The latitude and longitude coordinates associated with
each of the covenanted properties is superimposed. As noted in Section IV, we do not currently
have exact coordinates for many of the covenanted properties. For those properties, we chose to
append the coordinates of the nearest intersection. Thus, the size of each red dot signifies the
number of covenanted properties that have been mapped to that particular location, with larger
red dots signifying more properties.
27 In 1920, the Bureau of Labor Statistics began collecting data on new building permits issued in the country’s largest cities. While Philadelphia is included in the data set, the data are not available at the ward level. In lieu of data on building permits, we computed the number of covenanted properties as a percentage of the number of dwellings listed in the 1920 Census. 28 It did so by exchanging government bonds for defaulted mortgages. See Hillier (2002) for additional information.

18
Only about 4 percent of covenants were in green areas, while over 60 percent of the
covenants were in blue areas and 23 percent in yellow areas. This suggests the hypothesis that
HOLC staff may have viewed the presence of covenants as a second-order factor in highly rated
portions of the city but weighed them more heavily when determining whether an area should
receive a blue grade or a yellow grade.
A second observation in Figure 4 that warrants further examination is the location of
covenanted properties near the borders of differently colored areas. This is particularly visible in
Northeast Philadelphia, where covenants in the blue area dot the perimeter between it and several
yellow areas, and in Southwest Philadelphia, where yellow areas border red areas. Covenanted
properties along area borders are further evidence that developers and builders may have viewed
covenants as necessary buffers between white neighborhoods and nearby African American
neighborhoods.
C. Enumeration District-Level Analysis
In their work on residential segregation, Allison Shertzer, John Logan, and their colleagues have
found that the geographic scale in which one examines residential segregation can have
significant effects on results. Shertzer, Walsh, and Logan (2016) argue that this issue — known
as the Modifiable Areal Unit Problem — has affected the work of previous researchers whose
analyses relied on ward-level data. For this reason, they recommend using EDs to examine racial
composition prior to introduction of census tracts in the 1940s.29 Moreover, they have created
and made publicly available ED shapefiles for the period 1900–1930 for 10 cities, including
Philadelphia.30
In Figure 5, the city is divided into hundreds of EDs, many of which are no larger than a
few city blocks. Alison Shertzer also provided us with demographic data at the ED level, which
we use to map the racial composition of each ED (shaded in blue). Figure 5 places the
covenanted properties in relation to the many small African American neighborhoods that dotted
the city in 1920, and, in doing so, significantly refines the narrative. The covenanted properties
29 In addition, Smith (2016) recommends using intensive data representations — those that are comparable across areal units of different sizes and characteristics — to conduct areal data analysis. An example would be to use population per square mile in place of population count. 30 The shapefiles are available to download at https://s4.ad.brown.edu/Projects/UTP2/HGISDoc/Final_Version_All_ED_Maps.zip.

19
tend to fall along a large horizontal swath of land just south of the greater Northeast, with
concentrations in neighborhoods, such as Dearnley Park (Shawmont), East Falls, East Mount
Airy, East Germantown, West Oak Lane, Lawndale, Juniata Park, Frankford, Mayfair, and
Tacony. West of the Schuylkill River, the covenants are clustered in the neighborhoods of
Overbrook, Carrol Park, Wynnefield, Kingsessing, Southwest Schuylkill, and Clearview. Just
east of the river, across from Southwest Schuylkill, covenanted properties were found in Grays
Ferry. In the greater Northeast, covenanted properties were found in Fox Chase and in the
Somerton Gardens section of Somerton, a small development along the city’s northern edge.
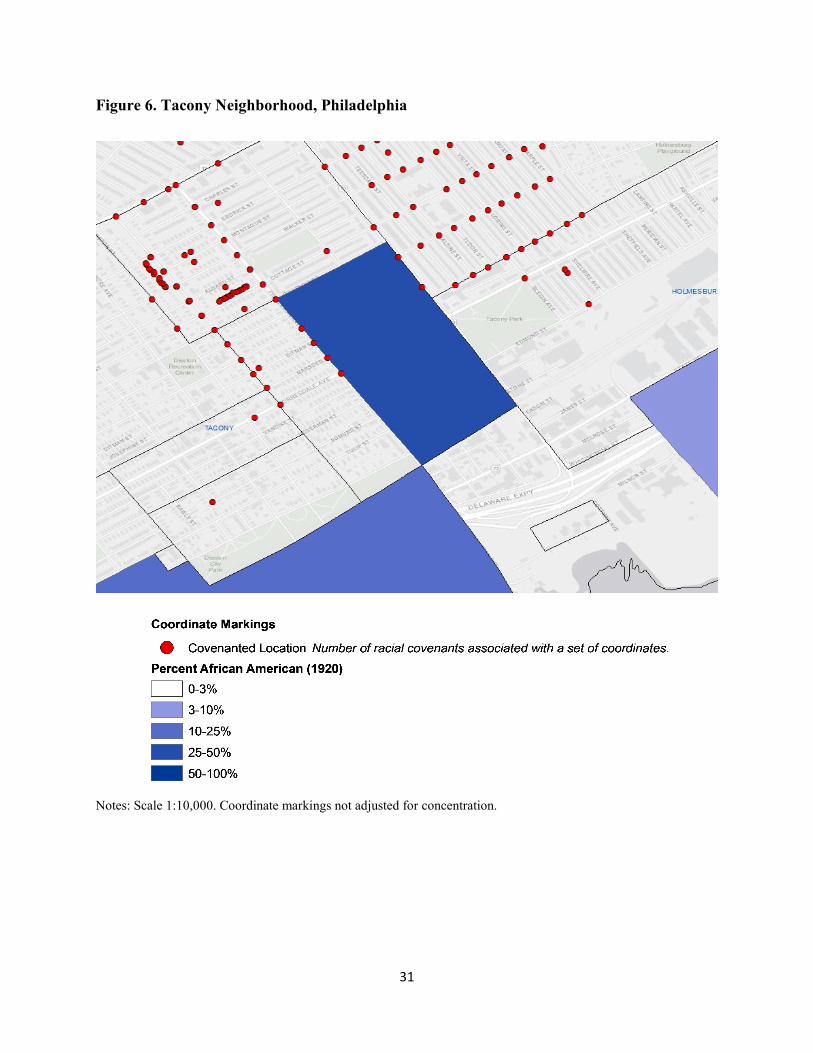
Many of the covenanted properties are in neighborhoods adjacent to those with high
concentrations of African Americans. For example, in Tacony — a neighborhood on the city’s
northeastern waterfront — the ED formed by Princeton Avenue, Gillespie Street, Route 73, and a
railway line, was 35 percent African American (Figure 6). There, racially covenanted properties
dot the bordering streets, presumably to keep African American residents from advancing into
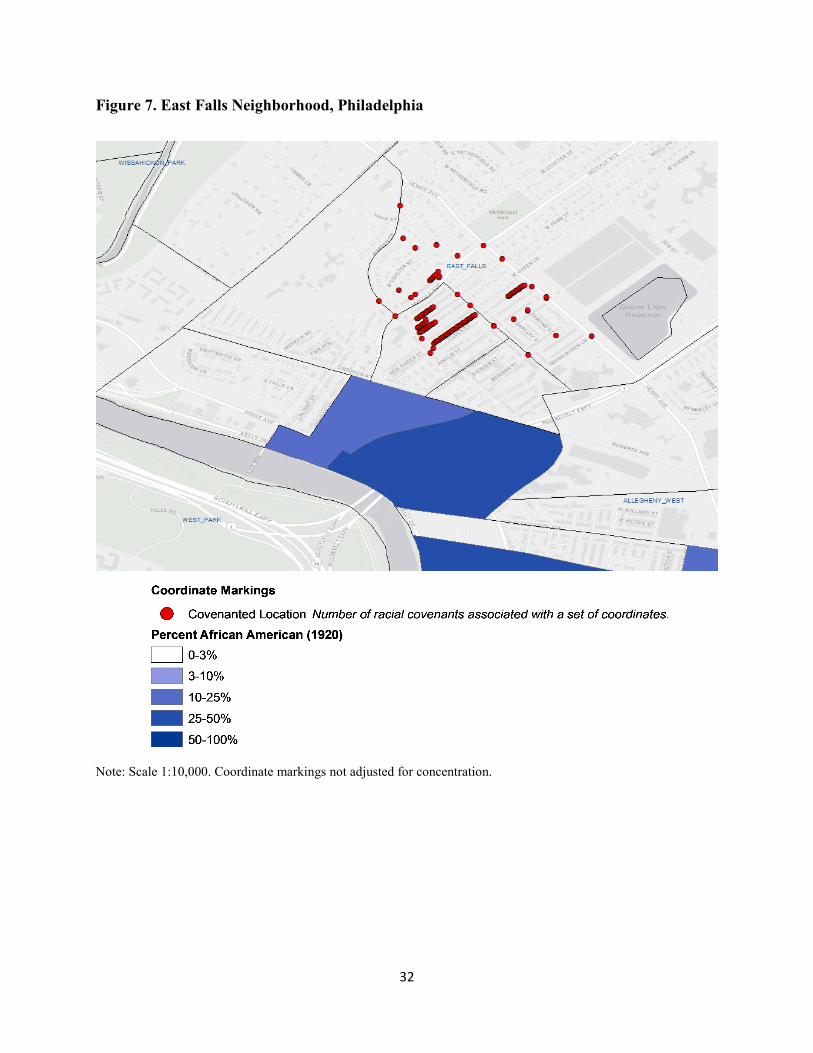
adjacent, mostly white neighborhoods.31 Likewise, in Figure 7, covenanted properties located in
the center of East Falls lie just north of two EDs with higher proportions of African American
residents.
In some instances, the imposition of racial covenants appears to have been driven by an
existential — rather than imminent — threat. In the Germantown Westside neighborhood, a
group of 44 homeowners living along either side of West Penn Street banded together in 1927 to
voluntarily impose a rather strict covenant, whereby violators could be evicted “by force of
arms” (Figure 8). The full text of the covenant is reproduced below:
That at no time hereafter forever shall any of the said properties be owned,
occupied, or leased by any persons other than those of the Caucasian race. That
at any time hereafter forever if any person or persons of any other race occupy
any of the said properties or any portion thereof, it shall be permissible for any
owner or occupier of any property hereinbefore mentioned to evict the same by
31 Recall from Section III.A.2 that, when a street address was unavailable, we approximated the property location to either the nearest street intersection or the intersection that marked the beginning of the metes-and-bounds description. Thus, it is likely that a racial covenant located at an intersection is linked to an interior lot. We do not believe this affects the results presented here.
20
force of arms or by action at law, and any title given by any deed to any person
other than that of the Caucasian race shall be null and void.
V. Concluding Remarks
The research presented in this Philadelphia Fed Discussion Paper represents a critical first step in
a broader initiative to ascertain the causal effects of racial covenants on a variety of economic
and social outcomes, including the wide and persistent racial wealth gap. We have begun the
process of cataloguing Philadelphia’s covenanted properties, finding 3,826 distinct covenants
placed on city properties from 1920 to 1932.
Going forward, we hope to better leverage our technological resources by automating key
parts of the discovery process, testing more powerful OCR software, and investigating how the
process might benefit from the tools of machine learning. With a refined process in hand, we
hope to continue to work with the Philadelphia Department of Records to expand our window
back to 1910 and forward to the Shelley decision of 1948 and beyond. Our preliminary findings
suggest there is a rich vein to be mined, and the information will only become more valuable as
more information is gathered and the geolocation process refined.

21
References
Aaronson, Daniel, Daniel Hartley, and Bhash Mazumder. “The Effects of the 1930s HOLC ‘Redlining’ Maps,” Working Paper 2017-12, Federal Reserve Bank of Chicago (2017).
Aliprantis, Dionissi, Daniel Carroll, and Eric Young. “Can Wealth Explain Neighborhood
Sorting by Race and Income?” Working Paper 18-08, Federal Reserve Bank of Cleveland (2018).
Boustan, Leah Platt. Competition in the Promised Land: Black Migrants in Northern Cities and
Labor Markets. Princeton, NJ: Princeton University Press, 2017. Boustan, Leah Platt. “Was Postwar Suburbanization ‘White Flight’? Evidence from the Black
Migration,” Quarterly Journal of Economics, 125-1 (2010). Brooks, Richard R.W., and Carol M. Rose. Saving the Neighborhood: Racially Restrictive
Covenants, Law, and Social Norms. Cambridge, MA: Harvard University Press, 2013. Christensen, Peter, and Christopher Timmons. “Sorting or Steering: Experimental Evidence on
the Economic Effects of Housing Discrimination,” Working Paper 24826, National Bureau of Economic Research (2018).
Cutler, David M., Edward L. Glaeser, and Jacob L. Vigdor. “The Rise and Decline of the
American Ghetto,” Journal of Political Economy, 107-3 (1999). Ferman, Barbara, Theresa Singleton, and Don DeMarco. “West Mount Airy, Philadelphia,”
Cityscape, 4-2 (1998). Freund, Ernst. The Police Power: Public Policy and Constitutional Rights. Chicago: University
of Chicago Press, 1904. Gibson, Campbell and Kay Jung. “Historical Census Statistics Population Totals By Race, 1790
to 1990, and By Hispanic Origin, 1970 to 1990, For The United States, Regions, Divisions, and States,” Working Paper 56, U.S. Census Bureau, Population Division (2002).
Gottlieb, Dylan. “Streetcar Suburbs,” The Encyclopedia of Greater Philadelphia (2015). Hillier, Amy. “Redlining in Philadelphia,” in Anne Kelly Knowles, ed., Past Time, Past Place:
GIS for History. Redlands, CA: ESRI Press, 2002. Hirt, Sonia A. Zoned in the USA: The Origins and Implications of American Land-Use
Regulation. Ithaca, NY: Cornell University Press, 2014.

22
Jones-Correa, Michael. “The Origins and Diffusion of Racial Restrictive Covenants,” Political Science Quarterly, 115-4 (Winter 2000).
Kaul, Greta. “With Covenants, Racism Was Written Into Minneapolis Housing. The Scars Are
Still Visible,” MinnPost, February, 22, 2019. Logan, John R., Weiwei Zhang, Richard Turner, and Allison Shertzer. “Creating the Black
Ghetto: Black Residential Patterns Before and During the Great Migration,” Annals of The American Academy of Political and Social Science, 660-1 (2015).
Massey, Douglas S., and Nancy A. Denton. American Apartheid: Segregation and the Making of
the Underclass. Cambridge, MA: Harvard University Press, 1993. Massey, Douglas S., and Nancy A. Denton. “The Dimensions of Residential Segregation,” Social
Forces, 67-2 (December 1988). McGruder, Kevin. Race and Real Estate: Conflict and Cooperation in Harlem, 1890-1920. New
York City: Columbia University Press, 2015. Monchow, Helen C. The Use of Deed Restrictions in Subdivision Development. Chicago: The
Institute for Research in Land Economics and Public Utilities, 1928. National Association of Real Estate Boards. Code of Ethics. National Association of Real Estate
Boards, 1928. New York Times, “Baltimore Tries the Drastic Plan of Race Segregation,” December 25, 1910. Plotkin, Wendy. “‘Hemmed In’: The Struggle against Racial Restrictive Covenants and Deed
Restrictions in Post-WWII Chicago,” Journal of the Illinois State Historical Society, 94-1 (2001).
Rolland, Keith, and Kyle DeMaria. “Mt. Airy: A Legacy of Intentional Integration,” Federal
Reserve Bank of Philadelphia Cascade 94 (Winter 2016). Rose, Carol M. “Property Law and the Rise, Life, and Demise of Racially Restrictive
Covenants,” Discussion Paper 13-21, Arizona Legal Studies (2013). Roithmayr, Daria. Reproducing Racism: How Everyday Choices Lock In White Advantage. New
York: New York University Press, 2014. Scanlan, Alfred Long. “Racial Restrictions in Real Estate — Property Values Versus Human
Values,” Notre Dame Law Review, 24-2 (1949). Shertzer, Allison, Randall P. Walsh, and John R. Logan. “Segregation and Neighborhood
Change in Northern Cities: New Historical GIS Data from 1900-1930,” Historical Methods, 49-4 (2016).
23
Shertzer, Allison, and Randall P. Walsh. “Racial Sorting and the Emergence of Segregation in
American Cities,” Working Paper 22077, National Bureau of Economic Research (2016). Smith, Tony E. “Notebook on Spatial Data Analysis,” (2016). Sood, Aradhya, William Speagle, and Kevin Ehrman-Solberg. “Long Shadow of Racial
Discrimination: Evidence from Housing Covenants of Minneapolis,” unpublished manuscript, 2019.
WOSU Public Media, “Divided by Design: Racially Restrictive Deed Clauses Remain on the
Books Despite Being Illegal,” November 15, 2017.

24
Figure 1. Advertisement for New Homes (1911)
Source: The Philadelphia Inquirer, Sunday, March 5, 1911; courtesy of J.M. Duffin, University of Pennsylvania.

25
Figure 2. Excerpt from Deed of Sale from James H. Watson to George W. Twaddell
(April 10, 1912)
Source: City of Philadelphia Department of Records; courtesy of J.M. Duffin, University of Pennsylvania.

26
Table 1. Racial Covenants Identified in Philadelphia Deed Books, 1920–1932
(a) (b) (c) (d) (e)
Ward Number of Covenanted Properties
Racial Covenants per Thousand
Dwellings
Percent African
American, 1920
Percent African
American, 1930 1 0 0 0.6% 2.4%
2 0 0 5.6% 17.9%
3 0 0 7.9% 21.1%
4 0 0 15.6% 33.0%
5 0 0 6.7% 11.9%
6 0 0 5.1% 19.8%
7 0 0 46.5% 41.5%
8 16 8.6 13.1% 8.5%
9 0 0 12.5% 6.0%
10 0 0 5.5% 8.7%
11 0 0 4.2% 21.3%
12 0 0 4.1% 20.3%
13 0 0 11.1% 26.4%
14 0 0 27.0% 46.0%
15 3 0.4 8.4% 10.7%
16 0 0 1.0% 6.8%
17 0 0 2.0% 3.6%
18 0 0 0.3% 0.1%
19 1 0.1 1.2% 3.0%
20 2 0.2 17.6% 35.9%
21 111 14.8 1.8% 2.6%
22 877 50.5 7.8% 9.1%
23 192 23.7 2.2% 2.9%
24 7 0.6 13.5% 23.7%
25 0 0 0.6% 1.3%
26 0 0 9.1% 8.9%
27 39 11.8 12.1% 13.0%

27
(a) (b) (c) (d) (e)
Ward Number of Covenanted Properties
Racial Covenants per Thousand
Dwellings
Percent African
American, 1920
Percent African
American, 1930 28 84 7.0 3.4% 12.7%
29 2 0.3 5.3% 21.9%
30 0 0 52.5% 70.3%
31 0 0 0.1% 0.1%
32 3 0.3 8.3% 31.7%
33 61 4.1 0.4% 0.2%
34 593 38.3 4.9% 16.0%
35 228 84.9 1.8% 1.5%
36 74 6.7 24.1% 29.8%
37 1 0.2 4.8% 8.0%
38 336 22.0 2.8% 3.8%
39 25 1.7 1.0% 2.9%
40 283 17.1 5.0% 6.8%
41 318 82.5 5.0% 5.4%
42 434 30.6 1.1% 0.7%
43 36 2.8 1.8% 1.7%
44 14 1.6 7.9% 26.2%
45 11 1.4 0.9% 0.8%
46 62 3.6 1.3% 1.7%
47 2 0.4 27.9% 40.9%
48 11 2.0 0.1% 0.6%
Totals 3,826 10.8 7.4% 11.3%
Notes: Number of racial covenants identified in property deeds found in City of Philadelphia Deed Books from 1920 to 1932. Multiple covenants on a single property are counted once. Totals include the population and dwellings of all 48 wards, including those in which no racial covenants were found.

28
Figure 3. Number of Covenanted Properties per Thousand Dwellings, by Ward, 1920–1932
Source: Author’s calculations Notes: Number of racial covenants identified in deeds books from 1920 until 1932. Dwellings are from 1920 Decennial Census.
29
Figure 4. Location of Racial Covenants on HOLC Residential Security Map (1937)
Note: Geographic boundaries are enumeration districts.

30
Figure 5. Location of Covenanted Properties Relative to African American Population
Note: Geographic boundaries are enumeration districts.
31
Figure 6. Tacony Neighborhood, Philadelphia
Notes: Scale 1:10,000. Coordinate markings not adjusted for concentration.
32
Figure 7. East Falls Neighborhood, Philadelphia
Note: Scale 1:10,000. Coordinate markings not adjusted for concentration.

33
Figure 8. Voluntary Neighbor Agreement, West Penn Street in Germantown
Note: Scale 1:15,000. Coordinate markings not adjusted for concentration.
Consumer Finance Institute Discussion Paper Series
http://www.philadelphiafed.org/consumer-finance-institute