how pediatrics can ameliorate its effects on child health
TRANSCRIPT

The High Cost of Poverty:How Pediatrics Can Ameliorate its
Effects on Child Health
Community Action Partnership Annual ConventionSeptember 1, 2016
Benard P. Dreyer, MD FAAPPresident, American Academy of Pediatrics
DISCLOSURE STATEMENT
Benard P. Dreyer, MD, FAAP
Has documented that he has nothing to disclose.

AAP BY THE NUMBERS
• 66,000 Members• 66 state/local chapters• 30 national committees, 49 sections, 6 councils• 450 employees in Illinois, Washington, D.C.

AAP MISSION
To attain optimal physical, mental, and
social health and well-being for all
infants, children, adolescents, and young
adults. To accomplish this mission, the
Academy shall support the professional
needs of its members.

Setting the Standard Issued 50+ policies in
the last year, taking the form of• Policy statements
• Clinical Reports
• Technical Reports
• Clinical Practice Guidelines

13.5
10.0
0
5
10
15
20
25
30
1980 1985 1990 1995 2000 2005 2010
Childrenunder 18
21.1
Source: U.S. Census Bureau, Current Population Survey, Annual Social and Economic Supplement(https://www.census.gov/content/dam/Census/library/publications/2015/demo/p60-252.pdf)
Adults 18-64
Adults 65+
25% of children 0-5 livebelow the FPL
U.S. POVERTY TRENDS BY AGE GROUP
1980-2014
Pe
rc
en
t

0
5
10
15
20
25
30
35
40
45
50
19801982198419861988199019921994199619982000200220042006200820102012
% B
ELO
W 1
00
% O
F FE
DER
AL
PO
VER
TY L
EVEL
Portion of children in the U.S. Living below the federal poverty level by
race/ethnicity: 1980-2013
White Black Hispanic
Source: U.S. Census Bureau. Income and Poverty in the United States: 2013, Current Population Reports
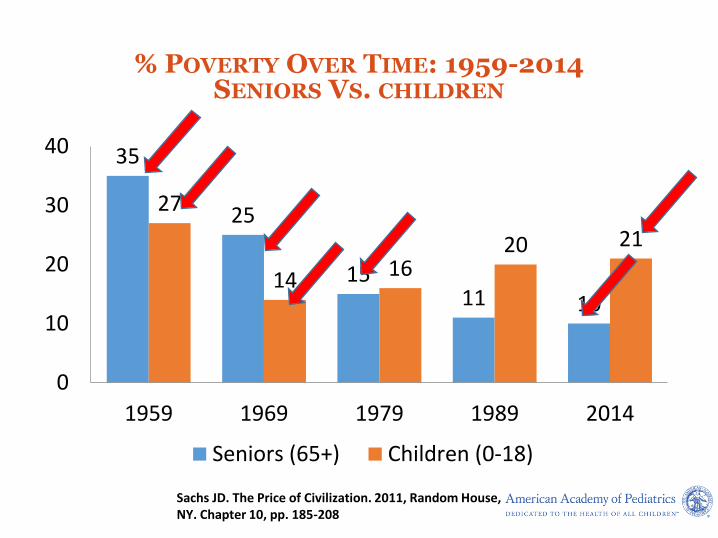
35
25
1511 10
27
14 1620 21
0
10
20
30
40
1959 1969 1979 1989 2014
Seniors (65+) Children (0-18)
Sachs JD. The Price of Civilization. 2011, Random House, NY. Chapter 10, pp. 185-208
% POVERTY OVER TIME: 1959-2014SENIORS VS. CHILDREN

US FEDERAL POVERTY LEVEL
DEVELOPED IN 1963-64
Mollie OrshanskySocial Security Administration
Based on “economy food plan”
Cheapest of 4 food plans developed by the Dept of Agriculture
“designed for temporary or emergency use when funds are low”
100% FPL for Family of 2 adults, 2 children: $23,850

Block et al. Struggling to Get By:The Real Cost Measure in California 2015
43% of children are below 200% FPL

POVERTY IS EVERYWHERE
Suburbs fasting growing area for poverty

POVERTY IS EVERYWHERE
4664
51
28
52
0102030405060708090
100
% P
atie
nts

POVERTY AFFECTS CHILD HEALTH
Poverty is one of the most significant
non-communicable diseases children are suffering from today

• Increased infant mortality
• Low birthweight and subsequent problems
• Chronic diseases such as asthma
• More food insecurity, poorer nutrition & growth
• Poorer access to quality health care and healthy food (transportation, food deserts)
• Increased accidental injury and mortality
• Increased obesity and its complications
• Increased exposure to toxins (i.e., lead) and pollutants
Moore KA et al. Children in poverty: trends, consequences, and policy options. 2009. Child Trends Research Brief
CONSEQUENCES OF POVERTY: CHILD HEALTH

• More toxic stress impacting EBCD• Poorer educational outcomes:
– poor academic achievement– higher rates of HS dropout
• Less positive social and emotional development• More problem behaviors leading to “TAEs”
– Early unprotected sex with increased teen pregnancy– Drug and alcohol abuse– Increased criminal behavior as adolescents and adults
• More likely to be poor adults– Low productivity and low earnings
• Especially if deep poverty (<50% FPL), long-term poverty, or poverty in early childhood
Moore KA et al. Children in poverty: trends, consequences, and policy options. 2009. Child Trends Research Brief
CONSEQUENCES OF POVERTY: WELL-BEING

WHY EARLY EXPERIENCES MATTER
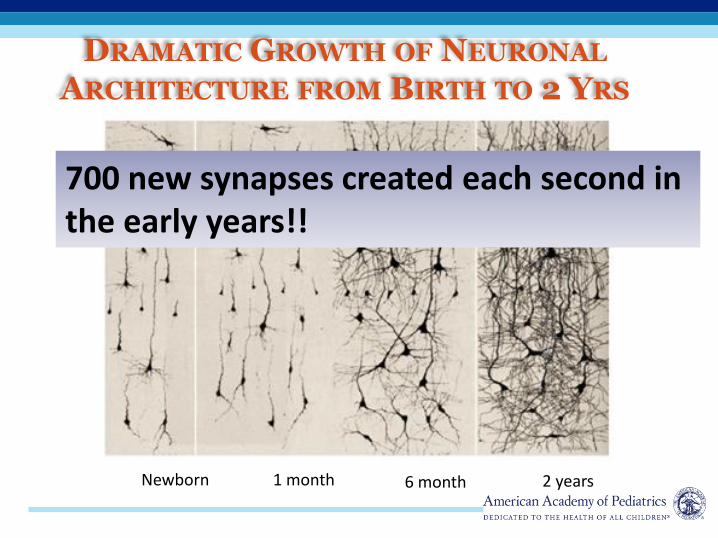
DRAMATIC GROWTH OF NEURONAL
ARCHITECTURE FROM BIRTH TO 2 YRS
Newborn 1 month 6 month 2 years
700 new synapses created each second in the early years!!
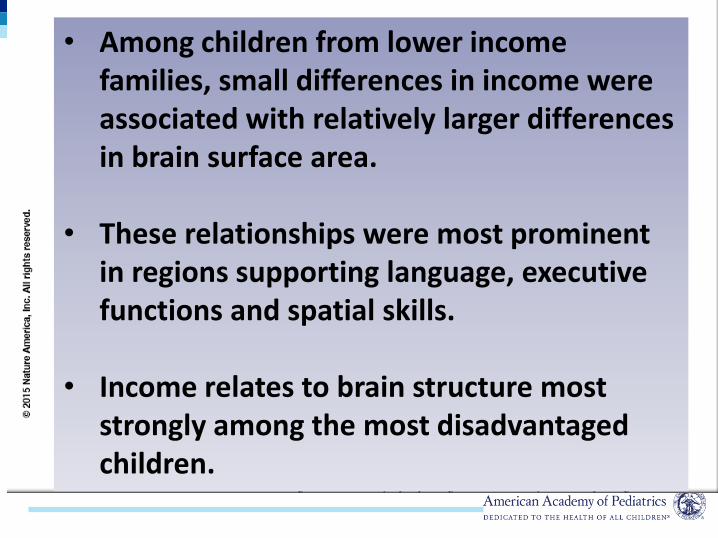
• Among children from lower income families, small differences in income were associated with relatively larger differences in brain surface area.
• These relationships were most prominent in regions supporting language, executive functions and spatial skills.
• Income relates to brain structure most strongly among the most disadvantaged children.

Hair et al. JAMA Pediatrics published online July 20, 2015
Editorial in JAMA Pediatrics:The findings of the Hair et al study showed that poor cognitive and academic performance among children living in poverty was mediated by a smaller hippocampus and frontal and temporal lobes and that the decrease in volume of the latter 2 structures explained as much as 15% to 20% of the achievement deficits found.

Hart & Risley, 1995
Professional
Poor
Working classCHILD’S
CUMULATIVEVOCABULARY
Age of Child (in months)
1200
1000
800
600
400
200
0
DISPARITIES BEGIN VERY EARLY
30 Million word gap

Heckman JJ. Skill formation and the economics of investing in disadvantaged children. Science. 2006;312:1900Carneiro P, Heckman JJ. In Inequality in America: What Role for Human Capital Policies? Heckman jj, Krueger AB, MIT Press 2003, chapter 2, pp 77-237.

Too Many Children Left Behind. Bradbury, Corak, Waldfogel, Washbrook. 2015

Too Many Children Left Behind. Bradbury, Corak, Waldfogel, Washbrook. 2015

It’s Health Equity
It’s early brain & child dev
It’s epi-genetics
It’s foster care It’s
mental health problems
It’s obesity
It’s Poverty!!!!!
…it’s a little like the blindfolded man feeling the elephant
And when we talk about children’s problems, we say…
It’s problems of immigrant children
It’s food insecurity
It’s low immuniz. rates
It’s poor oralhealth
It’s toxic stress
It’s ACES (adverse child events)
It’s chronic diseases e.g. asthma
It’s familyHomeless-ness
It’s lead poisoning


Figure 1
The Journal of Pediatrics 2013 163, 574-580.e1DOI: (10.1016/j.jpeds.2013.01.064)
HEALTH DISPARITIES IN ASTHMA:DIRECTLY RELATED TO POVERTY LEVELS AND ASSOCIATED
NEIGHBORHOOD FACTORS (POLLUTION, BAD HOUSING, LACK OF PHARMACIES)
Beck, Kahn et al. Journal of Pediatrics. 2013

ECONOMIC CASE FOR ENDING
CHILDHOOD POVERTY
• Reduces productivity and economic output by about 1.3% of GDP
• Raises the costs of crime by 1.3% of GDP
• Raises health expenditures and reduces the value of health by 1.2% of GDP
• Total cost of childhood poverty is 3.8% of GDP or $500 billion per year
• Context: Estimated Federal Deficit 2015 is 2.6% of GDP
Holzer HJ, Schanzenbach DW, Duncan GJ, Ludwig J. The Economic Costs of Poverty in the United States: Subsequent Effects of Children Growing Up Poor. 2007

Accelerating Improved Care for Children with Asthma

POVERTY AND CHILD HEALTH
LEADERSHIP WORKGROUP
• Andrew Racine, MD, PhD, FAAP
• Carole Allen, MD, FAAP
• Steve Federico, MD, FAAP
• Andrew Garner, MD, FAAP
• Benjamin Gitterman, MD, FAAP
• Renée Jenkins, MD, FAAP
• Katie Plax, MD, FAAP
• Barbara Ricks, MD, FAAP
• Sarah Jane Schwarzenberg, MD, FAAP
• Elizabeth Van Dyne, MD, FAAP
• Benard Dreyer, MD, FAAP

PRIORITY AREAS OF POVERTY WORK
• Messaging and Communications
• Supporting Practices to Address Poverty
• Advocacy
• Community Partnership and Engagement

MESSAGING AND COMMUNICATIONS
• Key Messages
– Poverty is Damaging to Children’s Health
– Poverty Happens Everywhere
– Fortunately, we have realistic solutions that we know will work
▪ Federal policies work! Without them 1 in 3 children would be poor as opposed to 1 in 5
▪ There are also important Federal and state programs that ameliorate the impact of poverty

CBPP: Chart Book: SNAP 2016
Extreme Poverty: living on <$2/day per family member3.5 million children in extreme poverty without SNAP1.2 million children in extreme poverty with SNAP

SUPPLEMENTAL POVERTY MEASURE:GOVERNMENT PROGRAMS WORK
• Using these measures in 2013 reduced % at 100% FPL from 21% to 16.5%
• Major portion of effect due to:▪ EITC -6.4%▪ SNAP(food stamps) -2.9%▪ Housing Subsidy -1.4%▪ School Lunch -1.1%▪ WIC -0.4%▪ Energy Assistance -0.1%▪ TANF -0.5%▪ Work/Child Care Expenses +3.1%▪ Medical OOP Expenses +3.5%▪ Taxes and FICA +2.0%
] -13%
With Medicaid (-1%)-14%

HIGH/SCOPE PERRY PRESCHOOL
PROGRAM: MAJOR FINDINGS AT 40
• 7 to 10% per year rate of return• Higher than post-World War II stock market
(5.8% -- before the 2008 meltdown)
• 7 to 12X Benefit/Cost Ratio
Heckman et al : Rate of return for High/Scope Perry Preschool Program. 2009

HEAD START AND EARLY HEAD
START

HOME VISITING: NURSE FAMILY
PARTNERSHIP
• Better language age 4
• Higher reading and math scores age 12
• $5.70 saved for each dollar of costMIECHV reaches only 2.5% of poor children under 3
years: 75,000 of 3 million

INTERVENTIONS IN PEDIATRIC
PRIMARY CAREReach Out and Read
6
3
0
5
10
Receptive Expressive
Advance in Language (months) in 2-5 yr-
olds
VIP: Video Interaction Project
Birth to 3 years
• Increased parent-child interactions, vocalizations
• Improved child cognitive, language, and social-emotional development
• Reduced delay, with 50% reduction in need for EI
P <0.05
Mendelsohn, Mogilner, Dreyer, Forman et al. Pediatrics. 2001;107:130-134.
Mendelsohn, Dreyer et al. J Dev Behav Pediatr2005;26(1):34-41 and 2007; 28(3): 206-212.
ROR Reaches 4 million children per year:¼ of all poor children!


SUPPORTING PEDIATRICIANS
TO ADDRESS POVERTY
• New AAP Report and Policy Statement
– Mediators and Adverse Effects of Child Poverty in the United States
– Child Poverty in the United States
• Screening and Referral Resources
• Advocacy Resources

POVERTY TECHNICAL REPORT
• Details impacts on child health and development
• Describes poverty demographics in the U.S.
• Addresses child poverty as a source of toxic stress

POVERTY POLICY STATEMENT
• Recommendations for pediatricians to screen for basic needs and make referrals
• Recommends that pediatricians adopt integrated programs in medical home*
• Supports advocacy for anti-poverty programs, income supports, and tax credits
*Healthy Steps, ROR, VIP, Health Leads, MLP, Incredible Yrs, Triple P

RECOMMENDATIONS FOR PEDIATRICIANS
• Screen for risk factors within social determinants of health during patient visits
– Questions about basic needs such as food, housing, heat, child care, making ends meet
– Refer to community resources
– We know SNAP, EITC, etc. improve child health and academic success
• Implement integrated medical home programs such as:
– Reach Out and Read
– Video Interaction Project
– Healthy Steps
– Incredible Years and Triple P (behavioral management)
• Collaborate with community organizations to help families address unmet needs and assist with stressors

PRACTICE RESOURCES
• Suggests screening tools to identify basic needs
• Provides template for practices to identify community resources
• Recommends practice tips for implementation

STATE ADVOCACY
RESOURCES
• Child Poverty Partners
• State Child Poverty Commissions
• Information on State Income Supports and Tax Credits, Paid Leave, Minimum Wage
• Anti-poverty Programs
aap.org/poverty

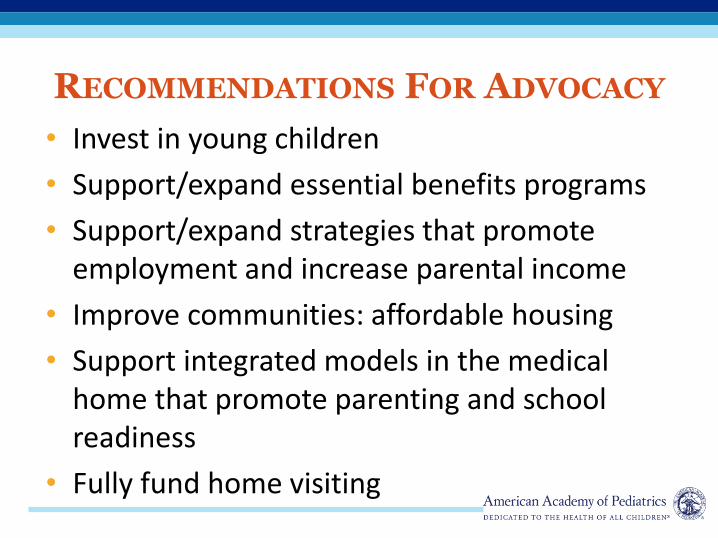
RECOMMENDATIONS FOR ADVOCACY
• Invest in young children
• Support/expand essential benefits programs
• Support/expand strategies that promote employment and increase parental income
• Improve communities: affordable housing
• Support integrated models in the medical home that promote parenting and school readiness
• Fully fund home visiting

FEDERAL ADVOCACY
• Successes in 2015
– CHIP funding through 2017
– Expiring provisions of the EITC and CTC made permanent
– Omnibus spending deal that increased austere budget caps
• Opportunities and Challenges in 2016
– Federal Nutrition Programs including school meals, WIC, summer feeding, and SNAP
– Appropriations: Funding for child care, head start and early head start, home visiting, TANF
– Speaker Paul Ryan’s Task Force on Poverty, Opportunity and Upward Mobility: Block grants (Medicaid and SNAP)
• Presidential Election
– AAP Blueprint for Children: How the Next President Can Build a Foundation for a Healthy Future
– September 19, 2016: 2:00 to 3:30 pm ET
– Live-streamed on AAP.org

COMMUNITY PARTNERSHIP AND
ENGAGEMENT• Working with other sectors and developing
new partnerships
• Developing local collaboration models and tools
• Community?: local, county, city

NY PASSES PAID FAMILY LEAVE
• 12 weeks of job-protected leave• Can be used for maternity/paternity
leave even for foster children; also sick children, sick family members
• 2/3 of wages up to 2/3 of statewide average wage
• 8 weeks start in 2018• Fully phased in by 2021

PAID FAMILY LEAVE EFFORTORGANIZED BY THE COMMUNITY SERVICES SOCIETY OF NY
It takes a village.It’s a Marathon, not a sprint

Rural IMPACT:
Rural Integration Models for Parents and Children to Thrive

Rural IMPACT Goal:
To reduce child poverty in rural and tribal areas
HOW:
By improving the well-being of children, parents and families
THROUGH:
A two-generation approach that will address the needs of both vulnerable children and their parents together.

Rural IMPACT Demonstration Partners
White House Rural Council
(WHRC)
Department of Agriculture (AG)
Department of Education (ED)
Department of Health and Human
Services (HHS)
Administration for Children and Families
(ACF)
Office of Community Services (OCS)
Community Action Partnership (CAP)
Office of Family Assistance (OFA)
Office of Child Care (OCC)
Health Resources and Services Administration
(HRSA)
Maternal and Child
Health Bureau (MCHB)
American Academy of Pediatrics (AAP)
Federal Office of Rural Health Policy (FORHP)
Substance Abuse and Mental Health Services
Administration
(SAMHSA)
Department of Labor (DOL)
Corporation for National and
Community Service (CNCS)
Appalachian Regional
Commission (ARC)
Delta Regional Authority (DRA)
Others (TBD)
Office of Head Start (OHS)

Rural IMPACT SitesLocation Organization
Oakland, MD Garrett County Community Action Committee & Allegany County Human Resources Development Commission, Inc.
Berea, KY Partners for Education at Berea College (Knox County)
Marshalltown, IA Mid-Iowa Community Action, Inc. (Marshall County)
Jackson, MS Friends of Children of Mississippi, Inc. (Sharkey, Issaquena, Humphreys Counties)
Hillsboro, OH Highland County Community Action Organization, Inc.
White Earth, MN White Earth Reservation Tribal Council (Mahnomen, Clearwater, Becker Counties)
Machias, ME Community Caring Collaborative (Washington County)
Blytheville, AR Mississippi County, Arkansas Economic Opportunity Commission, Inc.
Blanding, UT The San Juan Foundation (San Juan County)
Hugo, OK Little Dixie Community Action Agency, Inc. (Choctaw,McCurtain, Pushmataha Counties)


56
Rural IMPACT Demonstration• Rural Integration Models
for Parents and Children to Thrive (IMPACT)– help communities adopt a
two-generation approach to programs, policies, and systems
– a comprehensive, whole-family framework for addressing child poverty.
10 rural & tribal communities will receive:
– Technical assistance
– Support from Federal staff
– AmeriCorps VISTA members
– Peer learning
– Coaches
Source: Shelly Waters Boots, Sarah Griffen, and Karen Murrell (consultants)
Two-gen and other content expertise;
monthly web meetings and as-
needed consulting
Project management; T/A,
coach and peer learning
coordination
Oversight and Coordination; policy leadership; barrier
busting
Federal Interagency Committee
AAP
T/A and content
expertise
CAP
T/A and content experts
VISTA coordinators

NCECHWNational Center on Early Childhood
Health and Wellness

NCECHW A Brief Snapshot
•Awarded September 30, 2015
•5-year cooperative agreement with 3 different Federal agencies
•Builds on the work of the National Center on Health and Healthy Child Care America
•Audiences include Head Start/Early Head Start, child care, and pediatric health services professionals

NCECHWThe Partners
• American Academy of Pediatrics
• Education Development Center
• University of California, Los Angeles Health Care Institute
• Georgetown University’s National Maternal and Child Oral Health Resource Center
• Georgetown University’s Center for Child and Human Development
• Child Care Aware of America
• Nemours
• University of Colorado, Denver National Resource Center for Health and Safety in Child Care and Early Education
• Zero to Three

ACF Health and Wellness Goals• Improve the health and safety of ECE settings;
• Promote positive child health outcomes for children participating in ECE programs;
• Increase preventive services related to health outcomes;
• Promote access to continuous, accessible health services for children and families;
• Promote mental wellness and resiliency for staff, children, pregnant women, and families; and
• Strengthen networks and coordination of ECE programs and child health professionals

Asthma
Toxic stressTrauma and resilience
Emergency preparedness
Staff wellnessChallenging behaviors
Working with state and community partnersParental depression
Medication administration
Medical home
Oral health
Oral health of pregnant women
Oral health follow-up
Motivational interviewing
Safety and Injury Prevention
Active supervisionBuilding systems to support health
Aggregating and analyzing health data
How health impacts school readiness
Health literacy
Parent engagement in health
IMIL
Childhood obesity
Healthy active living
New health manager orientation
Tobacco exposure
Sensory screening
Stress
HSAC
Mental health

Online Resources
• Newsletters
• Fact sheets
• Online Tools
• Archived Webinars
• InfoLine
• Parent Resources
http://eclkc.ohs.acf.hhs.gov/hslc/tta-system/health/center

Virtual Early Education Center
http://eclkc.ohs.acf.hhs.gov/hslc/tta-system/health/health-services-management/program-planning/veec.html

Optimize healthy
development
Promote resilience
Providepreventative
services
Mitigate trauma & toxic stress
ECE Programs
MedicalHome
Working Together
Early Care and Education-Medical Home Learning Collaborative

PARTNERSHIP WITH CAPHEALTH INTERSECTION LEARNING COMMUNITY GROUP
• Webinar series
• AAP speakers, Community Action Agencies participate
• 3-4 webinars: toxic stress, oral health obesity, immigrant health
• November to April

“It is easier to build strong children than to repair broken men.”
Frederick DouglassAmerican Abolitionist
1818-1895
