how not to conduct an energy evaluation - wwoa.org conference...how not to conduct an energy...
TRANSCRIPT

How NOT to conduct an energy evaluation
WWOA 2015 Conference Technical Program Tuesday, October 6, 2015 2:40 p.m. to 4:00 p.m. CDT Workshop #2A Marula/Aralia Room Wisconsin Dells - Kalahari Convention Center 1305 Kalahari Drive Wisconsin Dells, Wisconsin 53965

Welcome
Thank you to

Speaker
• Tom Jenkins, JenTech Inc. – [email protected]
– (414) 352-5713
– President of JenTech Inc.
– Adjunct Professor of Civil and Environmental Engineering, UW Madison
– Founder of ESCOR (Energy Strategies Corporation)
– Over thirty years experience in automation and energy conservation in wastewater treatment processes
9:20 AM Wastewater Energy Evaluations 3

Please:
• Ask Questions! – At Any Time
– About Anything
• Share Your Experiences
• Cell Phones Off – Voice
– Text
9:20 AM Wastewater Energy Evaluations 4

Agenda • A few basics
• Using composite power cost may not reflect actual savings
• Ignoring non-quantitative factors in recommendations may result in ECM failure
• Consolidating all ECMs into a major plant upgrade may forgo years of savings
• Using motor nameplate power overestimates reductions
• Using design point performance for pumps and blowers doesn’t reflect actual power
• Using average operating conditions neglects the effect of peak demands
• Getting into too much detail in the analysis adds to effort without improving results
9:20 AM Wastewater Energy Evaluations 5

Some Basic Formulas
Determining electrical power:
If voltage and current are known:
If actual load power draw is known:
9:20 AM Wastewater Energy Evaluations 6
kW=Volts ∙ Amps ∙ No. Phases ∙ Power Factor
1000
Can get Power Factor from motor data sheets. For estimating Power Factor use 0.90 at 100% load, 0.80 at 50% load
Can get efficiency from manufacturer’s data. For estimating efficiency use 0.92 for motors and 0.97 for VFDs

Some Basic Formulas
• Calculating Savings – With Composite Rates
– With actual rates (Ignores Power Factor Charges)
9:20 AM Wastewater Energy Evaluations 7

• For most ECMs simple payback is preferred:
Some Basic Formulas
9:20 AM Wastewater Energy Evaluations 8
Payback Period, Years =Installed Cost
Savings per Year

Electric Power Cost
• Electric energy costs are complex
• They reflect utility costs for generation and distribution
• Very few operators or managers actually see electric bills
– Even fewer understand them
• Work with your utility’s engineers and account managers!
– They want to help you save energy
– Conservation measures may be mandated by law or driven by need to avoid building new generators
– They can provide usage history, demand charts, rate details, etc.
9:20 AM Wastewater Energy Evaluations 9

Electric Power Cost
• Energy ≠ Power ≠ Electric cost
• Energy = Capacity to do work
• Power = Work done per unit time
• Cost = Expenditure required to obtain electricity – Cost = Money and other outlays (time, CO2, labor, water …..)
9:20 AM Wastewater Energy Evaluations 10

Electric Power Cost
• Energy cost usually consists of several components: – Time of Day Energy Consumption
– On-Peak 8:00 AM to 8:00 PM weekdays for typical WPPI customer (where it applies!)
– 60 hours per week
– Off-Peak Weekends and Nighttime
– 108 hours per week
• Peak Demand Power = Highest Average Power Consumption Over 15 Minutes During On-Peak Time
• Power Factor – may be assessed against peak demand – if PF < 85%
9:20 AM Wastewater Energy Evaluations 11
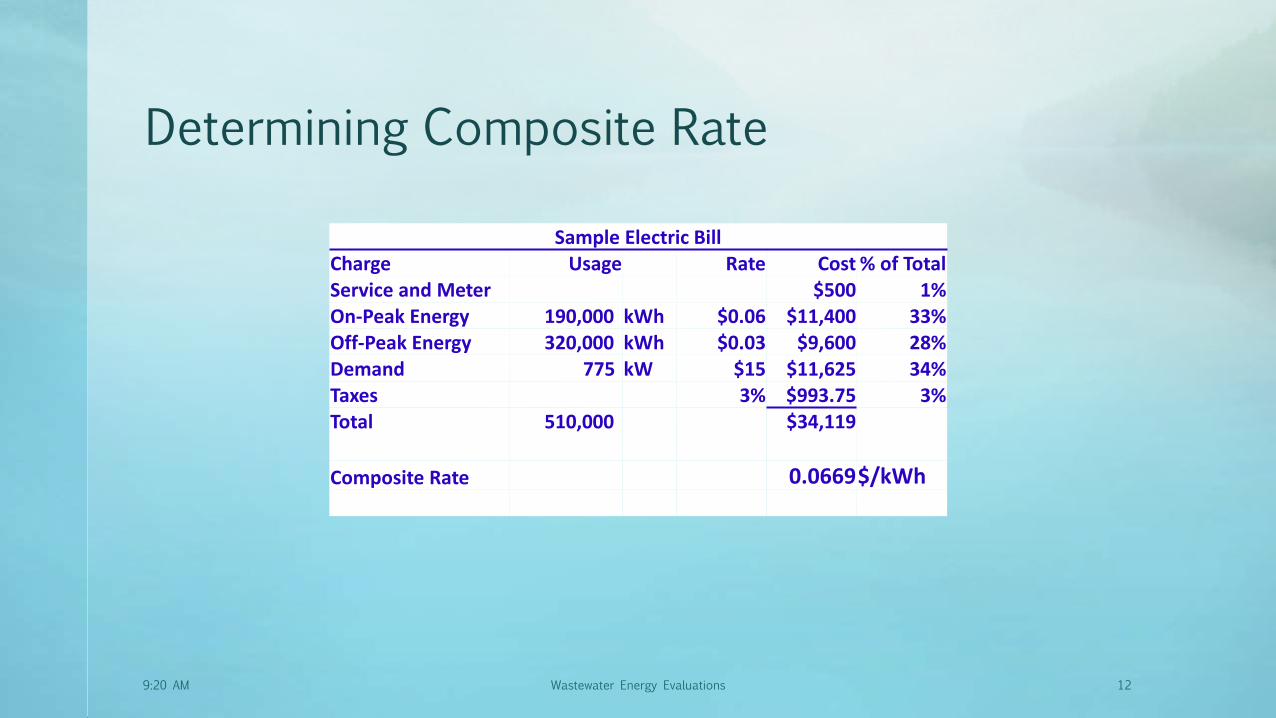
Determining Composite Rate
9:20 AM Wastewater Energy Evaluations 12
Sample Electric Bill Charge Usage Rate Cost % of Total Service and Meter $500 1% On-Peak Energy 190,000 kWh $0.06 $11,400 33% Off-Peak Energy 320,000 kWh $0.03 $9,600 28% Demand 775 kW $15 $11,625 34% Taxes 3% $993.75 3% Total 510,000 $34,119
Composite Rate 0.0669 $/kWh

Using Composite Rate
• Exercise caution when using composite (average) rates!
Example of ECM calculated with composite rate:
• The total energy per month is the same with and without VFDs, with the lower power being offset by the longer hours!
• Using the composite rate incorrectly indicates no $ savings. 9:20 AM Wastewater Energy Evaluations 13
Composite Rate Basis Current Pumping 100 kW Constant Speed On/Off with Floats With VFD 75 Constant Wet Well Level Hours per Day On 18 Average Hours per Day On 24
Hour per Month 545.4 Hour per Month 727.2 Cost per Month $3,649 Cost per Month $3,649
Based on $0.0669/kWh Composite Rate Cost per Year $43,784 Cost per Year $43,784
Savings $0
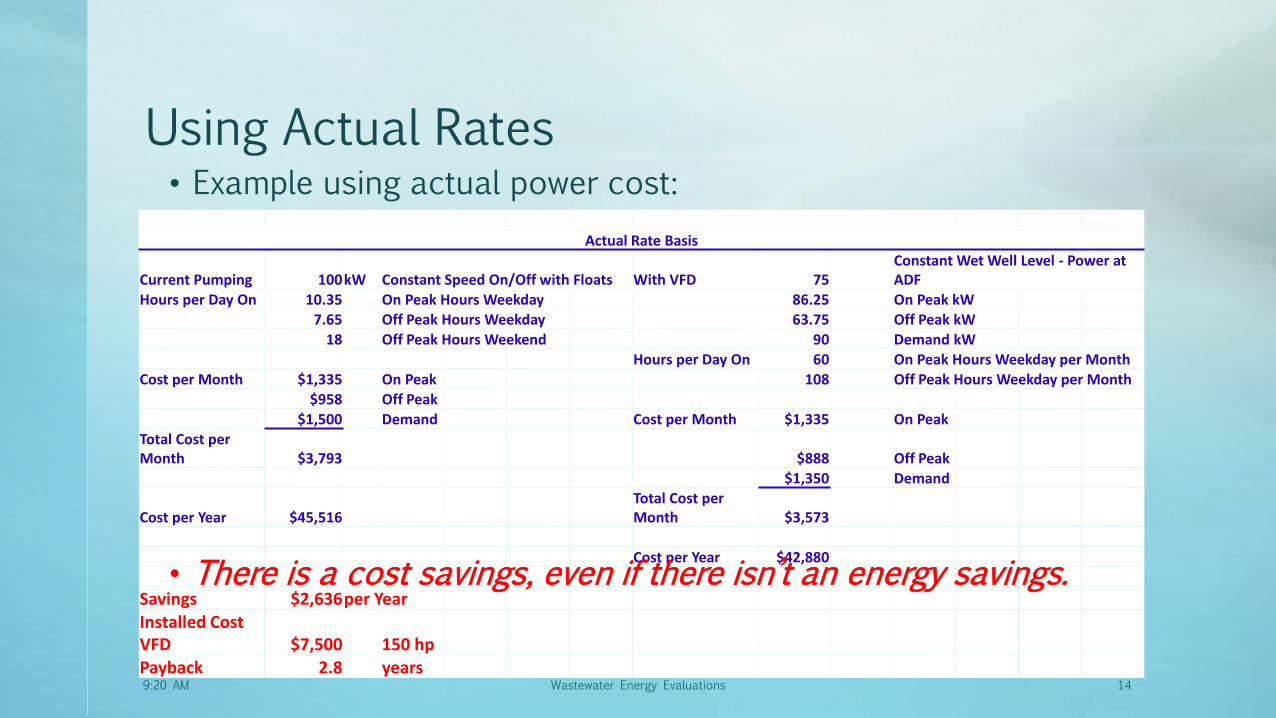
Using Actual Rates
9:20 AM Wastewater Energy Evaluations 14
Actual Rate Basis
Current Pumping 100 kW Constant Speed On/Off with Floats With VFD 75 Constant Wet Well Level - Power at ADF
Hours per Day On 10.35 On Peak Hours Weekday 86.25 On Peak kW 7.65 Off Peak Hours Weekday 63.75 Off Peak kW
18 Off Peak Hours Weekend 90 Demand kW Hours per Day On 60 On Peak Hours Weekday per Month
Cost per Month $1,335 On Peak 108 Off Peak Hours Weekday per Month $958 Off Peak
$1,500 Demand Cost per Month $1,335 On Peak Total Cost per Month $3,793 $888 Off Peak
$1,350 Demand
Cost per Year $45,516 Total Cost per Month $3,573
Cost per Year $42,880
Savings $2,636 per Year Installed Cost VFD $7,500 150 hp Payback 2.8 years
• Example using actual power cost:
• There is a cost savings, even if there isn’t an energy savings.

Problems With Using Composite Rates
• OK for facilities with simple rates like pump stations
• OK for quick “back of the envelope” type checks
• Misses some savings opportunities
• May misrepresent actual savings
– Demand
– On Peak Reductions
• Can’t represent savings from some operational changes
– Scheduling equipment alternation and side streams for off peak times
• Some utility incentives are based on demand savings
9:20 AM Wastewater Energy Evaluations 15

Don’t Just Go By the Numbers In Setting Priorities
9:20 AM Wastewater Energy Evaluations 16
• Non-financial factors go into selecting which ECM (Energy Conservation Measure) to implement first
• Simple payback is not the only factor for consideration
• Process considerations must be included
– They didn’t build the plant to save energy!
– Often improved energy performance results in improved process performance
• Judgement, operator preference, and experience must be included in decisions

Don’t Just Go By the Numbers In Setting Priorities
9:20 AM Wastewater Energy Evaluations 17
• Some operational changes can be implemented quickly for low or no capital investment
• Low capital cost projects may be of special interest if there isn’t a capital improvements budget
– Many operational changes fall into this category
– Such as taking tanks out of service
– Such as changing control set points
• Projects with short implementation time can “kick start” an ECM program
– Savings can be used to finance other ECMs
– Success promotes acceptance of other projects
Don’t Just Go By the Numbers In Setting Priorities
9:20 AM Wastewater Energy Evaluations 18
• Projects with high total savings potential may be initiated early
– May take long time for approval and implementation
• Multiple projects can be implemented at once
– Caution: don’t get overextended
• Some projects may be needed to fully utilize savings from others
– Example: blower upgrade may be needed to achieve savings from diffuser replacement

Don’t Wait For Next Major Upgrade To Implement ECMs
9:20 AM Wastewater Energy Evaluations 19
• May result in years of lost potential savings
– Design and construction phases for upgrades generally spans several years
– If the ECM has one or two year payback it could provide a return before the upgrade is in place
– Upgrades and permit changes may change and delay implementation further
• May result in lower or no incentives as utility emphasis changes
– Incentives change as program funding levels change
– Incentives change as ECM technology becomes common
– Example: Energy efficient motors

Don’t Wait For Next Major Upgrade To Implement ECMs
9:20 AM Wastewater Energy Evaluations 20
• ECMs may be cut from project based on total capital expenditure
– Especially if bonding or financing is limited
• Upgrades are usually process / permit driven – energy won’t be a priority
• The design engineer may be a process expert but not an energy expert
– May not understand or include potential ECMs
– May not do evaluation correctly

Don’t Use Motor Nameplate Power
9:20 AM Wastewater Energy Evaluations 21

Don’t Use Motor Nameplate Power
• Motors do NOT push power into loads
– The rated power of a motor designates the upper limit of design load power
– A motor doesn’t produce that power unless the load demands it
• Loads pull power from motors
• For example, if I put a bathroom fan impeller on a 300 hp motor, will it draw 300 hp?
9:20 AM Wastewater Energy Evaluations 22

Don’t Use Motor Nameplate Power • Pump example: 600 gpm, 22 ft. head, 65% pump efficiency
• The designer would probably specify a 7-½ hp motor.
• If nameplate power is used the error will be 46%
9:20 AM Wastewater Energy Evaluations 23

Don’t Use Motor Nameplate Power
• Motor nameplate value is the rated output power at the motor shaft
• This doesn’t include the electrical losses in the motor
• You pay the electric company for power into the motor
• Example, direct nameplate conversion vs. actual power at 92% motor efficiency:
9:20 AM Wastewater Energy Evaluations 24

Don’t Use Design Point Performance • Operations and maintenance manuals usually include performance data and power requirements at the specified design point
• Process equipment rarely, if ever, operates at the design conditions
– Plants are designed for 20 year life, design point is usually at projected requirements 20 years into the future
– Design point is usually at the worst case operating conditions expected
– Highest anticipated hydraulic loading
– Highest anticipated organic loading
– Highest anticipated pressures
– Highest (or lowest) anticipated temperatures 9:20 AM Wastewater Energy Evaluations 25

Don’t Use Design Point Performance • There are many reasons process equipment actually operates below the design point conditions
• Actual loads are below 20 year expectations
– The EPA estimates that most municipal WWTPs are operating at 1/3 of design
– This is consistent with my observations
9:20 AM Wastewater Energy Evaluations 26
Don’t Use Design Point Performance • Design loads are for worst case conditions
– Rain events (especially for pumping)
– Peak diurnal flow rate or organic load
– Fouled piping (especially for force mains)
– Highest back pressure
– Highest anticipated air temperatures (especially for aeration)
– Lowest anticipated air temperatures (especially for HVAC)
9:20 AM Wastewater Energy Evaluations 27

Don’t Use Design Point Performance
• Rain events skew design point compared to normal operation
– Flow may be more than four times ADF (Average Daily Flow)
– For many plants pumps and lift stations are controlled by float switches, so they only operate a few minutes each hour
– You must include actual hours of operation in evaluations
– The first flush may create short term organic loads at the aeration system
– Many plants shut down equipment or aeration to minimize solids washout
9:20 AM Wastewater Energy Evaluations 28

Don’t Use Design Point Performance
• Peak flow during normal dry weather diurnal variations is typically six hours per day (≈ 25% of the time)
– Equipment is sized for several times actual dry weather flows
– ADF is typically 80% of peak and 25% of design point
– For much of the day (≈ 30% of the time) actual hydraulic and organic loading is less than the ADF
• Pressure drops in piping are based on worst case conditions
– Fouled piping: Δp may be 50% higher than in clean piping
– For blowers design is typically based on fouled diffusers
– Max flow rates and velocities: Δp varies with q2
– Half the flow = ¼ the Δp
9:20 AM Wastewater Energy Evaluations 29

Don’t Use Design Point Performance • High estimated design temperatures affect aeration in multiple ways
– OTE (Oxygen Transfer Efficiency) is lowest at high mixed liquor temperature, requiring maximum air flow or max mechanical aerator power to meet O2 demand
– Because air density is less, high air temperatures mean higher volumetric air flow and higher power
– For centrifugal blowers pressure capability is reduced at higher air temperatures, meaning faster speed and higher power
– I generally use average annual air temp and mixed liquor temp for analysis
• Heating systems are designed for worst case ambient temperatures - units only operate a fraction of the day
9:20 AM Wastewater Energy Evaluations 30

Don’t Use Average Conditions for Final Analysis
9:20 AM Wastewater Energy Evaluations 31
A statistician is a man who drowns in a river whose average depth is three feet.

Don’t Use Average Conditions for Final Analysis
9:20 AM Wastewater Energy Evaluations 32
• Averages are fine for initial go/no-go estimates
• Using average temperatures for air and mixed liquor is OK
• Using average hydraulic and organic loading for energy evaluations will neglect key factors
– The impact is similar to using composite power rates
• Using averages is OK if more accurate data isn’t available
• Using averages is OK if loading is fairly constant or controllable
– Not common in wastewater treatment

Don’t Use Average Conditions for Final Analysis
9:20 AM Wastewater Energy Evaluations 33
• Average loading will miss the impact of on peak power rates
• Average loading will miss the impact of demand rates
• Note that many utility incentives are based on reduction in demand
• For the “average” WWTP:
– Loading during off-peak hours is approximately 85% of ADF
– Loading during on-peak hours is approximately 115% of ADF
– Peak demand load is approximately 120% of ADF
• Loads that are impacted by rain events or industrial slugs should include them in evaluating their effect on peak demand charges
Don’t Use Average Conditions for Final Analysis
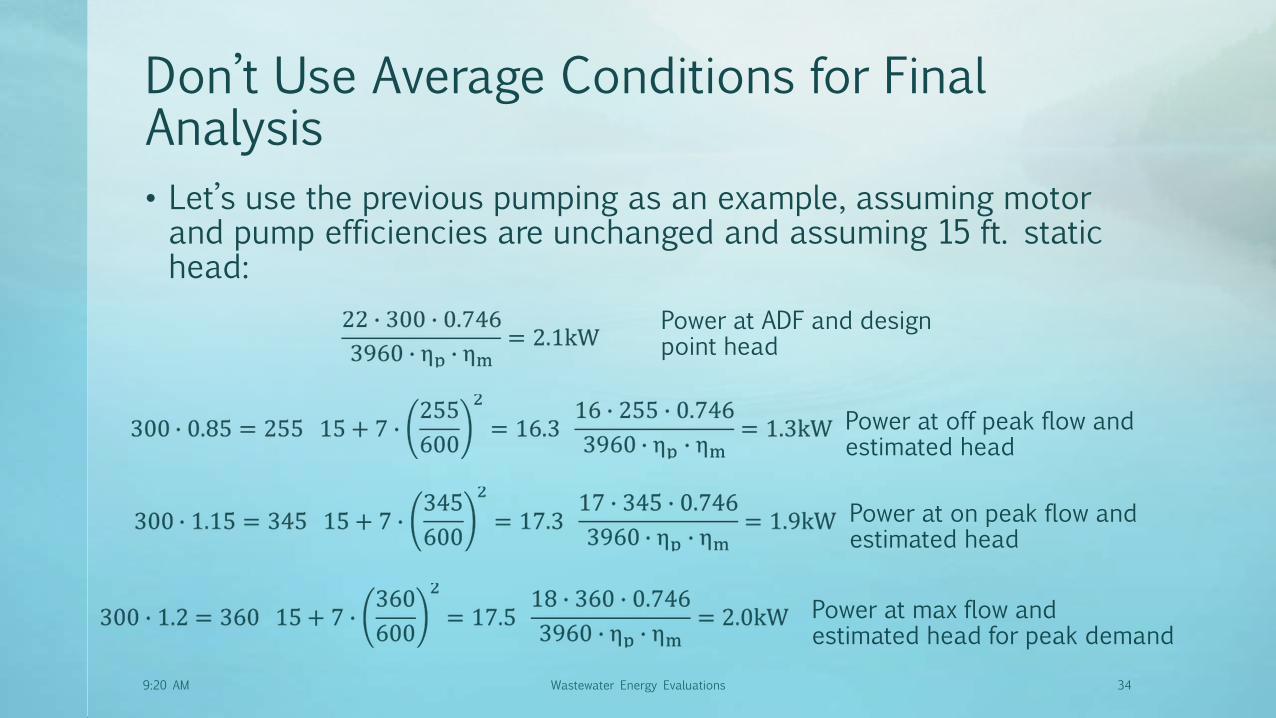
9:20 AM Wastewater Energy Evaluations 34
• Let’s use the previous pumping as an example, assuming motor and pump efficiencies are unchanged and assuming 15 ft. static head:
Power at ADF and design point head
Power at off peak flow and estimated head
Power at on peak flow and estimated head
Power at max flow and estimated head for peak demand

Don’t Use Average Conditions for Final Analysis
9:20 AM Wastewater Energy Evaluations 35
• Let’s use the previous pumping as an example, assuming motor and pump efficiencies are unchanged and assuming 15 ft. static head:
Power at ADF and design point head
Power at off peak flow and estimated head
Power at on peak flow and estimated head
Power at max flow and estimated head for peak demand

Don’t Use Average Conditions for Final Analysis
9:20 AM Wastewater Energy Evaluations 36
• Let’s use the previous pumping as an example, assuming motor and pump efficiencies are unchanged and assuming 15 ft. static head:
Power at ADF and design point head
Power at off peak flow and estimated head
Power at on peak flow and estimated head
Power at max flow and estimated head for peak demand

Don’t Use Unnecessary Levels of Detail in Analysis
9:20 AM Wastewater Energy Evaluations 37
• Loads are estimated based on “best available data”
– Hydraulic
– Organic
– Then rounded up
• Evaluation points are selected based on available data and engineer’s judgement
– Accuracy varies with plant’s historical data collection
– Every year will be different!
– Every day will be different!
– Accuracy of measurements may be questionable
– Calibration, installation, maintenance, etc.
Don’t Use Unnecessary Levels of Detail in Analysis
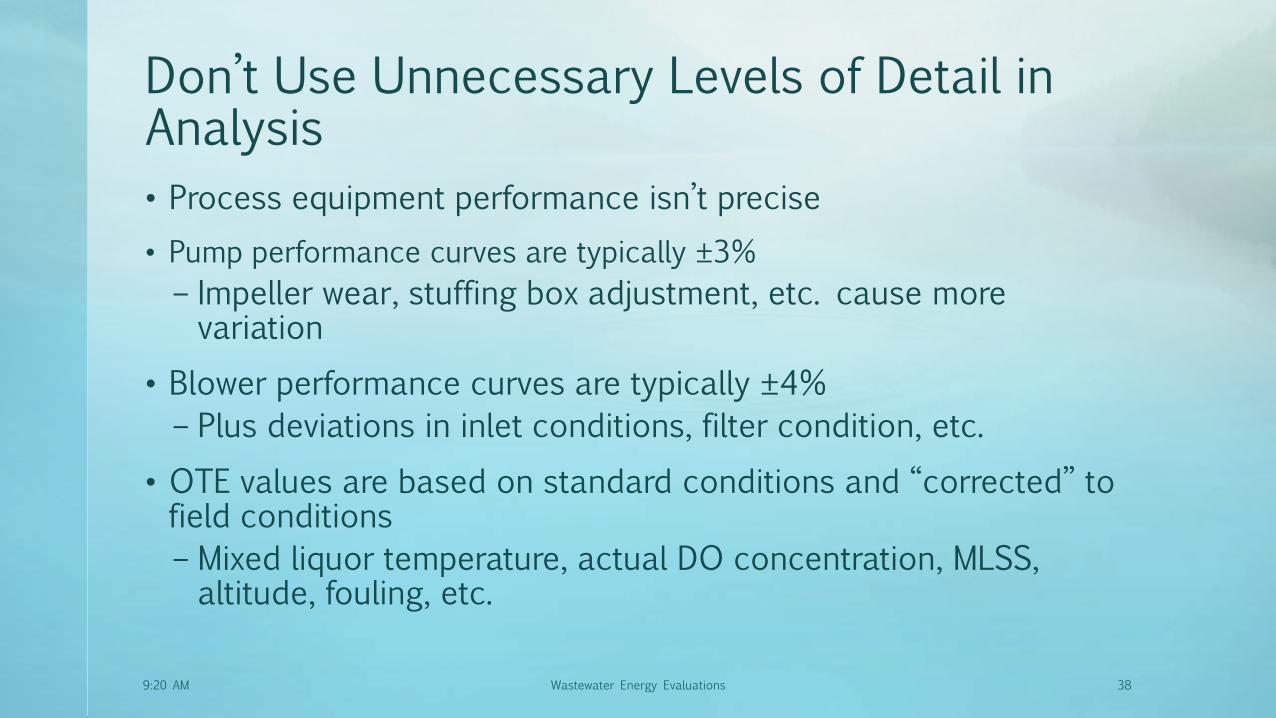
9:20 AM Wastewater Energy Evaluations 38
• Process equipment performance isn’t precise
• Pump performance curves are typically ±3%
– Impeller wear, stuffing box adjustment, etc. cause more variation
• Blower performance curves are typically ±4%
– Plus deviations in inlet conditions, filter condition, etc.
• OTE values are based on standard conditions and “corrected” to field conditions
– Mixed liquor temperature, actual DO concentration, MLSS, altitude, fouling, etc.

Don’t Use Unnecessary Levels of Detail in Analysis
9:20 AM Wastewater Energy Evaluations 39
• Don’t try to include every possible factor in the evaluation
– Just “impressing yourself”
– Only include factors with significant and predictable effect on system energy requirements
• Your PC will calculate a SWAG* value to 15 decimal places – you don’t need to use all of them
• Example from previous pump analysis:
*SWAG = Scientific Wild Ass Guess
Not much difference This is an estimate anyway!

Thank you to

Thank you for your attention and attendance!
The presentation is available from Wisconsin
Wastewater Operators’ Association: www.wwoa.org
Feel free to contact them for additional information
4:00