how many brass bands - ibew many brass bands.pdf · the brass band movement will grow, and this...
TRANSCRIPT

1
How Many Brass Bands? – An analysis of the distribution of bands in Britain and Ireland over the last 200 years Gavin Holman – March 2018 There have been many estimates of the number of brass bands over the years. These have ranged widely and, in most cases, were greatly exaggerated. My research to date has identified nearly 20,000 distinct brass bands which existed in the British Isles between 1880 and the present. This is not a final figure and, although there are many bands still to unearth, I would be surprised if there were more than 2,000 to 3,000 to be added, based on my research experiences. During my research for “Brass Bands of the British Isles”, the start and end dates for each band was identified – wherever possible. In many cases there were no definitive such dates, so the earliest/latest recorded were used. In the absence of either of the latter, an estimated date was taken. The largest number of bands concurrently active in the British Isles was 5,045 in 1895. Looking at the bands across the decades, again the 1890s top the table with 7,321 distinct bands active through those ten years. An interesting future exercise would be to look at the detailed breakdown of the different types of brass band (i.e. town/village, industrial (colliery/mill etc), religious, temperance etc.). Unfortunately, the wide variation of the names of bands precludes any straightforward, accurate method of analysis at present. However, an extraction using a few keywords gave the following, very rough, figures: temperance bands – 1,210, colliery bands – 415, iron/steel works – 125, volunteer bands – 695, oddfellows – 61, foresters – 135, Wesleyan/Methodist – 312, Baptist – 28, railway – 144, mills – 103. This paper looks at
• the chronological distribution of bands across the various decades, in total, for each country and each county (see appendix 8)
• the ratio of bands per 10,000 population – based on figures from census data for years 1881 and 1901, and a similar exercise for current bands
• graduated maps showing the “band density” across the countries for total number of bands and the per capita ratios for the counties
• a list of the earliest bands (from 1800 to 1829)

2
Caveats and assumptions
• the number of bands recorded in “Brass Bands of the British Isles” is certainly not definitive - by some unknown margin. As research continues, more records become digitised and searchable, our knowledge of the breadth and depth of the brass band movement will grow, and this analysis is merely a snapshot in time – but hopefully a lot more accurate than many of the estimates and assumptions over the years.
• types of bands excluded from “Brass Bands of the British Isles”, and therefore not counted, include: Salvation Army bands (the majority), military/brass & reed bands, youth & junior bands, scratch bands (one off’s), and ghost bands.
• the actual formation and cessation dates for many of the bands are not known. The dates used are those available in contemporary records, indicating a minimum span for the band’s activity. As a result, the number of bands in any one year or period will be greater than the figures given here.
• due to the nature of the information available about many of the bands, and the different names by which they were known or referred to, it is not clear in some cases whether band X is actually the same as band Y (with similar names etc.) or if, in fact they were truly distinct. I estimate perhaps 2% to 5% of the bands fall into this category, so any figures should be viewed with that in mind (and be adjusted downwards if so desired!).
• Where only a single date for a band is recorded, I have added an extra two years to the figures, on the assumption that, in most cases, the bands will have existed for at least that length of time.
• Where records give only a vague date for a band, e.g. “in the 1850s”, an educated guess has been taken for an actual figure to use. In some cases this was relatively straightforward, based on other supporting information and context. Where none was available, I used an early date (e.g. 1850 for “the 1850s” when assessing the earliest appearance of a band), and a late date (e.g. 1859 for “the 1850s” when assessing the latest appearance of a band).
• It is assumed that where a band is recorded as still being active in the 1910s then, in most cases, it will have ceased in or around 1914 rather than continuing through to 1919 – very few bands have documented activity during WW1.
• The county locations of the bands are those of the historical counties of Great Britain (for further details see www.county-wise.org.uk), and those of Ireland.
• The “Islands” include the Isle of Man and the Channel Islands – Isle of Wight is included in Hampshire when appropriate. Shetland and Orkney are individual Scottish counties.
• Population data for the various counties, to give relative sizes, for the total number of bands is taken from the 1881 census for England, Scotland and Wales. Due to the destruction of the equivalent records for Ireland, I have used

3
the Irish 1901 census data. For the distribution of current brass bands, I used a range of recent population sources, making educated guesses where the current administrative areas no longer matched the historical counties within which the bands were placed. In all cases the data is merely used to give a range of values to indicate density, and strict accuracy is unnecessary.
• In the population comparisons the City of York, being separate to the three Ridings of Yorkshire, has been included in the figures for the West Riding; the Isle of Wight has been included with Hampshire, and the Channel Islands and Isle of Man have been excluded; London and Middlesex have been combined; Dun Laoghaire and Fingal have been included in Dublin.
• There are some 40 bands for which there is no information at present, other than the fact of their existence, or for which no dates are available – these have been excluded from the date analyses.
• The figures in appendices 3 to 7 may not entirely match equivalent figures in the full table, appendix 8, due to conflation of some data between counties.
1800 – 2018 Current Total bands 19,634 1,234 England 15,588 981 Scotland 1,350 93 Wales 1,239 87 Northern Ireland 531 41 Eire 872 24 Islands 54 8

4
The rise and fall of brass bands across the years The factors which led to the rapid increase in the number of brass bands in the 19th century - which included the industrial revolution, the advent of saxhorns, increasing leisure time, growing philanthropy, and appetites for public entertainment – culminated in the mid-1890s. At that point, which may have been a saturation level of various factors, there began a decline. Although my figures show a sharp decline across the early 1900s, I suspect this is largely due to the lack of information about many bands, and though many will probably have continued through to WW1, I did not make that assumption in the data. As a result, I would propose that a more accurate representation would show a gradual decline from 1895 through to 1914, and then a much heavier loss of bands than these figures show, following many of the bandsmen signing up to join the armed forces. A small recovery in the number of bands took place immediately after WW1, as soldiers returned and communities started to rebuild. A similar drop in bands occurred during WW2, but there was not a corresponding recovery once the war ended – new bands did get established, but there were significantly fewer than those formed after WW1. An interesting point is that the number of bands since the early 1960s appears to have been relatively static. Despite a general feeling that the decline over the years continued apace, it seems to have levelled off.
0
1,000
2,000
3,000
4,000
5,000
6,000
18
01
18
08
18
15
18
22
18
29
18
36
18
43
18
50
18
57
18
64
18
71
18
78
18
85
18
92
18
99
19
06
19
13
19
20
19
27
19
34
19
41
19
48
19
55
19
62
19
69
19
76
19
83
19
90
19
97
20
04
20
11
20
18
Bands active in each year

5
The distribution of brass bands across the land The industrial heartlands of Yorkshire and Lancashire have always produced the largest
number of brass bands – and this is still the case today. Other areas, particularly those with
large mining and mill industries, such as Durham, Glamorgan, Cheshire, Derbyshire,
Staffordshire, also had a more significant number of bands. However, the southern counties
were not left out of the brass band explosion in the mid to late 19th century, with the south west
and south east both generating large number of bands. These tended to be less associated with
heavy industry, being town/village bands or being aligned with light industries, church and
temperance societies.
0
1,000
2,000
3,000
4,000
5,000
6,000
7,000
8,0001
80
0
18
10
18
20
18
30
18
40
18
50
18
60
18
70
18
80
18
90
19
00
19
10
19
20
19
30
19
40
19
50
19
60
19
70
19
80
19
90
20
00
20
10
Bands active in each decade

6
This first map shows the number of bands in existence in each county between 1800-2018

7
This map shows the ratio of bands in existence in each county between 1800-2018 compared
with the county populations in the late 19th century
8
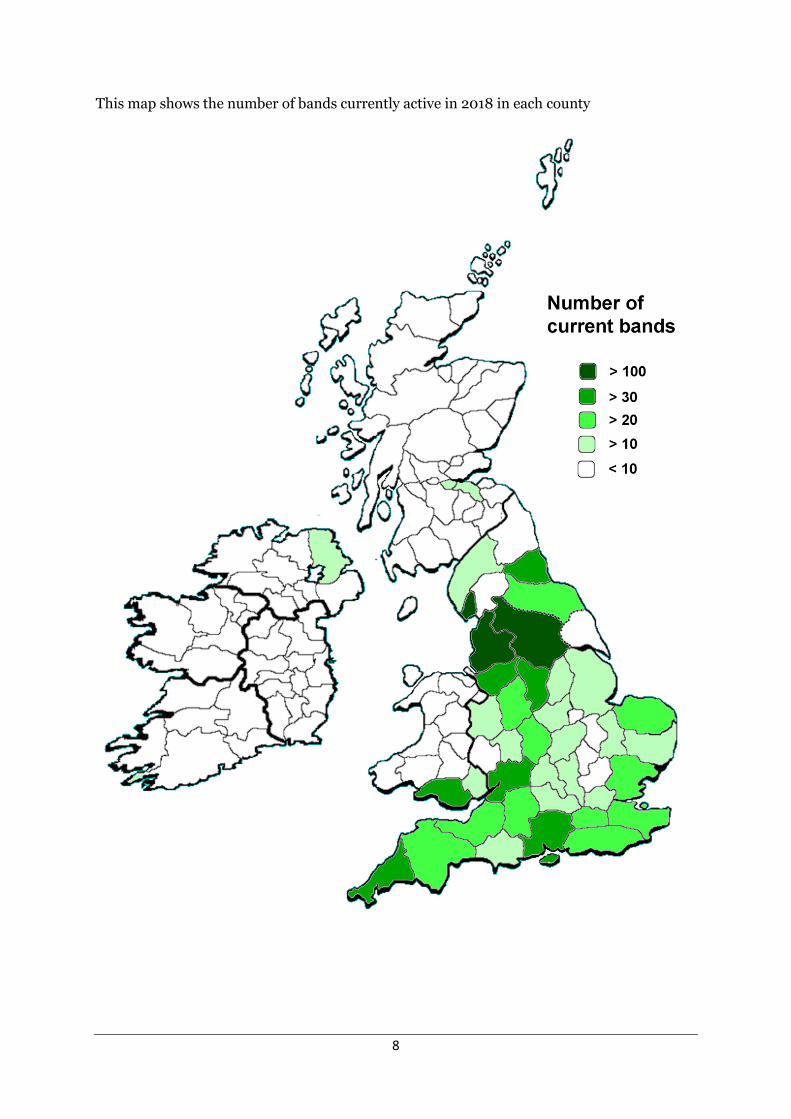
This map shows the number of bands currently active in 2018 in each county

9
This map shows the ratio of current bands in each county compared with the latest county
populations

10

11
Some years ago I carried out a similar exercise on “band density” on the U.S.A., working with a significantly smaller set of data, based on the photographs and postcards of bands in the IBEW “Vintage Band Pictures”, dating largely from the 1890 to 1920 period. Following the production of my upcoming “Brass Bands of the World”, later in 2018, I would hope to update these distribution maps accordingly.

12
Appendix 1
Year # bands Year # bands Year # bands Year # bands
1801 1 1856 1,291 1911 2,842 1966 1,271
1802 1 1857 1,425 1912 2,807 1967 1,280
1803 1 1858 1,513 1913 2,789 1968 1,279
1804 1 1859 1,600 1914 2,786 1969 1,291
1805 1 1860 2,108 1915 2,261 1970 1,292
1806 1 1861 2,194 1916 2,108 1971 1,302
1807 1 1862 2,387 1917 2,092 1972 1,318
1808 2 1863 2,509 1918 2,095 1973 1,328
1809 3 1864 2,593 1919 2,152 1974 1,343
1810 4 1865 2,726 1920 2,441 1975 1,368
1811 4 1866 2,700 1921 2,428 1976 1,353
1812 5 1867 2,731 1922 2,428 1977 1,363
1813 5 1868 2,740 1923 2,424 1978 1,366
1814 5 1869 2,817 1924 2,435 1979 1,384
1815 7 1870 2,853 1925 2,434 1980 1,358
1816 7 1871 2,888 1926 2,401 1981 1,359
1817 8 1872 2,906 1927 2,408 1982 1,372
1818 10 1873 2,941 1928 2,409 1983 1,378
1819 12 1874 3,041 1929 2,395 1984 1,380
1820 15 1875 3,222 1930 2,281 1985 1,393
1821 17 1876 3,262 1931 2,265 1986 1,352
1822 17 1877 3,357 1932 2,258 1987 1,360
1823 18 1878 3,431 1933 2,256 1988 1,363
1824 19 1879 3,503 1934 2,259 1989 1,370
1825 20 1880 3,706 1935 2,264 1990 1,255
1826 21 1881 3,781 1936 2,230 1991 1,245
1827 23 1882 3,863 1937 2,231 1992 1,246
1828 26 1883 3,919 1938 2,218 1993 1,249
1829 29 1884 4,122 1939 2,231 1994 1,252
1830 54 1885 4,322 1940 1,599 1995 1,253
1831 54 1886 4,334 1941 1,579 1996 1,233
1832 59 1887 4,454 1942 1,578 1997 1,240
1833 67 1888 4,484 1943 1,582 1998 1,236
1834 74 1889 4,545 1944 1,587 1999 1,235
1835 90 1890 4,847 1945 1,628 2000 1,236
1836 92 1891 4,940 1946 1,613 2001 1,227
1837 103 1892 4,983 1947 1,608 2002 1,230
1838 120 1893 5,021 1948 1,619 2003 1,234
1839 130 1894 4,986 1949 1,616 2004 1,237
1840 285 1895 5,045 1950 1,643 2005 1,228
1841 288 1896 4,857 1951 1,614 2006 1,208
1842 306 1897 4,758 1952 1,617 2007 1,219
1843 323 1898 4,628 1953 1,600 2008 1,222
1844 342 1899 4,628 1954 1,599 2009 1,227
1845 389 1900 4,925 1955 1,601 2010 1,224
1846 388 1901 4,817 1956 1,553 2011 1,218
1847 412 1902 4,859 1957 1,539 2012 1,216
1848 418 1903 4,705 1958 1,539 2013 1,221
1849 438 1904 4,644 1959 1,540 2014 1,225
1850 853 1905 4,452 1960 1,349 2015 1,232
1851 892 1906 3,863 1961 1,329 2016 1,239
1852 949 1907 3,774 1962 1,329 2017 1,243
1853 1,037 1908 3,656 1963 1,328 2018 1,242
1854 1,088 1909 3,620 1964 1,331 1855 1,240 1910 2,944 1965 1,349

13
Appendix 2
Decade Bands in each decade
1800 1809 3
1810 1819 12
1820 1829 29
1830 1839 136
1840 1849 507
1850 1859 1,988
1860 1869 4,091
1870 1879 4,812
1880 1889 6,571
1890 1899 7,321
1900 1909 6,245
1910 1919 3,269
1920 1929 2,625
1930 1939 2,477
1940 1949 1,794
1950 1959 1,740
1960 1969 1,476
1970 1979 1,472
1980 1989 1,465
1990 1999 1,347
2000 2009 1,327
2010 2019 1,292

14
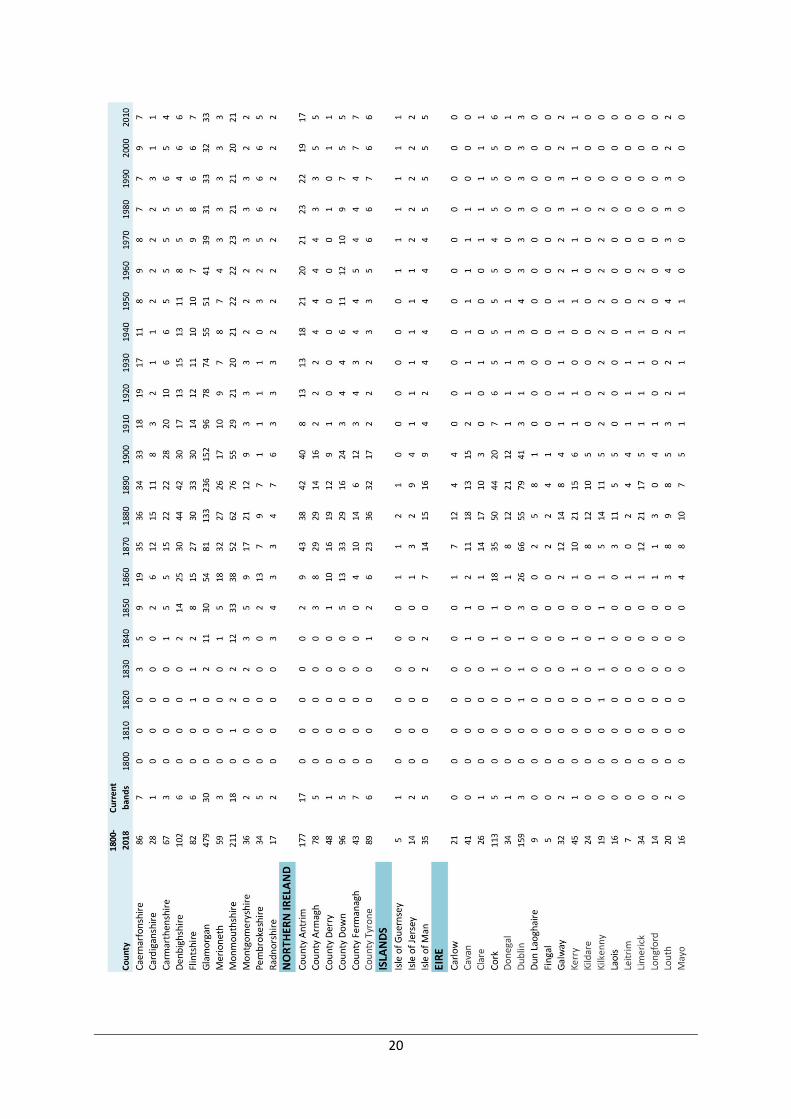
Appendix 3
England
County Total bands
1800-2018
Bands in
2018
Bedfordshire 132 6
Berkshire 185 12
Buckinghamshire 218 13
Cambridgeshire 122 12
Cheshire 433 44
Cornwall 420 46
Cumberland 225 11
Derbyshire 537 39
Devon 446 28
Dorset 207 13
Durham 756 41
Essex 430 24
Gloucestershire 494 40
Hampshire 433 45
Herefordshire 55 1
Hertfordshire 141 9
Huntingdonshire 45 1
Kent 491 23
Lancashire 1,765 105
Leicestershire 301 18
Lincolnshire 363 18
London & Middlesex 698 18
Norfolk 310 20
Northamptonshire 269 16
Northumberland 340 6
Nottinghamshire 316 18
Oxfordshire 216 17
Rutland 12 1
Shropshire 208 13
Somerset 435 26
Staffordshire 574 22
Suffolk 218 19
Surrey 457 21
Sussex 353 23
Warwickshire 346 22
Westmorland 70 6
Wiltshire 281 23
Worcestershire 213 10
Yorkshire (East Riding) 245 8
Yorkshire (North Riding) 338 27
Yorkshire (West Riding) 1,380 116

15
Appendix 4
Scotland
County Total bands
1800-2018
Bands in
2018
Aberdeenshire 86 5
Angus 78 8
Argyllshire 12 1
Ayrshire 109 5
Banffshire 27 2
Berwickshire 15 0
Buteshire 4 1
Caithness 12 0
Clackmannanshire 12 1
Dumfriesshire 25 4
Dunbartonshire 38 6
East Lothian 15 2
Fife 132 8
Inverness-shire 10 0
Kincardineshire 10 0
Kinrossshire 4 0
Kirkcudbrightshire 10 1
Lanarkshire 302 7
Midlothian 101 11
Morayshire 21 2
Nairnshire 3 0
Orkney 4 1
Peeblesshire 7 2
Perthshire 38 4
Renfrewshire 61 4
Ross-shire 16 0
Roxburghshire 24 3
Selkirkshire 9 2
Shetland 5 1
Stirlingshire 83 0
Sutherland 9 0
West Lothian 56 11
Wigtownshire 8 1

16
Appendix 5
Wales
County Total bands
1800-2018
Bands in
2018
Anglesey 20 3
Brecknockshire 18 1
Caernarfonshire 85 7
Cardiganshire 28 1
Carmarthenshire 66 3
Denbighshire 102 6
Flintshire 82 6
Glamorgan 477 30
Merioneth 58 3
Monmouthshire 208 18
Montgomeryshire 35 2
Pembrokeshire 34 5
Radnorshire 17 2
Appendix 6
Northern Ireland
County Total bands
1800-2018
Bands in
2018
County Antrim 153 17
County Armagh 69 5
County Derry 46 1
County Down 84 5
County Fermanagh 36 7
County Tyrone 80 6

17
Appendix 7
Eire
County Total bands
1800-2018
Bands in
2018
Carlow 18 0
Cavan 36 0
Clare 24 1
Cork 93 5
Donegal 32 1
Dublin 164 3
Galway 28 2
Kerry 37 1
Kildare 24 0
Kilkenny 18 0
Laois 14 0
Leitrim 5 0
Limerick 30 0
Longford 9 0
Louth 19 2
Mayo 16 0
Meath 20 1
Monaghan 26 1
Offaly 12 0
Roscommon 19 0
Sligo 17 1
Tipperary 44 1
Waterford 26 2
Westmeath 3 1
Wexford 28 1
Wicklow 24 1

18
Appendix 8 – bands per county per decade

19
20

21

22
Appendix 9
The earliest bands – formed before 1830
Band Current Year
founded
Coxlodge Colliery Brass Band 1808
Stalybridge Old Band * 1809
Brindle Brass Band * 1810
New Mills Band * 1812
Kirkbymoorside Town Brass Band * 1815
Langholm Town Band * 1815
Blaina Brass Band 1817
Besses o' th' Barn Band * 1818
Denton and Haughton Brass Band 1818
Airdrie Union Brass Band 1819
Barrhead Burgh Band * 1819
Cwmbran Brass * 1820
Haverhill Brass Band 1820
Royal Buckley Town Band * 1820
Kirkburton Old Band 1821
Kirkby Lonsdale Brass Band 1821
Stanhope Silver Band * 1823
Chryston Brass Band 1824
Cockermouth Mechanics Band * 1825
Blanchardstown Brass Band * 1826
Barlow Old Brass Band 1827
Haltwhistle Brass Band 1827
Graignamanagh Brass Band 1828
Okehampton Excelsior Silver Band * 1828
Stand Band 1828
Barnard Castle Subscription Band 1829
Duntocher Brass Band 1829
Sanderson's Brass Band (Stoneleigh) 1829