how has economic restructuring affected china’s urban workers?
TRANSCRIPT

THE WILLIAM DAVIDSON INSTITUTE AT THE UNIVERSITY OF MICHIGAN BUSINESS SCHOOL
How has Economic Restructuring Affected China’s Urban Workers?
By: John Giles, Albert Park and Fang Cai
William Davidson Institute Working Paper Number 628 October 2003

How has Economic Restructuring Affected China’s Urban Workers?*
John Giles ([email protected]) Department of Economics, Michigan State University William Davidson Institute, University of Michigan
Albert Park ([email protected])
Department of Economics and William Davidson Institute, University of Michigan
Fang Cai ([email protected]) Institute of Population and Labor Economics, Chinese Academy of Social Sciences
October 2003
Abstract
Using data from the China Urban Labor Survey conducted in five large Chinese cities at year end 2001, we quantify the nature and magnitude of shocks to employment and worker benefits during the period of economic structuring from 1996 to 2001, and evaluate the extent to which adversely affected urban workers had access to public and private assistance. Employment shocks were large and widespread, and were particularly hard on older workers and women. Unemployment reached double digits in all sample cities and labor force participation declined by 8 percent. Urban residents faced modest levels of wage and pension arrears, and sharp declines in health benefits. Public assistance programs for dislocated workers had limited coverage, with most job-leavers relying upon private assistance to support consumption, mainly from other household members. Keywords: labor, unemployment, China, restructuring *The authors acknowledge grants to support field research from Michigan State University (Intramural Research Grants Program), the Chinese Academy of Social Sciences, Ford Foundation, and the University of Michigan (Rackham Faculty Research Grant), and support for follow-up research from the Weatherhead Center for International Affairs at Harvard University (Academy Scholars Program) and the W.E. Upjohn Institute for Employment Research. We thank seminar participants at the University of Michigan, Hong Kong University of Science and Technology, the University of Washington, and Stanford University for helpful comments.

1
How has Economic Restructuring Affected China’s Urban Workers?
1. Introduction
Well into the post-Mao reform era, China’s socialist government maintained a strong
commitment to provide lifetime employment and benefits to urban workers through state-sector
employment. In the late 1990s, however, financial insolvency of many state-owned urban
enterprises led to aggressive enterprise restructuring that has shattered this “iron rice bowl.”
Implicit lifetime employment was replaced by massive layoffs, widespread unemployment,
forced early retirements, and frequent failure to provide promised wage, pension, and health care
benefits. According to government statistics, from 1995 to 2001 the number of workers
employed in the state-owned sector fell from 113 million to 67 million, a decline of 46 million or
40 percent (National Statistical Bureau, 2002). During the same period, employment in the
urban collective sector fell by 18.6 million, or nearly 60 percent.1 Over this same period, 43
million workers were officially registered as laid off, or xiagang, including 34 million from the
state sector (Ministry of Labor, 2002). The adjustments show no sign of letting up in light of
China’s recent entry into the World Trade Organization, which many forecast will cause new
episodes of labor dislocation. How Chinese families and public policies respond to these
challenges will have a major impact on the welfare of millions of Chinese citizens and could
alter the prospects for China’s economic reforms.
Although many have voiced concern about the plight facing China’s urban labor force,
there remains a glaring lack of information on even basic labor market outcomes such as
1Employment in urban collective enterprises peaked in 1991 at 36.3 million, and fell from 31.5 million to 12.9 million from 1995 to 2001. From 1995 to 2001, employment in mixed ownership work units (joint-stock companies, limited liability companies with mixed ownership) increased from 3.2 million to 14.8 million, and this increase was particularly rapid after passage of the new Company Law in 1997. Thus, employment in work-units of other ownership reforms only absorbed a small share of workers laid off from state and collective sectors.

2
unemployment, labor force participation, and retirement, let alone systematic analysis of the
nature of the shocks, their distribution among China’s urban population, or the access of workers
to public and private assistance when experiencing hardship. Part of the problem is the poor
quality of China’s official labor statistics. The official unemployment rate, for example, is not
based on representative sample surveys and includes only registered unemployed workers (less
than 4 percent in 2001). Other available survey data have limited spatial or temporal coverage,
and often do not measure employment and labor force participation in a consistent manner across
regions and time periods.
In this paper, we use newly available survey data from the China Urban Labor Survey
(CULS) directed by the authors at year-end 2001 in five large Chinese cities (Fuzhou, Shanghai,
Shenyang, Wuhan, and Xian) to provide a detailed description of how recent shocks affected
China’s workers during the critical adjustment period from 1996 to 2001. The paper has two
research goals. The first is to assess the extent to which economic restructuring created shocks to
employment and benefits for different demographic groups in urban China, and to describe the
types of workers who were hit the hardest by economic shocks. The second goal is to evaluate
the extent to which adversely affected workers had access to public and private assistance, and to
determine which workers and households were most vulnerable in the face of restructuring.
The paper is organized as follows. In Section 2, we describe the recent restructuring of
urban enterprises, review the existing literature, and raise specific issues of concern. Section 3
describes the CULS survey data. In section 4, we analyze how economic shocks to employment
and to benefits have affected different groups of urban workers. In section 5, we describe
responses to shocks and evaluate the extent to which workers had access to public and private
assistance mechanisms. Section 6 examines subjective welfare assessments to provide further

3
evidence on the vulnerability of different sub-groups of the population to the consequences of
economic restructuring. A final section discusses the implications of our findings.
2. Economic restructuring in urban China
One distinctive feature of China’s economic transition has been the government’s
gradualist approach to reforming state-owned enterprises (SOEs). Under China’s socialist
system, government departments and SOEs provided lifetime employment, housing, health care,
and pensions to a majority of urban workers. Despite the onset of economic reform, this
commitment to safeguarding the welfare of urban workers persisted well into the mid-1990s.
SOEs were not privatized, and unprofitable SOEs were supported by loans from state-owned
banks. During the first half of the 1990s, state employment grew by about two percent per year,
with 1995 being the first year to see no growth in state sector employment (National Statistical
Bureau, 2002).
By the mid-1990s, SOE losses had skyrocketed as productivity gains from
decentralization and reform of managerial decision-making authority were exhausted, incentive
problems associated with public ownership became increasingly apparent, and competition from
the non-state sector intensified. By this time, soft budget constraints and the government’s full
employment goals had led to substantial redundant labor in SOEs (Dong and Putterman, 2001
and 2003; Li and Xu, 2001). The government finally moved forward with extensive enterprise
restructuring as accumulated financial losses of SOEs threatened the solvency of the state-
controlled financial system (Lardy, 1998). In 1994, the government began a policy of privatizing
small and medium SOEs while protecting larger enterprises, or “seizing the large and letting go
of the small” (zhuada fangxiao) (Cao, Qian, and Weingast, 1999). With the passage of the

4
Company Law in 1997, ownership reform began in earnest. The goal was to gradually shift all
enterprises to modern forms of corporate governance with clearly defined shareholding and
boards of directors, shut down unprofitable enterprises, diversify ownership, and de-link the
provision of social services from individual employers by privatizing housing and shifting
responsibility for the provision of health insurance and pensions to city or provincial
governments.
As in other transition economies in Eastern and Central Europe and the former Soviet
Union, restructuring led to widespread labor dislocation, albeit much later in the transition
process. As described above, millions of workers in the state and collective sectors were laid off,
unemployment rates rose into the double digits (Giles, Park, and Zhang, 2003), and many
workers left the labor force. With labor retrenchment inevitable, the least productive workers
may have been most vulnerable to employment shocks. Given their poor human capital due to
both lower education and outdated job skills, older workers may have been particularly hard hit
by the recent changes. Women also may have been targeted for layoff, either because they were
viewed as less productive or less dependent on their jobs for survival. New entrants to the labor
force may have found it difficult to find gainful employment when most companies were
shedding labor. Unfortunately, as noted earlier, there is little information on how different
Chinese workers weathered the era of restructuring.
The differing ability of state-owned enterprises to compete in a market environment also
led to growing inequality in the employment benefits received by workers in different enterprises
as pay, particularly bonuses, and many non-wage benefits became dependent upon the economic
resources of the work unit (Benjamin, Brandt and Yuen, 2001). Anecdotal reports of wage and
pension arrears leading to active protests became increasingly common, and evidence suggests

5
that health insurance coverage of the population declined (Liu, 2000).2 Lacking ability to
enforce high mandated benefit contributions from enterprises, cash-strapped municipal
governments have been unable to shoulder the responsibility for benefit provision or to maintain
equitable access to benefits.
To ease the pain of labor force adjustment, the government established new social welfare
programs. After initial experiments in Shanghai as early as 1993, a special policy to support
newly laid off (xiagang) workers was formally implemented nationwide beginning in 1998.
Intended for permanent workers employed before labor contracting began in 1986 or contract
workers whose jobs were ended before their contracts expired, the policy provided three years of
basic living subsidies, as well as benefits (i.e., health care and pension contributions) based on 60
percent of each worker’s final wage.3 Laid off workers retained formal ties to their former work
units until they found a new job, and were expected to register with newly established
reemployment centers charged with providing skill training and assistance in searching for new
jobs. The xiagang subsidies drew upon unemployment insurance funds as well as central and
local budgetary expenditures and enterprise contributions, and were intended as a temporary
policy to end on January 1, 2001.4 Official documentation of the implementation and history of
the xiagang program, summarized in Zhang (2003), portrays something of a success story; most
workers received mandated benefits and retraining centers had a high success rate with job
referrals. However, our study finds much poorer performance in terms of both benefit coverage
and re-employment. 2See Murphy (2002), Roberts (2002) and Wonacott (2002) for anecdotal evidence of protests caught by the foreign news media in the months just following the CULS. A 1997 survey in 4 cities found that 9 percent of pensioners had arrears (Ge, 1998). A 1998 survey in Beijing, Wuxi, and Zhuhai found that health insurance and pension coverage of current workers was much lower in Wuxi and Zhuhai where the share of workers in collective and private enterprises was much greater (Drury and Arneberg, 2001). 3Benefits often declined over time and subsidies were supposed to be greater than unemployment insurance subsidies. However, actual benefit amounts depended greatly on municipal financial resources. 4In practice, many local governments extended benefits to 2003 (Zhang, 2003).

6
The government also standardized its unemployment insurance program in 1999. The
program is financed by payroll charges and provides subsidies for up to two years depending on
how long the worker and/or the work unit has participated in the unemployment insurance
program. Workers whose three years of xiagang subsidies expired become immediately eligible
for unemployment benefits.
By 1998, most cities also began providing relief through the minimum living standard
program (MLSP) to households whose income per capita fell below designated urban poverty
lines. The MLSP was administered in a relatively ad hoc fashion, lacking standardized poverty
lines, funding support, administrative apparati, or supervision. Central government financing
began in 1999 and expanded significantly in 2001, when expenditures reached 542 million yuan
and the number of beneficiaries reached 1.17 million (Zhang, 2003).
Given that similar structural adjustments occurred in other transition economies, it is of
interest to compare China’s labor adjustment experience with the far from uniform experiences
of countries in Central and Eastern Europe and the former Soviet Union. Many countries in
Central and Eastern Europe saw large employment declines along with moderate reductions in
real wages, while countries in the former Soviet Union were more likely to witness smaller
employment declines and larger wage adjustments (Boeri and Terrell, 2002). Boeri and Terrell
(2002) argue that generous non-wage employment benefits in Central and Eastern Europe acted
as a wage floor that made employment adjustment inevitable, and that this, in turn, facilitated
downsizing of inefficient SOEs but may have led to higher persistent unemployment.
Unemployment rates reached double digits in nearly all transition countries. Some transition
countries also experienced substantial wage and pension arrears, notably Russia where 34
percent of pensioners reported serious arrears (Jensen and Richter, forthcoming). As in China,

7
generous benefit programs for dislocated workers were initially established and gradually
reduced (Boeri, 2000). Interestingly, a substantial part of the large employment fall in transition
countries was in the form of voluntary quits rather than forced departures, which brought labor
force participation rates down from their abnormally high rates at the outset of reform (Boeri and
Terrell, 2002; Boeri, 2000).
3. The China Urban Labor Survey
The China Urban Labor Survey (CULS) was conducted at year-end 2001 by the Institute
for Population and Labor Economics at the Chinese Academy of Social Sciences (CASS-IPS),
working with provincial and municipal government statistical bureaus. The authors collaborated
in the design and execution of the survey.
The CULS was conducted in five cities: Fuzhou, Shanghai, Shenyang, Wuhan, and Xian.
The cities were chosen to provide regional diversity and variation in the size of the state versus
private sectors. Fuzhou and Shanghai are coastal cities that have enjoyed outstanding economic
performance throughout the reform period, while Shenyang in the northeast, Wuhan in central
China, and Xian in northwest China are interior cities with large, struggling state industrial
sectors that have experienced more painful restructuring. Summary data on each of the five
cities are provided in Table 1. Three of the cities are among China’s six largest cities by
population, and another ranks tenth. Ranked by GDP per capita or by mean wages, the ordering
of cities from richest to poorest is Shanghai, Fuzhou, Shenyang, Wuhan, and Xian. Summary
statistics for the pooled sample employ weights based on the sampling rate in each city as well as
the number of adults in each individual’s household (the CULS surveyed a representative sample
of households, not individuals, in each city). Thus, Shanghai receives a relatively large weight

8
because of its large population. Roughly half of the weighted sample comes from the two coastal
cities, and half from the three interior cities.
Within each city, a proportional population sampling approach was used to sample an
average of 15 registered urban households in each of 70 neighborhood clusters.5 Each household
head was asked questions about the family, and then all family members above age 16 who were
no longer in school were interviewed individually. We conducted surveys in 3499 households
(700 in each city), and completed surveys of 8109 adults over age 16. At the time of the survey,
5787 adults were under mandatory retirement age and 4238 were currently employed. The
survey had a non-response rate of 16.5 percent, of which 6.5 percent of households could not be
found, 4.9 percent had moved, and 5.1 percent refused to be interviewed.6
In this paper, we study individuals living in households with local urban permanent
residence permits only, and do not consider those with temporary residence permits or with no
registration status, a group consisting primarily of rural migrants. China maintains a household
registration (hukou) system that determines access to employment and many social services and
benefits. Our goal is to study how recent changes have affected urban workers previously
protected under the socialist system, making the focus on urban registered households
5Local statistical bureau offices assisted in developing sample frames and in providing local enumerators and supervisors who were trained and monitored by the project research team. The sampling had three stages. The November 2000 population census data was used to sample neighborhood clusters. In the first stage, neighborhoods (jiedao) in a city were chosen. All neighborhoods were listed with their population size, a sampling distance was calculated by dividing the total population of the city by the number of neighborhoods to be chosen, a starting point was chosen randomly, and each sampled neighborhood was selected based on the sampling distance. Using the same procedures, in stage two, communities (shequ), previously known as residents’ committees (juweihu), were chosen within each neighborhood, and in stage three, registered urban households were selected using sampling frames constructed from household lists provided by community offices at the time of the survey. An average of 10 households in each community were chosen to be interviewed, and an additional 5 were selected to be available for interviews in cases of non-response. 6This refusal rate compares favorably with the first round refusal rates of two influential surveys from transition and developing countries: the Russian Longitudinal Monitoring Survey (RLMS) and the Indonesia Family Life Survey (IFLS).

9
appropriate.7 In the 2000 Population Census, registered urban households comprise 76 percent
of those living in the five sample cities.
The CULS includes individual calendar-based work histories with detailed questions
about job changes, transitions to unemployment or retirement, changes in pension, health care,
and housing benefits, and access to government programs since January 1996.8 Like many
multi-purpose household surveys, it also includes a battery of questions on work status, income,
expenditure, housing and consumer durables, productive assets and wealth, health, and
household demographics.
4. Economic shocks in urban China
A. Trends in employment status
We begin by examining key work status outcomes for different demographic groups over
time. Specifically, we look at trends in the unemployment rate (UR), the labor force
participation rate (LFPR), and the employment rate (ER). We count as unemployed those who
report that they were not working at a particular time and who looked for work during the same
non-working spell.9 Individuals in the labor force are those who were working (employed) or
not working but looking for work (unemployed). The UR is the share of the labor force that is
unemployed, the LFPR is the share of all working-age adults who are in the labor force, and the
ER is the share of all working-age adults who are employed. These definitions imply the
following identity: ER = (1-UR) LFPR. One common measurement challenge is distinguishing
whether an individual is unemployed or out of the labor force, which can depend on the 7The CULS included a separate survey of migrants, but the data from that survey is not used in this study. 8English language translations of the CULS instruments can be found at: http://www.msu.edu/~gilesj/ 9This definition of the unemployment rate is not fully consistent with ILO standards, which, for example, is based on job search activity in the past 30 days. Our measure is likely to slightly overstate the true unemployment rate if calculated according to the ILO definition (Giles, Park, and Zhang, 2003).

10
definition of what constitutes job search. Also, some respondents, particularly older workers,
may be embarrassed to admit their inability to find work, feel discouraged from job search, or
ex-post rationalize their current work status, and so report themselves as out of the labor force
rather than unemployed.
The three work status measures are calculated for each month from January 1996 to
November 2001 based on retrospective work histories of urban residents interviewed in late
November and December 2001. Our calculations assume that recall is accurate and that those
interviewed in 2001 are representative of the labor force in earlier years. There could be bias in
earlier years if the number of deaths and departures from the city are significant and non-random,
but we do not expect such bias to be large.10 Also, because the CULS sample frame excludes
students in school who have never entered the labor force, we use the same criteria to adjust the
samples reconstructed for previous periods. This does not affect unemployment rates but does
create an upward bias in measured LFPR and could understate decreases in LFPR if the share of
adults in school increases over time.
Overall trends for UR, LFPR and ER are presented in Figure 1, which also plots trends by
gender. Table 2 reports UR and LFPR for the initial and ending months of the survey recall
period. From January 1996 to November 2001, the UR for working-age adults (those aged 16 to
60) increased from 7.2 to 12.9 percent, the LFPR fell from 82.7 to 74.5 percent, and the ER fell
from 77.0 to 64.8 percent. Looking at the breakdowns by gender, we find sharper increases in
UR and sharper declines in LFPR for women than for men. At the beginning of the recall period,
the unemployment rate already was higher for women (8.2 percent) than men (6.3 percent). By
10We may underestimate earlier unemployment and overestimate the LFPR if non-working adults were more likely than working adults to migrate or die. However, migration of urban residents is sharply circumscribed by China’s residential registration system, and it is also possible that migrants are more likely to be those with more skills and job opportunities elsewhere, which would reverse the direction of bias. In any case, migration and mortality rates in urban China do not appear to be high enough to explain the dramatic trends that we observe.

11
the end of the period, women’s UR jumped by 6.7 percent to reach 14.9 percent, while men’s UR
rose by 5.1 percent to reach 11.4 percent. The scale of female exit from the labor force further
underscores the differential impact that transition had on women. Over the recall period, the
LFPR of working-age women fell by 10.6 percent, from 73.4 percent to 62.8 percent, while that
of men declined by 6.9 percent, to 85.7 percent in November 2001.
Next, we examine trends in work status by demographic group (Figures 2 and 3, Table 2).
Employment shocks, as measured by increased unemployment or departures from the labor
force, appear to be greatest for older workers approaching mandatory retirement age (60 for men,
55 for women) and for older workers. For men, the rise in UR is greatest for those aged 50 to 55
(from 2.5 percent to 11.5 percent), followed by those aged 40 to 50 (from 3.9 to 10.4 percent).
The UR was also high and increasing fast for young men in the 16 to 30 age group, rising from
12.9 to 18.3 percent. For women, the increase in UR also was largest for older workers,
remarkably more than tripling from 4.6 percent to 17.2 percent for those aged 40 to 50. In
contrast, the UR actually fell slightly for women aged 16 to 30 (14.3 to 13.2 percent).
Decreases in labor force participation were most pronounced for individuals approaching
mandatory retirement age, and likely reflect aggressive use of early retirement to reduce payrolls
in state sector enterprises. For men near retirement (aged 55 to 60), the LFPR fell by a
remarkable 20 percent, from 76.4 to 56.4 percent, and the decline also was substantial for those
aged 40 to 50 (96.9 to 89.0 percent). The LFPR of both young men and women (aged 16 to 30)
changed little. The decline in the LFPR of women was greatest for older cohorts, falling from
81.5 to 66.7 percent or (a decline of 14.8 percent) for women aged 40 to 50, and from 42.3 to
33.4 percent for those near mandatory retirement age (aged 50 to 55).
Overall, from January 1996 to November 2001, older workers (those over 40)

12
experienced the most severe employment shocks. For both men and women, those aged 40 to 50
witnessed the largest increase in the UR and for women, this group also experience the greatest
decline in the LFPR. Those near retirement age, especially men, also stopped working in large
numbers, mainly through departures from the labor force. Younger men and women aged 16 to
30 experienced relatively high rates of unemployment but not as large increases in the UR as
other age groups. In fact, the unemployment rate of younger women actually declined. Also, in
contrast to older workers, there was no decline in the labor force participation of younger
workers.
Table 2 also provides breakdowns of changes in work status by city, educational
attainment, and ownership sector of most recent employment. Wuhan had the highest UR (17.2
percent in November 2001) and greatest increase in the UR (7.9 percent). Shanghai and Fuzhou
had the second and third greatest increases in the UR (5.7 and 4.2 percent), but the lowest levels.
Xian and Shenyang had the lowest UR increases but in November 2001 still had higher UR
levels than the coastal cities. All cities had unemployment rates above 10 percent in November
2001. The largest declines in LFPR occurred in Shanghai (6.9 percent), followed by Wuhan (4.2
percent). The other three cities had negligible declines. Overall, it does not appear that
restructuring shocks in China were confined to interior cities, but rather affected workers in
affluent coastal cities as well.
Employment shocks were strongly correlated with educational attainment. College
educated workers showed little change in their UR and little appreciable decrease in their LFPR.
The UR of high school graduates increased from 6.9 percent to 14.1 percent, while their LFPR
changed little. Those with less than high school education showed the highest increases and
levels of UR and significant declines in LFPR. The LFPR of individuals with only lower

13
secondary school education fell from 78.2 percent to 61.8 percent.
Looking at employment status by ownership sector of most recent employment, we not
surprisingly see a sharp jump in the unemployment rate of individuals in the state-owned, state-
controlled and collective sectors, and a sharp fall in LFPR in these same sectors. On the other
hand, for those in the private and foreign-invested sectors, the UR fell and the LFPR increased.
To investigate the determinants of labor outcomes in a multivariate framework, we
estimate probit models of unemployment and labor force participation for both men and women
in January 1996 and November 2001. We are particularly interested in assessing the extent to
which the greater susceptibility of older workers to employment shocks can be explained by
differences in educational attainment. By comparing results for the beginning and end of the
recall period, we also can see how the importance of different factors changed over time. The
independent variables are sets of dummy variables for educational attainment, age group, and
city. The dummy variables are defined so that the reference category is workers aged 16 to 30
with “elementary or less” education in Shanghai. We report marginal effects and their standard
errors in Table 3.
Conditional on being in the labor force, the marginal probability of being unemployed in
comparison to younger workers decreased over time for each male age group, but the differences
are not statistically different in either year. The probability of unemployment was more strongly
influenced by education. For men, those with post-secondary education were 5.9 percent less
likely to be unemployed than those with elementary education or less in 1996, and 6.5 percent
less likely in 2001. For women, the importance of education is greater and increasing faster; the
comparable marginal probabilities in 1996 and 2001 were -7.1 and -17.4 percent, respectively.11
11This result is consistent with other findings showing rising returns to education in urban China, especially for women (Zhang and Zhao, 2002).

14
Thus, conditional on being in the labor force, education is more important than age for
determining employment outcomes.
Interestingly, unlike for unemployment, age does appear to significantly affect labor force
participation even after controlling for education. The marginal probability of men in the 50 to
54 and 55 to 59 age groups remaining in the labor force relative to younger workers fell sharply
between January 1996 and November 2001. For women, a significant drop in marginal
probabilities of labor force participation compared to younger workers occurs at all age levels,
and became significantly negative for those aged 40 to 49, who by year-end 2001 were 20
percent less likely to be in the labor force than younger women. Women aged 50 to 54 were
already 42.8 percent less likely than young women to be in the labor force in 1996, but this
declined further to 50.3 percent less likely in 2001. Controlling for age, the positive effect of
education on the likelihood of labor force participation also became more significant over time
for both men and women. Men and women with post-secondary education were 5.6 and 21.6
percent more likely to be in the labor force than the least educated group in 1996, but 14.1 and
30.3 percent more likely in November 2001. Finally, we note that nearly all of the city
differences are not statistically different.12
To evaluate gender bias, we also estimate pooled regressions including data for men and
women and adding a dummy variable for gender. We find that after controlling for differences in
age, education, and city, women were no more likely than men to be unemployed in January
1996 but 2.7 percent more likely in November 2001. Women were 15.8 percent less likely to be
in the labor force at the beginning of the period and 22.8 percent less likely at the end. Overall,
gender bias in employment status appears to have increased over time.
Are Job Separations Voluntary? 12Men in Wuhan and women in Wuhan and Shenyang are more likely to be unemployed or out of the labor force.

15
One of the concerns about substantial declines in LFPR, especially among older workers,
is that such workers may not have left the labor force voluntarily. As noted earlier, they may feel
discouraged, incapable of finding suitable new work, or feel better describing themselves as
retired rather than unemployed. Policy makers may be less concerned if newly unemployed
workers are those who left jobs voluntarily in search of better work, and so reflect an increase in
natural unemployment associated with a more active labor market. Thus, it is of interest to
understand whether job separations were voluntary or involuntary.
To investigate this question, we examine self-reported explanations for the end of
employment for all job spells ending during the period 1996 to 2001 (Table 4). Enterprise
restructuring is considered to be the reason for job loss if the respondent chooses one of the
following responses: work unit closed, went bankrupt, or was merged or reorganized. Other
involuntary reasons for job separations include forced early retirement and other involuntary
dismissals. The remaining reasons for job separations are voluntary departures, mandatory
retirement, and “other.” Overall, 60.3 and 64.4 percent of job separations of men and women
were involuntary and non-mandatory. These total percentages include 29.0 and 21.8 percent
explicitly related to restructuring, 15.6 and 31.1 percent forced early retirements and 15.8 and
11.4 percent other involuntary dismissals (these latter two reasons also could be related to
restructuring). Only 25.9 and 19.0 percent of job separations were voluntary. Even allowing for
reporting bias by disgruntled workers, China clearly contrasts with other transition economies in
the predominantly involuntary nature of job separations.
For men and women aged 30 to 39 and men aged 40 to 49, restructuring was the most
important reason for involuntary job separation. Further, 57.5 percent of job separations for
women aged 40 to 49 and 88.1 percent for women aged 50 to 54 were in the form of early

16
retirement, and the majority of these women reported that retirement was involuntary. The
likelihood that early retirement may be unwanted is underscored when we compare average
retirement ages of different cohorts of the elderly. Men aged 60 to 65 in 2001, who began the
1996-2001 period near to the official retirement age, had a lower average retirement age, 57.8,
than men aged 65 to 70, who had already passed retirement age before widespread restructuring
began, and whose average retirement age was 58.3. Similarly, women aged 55 to 60 in 2001 had
a mean retirement age of 50.8 compared to 51.6 for the adjacent older cohort. Nearly all of the
elderly in both cohorts had retired by the time of the survey.
B. Changes in wages and benefits
Changes in wages and benefits are another important dimension of shocks that may have
affected large numbers of urban workers, even those fortunate enough to keep their jobs.
Information on such shocks is particularly lacking in the existing literature. Wage shocks may
take the form of reduced nominal or real wages, or wage arrears. Benefit shocks can take the
form of lost health insurance coverage, reduced health insurance benefits and health expenditure
reimbursement arrears for those with insurance, reduced pension benefits (for those still
working), pension arrears (for retired workers), and changes in housing benefits. In this section,
we focus on wage arrears, changes in health insurance coverage, and health expenditure
reimbursement arrears of employed working-age individuals, as well as pension and health care
reimbursement arrears of retired workers. Wage changes associated with job changes are
discussed in the next section on responses to shocks. We believe the other types of wage and
benefit shocks are less likely to have created immediate, significant hardships for most

17
workers.13
Wage, pension, and health expenditure reimbursement arrears are typically related to
temporary cash flow problems of employers, and may reflect the poor financial health of
enterprises or signal potential bankruptcy or layoff in the future. Overall, 10.6 percent of
working-age adults who worked during the 1996 to 2001 period experienced wage arrears at
some point during that period (column 1, Table 5). Less than four percent of ever-employed
workers (roughly one third of those with arrears) reported wage arrears in default, meaning that
the worker did not expect the wages to ever be paid. There is considerable variation in wage
arrears across cities. In Shenyang and Xian, about 23 percent of workers experienced wage
arrears (7.8 and 6.4 percent in default), followed by Wuhan (13.6 percent), Fuzhou (5.7 percent),
and Shanghai (2.1 percent). Wage arrears are spread relatively evenly across demographic
groups, with over 10 percent in every group reporting such arrears. Men aged 40 to 50 and
women aged 30 to 40 have the highest percentage of wage arrears (13.3 and 14.3 percent). Wage
arrears are much more prevalent among less educated workers (14.6 percent for those with lower
secondary school education, 10.8 percent for those with upper secondary education, and 5.7
percent for those with post-secondary education). Workers in wholly state-owned, majority
state-owned, and collective enterprises were most likely to have experienced wage arrears, and
those in government or party organizations or in foreign-invested enterprises were least likely.
To examine changes in health insurance coverage over time, we use the work histories to
calculate employer-provided health insurance coverage rates for working adults aged 16 to 60 at
13Wage data from the CULS work histories reveal that reductions in nominal wages while staying with the same employer rarely occurred, although our data are not ideal for examining such changes because the survey asks about starting and ending wages for each job spell but does not capture wage reductions that followed wage increases. Inflation was only 0.54 percent per annum from 1996 to 2001 in urban China, making real wage shocks due to inflation inconsequential. In pretests, we found that most workers did not have a good understanding of the details of their pension or health care benefits. It has not been common practice to take housing away from displaced workers, mainly because of the potentially explosive social and political repercussions.

18
the beginning and end of the recall period (columns 2 and 3, Table 5). Overall, coverage fell
substantially, from 81.6 percent in January 1996 to 68.7 percent in November 2001. Declines
were greater for women (75.7 to 61.0 percent) than men (84.5 to 74.3 percent). They were most
dramatic in Shanghai (decline of 17.0 percent) and Xian (16.4 percent), followed by Fuzhou
(11.9 percent), Wuhan (8.2 percent), and Shenyang (6.4 percent). However, by the end of the
period, Shanghai still had the highest coverage rate (74.6 percent) and Shenyang the lowest (53.5
percent). Declines were very modest in wholly-owned SOEs and in government, but more
common in majority-owned SOEs, collective enterprises, and non-public enterprises. The low
percentage of workers in the private sector with employer-provided insurance suggests that
prospective loss of benefits could be a barrier preventing workers from shifting from the public
to private sectors. Most reductions in health insurance coverage appear to be associated with job
changes. We found no evidence of large numbers of employees losing insurance outright while
working with the same employer. Given that the ER declined over time and non-working
individuals were less likely to have health insurance, the decline in health insurance coverage for
the whole population was surely greater than the decline in insurance coverage of working
adults.
In column 5 of Table 5, we report health insurance coverage rates for all individuals aged
16 to 60 in November 2001, whether working or not working, based on responses to an
independent question on current health insurance status. Overall, 56.1 percent of working age
adults in the five city CULS survey had health insurance, of which only 6.1 percent of adults
purchased insurance themselves. Shanghai had by far the highest coverage rate (87.4 percent),
followed by Xian (57.5 percent), Fuzhou (48.7 percent), Wuhan (46.2 percent), and Shenyang
(39.1 percent). The fact that Shanghai’s overall coverage rate is even higher than the employer-

19
provided coverage rate for employed workers in 2001 could reflect both the high coverage rate
of early retirees (97.6 percent of retirees in Shanghai report that they have health insurance) and
Shanghai’s relative success in separating health care provision from enterprises. In general,
health insurance is closely tied to employment; 66.7 percent of employed working-age adults had
health insurance coverage, compared to only 35.4 percent of those who were not working. In
comparing coverage rates of different demographic groups, we find that a higher percentage of
men than women in each age category had health insurance coverage. Among older workers,
who have much greater potential for health problems, men were much more likely to have health
insurance provided by employers. Overall, women closer to retirement age were more likely to
have coverage, but the share with employer-provided health insurance declined for the 50-55
cohort approaching mandatory retirement. Health insurance coverage was much higher for more
educated workers, and in government or publicly owned enterprises.
Those with health insurance may also experience shocks if they have difficulty obtaining
promised reimbursements. Health expenditure reimbursement arrears among those with health
insurance are even more common than wage or pension arrears. Overall, 22.1 percent of
working-age adults with health insurance report health expenditure reimbursement arrears
(column 2, Table 5). The variation across cities in health expenditure reimbursement arrears is
quite different than for wage and pension arrears, and follows more closely differences in city
income per capita. Xian has by far the greatest prevalence, at 38.2 percent, followed by
Shenyang (27.7 percent), Wuhan (19.5 percent), Fuzhou (18.9 percent) and Shanghai (18.9
percent). Unlike other types of arrears, we don’t see a significant difference in arrears across
demographic or education categories conditional on having insurance.
Next, we briefly describe shocks to benefits affecting retired workers (Table 6). While

20
these shocks mainly affected elderly individuals, defined as those aged 60 and older, they also
affected some who retired early (28 percent of retirees were below mandatory retirement age at
the time of the survey). We find that 10.6 percent of retirees report experiencing pension arrears.
For the most part, the breakdowns by city and educational attainment exhibit the same patterns as
for wage arrears. The greatest prevalence of pension arrears is in Shenyang, where 26.4 percent
of retirees report arrears. Table 6 also shows that health insurance coverage rates of retired
persons were generally higher than those of working-age adults (74.2 percent compared to 56.1
percent), but conditional on having insurance, the incidence of health expenditure reimbursement
arrears was much greater (29.9 percent compared to 22.1 percent). This latter difference makes
sense because the elderly would be expected to have a higher demand for health services.
One of the main goals of labor policy reforms was to “socialize” the work benefit system
by shifting responsibility for their provision from enterprises to local governments. Many
inequities in benefit access occur because, in the absence of such reforms, workers in poorly
performing enterprises became vulnerable to losing promised benefits. The CULS provides
information on whether health insurance reimbursements and pension payments were provided
by work units or local governments. In January 1996, only 5.6 percent of employed workers
with health insurance received socialized benefits, but by November 2001, the share had
increased to 55.7 percent.14 However, progress in socializing health insurance benefits varied
dramatically by city. The share of the insured receiving socialized health insurance benefits in
2001 was 88.6 percent in Shanghai, 50.5 percent in Xian, 35.6 percent in Fuzhou, 11.4 percent in
Wuhan, and 9.1 percent in Shenyang. Shanghai also led the way in socializing pension benefits.
14Access to socialized insurance and pensions still requires that firms and employees are making contributions to city-wide insurance pools. For this reason, both the health of firms and the monitoring and enforcement capacity of the local Ministry of Labor and Social Security office are important for determining the coverage of workers under the socialized health insurance and pension programs.

21
By 2001, 93.9 percent of pensioners in Shanghai received their pension payments from
government offices rather than their enterprise, compared to 69.5 percent in Fuzhou, and roughly
60 percent in the other three cities. In all of the cities, the share receiving socialized pension
benefits in 1996 was between 15 and 25 percent.
5. Responses to economic shocks
Workers who are adversely affected by economic shocks may reduce the negative impact
of lost wages and benefits in several ways. First, workers losing jobs may try to find a new job.
If this fails or if they are unwilling to search for new work, they can seek access to government
social welfare programs, turn to family and friends, or draw upon their own savings or other
assets. Workers who formally retire may be eligible for pension payments. In this section, we
evaluate the extent to which workers adversely affected by recent economic shocks have been
able to find support through these various mechanisms.
A. Reemployment
For workers who lose jobs involuntarily, finding new jobs in as short a time as possible
may be the best way to avoid large welfare reductions associated with lost pay and benefits.
However, even if one finds a new job, the extent to which reemployment cushions the original
employment shock depends upon the duration of non-employment and the difference in the
wages and benefits provided by the new job in comparison to the old job.15 Access to public and
private support or to pension payments also determines the welfare loss associated with non-
employment, and may affect the duration of non-employment. Many workers also leave jobs
15A literature on the long-term effects of worker dislocation in the US suggests that individuals who experience layoffs have persistently lower income and that this is reflected in persistent downward adjustments to household consumption per capita. See Stephens (2001) for an example and a useful review of this literature.

22
voluntarily in the hopes of finding better jobs or when a better job offer is already in hand. Thus,
the dynamics of reemployment may vary considerably depending on the reason for job
separation. We are particularly interested in the reemployment of those suffering from
employment shocks due to restructuring.
Between January 1996 and November 2001, the CULS documented 2705 job separations
of working-age adults. As shown in Table 7, 34.8 percent of individuals experiencing job
separations were employed again within 12 months of leaving their jobs, and 44.7 percent were
employed again by November 2001. In Shanghai and Fuzhou, cities hit less hard by
restructuring, about 42 percent of individuals were employed again within 12 months. In
Shenyang, Wuhan, and Xian, only 29 to 30 percent of workers leaving jobs were employed again
within 12 months. Out-of-work duration also differed by gender, age, and education. For all age
groups, the share of men reemployed within 12 months was higher than the share of women. For
both men and women, there was a significant decline in the share reemployed within 12 months
for those over age 40. Individuals with more education were more likely to be re-employed
within a year.16
When we look at the duration of unemployment by reason for job separation, we find, not
surprisingly, that those who left jobs voluntarily were much more likely to find new jobs quickly
compared to those who left involuntarily. Of those who voluntarily left jobs, 62.3 percent were
reemployed within 12 months and 70.7 percent were employed by November 2001. In contrast,
of those losing jobs because of restructuring or other involuntary reasons, only 38.0 and 31.7
percent found new jobs within 12 months. The reemployment rate was even lower for those who
said they had retired early.
16When we analyze out of work duration in a multivariate framework using a duration model, we find that these age, gender and education effects remain present and significant.

23
The plight of state-sector employees is highlighted by our finding that only 29.1 percent
of individuals leaving state-owned enterprises were employed again within a year, and only 36.8
percent by November 2001. Employees leaving government or party organizations fared
relatively better, with 60.3 percent re-employed within a year, followed by individuals working
in foreign-invested and private sectors.
During the late 1990s, China’s policymakers hoped that demand for laborers in the non-
state sector would absorb laid-off workers from the state sector. Has labor, in fact, shifted from
the state to non-state sector? Table 8 displays a transition matrix with ownership sector of
previous job on the vertical axis and ownership sector of new job on the horizontal axis. Of the
944 workers who left state sector jobs, 64.5 percent were still out of work in November 2001.
Of the 35.5 percent who found new employment, only 8.5 percent, or less than one fourth of
reemployed workers, found work in state-owned enterprises, while 7.0 percent found jobs in
collective enterprises. Also, 14.2 percent of former SOE employees (about 40 percent of the
employees who found new jobs) found their new job in the private sector. Similar transitions
characterized workers leaving the majority state-owned and collective sectors.
Do workers finding new employment end up taking a cut in pay, or do some workers
actually do better with new employers? Again, the answer to this question depends upon the
reason for job separation. Columns 3 to 5 of Table 7 provide summary information on changes
in nominal wages when individuals change jobs. The first column reports mean percent changes
in wages from previous job to new job for individuals who change jobs. The second and third
columns report the share of respondents with lower and higher nominal wages, respectively.
Workers under age 40 experienced an increase in mean nominal wages, while those over 40 saw
average wages decline. The decrease in nominal wage was largest for those workers in the

24
cohort five years before mandatory retirement. Given that older workers have less human capital
and likely found it difficult to learn new skills, this result is not surprising. Overall, job loss did
not appear to have a scarring effect for younger workers, but did for older workers. At first
blush, this would suggest a conclusion similar to Appleton et al (1992), which contrasts with
findings in many countries that job loss is associated with a permanent decrease in wages. It is
important to keep in mind, however, that nearly 60 percent of workers experiencing job
separations during this period were still unemployed in November 2001.
The importance of education and prior sector of employment also figure prominently in
the changes observed between jobs. Individuals with upper secondary education and above saw
positive increases in wages as they shifted between jobs, while workers with lower secondary or
primary education saw a drop in their average wage. Similarly, workers formerly in wholly-
owned SOEs, majority-owned SOEs, and foreign-invested enterprises witnessed an average
decline in nominal wages, while those that had been previously employed in government or party
organizations or in the private sector saw an average gain in their nominal wage when changing
jobs.
New jobs may also restore employment-related benefits, unless new employers tend to be
foreign or private firms that provide fewer benefits than SOEs. Take the case of health
insurance. Of the 1120 workers in the CULS who found new jobs after ending job spells, 80
percent did not receive health insurance benefits in their new jobs. For individuals with
employer provided health insurance in their previous job, 73 percent did not receive health
insurance benefits in their next job. Thus, even when reemployment restored wage income, it
often did not reverse lost benefits associated with departures from state-sector employment.

25
B. Access to Public Support
The three main social insurance programs designed to help workers adversely affected by
economic shocks are xiagang subsidies, unemployment subsidies, and MLSP payments.
Publicly funded pension payments, especially for those who retire early, can also be considered a
form of public support. Whether or not and to what extent dislocated workers have had access to
these different forms of public support has been an important but poorly understood policy
question.
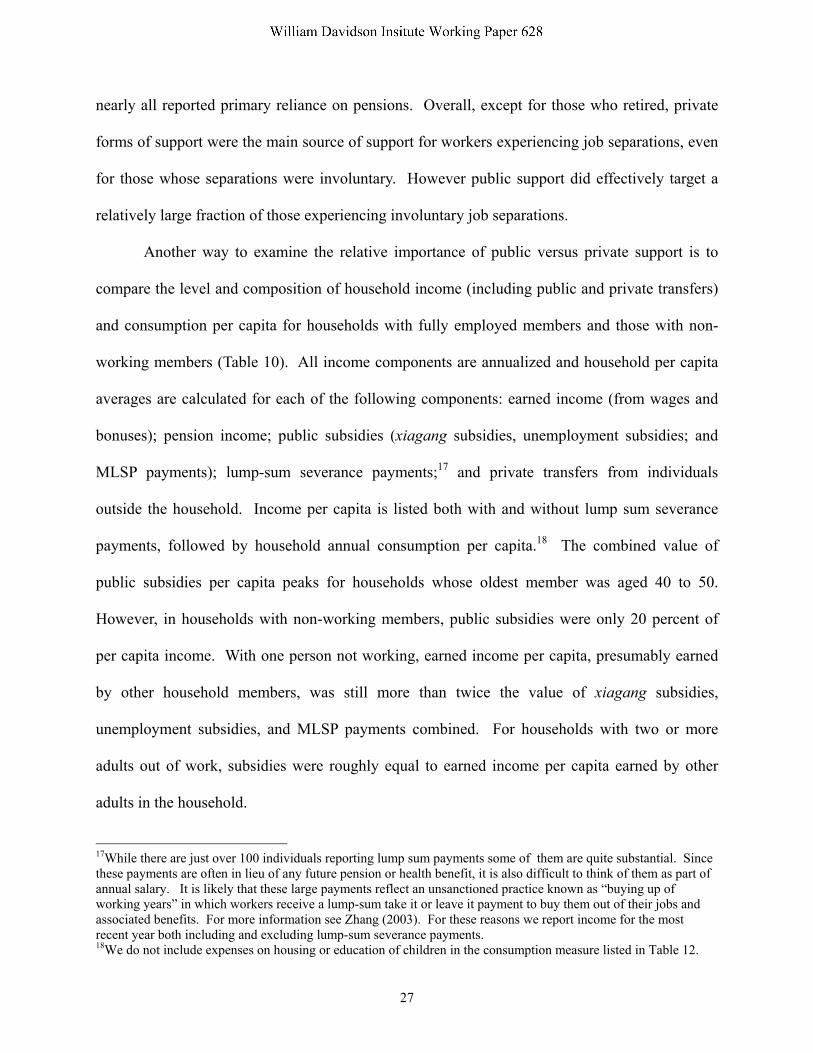
Figure 4 repeats the plots of unemployment rates by demographic groups from Figure 2,
but further breaks down the unemployed in each demographic group into three categories: the
share with access to xiagang subsidies or unemployment insurance (shaded in gray); the share
receiving pension payments (white); and the share lacking access to public support (black).
Because MLSP payments are targeted to the household, they are not considered here. Fewer
than 20 percent of unemployed workers under age 30 had access to public support, and even for
those aged 30 to 40, fewer than 30 percent of unemployed men and 25 percent of women had
access to xiagang or unemployment subsidies. For men aged 40 to 55 and women aged 40 to 50,
coverage was better, with over half of the unemployed receiving public subsidies. For those near
retirement age, pensions became an important source of support. For men aged 50 to 55 and
women aged 40 to 50, about one fifth of the unemployed receive pensions, and for men aged 55
to 59 and women aged 50 to 59, the vast majority of the unemployed received pensions.
The importance of pensions as a source of support for older working age adults becomes
more evident when we look at public support for those who are out of the labor force, again
broken down by gender and age group (Figure 5). For women over 40 and men over 50, large
majorities of workers who were neither working nor looking for work received pensions.

26
Otherwise the patterns of support are similar to those for the unemployed. Again, among
younger workers who were out of the labor force, especially those below age 30, very few
received public support. Among those aged 40 to 49, more than half of men received subsidies
(similar to the support received by the unemployed) but relatively few women did (most relied
on pensions).
Overall, we find that younger workers had very poor access to public support compared
to older workers. As workers neared retirement, it was increasingly likely that non-employed
workers, especially those out of the labor force, received pensions. Considering all forms of
public support, including pensions, we find that the coverage of public support increased
monotonically with the age group of the worker. However, for all age groups, there remained
substantial shares of dislocated workers who received no public support at all, including one
third to one half of the unemployed aged 40 to 50, the group experiencing the greatest
employment shocks due to restructuring.
Even for those who received public support, the magnitude of support and its importance
relative to private sources of support may have been limited. In the work histories, we directly
asked respondents to report the most important source of financial support during each non-
working spell. Table 9 reports these responses by gender and reason for job separation. For
those experiencing involuntary job separations, the most frequent main source of support was
income from other household members (33.8 percent for men, 54.0 percent for women). Forms
of public support were cited by 33.5 percent of men and 26.3 percent of women, the most
common choice being xiagang subsidies (24.7 percent of men and 21.5 percent of women). For
those reporting voluntary separations, only 13.8 percent of men and 12.9 percent of women
reported public support as the main source of support while not working. For retired workers,
27
nearly all reported primary reliance on pensions. Overall, except for those who retired, private
forms of support were the main source of support for workers experiencing job separations, even
for those whose separations were involuntary. However public support did effectively target a
relatively large fraction of those experiencing involuntary job separations.
Another way to examine the relative importance of public versus private support is to
compare the level and composition of household income (including public and private transfers)
and consumption per capita for households with fully employed members and those with non-
working members (Table 10). All income components are annualized and household per capita
averages are calculated for each of the following components: earned income (from wages and
bonuses); pension income; public subsidies (xiagang subsidies, unemployment subsidies; and
MLSP payments); lump-sum severance payments;17 and private transfers from individuals
outside the household. Income per capita is listed both with and without lump sum severance
payments, followed by household annual consumption per capita.18 The combined value of
public subsidies per capita peaks for households whose oldest member was aged 40 to 50.
However, in households with non-working members, public subsidies were only 20 percent of
per capita income. With one person not working, earned income per capita, presumably earned
by other household members, was still more than twice the value of xiagang subsidies,
unemployment subsidies, and MLSP payments combined. For households with two or more
adults out of work, subsidies were roughly equal to earned income per capita earned by other
adults in the household.
17While there are just over 100 individuals reporting lump sum payments some of them are quite substantial. Since these payments are often in lieu of any future pension or health benefit, it is also difficult to think of them as part of annual salary. It is likely that these large payments reflect an unsanctioned practice known as “buying up of working years” in which workers receive a lump-sum take it or leave it payment to buy them out of their jobs and associated benefits. For more information see Zhang (2003). For these reasons we report income for the most recent year both including and excluding lump-sum severance payments. 18We do not include expenses on housing or education of children in the consumption measure listed in Table 12.

28
Further appreciation of the coverage and leakage of the xiagang and registered
unemployment programs can be drawn from information describing both the benefits received
and current work-status of xiagang and registered unemployed workers. The CULS contains
information on 969 workers who reported that they were current or former xiagang workers. Of
this group, 83.9 percent were still xiagang in November 2001. Only 42.3 percent of self-
described xiagang workers actually received formal xiagang registration certificates, and 35.1
percent did not receive any living support subsidies (24.6 percent of registered and 44.4 percent
of non-registered xiagang workers). Self-reported xiagang workers may be un-registered if they
are not strictly eligible for xiagang status but prefer using the word to describe their situation, or
if they are qualified but work units are unwilling to grant registered status because of the
financial responsibilities entailed. The flipside of the incomplete coverage problem is leakage.
We find that 17.4 percent of xiagang workers received xiagang or unemployment living
allowances while also working.
There is some overlap in the targeting of xiagang and unemployment subsidies. Some
xiagang workers were registered as unemployed (15.1 percent) and received unemployment
benefits (7.7 percent). Some xiagang workers were even able to receive both xiagang and
unemployment subsidies at the same time (3.1 percent). The new unemployment subsidies also
have problems of incomplete coverage and leakage. Many unemployed workers were not
officially registered as such, and of those who registered, 40.6 percent received no subsidies. But
18.2 percent of registered unemployed workers received some type of subsidy while working.
Those receiving both xiagang and unemployment subsidies accounted for 7.1 percent of the
registered unemployed.
According to official guidelines (Ministry of Labor and Social Security, 2002), xiagang

29
workers were required to enroll at re-employment centers, and the centers were required to
provide a basic living allowance; make contributions on behalf of workers to pension, medical
insurance, unemployment insurance and other social security pools; and organize re-training and
provide referrals for re-employment. In fact, only 23.8 percent of self-reported xiagang workers
had medical insurance, and 18.9 percent of those with insurance experienced reimbursements
arrears. Moreover, only 39.0 percent of workers with a xiagang certificate and 27.5 percent
without believed that they would ever receive a pension, let alone benefit from employer pension
contributions. Finally, in practice, access to retraining programs was far from complete. Only
12 percent of self-described xiagang workers reported that participation in retraining programs
was mandatory and an even lower percentage reported actually participating in a training
program.19
B. Access to Private Support
Evidence presented in Tables 9 and 10 suggests that pooling of income within households
was an important source of insurance against job loss. Overall, most individuals experiencing
involuntary job separations reported that the main source of support came from private sources.
Aside from income from other household members, the next most frequent source of private
support was own savings (23.0 percent for men and 12.4 percent for women). Loans and private
transfers were the main source of support for only a tiny fraction of such individuals. Private
support was even more important for those voluntarily leaving jobs; for such individuals, other
household members were by far the most important source of support when not working. For
retirees, very few reported primary reliance on private sources of support; rather, pensions were
19This calls into question the findings of Bidani, Goh, and O’Leary (2002), which looks at the effectiveness of retraining programs in Wuhan and Shenyang based on surveys of workers who showed up at retraining centers, since such a sample would clearly suffer from selection bias.

30
nearly always the main source of support.
Table 10 reinforces the point that private transfers from non-household members were
unlikely to provide significant relief for those experiencing adverse shocks to employment.
Families headed by an adult in the 40 to 49 age group, with one non-working man, had private
transfers that accounted for only 3 percent of non-housing consumption, compared to net
transfers out in households in which all adults were working. Among some demographic groups,
net transfers received were negative (reflecting a transfer out) in spite of the fact that the
household had one or more unemployed family members. Assistance in the form of private
transfers was not appreciably higher in families with more than one adult out of work. It is
possible that unobserved characteristics of families with non-working members and with fully
employed members could bias simple comparisons of private transfers. However, few
individuals suffering from shocks subjectively report such transfers as being important (Table 9).
When we estimate the determinants of net transfers received in 2001 as a function of household
employment shocks (and instrument shocks with industry-city employment changes as in Jensen
and Richter, forthcoming), we find that the responsiveness of private transfers to shocks,
although larger than suggested by Table 10, remains relatively small as a share of consumption.20
Comparisons of income and consumption of households with working and non-working
members reveal potential differences in the ability of households to smooth income shocks. For
each age group, the income and consumption of households with a man not working relative to
20We estimated a linear version of ( , , , , )T f UM PEN Z E CITY= , where T is the inverse hyperbolic sign of net transfers received per capita (a log-like transformation amenable to zeros). T is a function of unemployed months per capita experienced by household members (UM), exogenous pension receipts per capita (PEN), a set of family demographic variables (Z) that includes number of adult males, adult females and children, and shares of adults in different age categories; family education variables (E) defined as the share of adults with lower middle school, upper middle school, and post-high school education; and a set of dummy variables for city of residence (CITY). We find that an additional month of unemployment per capita increases private transfers by 55.2 yuan per capita when transfers are close to zero, far from enough to cover an individual’s living expenses for one month.

31
fully employed households was much lower than that of households with a woman not working.
These differences also were greatest when household heads were middle-aged (aged 30 to 50).
Greater vulnerability of middle-age workers could reflect the fact that younger and older workers
were more likely to live in households with two generations of workers. Nonetheless, the effect
of non-employment on income per capita was much greater, on average, than its effect on
consumption per capita. For households headed by middle-aged workers, those with a non-
working male had household earnings per capita equal to one third of households with fully
employed members, but non-housing consumption per capita was two thirds of the average for
fully employed households.
Can household composition itself be an important source of insurance against negative
income shocks? For all working age adults between 16 and 60, only 38 percent of unemployed
adults and 32 percent of those out of the labor force lived in households with two or fewer adults,
which we define to be “nuclear”, while 45 percent of working individuals lived in nuclear
households. This strong correlation between living arrangement and work status may reflect a
greater willingness of those living in extended families to leave jobs, or the responsiveness of
living arrangements to shocks.
6. Has Economic Restructuring Got You Down?
Finally, we examine subjective evaluations of well-being based on the answers to two
questions. The first measures perceptions about shocks. It reads, “How does your economic
condition compare with five years ago?” Possible responses are “much better,” “better,” “the
same,” and “worse.” The second question is, “Are you satisfied with your current standard of
living?,” a measure of perceived welfare. Possible responses are “very satisfied,” “somewhat

32
satisfied,” “somewhat dissatisfied,” and “very dissatisfied.”
In Table 11, we report the percentage of respondents who answered “worse” to the first
question. For the full sample and separately for working, unemployed, and out of the labor force
workers, we break down the subjective shock assessment by city, demographic group, education
level, and sector of employment. Overall, 24 percent of respondents reported a worsening of
their economic condition. The percentage perceiving negative shocks was highest for the
unemployed (47.8 percent), followed by those out of the labor force (26.6 percent) and those
working (19.4 percent). Those answering “worse” was highest in Wuhan (30.5 percent), but also
accounted for about 20 percent of respondents in Shanghai and Fuzhou. The worst hit
demographic group was older unemployed men aged 40 to 55. In general, older workers were
most affected, while younger workers and those very near to retirement were less affected. Men
who were unemployed or out of the labor force were more likely to report declines in economic
conditions than women. Shocks also hit the less educated harder. Among ownership sectors,
worsening economic conditions were widespread, except for those working in the government or
party, or in foreign-invested enterprises. All of these results are consistent with earlier findings.
Responses to the question on current standard of living bely relatively widespread
dissatisfaction. Table 12 reports the percentage who felt “unsatisfied” or “very unsatisfied,”
broken down just as in Table 11. Over half of all respondents (51.7 percent) reported
dissatisfaction with their living standards at the time of the survey. Many patterns in the
responses mirror those for the question on change in economic conditions. For instance, Wuhan
workers are the least satisfied (63.7 percent), older but not oldest workers are the least satisfied,
those near retirement are the most satisfied, those with greater education are more satisfied, and
those working for the government or party, or foreign-invested enterprises are more satisfied.

33
Nearly all of the correlations suggested in Tables 11 and 12 hold up when we estimate the
effect of different determinants of subjective assessments in a multivariate framework by
estimating probit models of whether respondents report worse economic conditions over the past
five years or dissatisfaction with current living standards (not reported).21 The results strongly
reinforce the earlier findings that older workers aged 40 to 50 appear to have been hit the hardest
and be most vulnerable to shocks.
7. Conclusions
The period 1996 to 2001 was a time of tumultuous change for many of China’s urban
workers. In this paper, we have used new evidence from surveys of working-age individuals in
five large Chinese cities to examine how negative shocks to employment and benefits affected
different groups of Chinese workers and how workers coped with these shocks through public
and private means.
Employment shocks were large and widespread, with unemployment reaching double
digits in all sample cities and labor force participation declining by 8 percent over the period.
These changes were similar to those experienced by some of the transition countries in Eastern
and Central Europe, where, like China, labor market adjustments were primarily accomplished
through changes in employment rather than real wages. China’s experience was distinctive in
that most job leaving was involuntary, which should also raise concern that workers may have
had difficulty coping with shocks. Older workers and women were particularly likely to lose
jobs and become unemployed or leave the labor force.
Benefit shocks were also important. We found evidence of modest amounts of wage and
21These were specified in the same way as the probit models for unemployment and labor force participation and shown in Table 3.

34
pension arrears, spread relatively evenly across demographic groups. The problem was
relatively more severe in Shenyang, particularly for pensions, and Xian, but did not reach the
same crisis proportions as in Russia. Declines in health benefits, which have received little
previous attention, probably affected many more individuals. The health insurance coverage rate
of employed workers declined by 12.9 percent over the period. With much poorer coverage
among those not working (except the retired), overall health insurance coverage rates for the
urban population were surprisingly low by 2001 (56.1 percent overall and less than 50 percent in
three of the five cities). And among those with insurance, health expenditure reimbursement
arrears occurred more frequently than wage or pension arrears. Falling health care benefits were
related to but not simply a problem of lost jobs. New employers in the nonstate sector were
much less likely to provide health insurance than SOEs. Difficulty in maintaining benefit
coverage is likely related to the mixed success of socializing benefit provision by shifting
responsibility for program management from enterprises to municipal governments.
Public assistance programs for dislocated workers achieved mixed success. The xiagang
subsidy program reached many more people than the nascent unemployment insurance program
or the MLSP. Younger workers received few subsidies despite exhibiting relatively high rates of
unemployment. A substantial percentage of older workers out of work received subsidies. Most
retirees, including those forced to retire early, received pension payments. But there were
numerous problems with the xiagang program as well. Even among the targeted group of older
workers, most of the unemployed or out-of-the-labor-force individuals did not receive any
subsidies. Most self-described xiagang workers were not registered as such, and one fourth of
the registered received no xiagang subsidies. There were also problems of leakage, with 20.7
percent of self-described xiagang workers receiving subsidies while working. Most xiagang

35
workers did not receive other benefits (i.e., health insurance, pension contributions) as promised,
and most received no help from reemployment centers in learning new skills or finding new jobs.
Not surprisingly, most job-leavers reported that they relied primarily upon private
assistance to support consumption when not working. By far the most important form of support
was from co-resident family members, followed by own savings. Private transfers from relatives
and friends outside the household were relatively unimportant. While these mechanisms reduced
the effect of employment shocks on individual consumption, they only partly cushioned the
negative shocks. A better understanding of private support mechanisms is an important agenda
item for future research.
Overall, older workers, who were in their prime earning years and often played key
breadwinning roles for their families, were most adversely affected by shocks. Often lacking
marketable skills, they weathered the largest employment shocks, were least likely to find new
jobs, and if they found new jobs the pay was lower. Many received little or no help from public
subsidies. In subjective assessments, they were most likely to report declines in living standards
and most likely to report being dissatisfied. Younger workers, who typically are less settled in
their career trajectories, were not hit as hard in terms of changes in employment, but many were
unemployed, few received public benefits, and most were dissatisfied with their standard of
living. Retired workers were relatively well-supported by pension payments and reported being
most satisfied with their living standards. Women were hit harder by employment shocks, were
less likely to find new jobs, but had stronger financial support from other household members.
Finally, recent changes in the labor market have privileged better educated workers. Those with
post-secondary education saw little change in unemployment or labor force participation, limited
shocks to benefits, were least likely to be laid off and most likely to find new jobs, often at

36
higher wages, and reported the highest rates of satisfaction.
Urban families in China weathered substantial and widespread adversity during the
period 1996 to 2001. While it would be hard to describe the situation as having reached crisis
proportions, designing appropriate policies will be a serious challenge for China’s new
leadership for some time, and will require ongoing monitoring and analysis of the nature of
economic difficulties and the functioning of public and private support mechanisms.

37
References
Appleton, Simon, John Knight, Lina Song, and Qingjie Xia (2002). “Labor Retrenchment in China: Determinants and Consequences,” China Economic Review 13: 252-275.
Benjamin, Dwayne, Loren Brandt and Terrence Yuen (2003). “Employment Dynamics in State
Owned Enterprises During Economic Transition,” mimeo, University of Toronto. Bidani, Benu, Chorching Goh, and Christopher O’Leary (2002). Has Training Helped Employ
Xiagang in China?: A Tale from Two Cities, mimeo, The World Bank. Boeri, Tito (2000). “Transition with Labor Supply,” William Davidson Institute Working Paper
No. 274. Boeri, Tito, and Katherine Terrell (2002). “Institutional Determinants of Labor Reallocation in
Transition,” Journal of Economic Perspectives 16(1): 51-76. Cao, Yuanzheng, Yingyi Qian, and Barry Weingast (1999). “From Federalism, Chinese Style, to
Privatization, Chinese Style,” Economics of Transition 7(1): 103-131. Dong, Xiao-yuan, and Louis Putterman (2003). “Soft Budget Constraints, Social Burdens, and
Labor Redundancy in China’s State Industry,” Journal of Comparative Economics (March). Dong, Xiao-yuan, and Louis Putterman (2001). “The Emergence of Labor Redundancy in
China’s State Industry: Findings from a 1980-1994 Data Panel,” Comparative Economic Studies 43(2): 111-128.
Drury, David, and Marie W. Arneberg, eds. (2001). No More Forevers: The Chinese Labour
Force in a Time of Reform, Norway: Fafo Institute for Applied Social Science. Ge, Yanfeng (1998). Report on Urban Employment: Survey in Shenyang, Qingdao, Changsha,
and Chengdu (Shenyang, Qingdao, Changsha, Chendu si chengshi chengzheng jumin jiuye zhuangkuang chouyang diaocha fenxi baogao), Beijing: UNDP.
Giles, John, Albert Park, and Juwei Zhang (2003). What is China’s True Unemployment Rate?,
mimeo, University of Michigan. Jensen, Robert T. and Kaspar Richter (forthcoming). “The Health Implications of Social Security
Failure: Evidence from the Russian Pension Crisis,” Journal of Public Economics. Lardy, Nicholas R. (1998). China's Unfinished Economic Revolution, Brookings Institution
Press, Washington, D.C. Li, Guo, and Colin Lixin Xu (2001). “State-Owned Enterprises, Labor Redundancy, and Job
Creation: the Experience of the Chinese Provinces,” China Economic Quarterly 1(1): 97-110.

38
Liu, Yuanli (2000). Health Insurance Reform in China, report to the Asian Development Bank. Lokshin, Michael M., and Rurlan Yemtsov (2000). “Household Strategies for Coping with
Poverty and Social Exclusion in Post-crisis Russia,” World Bank Research Working Paper No. 2556.
Maurer-Fazio, Margaret (2002). “The Role of Education in Determining Labor Market
Outcomes in Urban China,” mimeo, Bates College. Ministry of Labor (2002). China Labor and Social Security Yearbook (Beijing: Ministry of
Labor). Ministry of Labor and Social Security (2002). Selected Important Documents on Labor and
Social Security in the New Period. Document Research Office of the Central Committee of the Communist Party of China, China Labor and Social Security Publishing House and Central Document Publishing House, 2002.
Murphy, David (2002). “China – Urban Poverty – Nothing More to Lose…” in The Far Eastern
Economic Review, November 7, 2002. National Statistical Bureau (2002). China Statistical Yearbook (Beijing: China Statistical Press). Roberts, Dexter T. (2002). “Days of Rage. Angry Workers Hit the Streets,” in Businessweek 50
No 3777, April 8, 2002. Stephens, Melvin, Jr (2001). “The Long-Run Consumption Effects of Earnings Shocks,” Review
of Economics and Statistics 83(1): 28-36. Svejnar, Jan (2002). “Labor Market Flexibility in Central and Eastern Europe,” William
Davidson Working Paper Number 496. Wonacott, Peter (2002). “Laid-Off Workers Besiege Subsidiary of PetroChina – Retirement-
Package Battle Signals China’s Labor Woes,” in The Wall Street Journal (European Edition), March 14, 2002.
Zhang, Juwei (2003). Urban Xiagang, Unemployment and Social Support Policies: A Literature
Review of Labor Market Policies in Transitional China, Report to the World Bank. Zhang, Junsen, and Yaohui Zhao (2002). Economic Returns to Schooling in Urban China, 1988
to 1999, mimeo, Peking University.

39
Figure 1
Trends in Urban Employment Status In the CULS, 1996-2001
Unemployment Rates
1996-2001
0.000.020.040.060.080.100.120.140.160.18
1996 1997 1998 1999 2000 2001 2002
All Men Women
Labor Force Participation Rate1996-2001
0.50
0.55
0.60
0.65
0.70
0.75
0.80
0.85
0.90
0.95
1996 1997 1998 1999 2000 2001 2002
All Men Women
Employed Share of Working Age Adults1996-2001
0.50
0.55
0.60
0.65
0.70
0.75
0.80
0.85
0.90
1996 1997 1998 1999 2000 2001 2002
All Men Women
Source: China Urban Labor Survey. Trends reflect respondents with contemporaneous age 16 to 60.

40
Figure 2 Unemployment Rates
Men
0.00
0.05
0.10
0.15
0.20
0.25
1996 1997 1998 1999 2000 2001 2002
Une
mpl
oym
ent R
ate
Age >=16 & <30 Age >=30 & <40 Age >=40 & <50Age >=50 & <55 Age >=55 & <60
Women
0.00
0.05
0.10
0.15
0.20
0.25
1996 1997 1998 1999 2000 2001 2002
Une
mpl
oym
ent R
ate
Age >=16 & <30 Age >=30 & <40 Age >=40 & <50Age >=50 & <55 Age >=55 & <60
Source: China Urban Labor Survey (Fuzhou, Shanghai, Shenyang, Wuhan, Xian)

41
Figure 3 Labor Force Participation Rate
Error! Not a valid link.
Women
0.100
0.250
0.400
0.550
0.700
0.850
1.000
1996 1997 1998 1999 2000 2001 2002
Labo
r For
ce P
artic
ipat
ion
Rate
Age >=16 & <30 Age >=30 & <40 Age >=40 & <50Age >=50 & <55 Age >=55 & <60
Source: China Urban Labor Survey (Fuzhou, Shanghai, Shenyang, Wuhan, Xian)
42
Figure 4
Share of Unemployed Receiving Public Subsidies and Pensions By Gender and Age Cohort
Men, 16-29
0.00
0.02
0.04
0.06
0.08
0.10
0.12
0.14
0.16
0.18
0.20
1996 1997 1998 1999 2000 2001
Year
Une
mpl
oym
ent R
ate
Receives Public Subsidy No Support
Women, 16-29
0.00
0.02
0.04
0.06
0.08
0.10
0.12
0.14
0.16
0.18
0.20
1996 1997 1998 1999 2000 2001
Year
Une
mpl
oym
ent R
ate
Receives Public Subsidy No Support
Men, 30-39
0.00
0.02
0.04
0.06
0.08
0.10
0.12
0.14
0.16
0.18
0.20
1996 1997 1998 1999 2000 2001
Year
Une
mpl
oym
ent R
ate
Receives Public Subsidy Receives Pension No Support
Women, 30-39
0.00
0.02
0.04
0.06
0.08
0.10
0.12
0.14
0.16
0.18
0.20
1996 1997 1998 1999 2000 2001
Year
Une
mpl
oym
ent R
ate
Receives Public Subsidy Receives Pension No Support
Men, 40-49
0.00
0.02
0.04
0.06
0.08
0.10
0.12
0.14
0.16
0.18
0.20
1996 1997 1998 1999 2000 2001
Year
Une
mpl
oym
ent R
ate
Receives Public Subsidy Receives Pension No Support
Women, 40-49
0.00
0.02
0.04
0.06
0.08
0.10
0.12
0.14
0.16
0.18
0.20
1996 1997 1998 1999 2000 2001
Year
Une
mpl
oym
ent R
ate
Receives Public Subsidy Receives Pension No Support
Source: China Urban Labor Survey (Five City Urban Hukou Sample).

43
Figure 4 (Continued)
Share of Unemployed Receiving Formal Support By Gender and Age Cohort
Men, 50-54
0.00
0.02
0.04
0.06
0.08
0.10
0.12
0.14
0.16
0.18
0.20
1996 1997 1998 1999 2000 2001
Year
Une
mpl
oym
ent R
ate
Receives Public Subsidy Receives Pension No Support
Women, 50-54
0.00
0.02
0.04
0.06
0.08
0.10
0.12
0.14
0.16
0.18
0.20
1996 1997 1998 1999 2000 2001
Year
Une
mpl
oym
ent R
ate
Receives Public Subsidy Receives Pension No Support
Men, 55-59
0.00
0.02
0.04
0.06
0.08
0.10
0.12
0.14
0.16
0.18
0.20
1996 1997 1998 1999 2000 2001
Year
Une
mpl
oym
ent R
ate
Receives Public Subsidy Receives Pension No Support
Women, 55-59
0.00
0.02
0.04
0.06
0.08
0.10
0.12
0.14
0.16
0.18
0.20
1996 1997 1998 1999 2000 2001
Year
Une
mpl
oym
ent R
ate
Receives Public Subsidy Receives Pension No Support
Source: China Urban Labor Survey (Five City Urban Hukou Sample).

44
Figure 5
Share of Out-of-the-Labor-Force Receiving Public Subsidies and Pensions By Gender and Age Cohort
Men, 16-29
0.00
0.05
0.10
0.15
0.20
0.25
0.30
0.35
0.40
1996 1997 1998 1999 2000 2001
Year
Shar
e O
ut o
f Lab
or F
orce
Receives Public Subsidy No Support
Women, 16-29
0.00
0.05
0.10
0.15
0.20
0.25
0.30
0.35
0.40
1996 1997 1998 1999 2000 2001
Year
Shar
e O
ut o
f Lab
or F
orce
Receives Public Subsidy No Support Men, 30-39
0.00
0.05
0.10
0.15
0.20
0.25
1996 1997 1998 1999 2000 2001
Year
Shar
e O
ut o
f Lab
or F
orce
Receives Public Subsidy Receives Pension No Support
Women, 30-39
0.00
0.05
0.10
0.15
0.20
0.25
1996 1997 1998 1999 2000 2001
Year
Shar
e O
ut o
f Lab
or F
orce
Receives Public Subsidy Receives Pension No Support Men, 40-49
0.00
0.10
0.20
0.30
0.40
0.50
0.60
1996 1997 1998 1999 2000 2001
Year
Shar
e O
ut o
f Lab
or F
orce
Receives Public Subsidy Receives Pension No Support
Women, 40-49
0.00
0.10
0.20
0.30
0.40
0.50
0.60
1996 1997 1998 1999 2000 2001
Year
Shar
e O
ut o
f Lab
or F
orce
Receives Public Subsidy Receives Pension No Support Source: China Urban Labor Survey (Five City Urban Hukou Sample).

45
Figure 5 (Continued)
“Out of the Labor Force” By Type of Formal Support
Men, 50-54
0.00
0.10
0.20
0.30
0.40
0.50
0.60
0.70
0.80
0.90
1.00
1996 1997 1998 1999 2000 2001
Year
Shar
e O
ut o
f Lab
or F
orce
Receives Public Subsidy Receives Pension No Support
Women, 50-54
0.00
0.10
0.20
0.30
0.40
0.50
0.60
0.70
0.80
0.90
1.00
1996 1997 1998 1999 2000 2001
Year
Shar
e O
ut o
f Lab
or F
orce
Receives Public Subsidy Receives Pension No Support Men, 55-59
0.00
0.10
0.20
0.30
0.40
0.50
0.60
0.70
0.80
0.90
1.00
1996 1997 1998 1999 2000 2001
Year
Shar
e O
ut o
f Lab
or F
orce
Receives Public Subsidy Receives Pension No Support
Men, 55-59
0.00
0.10
0.20
0.30
0.40
0.50
0.60
0.70
0.80
0.90
1.00
1996 1997 1998 1999 2000 2001
Year
Shar
e O
ut o
f Lab
or F
orce
Receives Public Subsidy Receives Pension No Support
Source: China Urban Labor Survey (Five City Urban Hukou Sample).

46
Table 1 Summary Statistics for CULS Sample Cities (2001)
Unit Shanghai Wuhan Shenyang Xian Fuzhou Urban population (rank) million 9.8 (1) 4.5 (4) 4.0 (6) 2.6 (10) 1.2 (32) GDP per capita Yuan 40788 17882 21736 13409 30776 Population density persons/km2 2382 893 1395 2037 1474 SOE share of industrial outputa percent 52 63 67 78 33 SOE profitabilityb Yuan 16 11 7 6 17 Mean annual wage Yuan 26169 11314 11615 11164 13511
Unless otherwise noted, data are for residents of urban districts only. aProvincial aggregate for industrial enterprises with annual sale of over 5 million yuan in 2000; b1991-1997 provincial average profits per 100 yuan assets. Sources: SSB, China Urban Yearbook 2002; SSB, China Statistical Yearbook 2002.

47
Labor Force Participation Rate (Percent)Jan-96 Nov-01 Change Jan-96 Nov-01 Change
Full Sample 7.2 12.9 5.7 82.7 74.5 -8.2
By City:Shanghai 5.1 10.7 5.7 81.0 74.1 -6.9Wuhan 9.2 17.2 7.9 78.2 74.0 -4.2Shenyang 11.4 14.5 3.1 75.9 75.5 -0.5Fuzhou 5.8 10.0 4.2 77.6 78.1 0.5Xian 7.6 11.3 3.7 77.6 76.6 -1.0
By Demographic Group:Men (16 to 60) 6.3 11.4 5.2 92.6 85.7 -6.9 <30 12.9 18.3 5.4 93.5 92.8 -0.7 30 to 40 7.1 9.2 2.0 94.4 92.4 -2.0 40 to 50 3.9 10.4 6.5 96.9 89.0 -8.0 50 to 55 2.5 11.5 9.0 85.7 82.5 -3.2 55 to 60 0.8 6.0 5.2 76.4 56.4 -20.0
Women (16 to 60) 8.2 14.9 6.6 73.4 62.8 -10.6 <30 14.3 13.2 -1.1 84.6 87.3 2.7 30 to 40 9.8 15.5 5.7 89.2 82.3 -6.9 40 to 50 4.6 17.2 12.5 81.5 66.7 -14.8 50 to 55 3.4 9.1 5.7 42.3 33.4 -8.9 55 to 60 2.3 11.3 9.0 19.1 15.8 -3.2
By Education Level:Primary school 6.8 17.5 10.6 49.6 44.9 -4.7Lower secondary school 10.9 18.5 7.6 78.2 61.8 -16.4Upper secondary school 6.9 14.1 7.1 88.2 78.8 -9.4Post-secondary education 1.7 5.0 3.3 92.4 90.0 -2.4
By Ownership Sector: 1
Government or Party 3.9 0.0 -3.9 96.0 89.4 -6.6Wholly state-owned 1.6 10.0 8.4 99.6 73.6 -26.0Majority state-owned 1.5 9.8 8.2 98.6 81.8 -16.8Collective 2.3 7.4 5.1 96.0 80.8 -15.2Foreign-invested 6.3 6.6 0.3 95.5 92.5 -3.1Private 19.5 8.4 -11.0 91.1 91.2 0.1Other 5.3 1.9 -3.4 96.7 86.1 -10.6
1For individuals who are not currently working we use sector of most recent job.
Table 2Unemployment Rate and Labor Force Participation Rate, January 1996 and November 2001
(All Individuals Age 16 to 60)Unemployment Rate (Percent)

48
GenderModel 1 2 3 4 5 6 7 8Month-Year Jan-96 Nov-01 Jan-96 Nov-01 Jan-96 Nov-01 Jan-96 Nov-01DepVar In LF? In LF? Unemp? Unemp? In LF? In LF? Unemp? Unemp?
30≤Age<40 0.011 0.011 -0.032 -0.079 0.067 -0.039 -0.030 0.004(0.014) (0.026) (0.009) (0.016) (0.028) (0.042) (0.013) (0.027)
40≤Age<50 0.041 -0.023 -0.060 -0.082 -0.006 -0.190 -0.076 0.001(0.013) (0.024) (0.010) (0.018) (0.031) (0.039) (0.014) (0.026)
50≤Age<55 -0.070 -0.089 -0.046 -0.062 -0.428 -0.503 -0.054 -0.061(0.030) (0.036) (0.008) (0.018) (0.045) (0.038) (0.012) (0.035)
55≤Age<60 -0.159 -0.378 -0.051 -0.079 -0.618 -0.647 -0.058 -0.045(0.042) (0.050) (0.006) (0.020) (0.037) (0.027) (0.009) (0.054)
0.005 0.035 0.005 0.065 0.069 0.003 0.025 -0.046(0.018) (0.031) (0.022) (0.044) (0.036) (0.060) (0.028) (0.047)
0.028 0.088 -0.026 0.015 0.184 0.159 -0.018 -0.087(0.017) (0.031) (0.019) (0.037) (0.034) (0.057) (0.025) (0.050)
0.056 0.141 -0.059 -0.065 0.216 0.303 -0.071 -0.174(0.012) (0.022) (0.013) (0.031) (0.023) (0.041) (0.014) (0.031)
Wuhan -0.056 -0.064 0.001 0.056 -0.075 -0.011 0.060 0.059(0.018) (0.022) (0.012) (0.022) (0.030) (0.031) (0.021) (0.028)
Shenyang -0.049 -0.020 0.019 0.002 -0.090 -0.020 0.055 0.065(0.019) (0.022) (0.014) (0.021) (0.030) (0.033) (0.023) (0.031)
Fuzhou -0.013 0.046 -0.011 -0.009 -0.131 -0.011 0.004 -0.028(0.017) (0.017) (0.012) (0.020) (0.033) (0.033) (0.018) (0.025)
Xian -0.008 -0.002 -0.001 0.019 -0.080 0.003 0.042 -0.019(0.016) (0.020) (0.013) (0.022) (0.031) (0.033) (0.022) (0.026)
Model Chi-Square 226.5 201.3 74.9 69.3 496.1 469.3 95.6 78.1Observations 3144 2945 2787 2565 3417 3121 2397 2026Pseudo-R2 0.135 0.147 0.103 0.067 0.202 0.222 0.091 0.074
Lower Secondary School
Upper Secondary School
Post-Secondary School
Table 3Determinants of Unemployment and Labor Force Participation by Gender,
January 1996 and November 2001(Marginal Effects)
Men Women

49
GTE 16 & LT 30
GTE 30 & LT 40
GTE 40 & LT 50
GTE 50 & LT 55
GTE 55 & LT 60
Total
Men Enterprise Restructuring 18.3 37.7 46.6 16.4 0.7 29.0Other Involuntary Separations 17.8 23.1 17.9 10.0 2.7 15.8Voluntary Separations 53.0 29.7 23.9 10.7 2.7 25.9Retired 1.0 3.8 9.7 61.4 93.9 25.5Of Which: Early Retirement 1.0 4.2 9.4 59.3 72.1 22.1 Of Which: Involuntary 1.0 3.3 6.5 39.3 52.4 15.6Other 9.9 5.7 2.0 1.4 0.0 3.9
Non-Voluntary Non-Mandatory Job Separation 37.1 64.2 71.0 65.7 55.8 60.3
WomenEnterprise Restructuring 18.1 47.3 21.3 0.5 0.0 21.8Other Involuntary Separations 12.7 23.1 10.7 0.5 0.0 11.4Voluntary Separations 66.1 23.5 7.7 0.5 0.0 19.0Retired 0.0 2.4 59.4 98.0 96.8 45.7Of Which: Early Retirement 0.0 2.4 57.5 88.1 34.0 39.1 Of Which: Involuntary 0.0 1.7 43.2 77.7 25.5 31.1Other 3.2 3.7 0.9 0.5 3.2 2.0
Non-Voluntary Non-Mandatory Job Separation 30.8 72.1 75.2 78.7 25.5 64.4
Enterprise restructuring: worker lost job after work-unit closed, went bankrupt, was merged with another firm or reorganized.Other involuntary: involuntarily dismissed or laid-off for reasons other than restructuring of the firm.Early retirement: worker retired through an early-retirement program at the firm. Early retirement is involuntary if the worker'schoice was to retire or be fired.Non-mandatory job separation refers to loss of a job not suject to mandatory retirement provisions.
Reasons for Job Separation by Gender and Age (in Percent)
Reason for Job Separation
Are Job Separations Voluntary?Table 4

50
in Jan 96 in Nov 01Total 10.6 22.1 81.6 68.7 56.1
By CityShanghai 2.1 18.9 91.6 74.6 87.4Wuhan 13.6 19.5 76.9 68.7 46.2Shenyang 23.1 27.7 59.9 53.5 39.1Fuzhou 5.7 18.9 79.5 67.6 48.7Xian 23.3 38.2 81.0 64.6 57.5
MenMen (16 to 60) 11.1 20.3 84.5 74.3 46.4 <30 10.1 16.0 77.8 66.3 57.4 30 to 40 10.0 21.1 81.7 76.3 59.9 40 to 50 13.3 22.8 87.0 72.7 73.2 50 to 55 11.2 17.3 92.3 82.2 73.1 55 to 60 7.5 24.4 90.1 79.0 60.3
WomenWomen (16 to 60) 12.3 26.2 75.7 61.0 45.3 <30 11.0 21.1 64.0 64.7 45.6 30 to 40 14.3 25.7 77.0 67.8 54.5 40 to 50 12.0 30.9 82.4 61.4 59.7 50 to 55 10.7 24.6 75.6 42.2 61.4 55 to 60 1.7 21.1 55.8 24.8 52.2
By Education Level:Primary school 11.8 24.5 70.3 49.0 28.3Lower secondary school 14.6 26.6 76.1 54.0 45.8Upper secondary school 10.4 22.4 81.6 68.3 58.0Post-secondary education 5.7 18.1 90.8 82.3 79.4
By Ownership Sector: 1
Government or Party 1.9 22.8 89.7 78.9 82.3Wholly state-owned 13.8 23.8 88.3 82.2 77.5Majority state-owned 9.2 31.1 87.6 80.8 68.5Collective 11.7 22.9 78.5 66.7 67.0Foreign-invested 1.3 14.0 72.2 73.0 52.5Private 6.3 11.3 35.1 25.1 19.2Other 17.2 24.3 75.5 42.4 27.6
Note: In the first two columns we report the percent of individuals employed between 1996 and 2001 who report wage arrears and the percent of individuals who have ever had health insurance who report health insurance arrears. For those individuals whose
Wage and Health Arrears of Employed Workers Age 16 to 60Table 5
(as a Percent of Workers in Each Category)
Employer Provided Health InsuranceHealth Insurance
ArrearsWage Arrears
Percent of All Individuals Age 16 to 60 w/Health
Insurance in 2001

51
Number Who are Formal Retirees
Individuals Not Working Who Are Formally
Retired (Percent)
Retired Experiencing
Positive Pension Arrears
(Percent)
Health Insurance Coverage Rate
(Percent of Formally Retired)
Of Which, Percent Experiencing Health
Expenditure Reimbursement
Arrears
Full Sample 2532 74.7 10.6 73.9 29.9
By CityShanghai 672 82.5 4.7 97.6 18.1Wuhan 491 74.1 12.8 38.4 60.4Shenyang 489 75.8 26.4 42.8 77.6Fuzhou 380 68.3 4.5 57.9 42.5Xian 500 73.9 15.9 71.6 34.8
Total Men (Retired and Over 40) 1020 77.0 10.4 76.3 26.2Age GTE 40 & LT 50 9 4.1 5.0 50.4 29.0Age GTE 50 & LT 55 53 51.5 15.3 66.4 38.1Age GTE 55 & LT 60 110 82.1 15.3 70.9 18.6Age GTE 60 & LT 70 469 97.9 10.2 79.7 26.6Age GTE 70 379 97.9 7.8 78.0 26.5
Total Women (Retired and Over 40) 1512 73.1 10.7 72.3 32.4Age GTE 40 & LT 50 169 34.8 6.3 80.5 21.9Age GTE 50 & LT 55 254 87.9 11.1 73.6 26.0Age GTE 55 & LT 60 242 92.7 13.3 74.9 34.7Age GTE 60 & LT 70 545 89.2 12.7 66.5 40.8Age GTE 70 302 71.7 8.5 71.2 35.0
By Education LevelPrimary school 529 80.5 12.6 67.6 38.2Lower secondary school 1078 71.5 11.3 70.4 33.9Upper secondary school 542 67.4 9.8 80.2 23.4Post-secondary education 383 90.8 6.8 83.6 19.6
Table 6Benefits Shocks Experienced by Retired Workers

52
Employed Within 12 Months
Employed by Nov. 2001
Mean Percent Change Percent Lower Percent Higher
Total 34.8 44.7 2.1 39.2 55.0
By CityShanghai 42.1 49.7 0.3 42.9 52.9Wuhan 28.6 38.3 2.6 35.1 56.0Shenyang 28.5 39.6 0.9 41.3 53.7Fuzhou 41.8 51.4 19.3 34.0 59.9Xian 30.2 42.8 3.6 40.9 52.8
By Demographic Group:Men (16 to 60) 42.1 52.2 4.6 36.3 58.7 <30 53.4 68.7 20.1 22.1 71.4 30 to 40 51.5 65.6 7.0 32.8 61.6 40 to 50 44.3 52.4 -5.8 44.4 52.1 50 to 55 27.8 31.9 -13.3 52.4 42.9 55 to 60 12.2 15.5 -14.6 52.2 43.5
Women (16 to 60) 29.0 38.7 -0.4 42.4 51.4 <30 44.1 63.4 9.1 32.0 60.5 30 to 40 36.8 49.7 9.7 37.5 55.9 40 to 50 22.1 28.4 -5.4 48.9 45.3 50 to 55 22.0 24.4 -38.0 63.3 34.7 55 to 60 9.4 10.4 -5.6 70.0 20.0
By Reason for Job SeparationRestructuring 38.0 50.5 16.7 36.4 62.1Other Involuntary 31.7 43.5 -2.8 52.2 44.8Voluntary Separation 62.3 70.7 25.6 24.4 69.7Retirement 17.2 20.4 -22.3 54.5 44.7Other 57.4 67.6 39.6 33.3 61.9
By Education Level:Primary school 24.7 32.7 -33.0 59.5 33.3Lower secondary school 27.7 36.8 -2.2 42.7 51.5Upper secondary school 37.9 48.7 5.3 38.7 55.8Post-secondary education 51.6 60.9 7.9 28.7 64.9
By Ownership Sector: 1
Government or Party 60.3 61.9 36.6 27.0 64.9Wholly state-owned 29.1 36.8 -3.8 46.9 50.9Majority state-owned 30.6 41.4 -1.4 43.8 52.8Collective 31.3 38.8 10.1 37.6 59.0Foreign-invested 57.4 66.2 -15.5 41.5 48.8Private 51.2 59.9 2.9 30.6 55.3Other 23.5 40.0 7.2 14.3 57.1
As a Percent of All Job Separations As a Percent of Re-EmployedNominal Wage Comparison
Table 7Job Separations, Unemployment Spell Duration, and Changes
in Nominal Wages of Re-Employed(For Individuals Between 16 and 60 Years of Age)

53
Government or Party 68 (30) 26.5 4.4 4.4 10.3 2.9 8.8 1.5 41.2
Wholly-State-Owned Enterprise 944 (50) 1.8 8.5 1.2 7.0 1.8 14.1 1.2 64.5
Majority-State-Owned Enterprise 247 (51) 0.8 2.0 11.7 6.9 2.4 14.2 0.4 61.5
Collective Enterprises 673 (45) 1.3 1.2 0.4 14.7 1.3 16.9 1.8 62.3
Foreign Invested Enterprise 66 (71) 0.0 4.5 0.0 6.1 33.3 16.7 0.0 39.4
Individual or Private Enterprise 427 (72) 0.9 3.5 0.9 4.7 1.9 41.2 0.9 45.9
Other 45 (34) 0.0 0.0 4.4 4.4 0.0 17.8 20.0 53.3
Total 2470 (50) 2.0 4.6 2.1 8.7 2.6 19.6 1.5 58.9
Foreign Invested
Enterprise
Individual or Private
Enterprise Other
Table 8Mobility Across Ownership Sectors Among Job Changers (January 1996 to November 2001)
Still Out of Work in
November 2001
Previous Sector
New Sector (As a Percent of Separations from Previous Sector)
Number of Job Separations
(percent employed in sector)
Government or Party
Wholly-State-Owned
Enterprise
Majority-State-Owned
EnterpriseCollective Enterprise

54
Share Using Each Type of Support for Each Job Separation Reason Involuntary Voluntary Retired Total
Men Total Job Separations 368 128 231 727 Pension 0.8 0.0 93.5 30.1 Xiagang Subsidy 24.7 7.0 1.7 14.3 Unemployment Payment 6.3 1.6 0.0 3.4 Social Welfare Funds 1.6 4.7 0.0 1.7 Savings 23.1 25.8 2.2 16.9 Income of Other HH Member 33.7 53.9 1.3 27.0 Help from Other Friends and Family 2.7 2.3 0.4 1.9 Income from Temporary Job 6.3 3.1 0.4 3.9 Loans 0.5 0.0 0.4 0.4 Other 0.3 1.6 0.0 0.4
Women Total Job Seperations 387 154 584 1125 Pension 1.0 0.0 92.1 42.7 Xiagang Subsidy 21.5 5.3 2.0 10.1 Unemployment Payment 2.3 2.0 0.0 1.2 Social Welfare Fund 1.3 5.3 0.2 1.4 Savings 12.4 7.3 0.9 6.4 Income of Other HH Member 54.4 70.0 3.9 33.6 Help from Other Friends and Family 1.8 4.7 0.2 1.5 Income from Temporary Job 4.9 4.7 0.7 2.9 Loans 0.3 0.0 0.0 0.1 Other 0.0 0.7 0.0 0.1
Table 9Primary Means of Support When Not Working
By Reason for Leaving Previous Job
Note: We show results for adults who have not yet reached mandatory retirement age. We only report information on individuals who had non-work spells of greater than one month.

55
Number and Gender of Current Out-of-Work Working-Age Household MembersIncome Components (Per Capita) 0 1 Man 1 Woman Two or More All
Age>=16 & Age<30Earned Income (Salaries + Bonus) 7564 1468 5450 1836 6511Pension and Disability Income (Monthly) 2939 2731 1683 896 2587Public Subsidies 51 221 284 282 118Lump Sum Severance 176 347 53 197 163Net Private Transfers Received 148 -71 210 -7 140IPC (Excluding Lump Sum Severance) 10702 4349 7628 3007 9357IPC (Including Lump Sum Severance) 10878 4695 7680 3204 9520
Non-Housing Consumption 8503 6457 6471 3564 7756
Age>=30 & Age<40Earned Income (Salaries + Bonus) 7918 2199 3687 373 5821Pension and Disability Income (Monthly) 1863 2820 1333 991 1770Public Subsidies 103 447 298 449 207Lump Sum Severance 107 404 468 469 247Net Private Transfers Received -32 -51 -119 13 -51IPC (Excluding Lump Sum Severance) 9852 5416 5199 1826 7747IPC (Including Lump Sum Severance) 9959 5819 5667 2296 7994
Non-Housing Consumption 6675 4424 5267 3431 5892
Age>=40 & Age<50Earned Income (Salaries + Bonus) 7499 2618 4618 1005 5320Pension and Disability Income (Monthly) 1085 953 1178 1088 1098Public subsidies 239 699 401 735 398Lump Sum Severance 249 661 270 1551 455Net Private Transfers Received -50 167 -131 56 -37IPC (Excluding Lump Sum Severance) 8774 4437 6066 2884 6779IPC (Including Lump Sum Severance) 9023 5098 6336 4435 7234
Non-Housing Consumption 7478 5497 6974 3986 6691
Age>=50 & Age<60Earned Income (Salaries + Bonus) 10593 5069 9351 2808 7155Pension and Disability Income (Monthly) 2408 3270 2771 3451 2940Public Subsidies 164 352 133 399 252Lump Sum Severance 151 73 303 195 194Net Private Transfers Received -171 -116 -208 1 -123IPC (Excluding Lump Sum Severance) 12994 8575 12047 6659 10225IPC (Including Lump Sum Severance) 13145 8648 12351 6854 10419
Non-Housing Consumption 8727 6111 7659 5636 7143
Note: Households are broken into separate groups based on the demographic category of the oldest working-age adult in the household.
Table 10Household Annual Per Capita Income and Consumption By Demographic Group of
Oldest Working Age Adult and Number of Working Age Household Members Out of Work

56
Working Unemployed Out AllTotal 19.4 47.8 26.6 24.0
By CityShanghai 17.4 45.5 20.9 20.6Wuhan 25.1 52.2 32.5 30.5Shenyang 18.8 44.8 31.3 24.7Fuzhou 15.2 50.2 23.5 19.7Xian 19.1 45.6 31.4 24.2
By Demographic Group:Men (16 to 60) 19.5 51.6 36.7 25.0 <30 12.1 34.7 37.0 17.8 30 to 40 13.3 59.6 46.7 19.6 40 to 50 28.8 62.1 60.6 35.1 50 to 55 20.2 63.0 33.3 26.4 55 to 60 7.5 10.1 16.3 11.5
Women (16 to 60) 19.4 44.1 22.9 23.0 <30 6.3 21.5 26.3 10.5 30 to 40 19.7 47.3 35.6 26.0 40 to 50 29.7 54.0 33.3 33.7 50 to 55 11.7 48.3 15.6 15.5 55 to 60 20.9 8.4 10.8 12.2
By Education Level:Primary school 23.4 37.6 22.2 23.8Lower secondary school 27.4 50.3 26.6 29.8Upper secondary school 20.6 46.8 29.8 25.3Post-secondary education 7.9 37.4 21.8 10.0
By Ownership Sector: 1
Government or Party 8.1 - 10.7 8.4Wholly state-owned 19.9 51.9 25.5 23.9Majority state-owned 18.0 64.5 32.8 24.7Collective 16.4 51.6 24.9 20.2Foreign-invested 9.6 50.3 25.9 12.9Private 25.4 43.4 36.8 27.5Other 31.5 33.3 60.5 35.5
Table 11How Does Your Economic Condition Compare with Five Years Ago?
Sectors of employment are current sectors for currently employed individuals and most recent sector for individuals who are not currently working.
Percent of Working Age Adults (16 to 60) Answering "Worse"
Work Status in November 2001

57
Working Unemployed Out AllTotal 47.5 83.0 50.3 51.7
By CityShanghai 40.5 78.5 41.4 43.7Wuhan 60.4 89.3 58.7 63.7Shenyang 50.0 82.4 61.1 56.3Fuzhou 30.4 75.7 42.6 36.6Xian 54.7 83.0 55.0 57.3
By Demographic Group:Men (16 to 60) 47.8 83.1 61.1 53.1 <30 46.8 73.8 74.4 53.4 30 to 40 45.9 92.3 68.7 51.5 40 to 50 55.9 89.9 89.3 62.5 50 to 55 41.2 81.9 59.6 48.1 55 to 60 28.3 55.8 33.4 31.5
Women (16 to 60) 47.1 82.9 46.2 50.3 <30 41.4 71.6 59.9 47.1 30 to 40 52.0 87.2 70.8 59.8 40 to 50 53.6 87.4 62.4 60.5 50 to 55 25.0 93.0 33.9 33.1 55 to 60 36.1 30.3 24.7 26.5
By Education Level:Primary school 59.0 75.8 49.5 55.1Lower secondary school 55.0 84.0 51.1 57.1Upper secondary school 49.9 83.3 51.1 53.8Post-secondary education 33.0 79.1 40.3 35.1
By Ownership Sector: 1
Government or Party 30.1 - 46.6 31.6Wholly state-owned 47.3 85.2 48.0 50.5Majority state-owned 42.6 92.4 52.0 48.5Collective 44.3 79.6 51.4 47.9Foreign-invested 32.5 72.1 30.7 34.5Private 56.8 87.8 60.5 59.2Other 71.5 100.0 76.4 72.5
Sectors of employment are current sectors for currently employed individuals and most recent sector for individuals who are not currently working.
Work Status in November 2001
Table 12Are You Satistied with Your Current Standard of Living?
Share of Working Age Adults (16 to 60) Answering "Unsatisfied" or "Very Unsatisfied"

DAVIDSON INSTITUTE WORKING PAPER SERIES - Most Recent Papers The entire Working Paper Series may be downloaded free of charge at: www.wdi.bus.umich.edu
CURRENT AS OF 10/31/03 Publication Authors Date No. 628: How has Economic Restructuring Affected China’s Urban Workers?
John Giles, Albert Park, Feng Cai Oct. 2003
No. 627: The Life Cycle of Government Ownership Jiahua Che Oct. 2003 No. 626: Blocked Transition And Post-Socialist Transformation: Serbia in the Nineties
Silvano Bolcic Oct. 2003
No. 625: Generalizing the Causal Effect of Fertility on Female Labor Supply
Guillermo Cruces and Sebastian Galiani
Oct. 2003
No. 624: The Allocation and Monitoring Role of Capital Markets: Theory and International Evidence
Solomon Tadesse Oct. 2003
No. 623: Firm-Specific Variation and Openness in Emerging Markets Kan Li, Randall Morck, Fan Yang and Bernard Yeung
Oct. 2003
No. 622: Exchange Rate Regimes and Volatility: Comparison of the Snake and Visegrad
Juraj Valachy and Evžen Kočenda
Oct. 2003
No. 621: Do Market Pressures Induce Economic Efficiency?: The Case of Slovenian Manufacturing, 1994-2001
Peter F. Orazem and Milan Vodopivec
Oct. 2003
No. 620: Compensating Differentials in Emerging Labor and Housing Markets: Estimates of Quality of Life in Russian Cities
Mark C. Berger, Glenn C. Blomquist and Klara Sabirianova Peter
Oct. 2003
No. 619: Are Foreign Banks Bad for Development Even If They Are Efficient? Evidence from the Indian Banking Sector
Sumon Bhaumik and Jenifer Piesse
Oct. 2003
No. 618: The Echo of Job Displacement Marcus Eliason and Donald Storrie
Oct. 2003
No. 617: Deposit Insurance During Accession EU Accession Nikolay Nenovsky and Kalina Dimitrova
Oct. 2003
No. 616: Skill-Biased Transition: The Role of Markets, Institutions, and Technological Change
Klara Sabirianova Peter Oct. 2003
No. 615: Initial Conditions, Institutional Dynamics and Economic Performance: Evidence from the American States
Daniel Berkowitz and Karen Clay Sept. 2003
No. 614: Labor Market Dynamics and Wage Losses of Displaced Workers in France and the United States
Arnaud Lefranc Sept. 2003
No. 613: Firm Size Distribution and EPL in Italy Fabiano Schivardi and Roberto Torrini
Sept. 2003
No. 612: The Effect of Employee Involvment on Firm Performance: Evidence from an Econometric Case Study
Derek C. Jones and Takao Kato Sept. 2003
No. 611: Working Inflow, Outflow, and Churning Pekka Ilmakunnas and Mika Maliranta
Sept. 2003
No. 610: Signaling in The Labor Market: New Evidence On Layoffs, and Plant Closings
Nuria Rodriguez-Planas Sept. 2003
No. 609: Job Flows and Establishment Characteristics: Variations Across U.S. Metropolitan Areas
R. Jason Faberman Sept. 2003
No. 608: Dowry and Intrahousehold Bargaining: Evidence from China Philip H. Brown Sept. 2003 No. 607: Policy Regime Change and Corporate Credit in Bulgaria: Asymmetric Supply and Demand Responses
Rumen Dobrinsky and Nikola Markov
Sept. 2003
No. 606: Corporate Performance and Market Structure During Transition in Hungary
László Halpern and Gábor Kõrösi Aug. 2003
No. 605: Culture Rules: The Foundations of the Rule of Law and Other Norms of Governance
Amir N. Licht, Chanan Goldschmidt, and Shalom H. Schwartz
Aug. 2003
No. 604: Institutional Subversion: Evidence from Russian Regions Irina Slinko, Evgeny Yakovlev, and Ekaterina Zhuravskaya
Aug. 2003
No. 603: The Effects of Privitzation and International Competitive Pressure on Firms’ Price-Cost Margins: Micro Evidence from Emerging Economics
Jozef Konings, Patrick Van Cayseele and Frederic Warzynski
Aug. 2003