how federal, state, and institutional policies matter usw 31, november 19, 2014 theda skocpol
TRANSCRIPT

How Federal, State, and Institutional Policies Matter
USW 31, November 19, 2014
Theda Skocpol

DEBATING THE FUTURE OF AID TO HIGHER EDUCATION
Attendance is growing, but many students fail to complete college and/or leave with growing debt burdens.
States have reduced support for students and institutions, and for-profit colleges drain taxpayer funds to produce poor results for students.
Congress is now debating renewal and changes to the U.S. Higher Education Act first enacted in 1965.
Bipartisan agreement on simplifying financial aid applications and making information about costs and graduation rates more transparent.
Democrats want to crack down on for-profit colleges, create incentives for states to invest more in public higher education, and perhaps allow student debts to be discharged in bankruptcy.
Conservative Republicans favor steps to reduce college prices and further learning based on mastery of content rather than time in classes.


Source: Michael Hout, Berkeley.
US COLLEGE GRADUATION TREND
0% 10% 20% 30% 40% 50% 60% 70% 80%
Bottomquartile
2ndquartile
3rdquartile
Topquartile
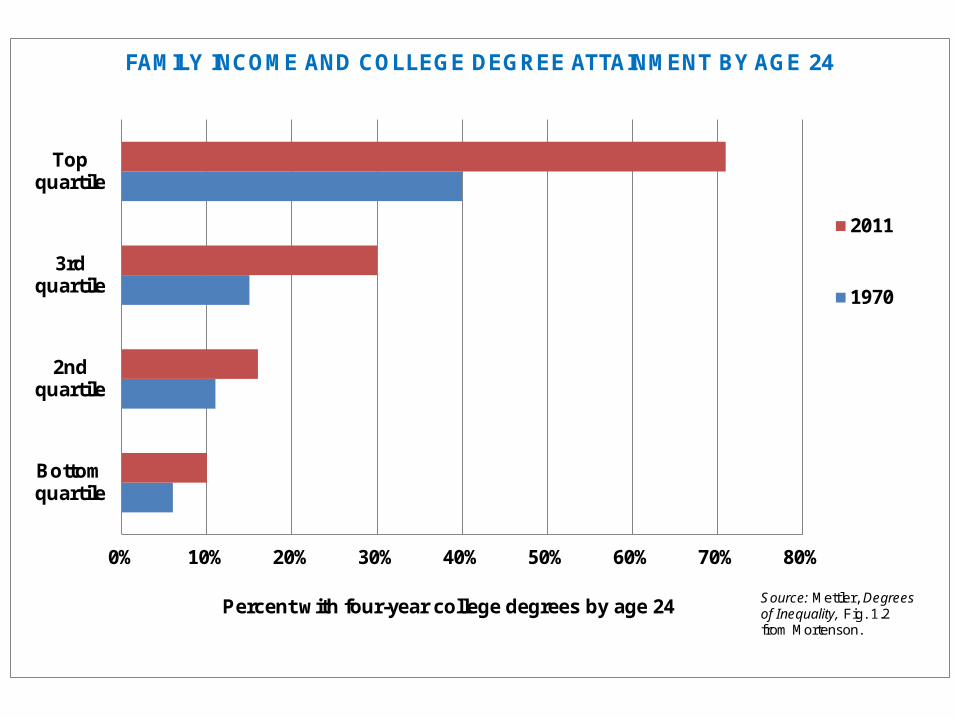
Percent with four-year college degrees by age 24
FAMILY INCOME AND COLLEGE DEGREE ATTAINMENT BY AGE 24
2011
1970
Source: Mettler, Degrees of Inequality, Fig. 1.2 from Mortenson.

0% 20% 40% 60% 80%
Low income
Midde income
High income
INCOME, TEST SCORES, AND ATTAINMENT OF COLLEGE DEGREES
High scores
Middle scores
Low scores
Percentage of students with a four-year degree or more, 2000 Source: Mettler, Degrees of Inequality, Fig. 1.3.

U.S. Higher Ed Policies: From Opportunity to Elite Subsidies
19th-early 20th c.: Morrill Land Grant college system established; federal subsidies to agricultural colleges.
WWII and after: federal research programs spread capacities to many universities and fund faculty projects.
1944: GI Bill offers tuition and family allowances. 1958: National Defense Education Act establishes low-interest
student loans. 1965, 1972: Higher Ed Act and its reauthorization create need-
based grants, Work-Study Program, Pell Grants, and matching grants for states that offered need-based student grants.
After mid-1970s: value of Pell Grants erode as tuitions skyrocket. 1990sff: federal legislation subsidizes/guarantees bank-offered
student loans and offers tax credits to middle-class borrowers. 1990s: Justice Department outlaws agreements to prevent
escalating “merit” offers – unless institutions offer purely need-blind aid (which only the richest can do).

U.S. Higher Education Aid 1965/1972 through 2008:Intended and Unintended Consequences
Higher Ed Act (‘65, ’72) emphasis on need-based student aid via Pell Grants. allows subsidized loans for some in middle class, but not tax credits.
Equal Opportunity Era, 1966-80 Liberal Dems and bipartisan consensus. Sallie Mae created in 1978 to enlarge private loan pool; middle class
access to grants and loans broadened. Pell Grants boosted in this period to broaden opportunity.
Divisions and Contradictory Directions, 1981-94 GOP gained power via Reagan, eventually Congress. Student aid trimmed, Pell Grants not regularly increased -- as tuition
rose 145% from 1980 to 2002 as family incomes rose by only 23%. Bank lending with federal guarantees becomes profitable, and private
interests organize to lobby. By early 1990s, loans for the middle class outpace aid to the needy.

Aid to the Privileged Comes to the Fore, 1995-2007
Supported by more conservative Republicans, subsidies and guarantees to private lenders become more lucrative.
Supported by Democratic President Bill Clinton, tax credits for the middle class and privileged are added to federal college aid.
Grants to needy continue to erode in value, while loans and tax credits allow more privileged students to afford the rising tuitions, especially at selective colleges.
Students end up with high debt burdens when (if) they graduate.

Source: Mettler, Degrees of Inequality
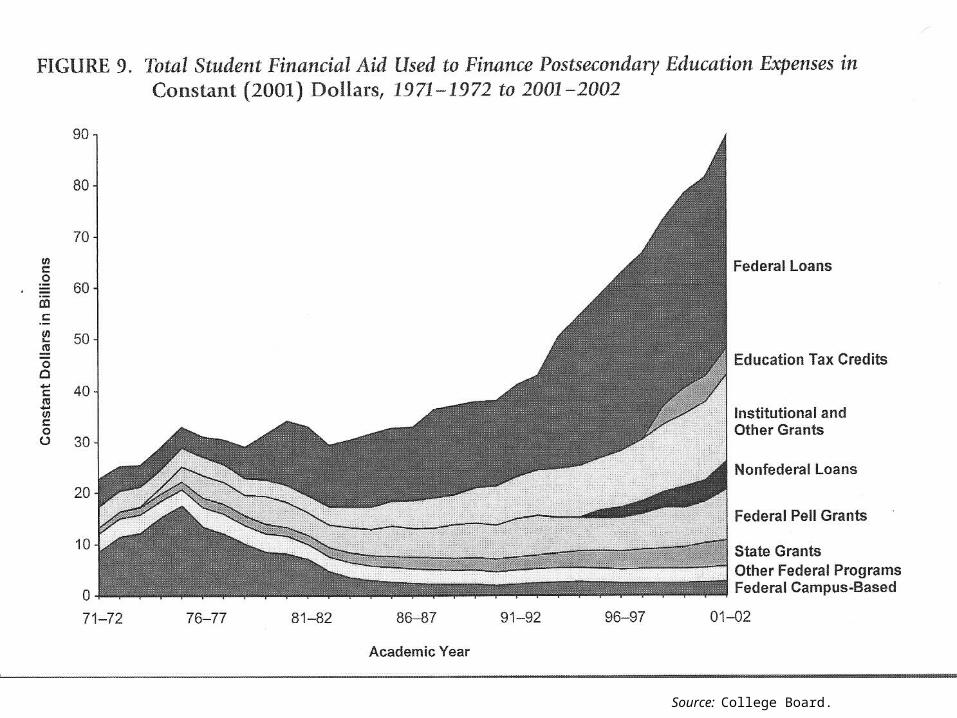
Source: College Board.

Obama Administration Higher Ed Policies
• Remove banks as middlemen with guaranteed profits from student loan programs, and use some of the savings to increase Pell Grants and improve loan terms.
• Expand and improve levels of Pell Grants.
• Give more aid to community colleges – and strengthen their ties to area employers.
• Simplify information about college funding and make it available earlier in high school.
• Push colleges to limit tuition hikes, improve graduation rates, and make more information available about costs, graduation, jobs.
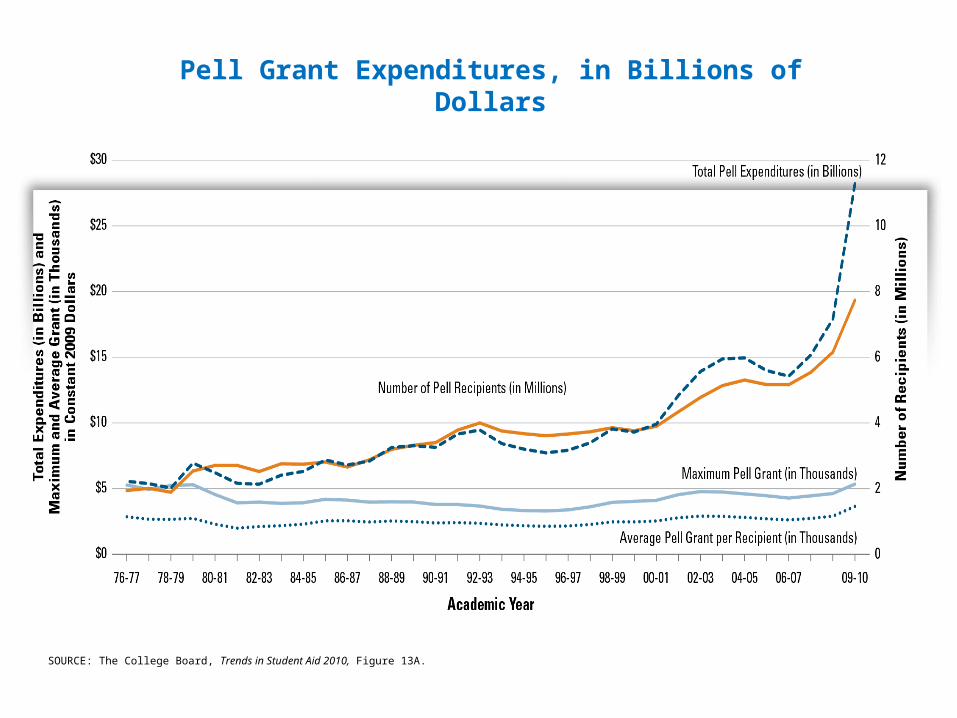
SOURCE: The College Board, Trends in Student Aid 2010, Figure 13A.
Pell Grant Expenditures, in Billions of Dollars

U.S. PELL GRANTS: Recipients and Expenditures, 1976-77 to 2009-10
0
5
10
15
20
25
30
1976
-77
1978
-79
1980
-81
1982
-83
1984
-85
1986
-87
1988
-89
1990
-91
1992
-93
1994
-95
1996
-97
1998
-99
2000
-01
2002
-03
2004
-05
2006
-07
2008
-09
2009
-10
Ex
pe
nd
itu
res
(b
illi
on
s o
f 2
00
9 d
oll
ars
)
0
1
2
3
4
5
6
7
8
9
Mil
lio
ns
of
stu
de
nt
rec
ipie
nts
Source: College Board from U.S. Dept. of Education
Ave. grant in 1976-77 = $2,862 (in 2009$)
Max grant = $5,280
Ave. grant 2009-10 = $3,646 (max $5,350)
Ave. grant 2008-09 = $2,909 (max $4,632)

Undergraduate Student Aid by Source (in Billions), 2009-10
SOURCE: The College Board, Trends in Student Aid 2010, Figure 2A.

Maximum Pell Grant as a Percentage of Tuition and Fees and Room and Board (TFRB),
1990-91 to 2010-11
SOURCE: The College Board, Trends in Student Aid 2010, Figure 13B.
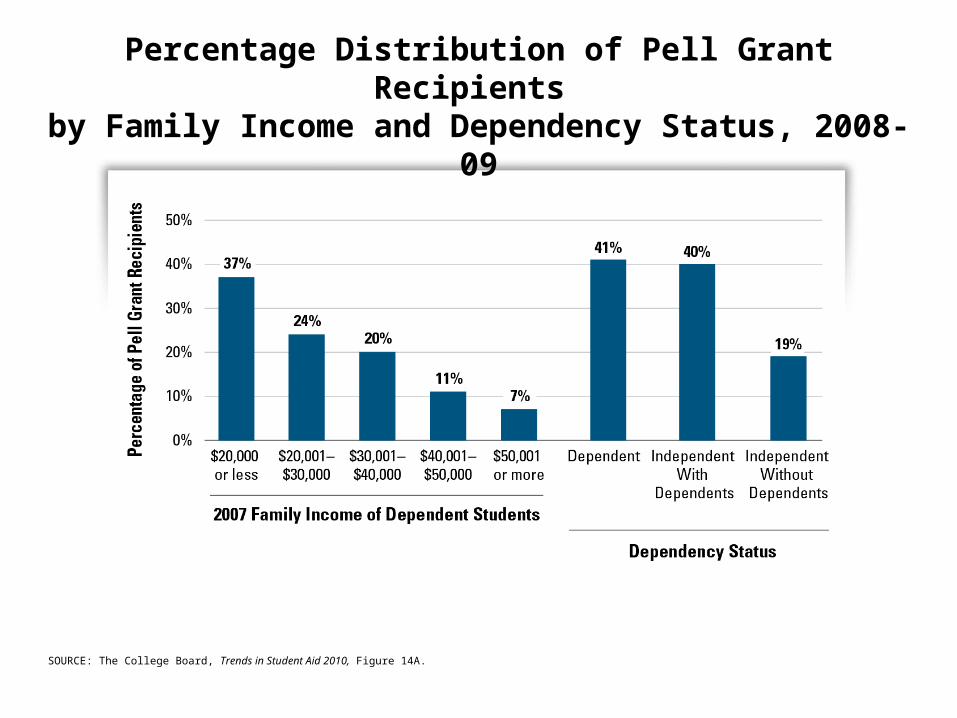
Percentage Distribution of Pell Grant Recipients
by Family Income and Dependency Status, 2008-09
SOURCE: The College Board, Trends in Student Aid 2010, Figure 14A.

Ten-Year Trend in Student Aid and Nonfederal Loans per FTE Used to Finance Postsecondary Education Expenses
in Constant 2009 Dollars, 1999-2000 to 2009-10
SOURCE: The College Board, Trends in Student Aid 2010, Figure 1.

Source: College Board.

Need-Based and
Non-Need-Based
State
Aid
Grants
SOURCE: The College Board, Trends in Student Aid 2010, Figure 15.

State Grant Dollars per Full-Time In-State Undergraduate Student and Percentage Receiving State Grants, by
Dependency Status and Income, Selected States, 2007‑08
SOURCE: The College Board, Trends in Student Aid 2010, Figure 16.

Low-Income Undergraduates at Leading U.S. Universities, 1983-2006(percent receiving Pell Grants)
0% 5% 10% 15% 20% 25% 30% 35% 40%
U of North Carolina
U of Michigan
UCLA
UC Berkeley
Columbia
Cornell
Stanford
Princeton
Yale
Harvard
1983
1993
2004
2006
Source: Journal of Blacks in Higher Education 1/22/08
INSTITUTIONAL FINANCIAL AID
Only super-wealthy, highly endowed universities can afford to be need-blind or give very generous grants to low and middle-income students.
But these universities admit only a tiny proportion of all students and very few from low-income families. Most have not expanded entering classes much or at all.
When private, super-wealthy institutions boost grants to middle-income students, they put pressure on larger public universities to shift aid toward “merit” rather than need-based grants.
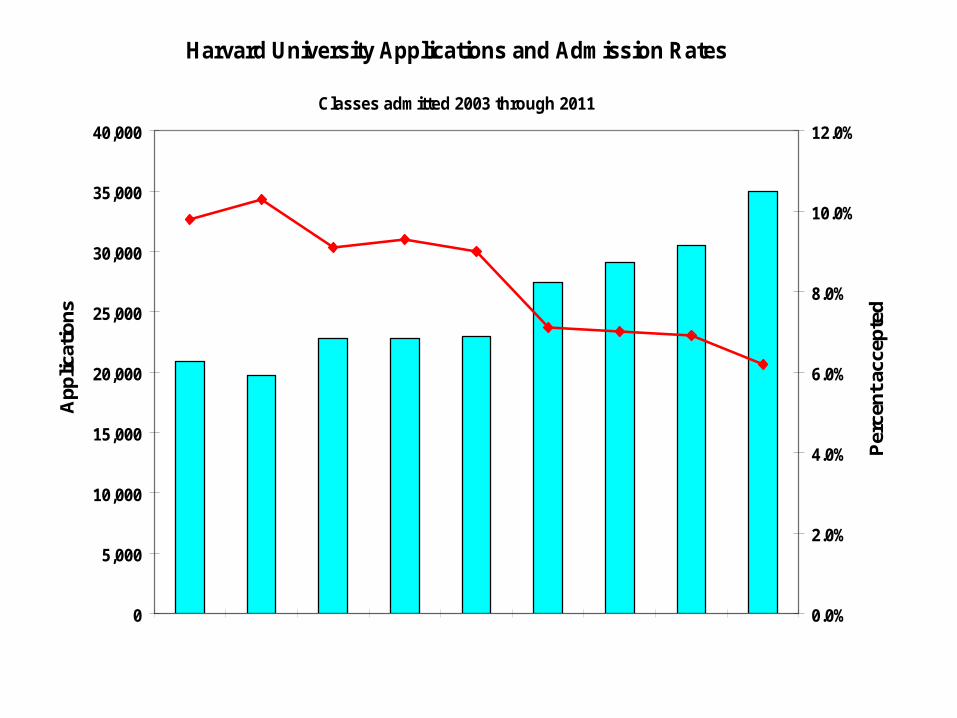
Harvard University Applications and Admission Rates
Classes admitted 2003 through 2011
0
5,000
10,000
15,000
20,000
25,000
30,000
35,000
40,000
1 2 3 4 5 6 7 8 9
App
licat
ions
0.0%
2.0%
4.0%
6.0%
8.0%
10.0%
12.0%
Per
cent
acc
epte
d
2007 2008 2009 2010 2011 2012 2013 2014 2015Class of:
Very generous financial aid, up to $180K per year

ADDITIONAL ISSUES FOR U.S. HIGHER EDUCATION
Future use of racial criteria in admissions, as new challenges reach the Supreme Court.
Role of on-line learning versus physical classrooms – are there inequality questions?
College completion rates -- what can be done to help students finish and earn degrees, especially less privileged students and students enrolled in poorly endowed institutions?