how does population effect how people live?gcorbett/pdfs/cottingham_iii_6.pdf · how does...
TRANSCRIPT

6th Grade Human Geography: Population
How does population effect how people live?
Created by Elisa Cottingham
Fall 2005 Field Placement Unit
ELED 4366 Gary Babiuk

Human Geography: Population Grade Level: 6th
Estimated time required: 5-7 days, 45 minute classes Overview of unit (and why unit is acceptable): Population is an important concept for students to learn about. There are many aspects about population that are around them every day. Some concepts that come along with population are population density, population distribution, rural areas, urban areas, demographers, birth rate, death rate, life expectancy, migration, and push-pull theory. Through the unit on population, the students will focus on the big question “How can population effect the way people live?” through class discussions, small group discussions, creating and using retrieval charts, Venn diagrams, and a final reflection. National Standards to be met during unit: Standard Three: People, Places and Environment:
o Use appropriate resources, data sources… and interpret information such as atlases, databases, charts, graphs and maps.
State Standards: (Wisconsin)
o Describe the movement of people, ideas, diseases, and products throughout the world
(http://www.dpi.state.wi.us/standards/ssa8.html) District Standards: (Superior District Standards)
o Explain the relationship of population distribution to earth’s physical characteristics.
(http://www.superior.k12.wi.us/curriculum/standards/social68.pdf) Overall goals:
• Students will understand the factors that work behind the word “population”. Population in an area doesn’t just happen. There are reasons why people live where they do (push-pull theory) ETC.. Students will become more familiar with using a variety of sources to find information (atlas, encyclopedia, etc). Students will also further develop their communication skills through numerous group discussions and group working activities.

Specific objectives (use action verbs):
• Students will share their ideas through group discussion • Students will utilize sources from the library to find information • Students will fill out chart accordingly • Students will share and discuss their findings with group members • Students will participate in small group discussion • Students will reflect on the week and what they have learned • Students will take part in Jeopardy and give input
Inquiry/focus questions (sub questions): • What causes large population in some areas? • What causes small populations or no population in other areas? • What are some reasons why people migrate to a new place? • How does the geography of a country determine the size of it’s population? • How does the push-pull theory play a role in the process of immigration?
List of resources: Atlas of the World: Geography (Rand McNally) 2003. Editor: Grover, Brett. World Explorer (Prentice Hall) Geography: Tools and Concepts (Pearson Education) 2003. World Encyclopedia (Britanica) 2004. World Almanac Book of Facts (World Almanac Books) 2004. Student assessment plan: include all assessments that you will use to assure that students are meeting objectives *include culminating activity. Population worksheet Retrieval Charts Venn diagram Mix-and-Match Jeopardy Game *Reflection Paper (culminating activity) Complete lesson plans:

How does population effect how people live?
Population: Day One How are other countries population different than the US
Grade Level: Sixth grade Standard: One- Culture Time: 45 minutes Objectives for lesson:
• Students will comprehend key terms (population, population distribution, demographers, urban, rural)
• Students will participate in class discussion • Students will complete the Population worksheet
Materials:
Lap top Projector Population worksheet
Procedure: I. I will begin class with a PowerPoint. The presentation is filled with diverse pictures- from rural areas to deep urban cities. From one picture to the next, I will ask students questions to encourage them to come to an understanding of terms and concepts. Examples:
• What do you see in this picture? • Is population around the world evenly distributed? • What’s the difference between this city street (in India) and a street in your city? • What are the differences between these two pictures? • How does population effect how these people live?
II. Throughout the presentation, new definitions will be introduced. The pictures after them correlate to the concepts and should spark more of an understanding. (Visual learners) a) Population b) Population distribution c) Urban d) Rural

e) Demographer II. After the Power point and our discussion, the population worksheet will be handed out to assess the students’ grasp on the new information. (15 minutes) On-going Assessment throughout lesson: Are the students participating in the group discussion? Do the students’ answers to questions make sense? Are they grasping the concepts of the new definitions?

Population Worksheet 1) What is population? Please explain. ________________________________________________________________________________________________________________________________________________________________________________________________________________________________________________________________________________________________ 2) What is population distribution? ________________________________________________________________________________________________________________________________________________________________________________________________________________________ 3) Is population around the world evenly distributed? Why or why not? ________________________________________________________________________________________________________________________________________________________________________________________________________________________ 4) List three things that may effect where people decide to live. ________________________________________________________________________________________________________________________________________________________________________________________________________________________ 5) What do demographers do? ________________________________________________________________________________________________________________________________________________________________________________________________________________________ 6) Which picture below is an urban area? (circle) Please explain why. ________________________________________________________________________________________________________________________________________________________________________________________________________________________
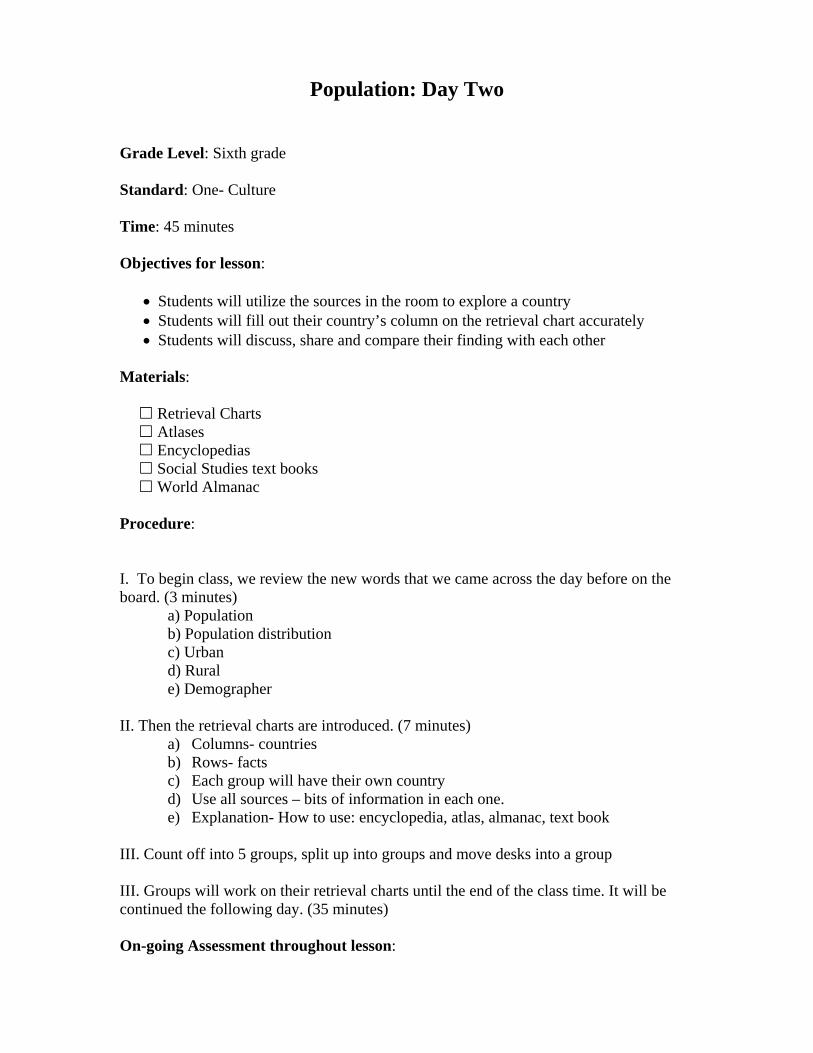
Population: Day Two
Grade Level: Sixth grade Standard: One- Culture Time: 45 minutes Objectives for lesson:
• Students will utilize the sources in the room to explore a country • Students will fill out their country’s column on the retrieval chart accurately • Students will discuss, share and compare their finding with each other
Materials:
Retrieval Charts Atlases Encyclopedias Social Studies text books World Almanac
Procedure: I. To begin class, we review the new words that we came across the day before on the board. (3 minutes) a) Population b) Population distribution c) Urban d) Rural e) Demographer II. Then the retrieval charts are introduced. (7 minutes)
a) Columns- countries b) Rows- facts c) Each group will have their own country d) Use all sources – bits of information in each one. e) Explanation- How to use: encyclopedia, atlas, almanac, text book
III. Count off into 5 groups, split up into groups and move desks into a group III. Groups will work on their retrieval charts until the end of the class time. It will be continued the following day. (35 minutes) On-going Assessment throughout lesson:

Can the students recall previous vocabulary words? Can they explain what each means? Does the student work well with group- take responsibility in retrieving the information they are assigned to?
(smaller than actual size chart)
United States Japan Australia India Brazil Norway
Population
Area of Country
Population Density
Capital City
Life Expectancy
Birth Rate
Death rate
Climate
Neighboring Countries
Other interesting facts
Country Retrieval Chart

Population: Day Three
Grade Level: Sixth grade Standard: One- Culture Time: 45 minutes Objectives for lesson:
• Students will complete their retrieval charts accurately with their groups • Students will participate in a small group discussion • Students will discuss similarities and differences between countries • Students will fill out a Venn diagram accurately with information from retrieval
charts. Materials:
Retrieval Charts Atlases Encyclopedias Social Studies text books World Almanac Paper Markers
Procedure: I. To begin class, the students will complete their charts with their group. (10 minutes) II. Once they are finished, students will be numbered off and join a new group. (15 minutes)
a) Each group will have one member from each country. b) They will then brainstorm about and compare the information they have for their own country to the others. c) Students will fill in the remaining countries facts into their retrieval charts.
III. These new groups will then choose two countries to compare. (15 minutes)
a) I will explain what a Venn Diagram is b) Students will create their own Venn Diagram as a group
IV. Students will present their information with the class. (5 minutes)

On-going Assessment throughout lesson: Can the students discuss and comprehend the information that is shared among the new group? Do the Venn Diagrams reflect the students’ understanding of the similarities and differences between countries?

NAME: ________________________
What information surprises you? Why?
What do the birth and death rates tell you about the country’s population?
What do the life expectancy rates tell you? Between male and female? Between the different countries?
Compare the population densities to each other. What educated guesses can you make about each country, based on the population density?
How do you the neighboring countries affect your country?
Which of the countries that you’re comparing do you think has more rural areas? Why?
What continent do each of the countries belong to?
What are some similarities between the two countries?
What are differences in the countries?
Other comments? (Use back of sheet if needed)
My country: _________________ The country we’re comparing: ___________________________

Population: Day Four
Grade Level: Sixth grade Standard: One- Culture Time: 45 minutes Objectives for lesson:
• Students will participate in group activity • Students will represent the push-pull theory. • Students will write a brief reflection on activity
Materials:
Name Cards (war, scarce food, plenty of jobs, religious persecution, etc) White board
Procedure: I. We will begin class by reviewing birth and death rate. (10 minutes)
a) Information from retrieval charts on board b) Students compare birth to death rates. c) What does it mean if Birth rate is higher than death rate? (population
Increasing) d) Life expectancy
II. What challenges may arise from increasing populations? – Class brainstorm (3 minutes)
a) pollution b) jobs shortages? c) Forests/rainforests d) Animal habitat e) Depleting resources f) Etc.
III. What things would make you want to leave your country? What things would make you want to go to another country? (3 minutes)
a) Push-Pull theory IV. “Push-Pull activity” (12 minutes)

a) Migration/immigration b) Four “countries” – each corner of room c) “Factors” (students with signs on: war, peace, scarce food, etc.) at center of
room. d) “Who wants War in their country?” all factors sent to a country; when they get
there, they read off an introduction to them to their new country. V. Class discussion (5-10 minutes)
a) How do citizens feel in their country? b) How does this activity illustrate the push-pull theory? c) How does population effect these people?
VI. Students write a short reflection on “What is Push-Pull Theory?” and “Explain how our activity illustrated this theory” On-going Assessment throughout lesson: Do the students participate in activity? Does student answer questions during discussion correctly? Can the student write out a short summary of what push-pull theory is?

1. Birth Rate ________ 2. Climate ________ 3. Demographers ________ 4. Population ________ 5. Population Density ________ 6. Population distribution ________ 7. Area of Country ________ 8. Life Expectancy ________ 9. Death Rate ________ 10. Your Student-teacher’s name ________
a) The total number of people in an area.
b) The size of a country
measured in square miles. c) The average number of
people living in a given area
d) Ms. Cottingham e) The average number of
years that a person may be expected to live.
f) The number of live births
each year per 1,000 people.
g) The number of deaths
each year per 1,000 people.
h) The weather patterns that
an area typically experiences over a long period of time
i) How a population is
spread over an area. j) A scientist who studies
human populations.
Word-to-definition Match up
Match the words on the left to the definitions of those words in the box. Write the correct letter next to the word. Please write legibly (neat)! If I am unable to read your letter answer, it will be marked incorrect!
NAME: ____________

Population: Day Five
Grade Level: Sixth grade Standard: One- Culture Time: 45 minutes Objectives for lesson:
• Students will reflect on this week by answering questions on board • Students will actively participate in Jeopardy game
Materials:
White board/markers Procedure: I. Students will get 20 minutes to answer three questions that are on the board
a) What specific ideas have you learned this week in Social Studies? (please explain)
b) How do these things relate and affect your life? c) How does population effect how people live?
II. After the students are finished with their final reflection, the class will be divided into two groups: team 1 and team 2.
a) Jeopardy will be played for the remaining 20-25 minutes. b) This game is full of review and reflection questions
On-going Assessment throughout lesson: Do the students answer all of the questions on the board? Are they correct interpretations? Can the students work together to come up with answers for the final game?

RUBRICS:
Population: Chapter three (Standard-Based Rubric)
Standard: 1 2 3 4
Use appropriate resources, data sources… and interpret information such as atlases,
databases, charts, graphs and maps. (National Standard)
Student has difficulty finding information in sources, may not use correct sources to find certain information.
Student utilizes resources well and finds mostly accurate information
Student uses appropriate sources for different information, uses a variety of sources, student finds accurate information
Student finds extra information from sources outside of the classroom. Student utilizes resources well and finds accurate information
Describe the movement of people, ideas, diseases, and
products throughout the world (Wisconsin State
standard)
Students can identify a few movement ideas or concepts.
Students can explain or give some examples of migration, immigration, the Push-Pull theory and other concepts
Students can explain or give examples of migration, immigration, the Push-Pull theory and other concepts
Student can explain and give numerous examples of migration, immigration, the Push-Pull theory and other concepts
Explain the relationship of population distribution to
earth’s physical characteristics. (Superior
District Standard)
Students can explain what population distribution means.
Student can explain what population distribution is or give an example of the concept.
Students show an understanding of population distribution and can explain or give examples of population distribution throughout the world. They can also give examples of a rural and urban area
Students fully understand and can explain and give examples of population distribution throughout the world. They also fully understand other concepts like rural and urban.

Population Rubric: Chapter Three
ACTIVITY 1
Needs Imrprivement
2 Acceptable, but could use work
3 Good
4 Above and Beyond!
Population Worksheet
5 or more answers wrong on worksheet; didn't show a strong
understadning of concepts;
3-4 answers wrong;
all other answers clearly prove
student's understanding of
concepts; examples given
0-2 answers wrong; Good answers;
Shows good inderstanding of concepts; good exaples given
0 answers wrong; all answers excellent; Understanding of whole concepts;
clearly written; great examples given
Retrieval Chart 1 column filled in, some information
inaccurate; unorganized;messy
2 columns filled in; most information accurate; neat
3 or more columns filled in; Accurate
information throughout chart; neat
All rows filled in; All information accurate;
extra information added; very neat and
organized
Venn Diagram
4 pieces of information included
in diagram; most info. placed in correct part
of diagram; group members did not
share task evenly; messy
5-10 pieces of info.; Most of info.
accurate; Group worked ok together;
neatness ok
Diagram mostly filled in (10 + pieces of information; Most
information accurate; Group members
shared task; neatly drawn; organized well
Diagram filled with information in all parts (12+ pieces of info) ; Information accuate; Information placed in
correct parts of diagram; All group members shared
task; very colorful and neat; organized well
Response Papers
Answers not in complete sentences;
Less than 4 sentences in each ansers; Not written
using paragraph format; does not give many if any examples
that show understandning of conceot; not neatly
written
Most ansers in complete sentences; 4+ sentences used in
each answer; Paragraph format
used; In most answers, gives examples and
explanations that prove understanding
of concepts and ideas; neatness ok
All answers in complete sentences; 6+ sentences used in
each answer; Paragraph format
used; gives examples and explanations that prove understanding
of concepts and ideas; neatly written
All answers in complete sentences; 9+ sentences used in
each answer; Paragraph-format
used; Gives examples and
explanations that prove deep
understanding of concepts and ideas;
neatly written

Population Unit: Reflection
Through my practicum experience at Superior Middle School, I have learned a lot
about my teaching and students’ learning. Every day you will come across things, as a
teacher that you can learn from. It’s just a matter of noting the lessons and remembering
them the next time.
I learned that a teacher really does need to know the material, to feel comfortable
with the material to give my absolute best as a teacher. If I can fully understand the
concepts, I know that I will be comfortable in front of the class. And if I am comfortable,
I will be able to give my best performance. There are many ways in which a teacher goes
about teaching their class, and I have realized that worksheets aren’t always the best way
to go.
In fact, I find that as a teacher, I really like to mix it up. My cooperating teacher
uses many worksheets, individual chapter reading and tests. I noticed that even I, as a
Block II Student teacher, was getting bored. Boredom leads to students misbehaving or
just plain out not learning. Yet, if students can find interest in a subject or activity, they
will learn. In any given class, there are numerous types of learners. Some learn well
when they hear a lecture, some learn well when they can see examples, and others learn
well by moving (just to name a few). As a teacher, I do not want to leave any child out.
So I will look to use variety in my classroom lessons.

As I said, there should be no students left out. This includes students who are a
part of the special education classes. In my class, there were numerous students who had
special needs. One was deaf, another was in a wheelchair, and another had OCD while 4
others had autism. I want to get these students as involved in my classroom and with their
peers as much as I can. They may not get the chance to have much interaction with
others outside of class; this is where they will have the opportunity to improve their
social skills.
My unit was on Population. The reason that I conducted my unit on this topic is
because my class was on Chapter 3, and my cooperative teacher wanted to move on
through the chapters. The students need to know the information about population to
more understand their world and what’s around them. To be honest, I didn’t find the
chapter really intriguing. But I did my best to illustrate it to the students in a way that
they would remember.
On the first day I presented a PowerPoint slide full of many pictures of different
places and populations of people. Throughout the presentation there were definitions and
questions to check back and see if they understood the idea. We began a Retrieval Chart
on day two. The class was split up into groups of 3-4 students, which would be their
country’s group. Japan, United States, Australia, Norway, India and Brazil were the
countries under inspection. The students had four sources where they could find their
information: the World Almanac, Encyclopedias, their textbook and an Atlas. They
worked on this task for the period, and continued on day three.

When their country-group finished, they were mixed into groups where there was
one from every country. They shared and discussed their information. When they
finished, they chose two countries to compare and created Venn Diagrams of the
information they found.
Day four was my favorite. The main idea I wanted to get across to the students
was the push-pull theory. We had a brief discussion on it, and then had our “Push-Pull
activity”. They loved it! On day five, the last day of my unit, we had a reflection on the
week and what they have got out of it. They wrote down answers to a three questions I
wrote on the board. Afterwards, we had a Jeopardy game. They really like it.
Now, my unit was definitely not perfect. I figured out that I should have taken
more time- more days to cover the information. Instead of five days, it should have been
more like seven days. Day one was alright, but day two, three and four should have been
used for the retrieval charts. It was just too rushed. Then day five would have been the
Venn diagram and discussion, day six the “Push-Pull activity” game and day seven the
reflection and jeopardy game. For the retrieval charts, I would have rather taken the class
down to the library, gone over where the resources are and how to use them- including
the internet. There will always be room for improvement.
While there are things I would change next time, I would definitely do the “Push-
Pull activity” again. The students enjoyed getting out of their seats and being physically
involved in the activity. I also would do the retrieval charts again; I think it is important
for students to have the skill of retrieving information from numerous types of sources.

The students really like the PowerPoint, also. They really don’t see many (if any at all),
and were attentive and drawn into the presentation.
I think this unit fit in well with my goal framework. I want to give all of my
students a variety of activities to learn from. I want to raise their curiosity, raise their
awareness and raise their capabilities to seek out and learn what they need and want to.
Although my unit could use improvements, it was a start. Now I can build from what I
have learned and bring even more rich experiences to my students.