how do the micropores of carbon xerogels influence their
TRANSCRIPT

1
How do the micropores of carbon xerogels influence their electrochemical
behavior as anodes for lithium-ion batteries?
Marie-Laure C. Piedboeuf 1*, Alexandre F. Léonard 1,†, Gudrun Reichenauer 2, Christian Balzer 2 Nathalie Job 1
1 Department of Chemical Engineering – Nanomaterials, Catalysis, Electrochemistry (NCE)
University of Liège (B6a), 4000 Liège, Belgium
2 Bavarian Center for Applied Energy Research, Division, Energy Efficiency, Magdalene-
Schoch-Strasse 3, 97074 Wuerzburg, Germany
Abstract
This work aims at shedding light on how the microporous texture of porous carbons influences
their electrochemical behavior when used as anodes for Li-ion batteries. To this aim, a synthetic
hard carbon (carbon xerogel, CX), prepared from a resorcinol-formaldehyde precursor gel,
underwent several post-synthesis treatments in order to modulate its micropore to total pore
volume ratio. The micropore volume was either expanded by physical activation or decreased
using chemical vapor deposition (CVD) of a carbon layer.
Several variables other than the micropore texture of the obtained carbons, which could
influence their behavior as anode active materials for Li-ion batteries, such as the particle size
or the electrode characteristics, were carefully controlled. The thickness of electrode coatings
and the pore texture of the active material-binder composite were analyzed. It was shown that
CX-binder composites resulting from water-based slurries preserve the microporosity of the
starting materials. Detailed electrochemical characterization of the electrodes prepared with
carbon xerogels displaying various defined micropore textures was performed. A clear linear
dependency could be evidenced between the Li+ insertion and de-insertion in half-cell
configuration with the increase of the volume of supermicropores (0.7 – 2 nm), demonstrating
the effect of micropore enlargement by activation on the storage capacity, provided the
maximum charge potential value is set at 3.0 V vs. Li+/Li.
* Present address: AC&CS – CRM GROUP, Allée de l’Innovation 1, B - 4000 Liege (Belgium) † Corresponding author. Tel: +32 4 366 3579. E-mail: [email protected] (A.F. Leonard)

2
Keywords
Carbon xerogels, physical activation, Li-ion battery, microporosity, charge capacity,
irreversible capacity
1. Introduction
Since the introduction of the Li-ion battery technology, carbon materials have extensively been
studied and used as anode materials. The first Li-ion battery commercialized by Sony in 1991
included an anode prepared from a disordered carbon (coke) [1]. Nevertheless, the main
drawback of this type of carbon lies in the fact that very high irreversible losses occur at the
first charge-discharge cycle [2]. For that reason, it was replaced by graphite, which has
remained until now the most appropriate carbon-based active material for this application, due
to improved cycle life and fast rate capability compared to coke. However, the theoretical (and
practical) capacity of graphite is limited to the insertion of one Li+ per six carbon atoms (which
corresponds to 372 mAh.g-1), i.e. a much lower capacity than that observed for porous hard
carbons for instance [3-4]. Moreover, the insertion mechanisms of Li+ ions inside porous
carbon structures still remains a matter of debate in the literature; in particular, the impact of
the pore texture remains unclear.
In that respect, we recently published a first study concerning the use of carbon xerogels (CX)
as model materials to better understand the behavior of porous carbons as anodes for Li-ion
batteries [5]. Carbon xerogels are usually made of a hierarchical pore texture featuring
microporous nodules that delimitate meso- or macroporous voids [6]. Standardized synthesis
conditions based on resorcinol-formaldehyde as precursor lead to materials with micropore
volumes between 0.15 and 0.30 cm³.g-1. The meso- or macropore size can be controlled by the
synthesis conditions (pH mainly) and can be varied over a wide range, from 5 nm to 5000 nm.
In the above-mentioned study [5], where polyvinylidene fluoride (PVDF) was used as a binder,
it was concluded that the external surface area of the CX backbone, representing the surface of
3
meso- or macropores, is a more appropriate parameter than its total specific surface area to
explain the observed electrochemical behavior: indeed, the insertion/de-insertion capacity was
directly linked to the external surface of the carbon nodules, while the micropores were blocked
by the PVDF binder. Going a step further, another work shed some light on the importance of
the binder used for the electrode preparation when porous materials are involved [7]. Indeed,
the processing of active materials into electrodes can strongly affect the textural characteristics
of the final composite formed by the porous active material and the binder.
Post-synthesis treatments can be applied to carbon xerogels to selectively modulate the
micropore volume without altering the meso- or macropore structure. The micropore volume
can be increased by chemical (using e.g. KOH or ZnCl2) or physical (using e.g. steam or CO2
at elevated temperature) activation. In particular, for carbon xerogels, CO2 physical activation
was compared with chemical activation using hydroxides [8]. It was concluded that physical
activation has numerous advantages such as the possible coupling with the pyrolysis step, the
retention of the meso- or macropore texture and the preservation of the surface chemistry. On
the opposite, a decrease of the microporosity can be achieved, for instance, by chemical vapor
deposition (CVD) of carbon initiated by ethylene cracking. Since CVD is an efficient technique
for the nano-replication of zeolites or mesoporous silica into porous carbons, it can be assumed
that the precise control of the conditions could lead to a selective filling or blocking of the
microporosity of the CX without affecting significantly the large pores [9].
In the literature, activated porous carbons derived from organic gels have been evaluated as
anode materials for Li-ion batteries [10–12], among which highly microporous carbon aerogels
and xerogels activated by chemical [10] or physical [11–12] post-treatments. In all cases, the
reversible charge capacity was enhanced (from 200 mAh.g-1 for the pristine carbon up to 700
mAh.g-1), and the irreversible capacity at the first cycle increased as well (from 300 to 3000
mAh.g-1). The main issue is that, even though both capacities globally increase with activation,
no correlation was found between the specific surface area measured on the powder and the

4
irreversible and reversible capacities. Even for similar values of specific surface area,
differences in the absolute values of stored energy can be noticed in some cases. In addition,
no information is provided regarding either the meso- and macropore texture of the carbons, or
the final pore texture in the electrode composite, prepared using PVDF as a binder. Since PVDF
is known to block micropores [5, 7], it is no surprise that the electrochemical data seem
scattered. Also, the particle size is never reported, while it can affect Li+ (de)insertion. Finally,
the maximum potential value used for electrochemical characterization changes from one study
to another (2.0 to 3.0 V vs. Li+/Li), which could also lead to different conclusions. It is therefore
difficult to derive general trends. In particular, a more systematic study using a binder that
leaves the micropore surface accessible to the electrolyte is necessary to compare results and
establish relationships between the microporosity and/or the specific surface area of the
material, and its behavior as Li-ion electrode material.
The aim of the present study is thus to isolate the sole influence of the micropores of porous
carbons on their electrochemical behavior as anodes for Li-ion batteries while keeping constant
all other variables such as the meso- and macropore texture, the particle size and the electrode
processing method. For that purpose, a macroporous carbon xerogel (with an average pore size
of 80 nm) was selected and submitted to different treatments in order to selectively modulate
its micropore fraction. The samples were carefully analyzed in terms of pore texture
characteristics but also in terms of preservation of the particle size. Moreover, an original
process was used for the preparation of the electrodes, which allows the retention of the initial
porous properties of the powder when processed as the final electrode. Finally, the
electrochemical behavior as anodes for Li-ion batteries was evaluated, and a relationship with
the textural parameters of the samples was established.
5
2. Experimental
2.1. Synthesis of the pristine carbon xerogel
The material studied was prepared following the process described by Job et al. [6]. In brief, a
35 wt.% resorcinol (Merck) aqueous solution was prepared and the pH was set by addition of
powdery sodium carbonate. A 37 wt.% solution of formaldehyde stabilized by 10-15 wt.%
methanol (Sigma-Aldrich) was then added in a molar ratio resorcinol : formaldehyde equal to
1 : 2 and the mixture was magnetically stirred for 1 h. The molar dilution ratio D =
water/reactants was fixed at 5.7. The molar ratio between resorcinol and carbonate (R/C) was
chosen equal to 2000. The obtained homogeneous gel precursor solution was then sealed in a
250 mL autoclaveable glass flask and aged for 3 days at 85°C. After gelation and ageing, drying
was performed by placing the gel in an oven under vacuum (2 kPa) at 60 °C for 12 h and then
at 150 °C for 30 h.
The dry xerogel was then ground using a Fritsch planetary mill (Mono Mill P6) in agate jars
with 1 cm diameter agate balls following the procedure described in a previous work to obtain
homogenous and reproducible particle sizes [13]. The obtained powder was put in a quartz boat
and introduced in a ceramic tubular oven to undergo a pyrolysis step at 900 °C, leading to a
carbon xerogel. The pyrolysis was performed just before coating on current collectors or other
post-synthesis treatments, under nitrogen (Air Liquide Alphagaz 1, flow rate = 0.004 mol.min-
1) with the following temperature profile: (1) ramp at 1.7 °C/min to 150 °C and hold for 15
min; (2) ramp at 5 °C/min to 400 °C and hold for 60 min; (3) ramp at 5 °C/min to 900°C and
hold for 120 min; and (4) natural cooling to room temperature. This (reference) carbon xerogel
pyrolyzed at 900°C without any other treatment is hereafter denoted CX-Ref.
2.2. Physical activation with CO2
The physical activations were performed using CO2 in the same tubular oven as used for the
pyrolysis. The oven was connected to a nitrogen and a carbon dioxide supply via a three-way
valve, allowing to switch between both atmospheres. 5 g of the powdery dry polymer gel were
6
introduced in the tubular oven to undergo a pyrolysis at 900 °C for 2 h under nitrogen as
described above; subsequently, the atmosphere in the tube was modified by switching from the
nitrogen supply to the CO2 bottle (Air Liquide N27), still at 900 °C and by keeping the same
flow rate of 0.004 mol.min-1. This temperature was maintained for different durations necessary
for the activation process (3, 8 or 16 h). Finally, the cooling step was done under nitrogen
atmosphere. The different samples are denoted as follows: CX-A is followed by the activation
time in hours. For instance, CX-A3 denotes a carbon xerogel that underwent a physical
activation for 3 h.
2.3. Chemical vapor deposition of ethylene
Chemical vapor deposition was performed in a stainless steel tubular oven. The temperature of
the oven was set at 685 °C under inert atmosphere (flow rate: 0.025 mol.min-1). The untreated
CX sample was placed in a quartz boat and introduced in the oven at this temperature by using
a reverse flow system allowing to keep the protective inert atmosphere. The reactor was then
fed with a gaseous mix (total flow rate: 0.082 mol.min-1) constituted of 80 % of ethylene (Air
Liquide N25, 0.066 mol.min-1) and 20 % of nitrogen (Air Liquide Alphagaz 1, 0.016 mol.min-
1) for 30 min at 685 °C. Then, the atmosphere was modified to 100 % of nitrogen (flow rate:
0.025 mol.min-1). Finally, the temperature was increased to 900 °C and kept constant for
another 2 h. This step was followed by cooling under nitrogen atmosphere. The resulting
sample is denoted CX-CVD.
2.4. Preparation and characterization of electrodes
After grinding and pyrolysis, the materials were processed into electrodes. The final powders
were kept in a glove box under argon atmosphere (MBraun) before coating to avoid a possible
modification of the surface chemistry upon exposure to air. A powdery mix containing CX and
xanthan gum (XG, Sigma-Aldrich, binder) was suspended in ultra-pure water to form a
homogeneous slurry. In a typical slurry preparation, the CX and XG mass fractions were set at
88 – 12 wt. % respectively in the solid mix, and the amount of water added was chosen so that

7
the solid (CX + binder) to water mass ratio was 50 wt. %. This ink was then sprayed manually
(Harder & Steenbeck Evolution Silverline 2) on pre-weighed stainless steel disks (Ø: 15.5 mm,
MTI corporation, stainless steel 304, thickness: 0.5 mm), homogeneously dispersed on a
protecting aluminum foil. The formed coatings were left to dry for 1 h at ambient temperature,
followed by 16 h at 60 °C and finally 3 h under vacuum at 120 °C. The formed electrodes were
then directly introduced into an Ar-filled glovebox (MBraun). The excess of dry ink sprayed
next to the electrodes on the protecting aluminum foil was scratched-off from the support and
recovered, allowing for obtaining a powdery active material-binder composite that displays the
same textural parameters as those of the electrodes.
The thickness of the coatings after drying was measured by stylus profilometry (Veeco Dektak
150, stylus radius: 12.5 µm, force: 9.8 µN). In order to get access to the thickness of the
coatings, three electrodes were fixed on a glass slide as illustrated in Fig.S.I.1. The carbon layer
was scratched off from borders to get access to the baseline. The thickness was calculated as
an average value taken from the two pathways on each electrode with two scans each.
2.5. Pore texture and particle size characterization
The pore texture of both the powdery carbon xerogels and the corresponding carbon-binder
composites forming the electrodes, was characterized by nitrogen adsorption. The nitrogen
adsorption-desorption isotherms were measured at -196 °C using a volumetric analyzer (ASAP
2420, Micromeritics, Norcross, USA). The samples were degassed overnight, at 270 °C for the
starting carbon or 120 °C for the carbon-binder composites, under high vacuum (133 Pa) prior
to analysis. From the nitrogen adsorption isotherms, the specific surface area, SBET, was
calculated using the Brunauer-Emmett-Teller (BET) equation, with the adsorption data
selected in the relative pressure range 0.01 to 0.10 [14]. The specific external surface area of
the nodules, SW, i.e. here the surface corresponding to the macropores, was determined
following the method described by Magee [15].

8
To access the evolution of microporosity of the powders in the complete pore size range
between about 0.3 and 2.0 nm, in addition to N2 adsorption at -196 °C, CO2 adsorption analysis
at 0 °C was performed using a volumetric adsorption instrument (ASAP 2020, Micromeritics,
Norcross, USA). Prior to analysis, the samples were degassed at 300 °C and under vacuum
(133 Pa) for about 24 h. It should be mentioned that these measurements were carried out only
on the starting pure carbon materials.
To determine the specific micropore volume and surface area distributions of the carbons, we
performed a combined nonlocal density functional (NLDFT) analysis of N2 and CO2 adsorption
isotherms using models for slit-shaped carbon pores based on refs [16-20]. Data analysis was
carried out using the commercial software Microactive (Micromeritics, Norcross, USA) [21].
From these datasets, the average micropore width w was calculated as:
w = 2Smic,NLDFT/Vmic,NLDFT [1]
with Smic,NLDFT and Vmic,NLDFT being the integral of the specific micropore surface area and
volume, respectively, as derived from the respective distributions.
Since the carbon xerogel samples feature macropores, the nitrogen adsorption technique is not
suitable for the determination of the respective pore width and pore volume. For that reason,
mercury porosimetry was performed with a Quantachrome Poremaster 60 in a pressure range
comprised between 0.01 to 400 MPa. The analysis of the obtained mercury intrusion data
allows for determining the specific pore volume, VHg, as well as the pore size distribution for
pores larger than 3.8 nm in diameter. The latter was calculated by using the Washburn equation
[22], valid for mercury intrusion without crushing and upon using average values of the
liquid/solid contact angle of 140° and a surface tension of mercury of 0.485 N.m-1.
Furthermore, the particle size distribution of the powders was obtained using laser diffraction
with a Mastersizer 2000 (Malvern Instruments) in wet mode (Hydro2000). Prior to grain size
distribution measurements, the samples were dispersed in water using high intensity ultrasonic
irradiations (Hielsher, UP400S). The sample preparation method is fully described elsewhere

9
[13]. Particle size distributions were obtained from the raw data by mathematic treatment
assuming a spherical geometry of the particles.
2.6. Electrochemical characterization
The electrochemical measurements were carried out in CR2032 coin cells, where the tested
material acted as positive electrode and a Li-metal disk as the negative, reference and counter
electrode. A Celgard® separator soaked with 80 µL of LP71 (1 M LiPF6 in EC:DEC:DMC
1:1:1) electrolyte was placed in-between. The cell assembly was performed in an Ar-filled
glove-box (MBraun). Charge-discharge cycles were recorded at C/10 (i.e. using the necessary
current to charge completely the battery in 10 h, based on the theoretical value for graphite –
372 mAh.g-1) between 0.005 and 1.5 V or 3.0 V vs. Li+/Li with a potentiostat (Biologic VMP3
multichannel) or a battery tester (Neware BTS 5 V / 1mA) at a controlled temperature of 25
°C. Cyclic voltammetry was also performed in the same voltage range at a scan rate of 0.05
mV.s-1.
In order to evaluate the surface accessibility by the electrolyte, capacitance measurements in
capacitor configuration were performed by using CX electrodes at each pole of the coin cell as
described elsewhere [5]. The electrolyte used was the same as for the half-cell assembly and
the cell voltage ranged from -0.3 to 0.3 V. Cyclic voltammetry was performed at a speed of 20
mV.s-1 and the capacitance was calculated from the slope of the straight line obtained by
plotting the charge (q) versus the potential (V). Graphite (KS6L, Timcal) was used in order to
compare the electrochemical behavior of CX material with a commercial carbon material used
as anode for Li-ion battery.
3. Results and discussion
3.1. Pore texture of the carbon xerogels
The nitrogen and carbon dioxide isotherms of all carbon xerogels investigated in this work are
shown in Figures 1a and 1b, respectively, while the analysis results according to BET theory,

10
t-plot method and NLDFT are given in Table 1. As can be seen from Figure 1, the nitrogen
adsorption isotherms of all samples investigated are combined type I and II isotherms according
the IUPAC recommendations [14]; as such, all samples feature micro- and macroporosity.
To begin with, we consider the reference carbon xerogels CX-Ref and the species activated for
3, 8 and 16 h, i.e. the samples CX-3, CX-8 and CX-16. As expected, all data evaluation
techniques show an increase in specific micropore volume and respective surface area for
progressing activation. Fig. S.I.2 shows a plot of the mass loss of the dry polymer gel powders
after pyrolysis and activation as a function of the activation time. For the pyrolyzed powder
without any other treatment (activation time = 0 h), a 52 % mass loss is observed, which is in
line with previous results [6]; it corresponds to the carbonization of the polymer network, i.e.
the end of the pyrolysis step. The CO2 activation induces an additional and increasing mass
loss linked to the activation time, up to 36 % after 16 h of treatment. This results from the
progressive erosion of the carbon by the carbon dioxide following the Boudouard reaction [23].
In contrast to the activated samples, the carbon xerogel subjected to CVD treatment displays a
mass increase of 25 %, confirming the deposition of a carbon coating.
Table 1: Textural parameters associated to nitrogen adsorption isotherms presented in Fig. 1.
a Calculated by the BET equation in the P/P0 range 0.01-0.10 [14]. b Calculated by the method described by Magee [15]. c Calculated by NLDFT analysis of combined nitrogen and carbon dioxide isotherms.
Sample SBET
(m².g-1) a
SW
(m².g-1) b
Smic,NLDFT
(m².g-1) c
VNLDFT
(cm³.g-1) c
± 5 %
CX-CVD 112 98 99 0.025
CX-Ref 679 124 908 0.247
CX-A3 1162 168 1397 0.426
CX-A8 1723 244 1684 0.618
CX-A16 2234 507 1788 0.788

11
Figure 1: (a) N2 adsorption-desorption isotherms; (b) CO2 adsorption isotherms; (c) Micropore
volume as a function of pore width. () CX-Ref, () CX-A3, (×) CX-A8, () CX-A16 and
() CX-CVD.
The values of specific BET surface area as derived from N2 isotherms are reported in Table 1
for comparative purposes with other studies, since this theory is the most widely applied in
textural analysis. Nevertheless, the calculations are not the most appropriate for micro-
mesoporous carbon xerogels, which is the reason why, in the present case and in order to be
more accurate regarding the micropore fraction of the materials, we chose to focus the
discussion on the data calculated from the nonlocal density functional (NLDFT) analysis of
combined N2 and CO2 adsorption isotherms. The micropore area of the unmodified carbon
(a) (b)
(c)

12
xerogel CX-ref equals 908 m².g-1. In the case of CX-CVD, this value is sharply reduced down
to 99 m².g-1. On the opposite, the specific surface area increases with the activation time, with
values up to 1788 m².g-1 for CX-A16. The cumulative micropore volume for pores with sizes
comprised between 0.3 and 2.0 nm follows the same trend (see Figure 1c). In addition to the
substantial increase in microporosity following the activation process, which was the main aim
here, the data also point to a development of the external surface area SW of the nodules (Table
1). This could be related to a decrease in the size of the nodules, to the evolution of
mesoporosity on the outer surface of the latter, or a combination of both, upon activation.
Mercury intrusion porosimetry allows obtaining the total specific volume of pores larger than
3.8 nm. Since the present study is focused on the microporosity effect, the Hg porosimetry
results are presented in Supplementary Information (see Figure S.I.3). Globally, the macropore
texture is retained, both after CVD treatment or activation, even though the average pore size
tends to decrease when the activation time is long (8 or 16 h). This phenomenon is likely due
to a broadening of the pore size distribution and not to the shrinking of the pores already present
in the material. This observation could explain the increase in the external surface area if the
nodules are subjected to mesopore formation on their surface, especially after the harsh
activation treatments.
3.2. Powder and coating characterization
Laser granulometry analysis of the powders (Figure S.I.4) shows that the final particle size
distribution of the powders is not significantly affected by the physical activation treatment.
Particle size distributions coincide for all samples except the one treated by CVD: in the case
of the latter, the particle size distribution is shifted to slightly higher values, which could be
explained either by the fact that the additional carbon coats both the micropores and the external
surface of the particles or (more likely as the particle size distribution is shifted by several µm)
by an agglomeration of different particles together, inducing increased particle sizes.

13
The thickness of the electrode coatings (Table S.I.2), measured by stylus profilometry
technique, is similar for CX-Ref and CX-CVD; it however increases when the samples are
activated. Indeed, the activation process strongly decreases the bulk density of the carbon,
leading to a thicker coating for a similar mass of active material (214 µm for CX-A16 compared
to 96 µm for CX-Ref).
The textural properties of the final composites formed between the CX active material and the
binder were evaluated by N2 adsorption-desorption. As described in the experimental part, this
composite is recovered from the excess of dry ink and thus really reflects the pore texture of
the electrodes. Fig. 2 compares the N2 adsorption-desorption isotherms of the bare powders
with the corresponding composites.
Figure 2: Comparison of N2 adsorption-desorption isotherms: () CX-Ref, () CX-A3, (×)
CX-A8, () CX-A16 and () CX-CVD. The continuous line represents the bare powder and
the dotted line represents the corresponding composite.
The data corresponding to the composites were corrected so as to take only the carbon into
account, since the binder is considered as a non-porous component. As seen from Fig. 2, the
isotherms obtained for the powders and the corresponding composites are almost identical in
the low to medium relative pressure regime (reflecting micropore and surface area
characteristics), indicating that the pore texture of the composite processed as an electrode is
the same as that of the pristine active material, especially regarding the specific micropore

14
volume and surface area.
Generally, when PVDF is used as binder for the preparation of electrodes made of porous
carbons, the specific micropore volume of the resulting active material-composite is strongly
reduced. In this context, this result is important since the method selected for this study allows
preserving the initial microporous texture of powders. This conclusion is in line with a previous
work [7] where PVDF, solubilized in N-methyl pyrrolidone (NMP), was replaced by a
combination of Na-CMC and SBR in a water-based ink. Indeed, it was shown that the solvent
used for ink preparation (NMP or water) has a strong influence on the final texture of the
composite. It has been hypothesized that NMP enters the inner part of the material while water
does not, leading in the latter case to almost no loss of porosity compared to the pristine powder
[7].
3.3. Electrochemical characterization
The surface of the material (as composite in an electrode, with XG as binder) accessible to the
electrolyte was analyzed in supercapacitor configuration as described in detail in our previous
study [5], with the same electrolyte as that used for the electrochemical characterization in half-
cells. Fig. 3a presents the cyclic voltammetry curves obtained at a scan rate of 20 mV.s-1 for
the different samples and Fig. 3b shows the calculated specific capacitance values for each
sample. Clearly, the specific capacitance evolves with the treatment of the carbon component
as expected.
The specific capacitance is clearly linked to the surface of the electrode accessible by the
electrolyte. A significant increase in capacitance is observed when an activation treatment is
applied. Indeed, the specific capacitance increases sharply after 3 h of physical activation (more
than 25 F.g-1 compared to 5 F.g-1 for CX-Ref). A longer activation time increases the
capacitance but the values seem to level off after 8 h treatment.

15
Figure 3: (a) Cyclic voltammetry curves obtained at a scan rate of 20 mV.s-1 with the
supercapacitor type assembly for () CX-Ref, () CX-A3, (×) CX-A8, () CX-A16 and ()
CX-CVD and (b) associated values of calculated specific capacitance
This phenomenon could be explained by a kinetic effect since the measurements are realized
using high scan rates (20 mV.s-1), much higher than those generally used in CV analysis
performed on electrodes for Li-ion batteries. In contrast, the CVD treatment, reducing the
micropore volume accessible to N2 and CO2 molecules, results in a 30% decrease in specific
capacitance (3.2 F.g-1 compared to 5.0 F.g-1 for CX-Ref). Obviously, the capacitance in
electrodes prepared from CX-CVD and CX-Ref samples are dominated by the external surface
area, i.e. storage sites in micropores are not accessible to the ions because of either kinetic or
steric limitations. With activation, access of ions to micropores is provided and the capacitance
strongly increases. However, no direct correlation can be evidenced with the further increase
in the micropore surface area with activation duration, so that the capacitance rather tends
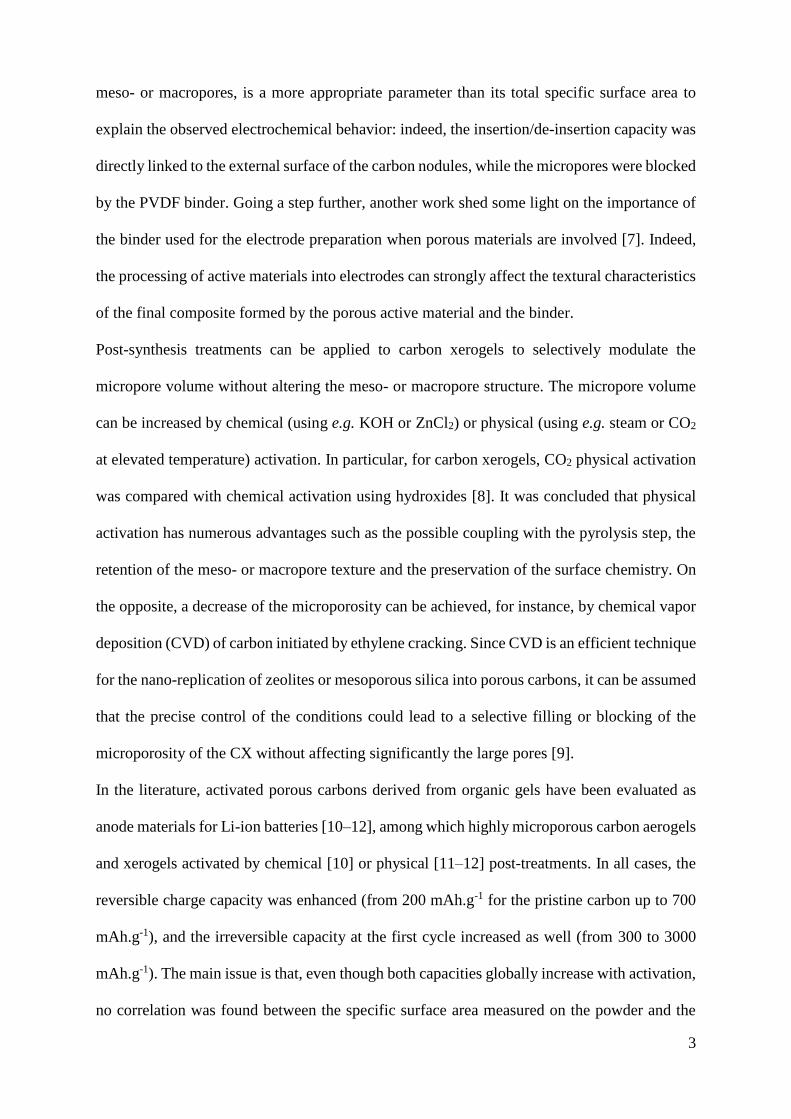
towards a maximum value. This described tendency is further illustrated in Fig. 4 showing the
calculated specific capacitance as a function of the micropore surface area. The value of
capacitance levels off, showing that the further increase in microporous surface does not result
in a linear increase in accessible storage sites.
16
Figure 4: Specific capacitance as a function of the micropore surface area (Smic.,NLDFT).
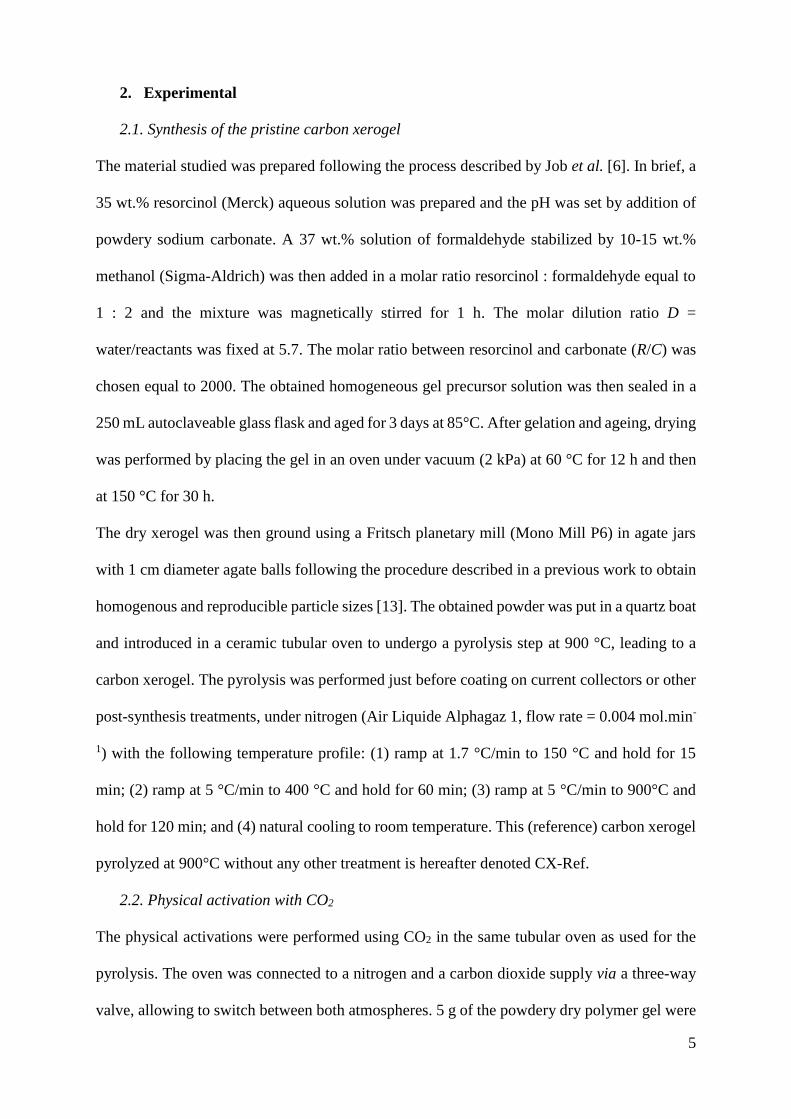
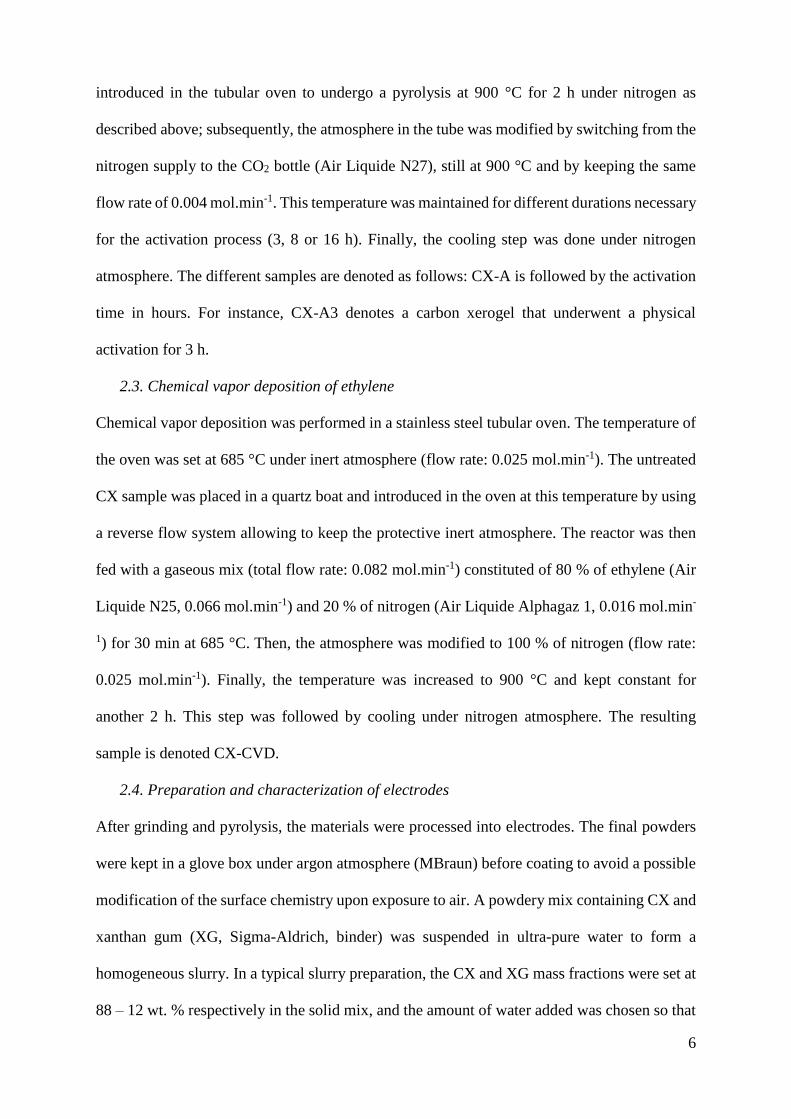
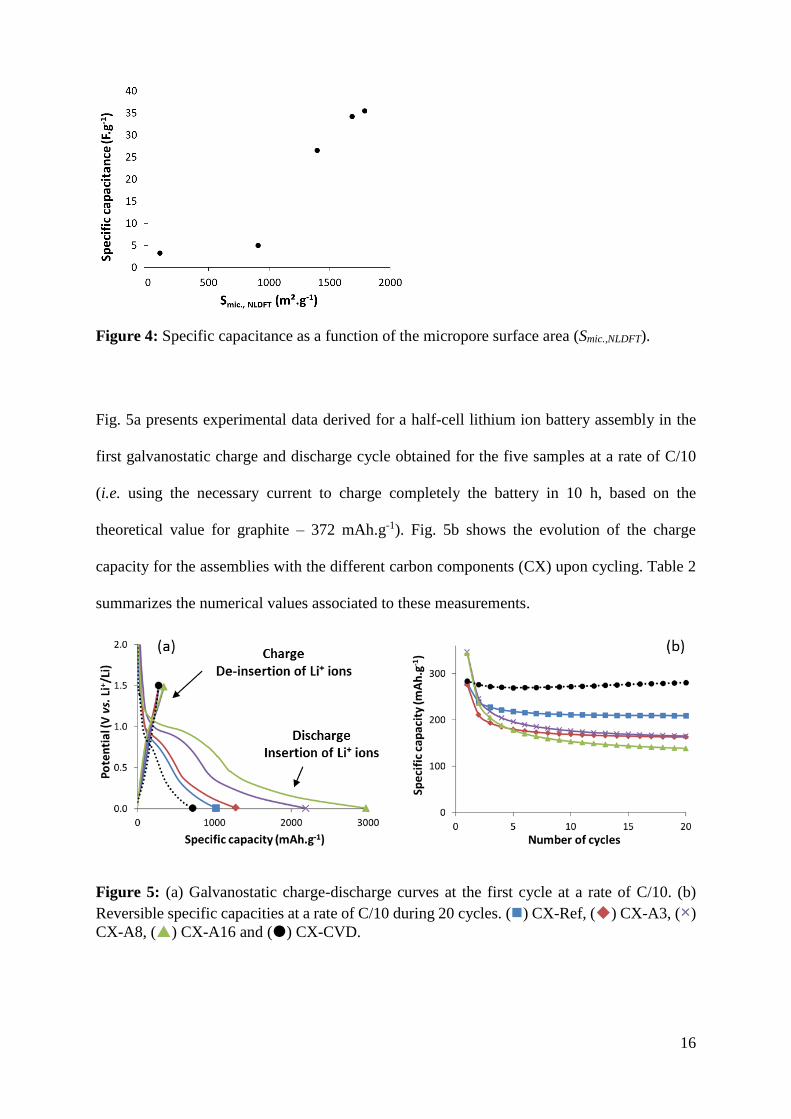
Fig. 5a presents experimental data derived for a half-cell lithium ion battery assembly in the
first galvanostatic charge and discharge cycle obtained for the five samples at a rate of C/10
(i.e. using the necessary current to charge completely the battery in 10 h, based on the
theoretical value for graphite – 372 mAh.g-1). Fig. 5b shows the evolution of the charge
capacity for the assemblies with the different carbon components (CX) upon cycling. Table 2
summarizes the numerical values associated to these measurements.
Figure 5: (a) Galvanostatic charge-discharge curves at the first cycle at a rate of C/10. (b)
Reversible specific capacities at a rate of C/10 during 20 cycles. () CX-Ref, () CX-A3, (×)
CX-A8, () CX-A16 and () CX-CVD.

17
Considering the first discharge, corresponding to the insertion of Li+ ions inside the CX
structure and to the formation of the solid electrolyte interface (SEI), it can be seen from the
comparison of the curves in Fig. 5a that the specific capacity strongly increases with the
duration of physical activation, and thus with the total accessible specific surface area i.e. the
sum of Smic,NLDFT and SW. On the other hand, the CVD treatment leads to a decrease of this
value compared to the reference material. Concerning the charge step, which corresponds to
the de-insertion of Li+ ions from the carbon structure, a slight increase in capacity is observed
with texture modification, but its extent is much more limited. Moreover, as shown in Fig. 5b,
even if the charge capacity for the activated samples is higher at the first cycle, it decreases
rapidly with further cycling and the values obtained after 20 cycles are in each case lower than
that corresponding to CX-Ref. On the opposite, CX-CVD keeps a stable and higher reversible
charge capacity compared to the reference material.
Table 2: Numerical values associated with electrochemical measurements performed at a
maximum potential value of 1.5 V vs. Li+/Li.
1st cycle 20th cycle
Sample Qirr
a
(mAh.g-1)
Qrevb
(mAh.g-1)
Qirr/Qrevc
(-)
Qrevb
(mAh.g-1)
± 5 % ± 5 % ± 0.1 ± 5 %
CX-CVD 452 276 1.6 268
CX-Ref 751 281 2.7 212
CX-A3 1015 269 3.9 165
CX-A8 1813 343 5.3 162
CX-A16 2589 334 7.8 135 a Irreversible capacity at the first cycle of charge-discharge: Qirr = Qdisch1-Qch1 (Qdisch1 corresponds to the capacity
at the first discharge and Qch1 corresponds to the capacity at the first charge). b Reversible capacity corresponding to the charge capacity of the half-cell (Qch). c Ratio between the irreversible capacity and the reversible capacity at the first charge-discharge cycle.
The Qirr/Qrev ratio (Table 2), calculated from the first charge-discharge cycle, is a parameter
that can be used in order to get a better insight into the global behavior of the material as anode
for a Li-ion battery. Indeed, this parameter takes into account both the irreversible losses and
the reversible capacity contribution. For an ideal active material of Li-ion battery, this ratio

18
should tend to zero. Moreover, it is independent of the mass of active material, thereby
precluding any possible error due to weighing of the electrodes [5]. The calculated ratio
decreases for CX-CVD compared to the reference material, indicating a better electrochemical
behavior. On the opposite, the ratio increases sharply with the activation time, due to a strong
increase of the irreversible losses. Indeed, the absolute value of Qirr is very high in the case of
CX-A16 (2589 mAh.g-1), which probably corresponds to a huge formation of the SEI on the
accessible surface in combination with a massive insertion of Li+ ions inside the micropores of
the carbon structure.
Figure 6: Qirr/Qrev at the first cycle as a function of (a) total accessible surface area (Stot =
Smic,NLDFT + Sw) and (b) the calculated cumulative volume of supermicropores (0.7–2.0 nm), as
calculated from Fig. 1c.
The change of Qirr/Qrev with the total accessible surface area and the volume of micropores in
the range between 0.7 and 2.0 nm (supermicropores) is further illustrated in Fig. 6. The data
corresponding specifically to the micropores as obtained from the combination of N2 and CO2
adsorption measurements were further refined upon plotting the cumulative micropore volume
as a function of the micropore sizes (Fig. 1c). The activation process makes additional
ultramicropores (< 0.7 nm) accessible, but their pore volume does not further evolve with
activation duration. On the opposite, a strong increase in both supermicropores (0.7-2.0 nm)
(a) (b)

19
size and volume takes place with extending the activation time. Interestingly, as shown from
Fig. 6b, a linear relationship can clearly be established between the supermicropore volume
and the Qirr/Qrev ratio, suggesting that the massive insertion of Li ions at the first cycle is mostly
controlled by the larger micropores. The offset in Fig. 6b indicates the contribution of the
external surface area to the irreversible capacity.
In the previous experiments, the maximum charge potential value for the electrochemical
characterization in the half-cells was voluntarily fixed at 1.5 V vs. Li+/Li, with the aim of
keeping conditions as close as possible to the working conditions of an anode material in a real
Li-ion battery. Nevertheless, studies on activated materials in the literature are generally
performed in a wider potential window (up to 2.0 or 3.0 V vs. Li+/Li) [10–12]. To allow for a
comparison with these values and to reach a better understanding of the phenomena occurring
in porous carbon materials when used as anodes for Li-ion batteries, the same electrochemical
characterizations were performed by setting the maximum charge potential at 3.0 V vs. Li+/Li.
Fig. 7a presents the curves corresponding to the first cycle of charge-discharge obtained for the
five samples at a rate of C/10. Fig. 7b shows the evolution of the reversible capacity of CX
samples upon cycling. Table 3 summarizes the numerical values associated to those
measurements.
Figure 7: (a) Galvanostatic charge-discharge curves at the first cycle at rate of C/10. (b)
Reversible specific capacities at rate of C/10 during 20 cycles. () CX-Ref, () CX-A3, (×)
CX-A8, () CX-A16 and () CX-CVD.

20
From Fig. 7a, it can be seen that, for all activated CX, a significant additional charge capacity
is present beyond 1.5 V and up to 3.0 V vs. Li+/Li. The longer the activation duration, the lower
the slope of the curve above 1.5 V vs. Li+/Li. Considering the absolute values, the reversible
capacity at the first charge cycle reaches 1330 mAh.g-1 for CX-A16. Increased values of charge
capacity are further maintained upon cycling up to 20 cycles (Fig. 7b), which was not the case
when the potential was limited to 1.5 V vs. Li+/Li.
The discharge capacity at the first cycle (first insertion of Li+ ions) is independent of the used
potential window. Nevertheless, since the reversible capacity is increased for activated samples
with the larger voltage window, the relative irreversible losses are significantly reduced.
Indeed, the value of Qirr is calculated by subtracting the charge capacity from the discharge
capacity at the first cycle. As the deinsertion (charge) capacity becomes much more important,
the irreversible losses are strongly decreased. As a consequence, in this case the Qirr/Qrev ratio
does not increase as for the characterization with the potential window limited at 1.5 V vs.
Li+/Li, but rather remains almost constant for all the studied samples.
Table 3: Numerical values associated with electrochemical measurements performed at a
maximum potential value of 3.0 V vs. Li+/Li.
1st cycle 20th cycle
Sample Qirr
a
(mAh.g-1)
Qrevb
(mAh.g-1)
Qirr/Qrevc
(-)
Qrevb
(mAh.g-1)
± 5 % ± 5 % ± 0.1 ± 5 %
CX-CVD 379 386 1.0 383
CX-Ref 593 383 1.5 329
CX-A3 710 585 1.2 381
CX-A8 1066 981 1.1 949
CX-A16 1794 1330 1.3 1251 a Irreversible capacity at the first cycle of charge-discharge: Qirr = Qdisch1-Qch1 (Qdisch1 corresponds to the
capacity at the first discharge and Qch1 corresponds to the capacity at the first charge). b Reversible capacity corresponding to the charge capacity of the half-cell. c Ratio between the irreversible capacity and the reversible capacity at the first charge-discharge cycle.
These results clearly show that the contribution of micropores is even more significant when
the characterization is performed up to high potential values (3.0 V vs. Li+/Li): indeed, during

21
the first discharge, Li+ ions are massively inserted inside the CX samples (up to 3000 mAh.g-1
for CX-A16). Li+ ions are only partially extracted when the charge step (Li+ de-insertion) is
performed up to 1.5 V vs. Li+/Li. Raising this potential value up to 3.0 V vs. Li+/Li allows for
a much more significant de-insertion of the Li+ from the structure of the activated carbon
xerogels. Concerning the CX-CVD sample, the potential value increase does not change the
tendency observed in comparison with the reference material. Indeed, in this sample, the
volume corresponding to micropores is strongly reduced. This further confirms the
predominant contribution of supermicropores (0.7 to 2 nm) to the massive insertion and
deinsertion of Li ions when cycling is performed up to a higher potential.
3.4. Comparison with graphite
In order to shed some light on the differences between the behavior of graphite (generally used
as anode in a Li-ion battery) and porous carbons, electrodes of graphite were prepared under
the same conditions as for the CX samples (same current collector, same binder, no conductive
additive and no pressing of the coating). Fig. 8 compares the electrochemical behavior of an
electrode made of CX-A16 with the one made with graphite.
Fig. 8: (a) First cycle of galvanostatic charge-discharge curves at a rate of C/10. (b) Cyclic
voltammetry curves for the first cycle at a rate of 0.05 mV.s-1. (+) Graphite and () CX-A16.

22
The first observation is that the charge capacity of the activated carbon xerogel is much higher
than that of graphite (Fig. 8a). However, in the case of graphite, the de-insertion of all the Li+
ions occurs in a narrow potential window (between 0.1 and 0.2 V vs. Li+/Li). This means that
the complete capacity is restored at a nearly constant potential value. Increasing the de-
insertion potential to a higher value would in this case not provide any additional capacity, as
evidenced from the vertical charge curve at potential higher than 0.2 V vs. Li+/Li. On the
opposite, in the case of CX, the charge process (de-insertion of Li+ ions) occurs continuously
over the whole potential window (between 0 to 3.0 V vs. Li+/Li), which is reflected by the
continuous charge increase versus potential. Due to this continuous increase, carbon xerogels
are not suitable for batteries delivering constant power (i.e. constant voltage) for the
application. Moreover, as mentioned earlier, a capacity at too a high potential value is less
useful in a real battery. Indeed, common cathode materials for Li-ion batteries usually display
insertion/de-insertion potentials around 3.5 to 4 V vs. Li+/Li. Consequently, the voltage of a
full cell would strongly decrease if the potential for the de-insertion from the carbon electrode
occurs at too a high value.
Further evidence is given by the comparison of the cyclic voltammetry curves (Fig. 8b). The
first main difference between the two materials during the first discharge is mainly attributed
to the degradation of the electrolyte at the surface of the CX material, leading to a huge SEI at
a potential close to 0.65 V vs. Li+/Li on the cathodic part of the cyclic voltammetry curve (Fig.
8b). This peak is almost undiscernible in the case of graphite. The insertion peak is found to
occur at similar potential values (between 0.005 and 0.15 V vs. Li+/Li) in both cases. On the
opposite, the de-insertion occurs in a narrow potential range in the case of graphite (reflected
by the narrow peak around ~0.23 V vs. Li+/Li), whereas at least three ill-defined peaks can be
observed at higher potential values in the case of CX (around 1.2 V, 2.3 V and 3.0 V vs. Li+/Li)
indicating a continuous de-insertion over the full range of potential (Fig. 8b). Therefore, the

23
major difference between these two materials results from a contribution to capacity above 1.5
V vs. Li+/Li, both curves leading to similar capacity values when cycling is performed at this
potential. The very different behavior at high potential in terms of Li+ insertion and de-insertion
results from the presence of a large amount of micropores, dominating the specific surface area
of the activated carbon in the electrode.
3.5. Effect of the microporosity on electrochemical behavior
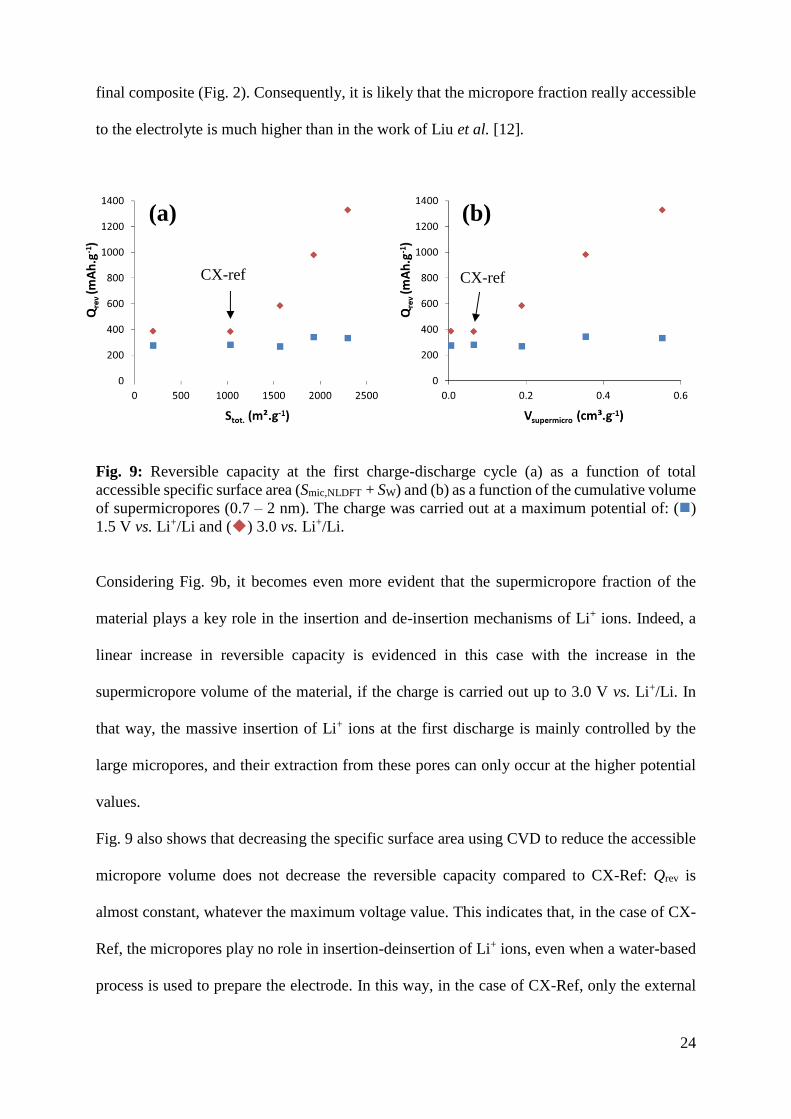
Fig. 9a shows the reversible charge capacity at the first charge-discharge cycle as a function of
the total accessible specific surface area (Smic,NLDFT + SW) of the CX powders for both series of
measurements, i.e. using either 1.5 V or 3.0 V vs. Li+/Li as maximum voltage. On the one hand,
the reversible charge capacity is almost constant when the potential is limited to 1.5 V vs.
Li+/Li, suggesting no direct influence of the micropores. On the other hand, when the charge is
carried out up to 3.0 V vs. Li+/Li, the reversible charge capacity increases with the total surface
area, for activated carbon xerogels. A direct relationship between Stot and Qrev is found only if
two conditions are fulfilled simultaneously: (i) the potential window is increased up to 3.0 V
vs. Li+/Li and (ii) the binder used preserves the micropore texture of the pristine materials.
Indeed, the absolute values of capacity obtained in the present study are much higher than those
found in literature with similar materials. In the case of a physically activated CX, Liu et al.
[12] report a reversible capacity value of 645 mAh.g-1 at a maximal potential of 3.0 V vs. Li+/Li
for a specific surface area, SBET, of 2912 m².g-1. The electrode was however prepared using an
organic ink (with PVDF in NMP), which certainly led to a sharp decrease of the microporosity
in the resulting active material-binder composite. In the present work, a reversible capacity
value of 1330 mAh.g-1 is obtained for a lower specific surface area, i.e. SBET equal to 2234
m².g-1. This very high difference can be explained by the aqueous preparation process of the
electrodes. Indeed, the method used in the present study (xanthan gum as binder in water)
allows for the preservation of the microporous texture of the pristine powder material in the
24
final composite (Fig. 2). Consequently, it is likely that the micropore fraction really accessible
to the electrolyte is much higher than in the work of Liu et al. [12].
Fig. 9: Reversible capacity at the first charge-discharge cycle (a) as a function of total
accessible specific surface area (Smic,NLDFT + SW) and (b) as a function of the cumulative volume
of supermicropores (0.7 – 2 nm). The charge was carried out at a maximum potential of: ()
1.5 V vs. Li+/Li and () 3.0 vs. Li+/Li.
Considering Fig. 9b, it becomes even more evident that the supermicropore fraction of the
material plays a key role in the insertion and de-insertion mechanisms of Li+ ions. Indeed, a
linear increase in reversible capacity is evidenced in this case with the increase in the
supermicropore volume of the material, if the charge is carried out up to 3.0 V vs. Li+/Li. In
that way, the massive insertion of Li+ ions at the first discharge is mainly controlled by the
large micropores, and their extraction from these pores can only occur at the higher potential
values.
Fig. 9 also shows that decreasing the specific surface area using CVD to reduce the accessible
micropore volume does not decrease the reversible capacity compared to CX-Ref: Qrev is
almost constant, whatever the maximum voltage value. This indicates that, in the case of CX-
Ref, the micropores play no role in insertion-deinsertion of Li+ ions, even when a water-based
process is used to prepare the electrode. In this way, in the case of CX-Ref, only the external
CX-ref CX-ref
(a) (b)

25
surface of the nodules is accessible to the Li+ ions: micropores are present in the nodules but
are not accessible to the electrolyte. As a consequence, the electrode capacity is identical,
whatever the maximum charge potential value considered. Physical activation using CO2
increases the total and in particular the accessible micropore volume and also leads to an
enlargement of their size. Such formation of a substantial volume of large micropores
(supermicropores: 0.7 to 2 nm) allows for an increased ion accessibility to the structure, and
so, a higher Li+ insertion. Consequently, when activated CX are used as negative electrode
(with xanthan gum as a binder), the enlargement of the micropores allows for an access to the
electrolyte, and so, the Li+ ions, leading to increased capacities directly related to the total
accessible surface area. Note again that the use of PVDF as a binder would not lead to the same
conclusions considering the fact that the microporosity of the porous carbon powder is blocked
by PVDF.
4. Conclusions
The modulation of the micropore volume of a carbon xerogel, as quantified by nitrogen and
CO2 adsorption-desorption analysis, was successfully achieved by the use of both CVD with
ethylene and CO2 physical activation. Materials with total surface areas between 200 and 2300
m².g-1 and nearly constant macropore size and volume, were produced. Li-ion battery
electrodes were prepared via an original aqueous process using xanthan gum as a binder and
water as a solvent. This process allows to preserve the textural characteristics (in particular the
accessibility of the micropores) of the CX powders in the final active material-binder
composite, which is not the case when PVDF in NMP is used, as in most studies.
Capacitance measurements show a significant improvement of the accessibility of the materials
by the electrolyte when activated CX are used. The influence of activation and carbon
deposition treatments on the electrochemical behavior of the samples in half-cell was
highlighted. Regarding Li+ insertion during the first cycle, a clear linear dependency could be

26
evidenced with the increase of the volume of supermicropores (0.7 – 2 nm), demonstrating the
effect of micropore enlargement by activation on the storage capacity. While the reversible de-
insertion capacity remained constant when the maximum potential value was set at 1.5 V vs.
Li+/Li, a clear linear relationship was observed between the supermicropore volume and the
reversible capacity at a maximum potential value of 3.0 V vs. Li+/Li. These results indicate that
the contribution of the larger micropores of CX materials to the observed Li+ storage capacity
is significant when cycling is performed in a wider potential window and when a water-
compatible binder is used for the electrode preparation. Indeed, during the first discharge, Li+
ions penetrate massively inside the CX micropore structure, but are only partially extracted
when the charge of the half-cell is performed up to 1.5 V vs. Li+/Li. The increase of the potential
value up to 3.0 V vs. Li+/Li allows for a more pronounced de-insertion of the Li+ ions from the
microporosity of the activated CX.
The present work has provided new information on the behavior of porous carbons when used
as anodes for Li-ion batteries. In particular, it has been demonstrated that, to determine the
influence of the micropore texture on parameters such as charge or discharge capacity, the pore
texture of the active material-binder composite needs to be taken into account: that of the
pristine powder could very well be irrelevant. Furthermore, the electrochemical
characterization conditions, and especially the potential window used, have to be clearly
defined to avoid any wrong conclusions. Indeed, if the potential is increased up to 3.0 V vs.
Li+/Li, a larger amount on Li+ ions can be de-inserted in the case of porous carbons, leading to
enhanced (and sometimes quite striking) capacity values; however, charge-discharge up to 3.0
V vs. Li+/Li for a negative electrode is not realistic for practical applications.

27
Acknowledgements
M.-L. Piedboeuf thanks the F.R.S.-FNRS for a FRIA fellowship grant. A. Léonard and N. Job
thank the financial support from the Région Wallonne (BATWAL, grant agreement 1318146,
PE Plan Marshall 2.vert) and the Research Funds for Coal and Steel - RFCS (PROMOTEE,
grant agreement 709741). The authors also thank the University of Liège (Fonds Spéciaux pour
la Recherche FSR C13/09) and the Fonds de Bay for their financial support.
References
[1] T. Nagaura, K. Tozaawa, Lithium Ion rechargeable battery, Prog. Batter. Sol. Cells. 9
(1990) 209–212.
[2] E. Buiel, J.R. Dahn, Li-insertion in hard carbon anode materials for Li-ion batteries,
Electrochim. Acta. 45 (1999) 121–130. doi:http://dx.doi.org/10.1016/S0013-
4686(99)00198-X.
[3] H. Fujimoto, K. Tokumitsu, A. Mabuchi, N. Chinnasamy, T. Kasuh, The anode
performance of the hard carbon for the lithium ion battery derived from the oxygen-
containing aromatic precursors, J. Power Sources. 195 (2010) 7452–7456.
doi:10.1016/j.jpowsour.2010.05.041.
[4] J. Ni, Y. Huang, L. Gao, A high-performance hard carbon for Li-ion batteries and
supercapacitors application, J. Power Sources. 223 (2013) 306–311.
doi:http://dx.doi.org/10.1016/j.jpowsour.2012.09.047.
[5] M.-L.C. Piedboeuf, A.F. Léonard, F.L. Deschamps, N. Job, Carbon xerogels as model
materials: toward a relationship between pore texture and electrochemical behavior as
anodes for lithium-ion batteries, J. Mater. Sci. 51 (2016) 4358–4370.
doi:10.1007/s10853-016-9748-3.
[6] N. Job, R. Pirard, J. Marien, J.-P. Pirard, Porous carbon xerogels with texture tailored
by pH control during sol–gel process, Carbon N. Y. 42 (2004) 619–628.
doi:http://dx.doi.org/10.1016/j.carbon.2003.12.072.
[7] N. Rey-Raap, M.-L.C. Piedboeuf, A. Arenillas, J.A. Menéndez, A.F. Léonard, N. Job,
Aqueous and organic inks of carbon xerogels as models for studying the role of porosity
in lithium-ion battery electrodes, Mater. Des. 109 (2016) 282–288.
doi:10.1016/j.matdes.2016.07.007.
[8] M.S. Contreras, C.A. Páez, L. Zubizarreta, A. Léonard, S. Blacher, C.G. Olivera-
Fuentes, et al., A comparison of physical activation of carbon xerogels with carbon
dioxide with chemical activation using hydroxides, Carbon N. Y. 48 (2010) 3157–3168.
doi:10.1016/j.carbon.2010.04.054.
[9] Z. Yang, Y. Xia, X. Sun, R. Mokaya, Preparation and hydrogen storage properties of
zeolite-templated carbon materials nanocast via chemical vapor deposition: Effect of the
zeolite template and nitrogen doping, J. Phys. Chem. B. 110 (2006) 18424–18431.
doi:10.1021/jp0639849.
[10] Y. Zhu, X. Xiang, E. Liu, Y. Wu, H. Xie, Z. Wu, et al., An activated microporous carbon
prepared from phenol-melamine-formaldehyde resin for lithium ion battery anode,
Mater. Res. Bull. 47 (2012) 2045–2050.
doi:http://dx.doi.org/10.1016/j.materresbull.2012.04.003.

28
[11] S.J. L. Nian-Ping G. Da-Yong, L. Dong, Z. Xiao-Wei, L. Ya-Jie, Effect of carbon
aerogel activation on electrode lithium insertion performance, Acta Physico-Chemica
Sin. 29 (2013) 966–972. doi:10.3866/PKU.WHXB201302281.
[12] X. Liu, S. Li, J. Mei, W.-M. Lau, R. Mi, Y. Li, et al., From melamine-resorcinol-
formaldehyde to nitrogen-doped carbon xerogels with micro- and meso-pores for
lithium batteries, J. Mater. Chem. A. 2 (2014) 14429–14438.
doi:10.1039/C4TA02928C.
[13] M.-L.C. Piedboeuf, A.F. Léonard, K. Traina, N. Job, Influence of the textural parameters
of resorcinol–formaldehyde dry polymers and carbon xerogels on particle sizes upon
mechanical milling, Colloids Surfaces A Physicochem. Eng. Asp. 471 (2015) 124–132.
doi:http://dx.doi.org/10.1016/j.colsurfa.2015.02.014.
[14] M. Thommes, K. Kaneko, A.V. Neimark, J.P. Olivier, F. Rodriguez-Reinoso, J.
Rouquerol, K.S.W. Sing, Physisorption of gases, with special reference to the evaluation
of surface area and pore size distribution (IUPAC Technical Report), Pure Appl. Chem.
87 (2015) 1051–1069.
doi: http://dx.doi.org/10.1515/pac-2014-1117
[15] R.W. Magee, Evaluation of the External Surface Area of Carbon Black by Nitrogen
Adsorption, Rubber Chemistry and Technology, 68 (1995) 590-600.
doi:http://doi.org/10.5254/1.3538760.
[16] P. Tarazona, A density functional theory of melting, Mol Phys, 52 (1984) 81-96.
doi: http://doi.org/10.1080/00268978400101071.
[17] P. Tarazona, Free-energy density functional for hard spheres, Phys. Rev. A, 31 (1985)
2672-2679.
doi: http://doi.org/10.1103/PhysRevA.31.2672.
[18] P. Tarazona, M.B. Marconi, R. Evans, Phase equilibria of fluids interfaces and confined
fluids: Non-local versus local density functionals, Mol Phys, 60 (1987) 573-595.
doi: http://doi.org/10.1080/00268978700100381
[19] J.P. Olivier, Modeling physical adsorption on porous and nonporous solids using density
functional theory, J. Porous Mat., 2 (1995) 9-17.
doi: http://doi.org/10.1007/BF00486565.
[20] M.W. Maddox, J.P. Olivier, K.E. Gubbins, Characterization of MCM-41 using
molecular simulation: Heterogeneity effects, Langmuir, 13 (1997) 1737-1745.
doi: https://pubs.acs.org/doi/abs/10.1021/la961068o.
[21] C. Balzer, R.T. Cimino, G.Y. Gor, A.V. Neimark, G. Reichenauer, Deformation of
microporous carbons during N2, Ar, and CO2 adsorption: Insight from the density
functional theory, Langmuir, 32 (2016) 8265–8274.
doi: http://pubs.acs.org/doi/10.1021/acs.langmuir.6b02036
[22] E.W. Washburn, Note on a method of determining the distribution of pore sizes in a
porous material, Proc. Natl. Acad. Sci. 7 (1921) 115–116.
[23] G.F.M. Antonio, F. Franco, N. Batalha, M.M. Pereira, Coupling CH4 pyrolysis with CO2
activation via reverse Boudouard reaction in the presence of O2 through a
multifunctional catalyst Ni-V-Li/Al2O3, J. CO2 Util. 16 (2016) 458–465.
doi:10.1016/j.jcou.2016.10.011.