how do organisms supply themselves with energy. copyright © 2005 pearson education, inc. publishing...
TRANSCRIPT

How do Organisms Supply Themselves with Energy

Copyright © 2005 Pearson Education, Inc. publishing as Benjamin Cummings
Light energy
ECOSYSTEM
CO2 + H2O
Photosynthesisin chloroplasts
Cellular respirationin mitochondria
Organicmolecules
+ O2
ATP
powers most cellular work
Heatenergy
Figure 9.2 Energy flow and chemical recycling in ecosystems

Respiration
C6H12O6 + 6 O2 6 CO2 + 6 H2O
Photosynthesis
6 CO2 + 6 H2O C6H12O6 + 6 O2
CO2 + H2O C(H2O) + 6 O2
Copyright © 2005 Pearson Education, Inc. publishing as Benjamin Cummings
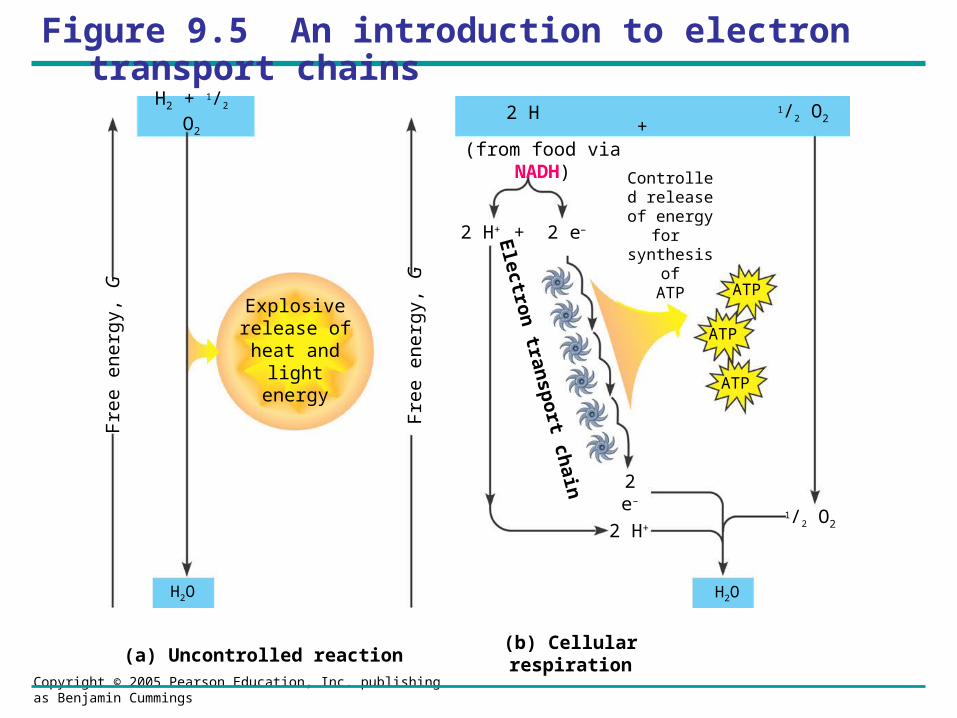
H2 + 1/2 O2 2 H 1/2 O2
(from food via NADH)
2 H+ + 2 e–
2 H+
2 e–
H2O
1/2 O2
Controlled release of energy for synthesis of
ATPATP
ATP
ATP
Electro
n tran
spo
rt chain
F
ree
ener
gy, G
(b) Cellular respiration(a) Uncontrolled reaction
Fre
e en
ergy
, G
H2O
Explosiverelease of
heat and lightenergy
+
Figure 9.5 An introduction to electron transport chains

Copyright © 2005 Pearson Education, Inc. publishing as Benjamin Cummings
Figure 9.6 An overview of cellular respiration
Glycolsis
Glucose
Pyruvate
ATP
Substrate-levelphosphorylation
Mitochondrion

Copyright © 2005 Pearson Education, Inc. publishing as Benjamin Cummings
Figure 9.6 An overview of cellular respiration
ATP
Substrate-levelphosphorylation
Mitochondrion
Glycolsis
Glucose
Pyruvate
ATP
Substrate-levelphosphorylation
Citric acid cycle

Copyright © 2005 Pearson Education, Inc. publishing as Benjamin Cummings
Figure 9.6 An overview of cellular respiration
Electronscarried
via NADH
Glycolsis
Glucose Pyruvate
ATP
Substrate-levelphosphorylation
Electrons carried via NADH and
FADH2
Citric acid cycle
Oxidativephosphorylation:electron transport
andchemiosmosis
ATPATP
Substrate-levelphosphorylation
Oxidativephosphorylation
Mitochondrion


Copyright © 2005 Pearson Education, Inc. publishing as Benjamin Cummings
Figure 9.13 Free-energy change during electron transport
Glycolysis Citircacidcycle
Oxidativephosphorylation
ATP ATP ATP
H2O
O2
NADH
FADH2
FMN
Fe•S Fe•S
Fe•S
O
FAD
Cyt b
Cyt c1Cyt c
Cyt aCyt a3
2 H + + 12
III
III
IV
Multiproteincomplexes
0
10
20
30
40
50
Fre
e e
ne
rgy
(G)
rela
tive
to
O2 (k
cl/m
ol)


Copyright © 2005 Pearson Education, Inc. publishing as Benjamin Cummings
Glucose
CYTOSOL
Pyruvate
No O2 presentFermentation
O2 present Cellular respiration
Ethanolor
lactate
Acetyl CoA
MITOCHONDRION
Citricacidcycle
Figure 9.18 Pyruvate as a key juncture in catabolism

Copyright © 2005 Pearson Education, Inc. publishing as Benjamin Cummings
Amino acids
Sugars Glycerol Fattyacids
Glycolysis
Glucose
Glyceraldehyde-3- P
Pyruvate
Acetyl CoA
NH3
Citricacidcycle
Oxidativephosphorylation
FatsProteins Carbohydrates
Figure 9.19 The catabolism of various molecules from food

Copyright © 2005 Pearson Education, Inc. publishing as Benjamin Cummings
Glucose
Glycolysis
Fructose-6-phosphate
Phosphofructokinase
Fructose-1,6-bisphosphateInhibits Inhibits
Pyruvate
ATPAcetyl CoA
Citricacidcycle
Citrate
Oxidativephosphorylation
Stimulates
AMP
+
– –
Figure 9.20 The control of cellular respiration