how do managed care plans reduce healthcare …jnv2106/jvanparys.jmp.pdfhow do managed care plans...
TRANSCRIPT

How Do Managed Care Plans Reduce Healthcare Costs?∗
Jessica Van Parys †
October 29, 2014
JOB MARKET PAPER
Abstract
The US public health insurance market is shifting toward reimbursement models that trans-
fer risk away from the government and toward health insurers and healthcare providers. Instead
of paying fee-for-service (FFS) to healthcare providers, Medicaid and Medicare now outsource
healthcare delivery to managed care plans and the plans accept risk related to their enrollees’
healthcare costs. Previous research reaches mixed conclusions about whether managed care
plans actually reduce costs. In this paper, I study Florida’s 2006 Medicaid Reform, which
mandated that Medicaid beneficiaries switch from the state’s FFS system to (1) insurer-owned
plans, (2) hospital-owned plans, or (3) physician-owned plans. I find that insurer-owned plans
reduced costs by 7-12% in all reform markets, but insurers in different markets reduced costs
in different ways. Insurers reduced the number of hospital visits after a hospital plan entered
one market, but insurers reduced the average cost per hospital visit after physician plans en-
tered another market. Motivated by these empirical findings, I show how insurers choose their
strategies in different markets. The results suggest that insurers have leverage in how they
reduce costs, but that competition with provider plans may restrict their options.
∗I would like to thank Doug Almond, Janet Currie, Tal Gross, Kate Ho, Bentley MacLeod, and the applied microe-conomics colloquium at Columbia University for their comments and suggestions. This project was supported by grantnumber R36HS023504 from the Agency for Healthcare Research and Quality. The content is solely the responsibilityof the author and does not necessarily represent the official views of the Agency for Healthcare Research and Quality.†Economics Department, Columbia University, 420 West 118th Street MC 3308, New York, NY 10027
1
1 Introduction
The US public health insurance programs, Medicaid and Medicare, now account for 24% of federaland state budgets, and expenditures on these programs are expected to grow by 6-8% per yearthrough 2023 (CMS 2013; [9] Rudowitz 2014 [39]). One in three US citizens is currently enrolled ina public health insurance program and enrollment is expected to increase as the population agesand states expand Medicaid eligibility under the Patient Protection and Affordable Care Act (CMS2013; [9] State Health Facts Medicaid Expansion 2014 [40]). As healthcare expenditures consumean increasing share of public expenditures, state and federal governments are under increasingpressure to reduce program costs (Boyd 2014; [7] State Budget Crisis Task Force 2012 [37]).
One of the most championed initiatives to reduce government healthcare expenditures is toswitch beneficiaries from the fee-for-service (FFS) system to managed care plans. Historically,Medicaid and Medicare paid a fee for every service to healthcare providers to treat patients. TheFFS system, however, encourages the over-utilization of medical resources, so Medicaid and Medi-care have been shifting beneficiaries to managed care plans. Managed care plans are owned andoperated by health insurers or healthcare providers and they are responsible for coordinating theirbeneficiaries’ healthcare. Managed care plans have incentives to reduce healthcare costs relativeto the FFS system, yet it is unclear whether plans actually reduce costs or how they might doso. Moreover, governments often reimburse managed care plans in a way that makes it difficultto realize cost-savings from managed care. This paper contributes to the literature by showinghow managed care plans reduce their own healthcare costs, which may help governments redesignreimbursements to share in cost-savings.
This paper uses the rollout of Florida’s 2006 Medicaid Reform to show how switching fromFFS to managed care affects total hospital costs. Hospital costs include costs associated withemergency room visits (ER) and hospitalizations and they account for the largest share of Medicaidexpenditures (CMS 2013; [9] State Health Facts Medicaid Expenditures 2012 [15]). Florida’s reformmandated that Medicaid children, families, aged, and disabled beneficiaries in five counties switchfrom the state’s FFS system to managed care plans. Medicaid beneficiaries in the remaining 62counties were not required to switch plans. Since not all beneficiaries were required to switchplans, the reform generated precise treatment and control groups and the groups are quite similaralong many observable dimensions. Therefore, to calculate the impact of the switch from FFSto managed care, I estimate a difference-in-difference model where I compare total hospital costsin reform counties to total hospital costs in non-reform counties before and after the reform wasimplemented.
Florida’s 2006 Medicaid Reform is also one of the first examples where health insurers andhealthcare providers competed directly for beneficiaries, so it provides a laboratory in which to
2

test whether competition between insurers and providers affects insurers’ strategies to reduce costs.Florida’s five reform counties were located in two geographically distinct but equally-sized mar-kets and different managed care plans operated in different markets. Insurer-owned plans operatedin both markets, but a hospital plan entered the Northeast Florida market, while physician plansentered the Southeast Florida market. Since different types of provider-owned plans entered dif-ferent markets, I explore the heterogeneous effects of the reform across markets and I show thatinsurers adopted different strategies to reduce costs in different markets.
The results of the empirical analysis reveal that switching from FFS to managed care reducedhospital costs by 7-12% in both markets, but that insurers reduced costs in different ways in differ-ent markets. In Northeast Florida, insurers reduced the number of nonemergency hospital visits.In Southeast Florida, insurers reduced the average cost per hospital visit. Consistent with thesefindings, I write a model to explain how insurers choose their strategies to minimize costs and Ishow that their optimal strategies depend on competition with provider-owned plans.
In the model, plans choose a combination of three labor inputs to minimize the total costsof producing a fixed amount of medical care for their enrollees. The three labor inputs are, (1)the number of primary care physician hours, (3) the number of in-network ER physician hours,and (3) the number of out-of-network ER physician hours. By increasing the number of primarycare physician hours, plans reduce the number of nonemergency hospital visits. By increasing thenumber of in-network ER physician hours, plans reduce the average cost per hospital visit. I showthat as the marginal cost of primary care physician hours increases, plans substitute away fromprimary care physicians and toward ER physicians. Similarly, as the marginal cost of in-networkER physician hours increases, plans substitute away from in-network ER physicians and towardprimary care physicians.
The model generates different predictions for different markets. The predictions depend onwhether insurers compete with hospital plans or with physician plans. When hospital plans formexclusive contracts with their ER physicians, they reduce the short run supply of ER physiciansavailable to insurers. As the supply of ER physicians decreases, the marginal cost of ER physi-cians increases. As a result, insurers substitute away from ER physicians and toward primary carephysicians. The increase in primary care physicians leads to fewer hospital visits in markets wherehospital plans form exclusive networks.
Similarly, when physician plans form exclusive contracts with their primary care physicians,they reduce the short run supply of primary care physicians available to insurers. As the supply ofprimary care physicians decreases, the marginal cost of primary care physicians increases. Insur-ers then substitute away from primary care physicians and toward in-network ER physicians. Theincrease in ER physician networks reduces the average cost per hospital visit in markets wherephysician-owned plans form exclusive networks. Since the number of hospital visits decreased
3

after a hospital plan entered the Northeast Florida reform market and the average cost per hospi-tal visit decreased after physician plans entered the Southeast Florida reform market, the modelexplains the empirical effects of Florida’s reform quite well.
This paper is organized into the following sections: Section 2 describes the costs and benefitsof fee-for-service and managed care and reviews the Medicaid managed care literature. It alsodescribes the institutional features of Florida’s 2006 Medicaid Reform and compares it to reformsin other states. Section 3 solves the cost minimization problem for managed care plans and explainshow plans choose their strategies in different markets. Section 4 describes the hospital dischargedata and the difference-in-differences empirical strategy. Section 5 presents the results for hospitalcosts and shows how managed care plans in different markets reduced costs. Section 6 summarizesthe paper’s contributions and presents ideas for future work.
2 Fee-For-Service (FFS) versus Managed Care
This section describes the differences between fee-for-service and managed care for Medicaidbeneficiaries. The main difference between FFS and managed care is that managed care planshave incentives to reduce healthcare costs and utilization. However, states design their Medicaidmanaged care programs differently, so the Medicaid managed care literature has reached differentconclusions about whether managed care plans actually reduce costs or utilization. In this paper,I show that the institutional features of state Medicaid programs affect how managed care plansreduce costs, so in this section, I discuss the key features of Florida’s 2006 Medicaid Reform andI compare Florida’s reform to Medicaid reforms in other states.
2.1 Incentives Under FFS and Managed Care
Medicaid in the United States has two general models for healthcare delivery. Under fee-for-service (FFS) delivery, Medicaid beneficiaries can visit any healthcare provider and the providerreceives a fee for every service that she provides the beneficiary. States set Medicaid fees for alltypes of healthcare providers including physicians and hospitals.1 Under managed care delivery,Medicaid beneficiaries enroll in a state-authorized health plan and the health plan is responsiblefor managing the beneficiaries’ care. States use different forms of reimbursement to incentivizemanaged care plans to reduce healthcare costs relative to the FFS system. The most common
1Florida Medicaid establishes a fee for every service for every type of licensed healthcare practitioner. Inpatienthospital fees are flat fees per visit-day, where the fee is a function of the hospital’s total costs for treating Medicaidpatients. The hospital fees have arbitrary ceilings that vary across counties and healthcare regions. Physician fees areflat fees per service and they do not vary across regions. All fees are updated annually.
4
form of reimbursement is a flat per-member-per-month fee (capitation) for each beneficiary thatthe plans enroll.2
Medicaid managed care plans have incentives to reduce their healthcare costs relative to theFFS system to remain profitable. State governments only reimburse managed care plans up toa limit, so plans absorb financial losses if their healthcare costs exceed the government limit.Mathematically, if plan profits equal total revenue minus total costs, then plans are profitable whentheir total revenue exceeds their total costs. Total revenue equals the capitation fee times thenumber of beneficiaries in the plan. Total costs equal the average cost per medical visit times thenumber of visits. Therefore, plans have an incentive to reduce either the average cost per visitand/or the number of visits to reduce their total healthcare costs.
Relative to the managed care system, the FFS system is criticized for three reasons. The pri-mary criticism is that FFS encourages the overutilization of medical resources (McGuire 2000; [34]
Wennberg 2010 [42]). If healthcare providers are reimbursed for how much medical care they pro-vide, then they will provide more care, all else equal. Other criticisms of FFS include: (2) gov-ernments are less efficient than markets at determining the optimal price per service, so someservices are priced too high while others are priced too low, and (3) the low prices under Med-icaid FFS discourage providers from accepting Medicaid patients. The primary justification forswitching Medicaid beneficiaries to a market-oriented system, where managed care plans competefor enrollees and receive capitation fees, is that plans will be able to identify and eliminate theinefficiencies in the FFS system.
How states determine capitation fees, however, affects how managed care plans reduce costs.3
Capitations are the maximum dollar amount that the state reimburses managed care plans perenrollee. States often calculate capitation fees using historical FFS claims from the Medicaidpopulation. For example, states estimate average costs per beneficiary based on the average FFScost per visit and the average number of visits per beneficiary.4 Then states discount these ratesby 5-10% to glean cost-savings from managed care (Holahan et al. 1998 [27]).5 This means that if
2Other types of reimbursement options include prepaid health plans and shared savings. Prepaid health plansreceive a fixed per member per month fee for a limited, pre-defined set of services. Florida’s reform did not featureprepaid health plans, although Florida Medicaid has a separate prepaid health plan program for behavioral services.Shared savings plans receive fee-for-service, but if their total costs exceed the would-be capitation, then the plans paya penalty. If their total costs are less than the would-be capitation, then they keep the difference. Florida’s reformfeatured shared savings plans and capitated plans.
3Not all states set their capitation fees. CA elicited bids from managed care plans for its Medicaid Reform (Aizeret al. 2007; [2] Duggan et al. 2004 [18]).
4States vary in their sophistication with risk-adjustment. Pre-reform, Florida risk-adjusted capitation fees based onsex, age, region, and Medicaid eligibility (e.g., TANF males ages 0-1 in Region 4). Post-reform, Florida phased in asystem of risk-adjustment that also accounted for prescription drug usage.
5CMS waivers require that states achieve budget neutrality from mandated managed care. Budget neutrality ismeasured in the following way: First states calculate total expenditures for the mandated population under FFS usinghistorical claims records and project that amount into the future (accounting for a growth rate and inflation). Then
5
Medicaid beneficiaries have historically few medical visits under FFS or if the state has historicallylow FFS fees, then capitations will be lower and managed care plans may have trouble reducingcosts. On the other hand, if the FFS system generated inefficiently high numbers of medical visits,inefficiently high-cost treatments, or inefficiently high fees, then managed care plans may haveopportunities to reduce costs. Florida Medicaid set very low provider fees under FFS (Goin andZuckerman 2012 [23]), so Florida’s managed care plans were less likely to reduce the average priceper visit, but they were potentially capable of reducing the number of visits or the amount of careprovided per visit.
2.2 History of Medicaid Managed Care
The evolution from FFS to managed care has occurred in four phases and Florida’s 2006 Reformfalls under the most recent phase.6 Medicaid managed care began in the 1970s, but it acceleratedthrough the 1990s as it became the preferred healthcare delivery system for most states (Iglehart2011 [29]). The percentage of Medicaid beneficiaries in some form of managed care grew from10% in 1991 to 72% in 2011. The earliest form of “managed care” was called primary carecase management (PCCM), which meant that a primary care physician gatekeeper was responsiblefor providing preventative care, treating nonemergency conditions, and issuing referrals, but allhealthcare providers continued to receive FFS reimbursements from the state. The drawback ofPCCM was that it did not incentivize providers to treat patients more efficiently because theycontinued to receive FFS reimbursements from the state. The purpose of Florida’s 2006 Reformwas to switch beneficiaries from the PCCM program to capitated managed care plans.
The second phase of Medicaid managed care introduced capitated health plans, but Medicaidbeneficiaries voluntarily enrolled in these plans. Insurer-owned plans (e.g., health maintenanceorganizations (HMOs)) were the most common form of capitated health plan.7 Insurer-ownedplans assigned beneficiaries to primary care physicians who were responsible for issuing referralsto other providers. Insurers also constructed low-cost networks of healthcare providers and, wherepossible, steered beneficiaries to in-network providers. Throughout the 1990s-2000s, Medicaidbeneficiaries in Florida had the option to enroll in insurer-owned plans, but enrolling in these planswas voluntary. The drawback to voluntary managed care was that plans could profit by selectingthe healthiest patients instead of finding ways to treat patients more efficiently.
The third phase of Medicaid managed care mandated that beneficiaries switch from FFS to
states estimate total expenditures under a managed care system with capitation fees and project that amount intothe future. Budget neutrality requires that the latter amount not exceed the former amount. Florida discounted itscapitation fees by approximately 7% to achieve budget neutrality.
6Glied (2000) [22] reviews the first three phases of managed care.7Other types of plans include provider service networks, community organized health systems, and prepaid health
plans. Insurer-owned plans can be Medicaid-Medicare-only HMOs and/or commercial HMOs.
6

capitated managed care plans. Whereas most of the early managed care enrollment was voluntary,the Balanced Budget Act (BBA) of 1997 made it easier for states to require that beneficiariesenroll in managed care.8 As a result, states like California, New York, Tennessee, Washington,and Wisconsin mandated that Medicaid children and families (TANF-eligible) enroll in capitatedmanaged care plans. Florida, however, did not mandate beneficiaries into managed care plansuntil its 2006 reform. The drawback to managed care mandates for only children and families isthat those groups have the lowest healthcare costs among Medicaid beneficiaries. The aged anddisabled beneficiaries have much higher healthcare costs and they remained in the FFS system.
The fourth phase of managed care is happening now. States want to enroll most, if not all, oftheir Medicaid beneficiaries into managed care plans and they want to offer more managed careplan options (Carroll 2011 [8]). Since 2005, several states have sought federal approval to mandatetheir aged and disabled (SSI-related) beneficiaries enroll in managed care.9 SSI beneficiaries havemore complex healthcare needs than TANF beneficiaries and they are, on average, more expensivethan TANF beneficiaries. Therefore, states hope to achieve greater cost-savings from requiring SSIbeneficiaries to enroll in managed care. Some states also want to offer managed care plans thatare owned and operated by healthcare providers and these plans will compete with the traditionalinsurer-owned plans.10
Florida’s 2006 Medicaid Reform is one of the most innovative managed care reforms for tworeasons. First, the reform mandated that aged and disabled beneficiaries, in addition to childrenand families, switch from FFS to managed care plans. Fewer states have mandated that aged anddisabled beneficiaries enroll in managed care and there is very little research about how managedcare affects these types of beneficiaries. Second, Florida’s reform offers a wider range of managedcare plans for beneficiaries to choose from. Beneficiaries can choose the standard insurer-ownedplans, which are similar to the managed care options in other states, or beneficiaries can chooseprovider-owned plans, which are similar to the Accountable Care Organizations offered by Medi-care. Because beneficiaries have more plan options, Florida’s reform offers an opportunity tostudy how competition between insurer-owned plans and provider-owned plans affects insurers’strategies to reduce costs. Therefore, this paper offers insights to policymakers who would like toimplement similar reforms in other states.
8Prior to the 1997 Balanced Budget Act (BBA), states had to obtain pre-approval from the Centers for Medicareand Medicaid Services (CMS) to require beneficiaries to enroll in managed care. The BBA, however, allowed statesto enroll children and families in managed care without obtaining pre-approval from CMS.
9AZ, CA, IL, NJ, NY, TN, TX, and WV are some examples of states that either have expanded or expect to expandmandatory managed care to their aged and disabled populations.
10AL, IL, MI, and NY are some examples of states that either currently offer or expect to offer provider-ownedmanaged care plans. There has been a growing interest in provider-owned plans for Medicaid beneficiaries since the2009 Affordable Care Act promoted the use of provider plans for Medicare beneficiaries.
7

2.3 Research on Medicaid Managed Care Reforms
The central question in the Medicaid managed care literature is, how does managed care affecthealthcare utilization, costs, and outcomes? The literature has produced mixed results, largely be-cause states design and implement their managed care programs differently and because managedcare has evolved so much over time (Howell et al. 2012 [28]).11 The most common finding is thatmanaged care plans reduce the number of unnecessary emergency room visits and hospitalizations(Baker and Afendulis 2005; [4] Bindman et al. 2005; [6] Dombkowski et al. (2004); Garret et al.2003; [21] Marton et al. 2014 [33]). One potential explanation for the reduction in unnecessary hospi-tal visits is that managed care plans provide better access to primary care (Coughlin et al. 2009; [11]
Levinson and Ullman 1998 [31]). These findings are far from definitive, however, because somepapers find no effects of managed care on primary care access (Basu et al. 2004; [5] Herring andAdams 2010 [26]) and other papers find worse access to primary care for some beneficiaries, par-ticularly pregnant women (Aizer et al. 2007; [2] Conover et al. 2001; [10] Currie and Fahr 2005; [13]
Kaestner et al. 2005 [30]).A key result from the managed care literature is that plans will not improve access to primary
care for beneficiaries who are capable of being carved out. Carve-outs refer to situations in whichmanaged care plans can drop beneficiaries from coverage when they become too expensive, whichmost often occurs after the onset of a serious medical condition. The carved-out beneficiaries arethen re-enrolled in the state’s FFS program. When managed care plans are not required to coverhigh-risk pregnancies, for example, the incentive to provide high-quality prenatal care is eliminated(Aizer et al. 2007 [2]).
Fewer studies have determined how managed care affects government expenditures. Dugganand Hayford (2011) [19] find that mandated managed care has not reduced total healthcare expendi-tures in the average state, and in the states where it has reduced expenditures, the authors suggestthat the savings come from lower prices rather than lower utilization. Their hypothesis is thatmanaged care plans can more easily negotiate lower prices with providers in states with high base-line fee-for-service fees. The trouble with this kind of state-level analysis is that states determinetheir capitation fees differently, they mandate different groups of beneficiaries into managed careplans, and they allow different carve-out services. It is therefore difficult to identify why totalexpenditures changed in some states, but not others, without taking account of these factors.
One way to account for the institutional differences across managed care programs is to conductanalysis within one state as opposed to comparing multiple states. Duggan (2004) [18] evaluates therollout of mandated managed care for children and families in California from 1993-1999. He finds
11Though the Medicaid managed care literature has reached mixed conclusions, research on managed care in theprivate health insurance market has shown that managed care plans reduce healthcare costs by reducing healthcareutilization (Glied 2000) [22] and by reducing prices paid to healthcare providers (Cutler et al. 2000 [14]).
8

that mandated managed care increased healthcare expenditures by 17% and it did not improvehealth outcomes. One interpretation of Duggan’s (2004) findings is that California designed itsmanaged care program sub-optimally. For example, CA did not set its capitation fees or allowmanaged care plans to compete in all counties, as Florida did in 2006. Instead, the state elicited bidsfor capitation fees from managed care plans and only permitted competition in certain counties.Notably, total expenditures did not increase by as much or as consistently in counties with twomanaged care plans. Expenditures primarily increased in counties with one plan. This highlightshow institutional features can determine the efficacy of healthcare reforms.
Two recent papers by Harman et al. (2011) [24] and Harman et al. (2014) [25] show how Florida’s2006 Medicaid Reform affected total government expenditures on Medicaid. They find no effectson total expenditures in the two years post-reform and they find small decreases in expendituresfour years post-reform. One limitation of estimating managed care’s effects on government expen-ditures, however, is that total expenditures are largely determined by the capitation fee set by thestate. If Florida sets its capitation fee equal to the expected costs under the FFS system, then evenif managed care plans reduced costs, the difference between the capitation fee and the managedcare plan’s costs is the plan’s profit, which is generally unobservable in Medicaid claims data.12 Itis arguably more important to show that managed care plans incur lower costs than the governmentdoes under FFS, because then states might be able to reduce their capitation fees and still havefunctioning Medicaid delivery systems. For that reason, this paper investigates whether Florida’smanaged care plans reduced hospital costs relative to the FFS system and focuses on the strategiesthat plans took to reduce costs.
Despite the incomplete evidence on the effects of managed care on healthcare utilization, costs,and outcomes, many states continue to expand their managed care programs (Draper et al. 2004; [17]
Iglehart et al. 2011; [29] Libersky et al. 2013 [32]). This paper offers two contributions to the statesthat wish to expand mandated managed care. First, it shows that managed care plans can reducehospital costs, which account for the largest share of Medicaid expenditures. Second, it shows thatplans have leverage in how they reduce costs and that competition between insurers and providersaffects insurers’ strategies to reduce costs. Since the institutional features of Florida’s 2006 Reformare important for contextualizing these findings, the next section describes the details of Florida’sreform.
2.4 Florida’s 2006 Medicaid Reform Pilot
This section discusses the institutional features of Florida’s 2006 Medicaid Reform Pilot and com-pares it to reforms in other states. Florida’s reform mandated that Medicaid beneficiaries switch
12Medicaid claims data report the capitation fee for Medicaid beneficiaries on managed care plans. The data usuallydo not report the number of medical visits per beneficiary or the costs per visit.
9

from the state’s fee-for-service (FFS) system to managed care plans. Children, families, agedand disabled beneficiaries were required to enroll in managed care plans, while pregnant womenand Medicaid-Medicare dual eligibles were not required to enroll in managed care plans.13 Thepurpose of the pilot was to test run mandated managed care in a few counties and to ultimatelyexpand the program statewide. The reform’s goals were to improve access to care, improve thequality of care, reduce fraud, and lower costs.14 Figure 1 shows that the reform affected Baker,Broward, Clay, Duval, and Nassau Counties. These counties are located in two equally-sized anddistinct healthcare markets, which I will refer to as the “Northeast” and “Southeast” Florida reformmarkets. Though it may seem like Northeast Florida was relatively more affected by the reform,there are approximately the same number of Medicaid beneficiaries in the Northeast and Southeastreform regions.
Florida’s Medicaid Reform was implemented in two waves. The first wave began in September2006 when children, families, aged, and disabled populations, herein referred to as the “targetpopulations,” in Broward and Duval Counties were required to switch from the state’s FFS systemto reform-approved managed care plans. Most beneficiaries were counseled to switch plans withinthe first three months of implementation and all beneficiaries were required to switch plans byAugust 2007. If beneficiaries did not select a managed care plan, then the state automaticallyassigned them to a plan.15 The second wave of reform began in September 2007 and mandated thatthe target populations in Baker, Clay, and Nassau counties switch from the FFS system to managedcare plans. The rules and implementation were the same in both waves; however, beneficiaries indifferent counties had different plan options.
There were significant differences between the state’s FFS “MediPass” system and the reform-approved managed care plans. The MediPass system began in 1990 and expanded statewide in1996. Each enrollee was assigned to a primary care case manager (PCCM) who coordinated theenrollee’s care. Primary care physicians and other healthcare providers registered with the stateto become MediPass service providers. Under MediPass, all healthcare providers received FFSreimbursements from the state.
Insurer-owned plans (i.e., health maintenance organizations (HMOs)) are one type of reform-approved managed care plan. Insurer-owned plans are private health insurance companies thatreceive capitated payments from the state for each Medicaid beneficiary that they enroll. Insurers
13The TANF and SSI populations in five counties were required to switch from FFS to managed care plans. Pregnantwomen with incomes above 26% of the federal poverty level, infants between 185-200% of the federal poverty level,and Medicaid-Medicare dual eligibles were not mandated to switch plans.
14Florida Medicaid Reform Application for 1115 Research and Demonstration Waiver August 30, 2005: http://www.fdhc.state.fl.us/medicaid/medicaid_reform/waiver/index.shtml
15When beneficiaries did not select a plan within their 30-day enrollment window, the state randomly assignedthem to plans. Approximately 30% of newly enrolled beneficiaries were randomly assigned to plans in the first waveof reform.
10
create networks of healthcare providers to treat patients and they negotiate prices with healthcareproviders. Plan networks vary in size and scope, and different plans reimburse providers at differ-ent prices. Insurers typically reimburse in-network providers at lower prices than out-of-networkproviders, and their goal is to direct patients to in-network providers who supply care at the lowestcosts.
Provider-owned plans (i.e., provider service networks (PSNs)) are another type of reform-approved managed care plan. Provider-owned plans are networks of providers that directly pro-vided care for their enrollees. Provider plans are owned by either primary care physician groups orhospitals. Florida Medicaid reimburses provider plans on the same fee-for-service schedule as theMediPass providers, but the provider plans are partially at-risk for their enrollees’ healthcare costs.If a provider plan’s total healthcare costs are less than the total capitations set by the state, then theplan keeps the difference between its total healthcare costs and the total capitated reimbursement.If the plan’s total healthcare costs exceed the total capitation, then the plan has to return the dif-ference between its total costs and the total capitation with a maximum penalty equal to 50% ofits administrative fee (Moewe 2006 [35]).16 In this way, the provider plans receive the same benefitsas insurers if they achieve cost-savings relative to FFS, but their losses are minimized if they didnot. Thus, the primary difference between provider plans and insurers is that insurers are exposedto greater downside risk.
The FFS system and the reform plans differed in several key ways. Since the reform planswere at-risk for their enrollees’ healthcare costs, they were allowed to employ different strategiesto reduce their healthcare costs relative to the FFS system. The reform plans could vary the amount,duration, and scope of (some) medical benefits. They could vary cost-sharing to a (very) limitedextent. They could conduct utilization review for medical care, which means that they could denypayment for unnecessary medical tests and procedures. However, the most significant differencebetween the managed care plans and the fee-for-service system was that reform plans could createnetworks of providers and discourage the use of out-of-network providers. Consequently, Medicaidbeneficiaries on managed care plans had access to different healthcare providers than Medicaidbeneficiaries on the FFS system.
Florida’s reform is comparable to other state reforms along several dimensions, and it offerstwo innovations. Other states typically mandate that children and families switch from FFS toinsurer-owned plans and states usually set capitation fees using historical FFS data. Florida’sreform is innovative because it also required aged and disabled beneficiaries to switch from FFSinto managed care plans and it allowed beneficiaries to choose between insurer-owned plans andprovider-owned plans. At least six other states have now mandated that their aged and disabled
16Florida Medicaid evaluates provider plans every six months. The administrative fee is a fraction of the capitationfee and the state loans that amount to the provider plans at the start of each evaluation period.
11

Medicaid populations enroll in managed care plans and the US Medicare program now encouragesprovider plans to compete with insurers, so Florida’s reform leads the way for these two types ofhealthcare delivery innovations.
Figure 1: Florida Medicaid Reform Counties
Florida Medicaid Reform Application for 1115 Research and Demonstration Waiver�
53 Updated October 19, 2005
Figure 2: Phase I
Walton
Holmes
Washington
Wakulla
Madison Leon
Gadsden
Jackson
Bay
Esca
mbi
a Santa Rosa
Oka
loos
a
Calhoun
Liberty
Gulf Franklin
Jefferson
Taylor
Lafayette
Hamilton
Suwannee
Col
umbi
a Baker
Nassau
Duval
St. Johns
Union
Bradford
Flagler
Putnam
Clay
Dixie Gilc
hris
t
Alachua
Levy Marion
Volusia
Citrus Lake
Sum
ter
Orange
Seminole
Hernando
Bre
vard
Indian River
Oseola Polk
Pasco
Hillsborough
Pinellas
Manatee Hardee Highlands
Okeechobee
St. Lucie
Sarasota De Soto
Charlotte Glades
Martin
Lee
Hendry Palm Beach
Collier Broward
Monroe Dade
Northeast
Southeast
Source: FL AHCA’s 1115 Research and Demonstration Waiver.
3 Model of Managed Care Plan Strategies
This section presents a model for how managed care plans might choose their cost-saving strate-gies. It shows that competition with provider plans affects how insurers choose their strategies toreduce total costs. Though insurer-owned plans operated in both of Florida’s reform markets pre-and post-reform, a hospital-owned plan entered the Northeast Florida market post-reform, whilephysician-owned plans entered the Southeast Florida market post-reform. The model in this sec-tion generates predictions for both markets and compares those predictions to the what might havehappened if insurers had only competed with other insurers post-reform.
12
In the model, managed care plans choose a combination of three labor inputs to minimize thetotal costs of producing a fixed amount of medical output. The fixed amount of medical output canbe thought of as the amount of medical care that the plans’ enrollees required post-reform. Thethree labor inputs are (1) the number of primary care physician hours, (2) the number of in-networkemergency room (ER) physician hours, and (3) the number of out-of-network ER physician hours.Primary care physicians are gatekeepers who reduce the number of unnecessary hospital visits,while in-network ER physicians reduce the average cost per hospital visit. Plans reduce their totalcosts when their patients receive treatment from primary care physicians or in-network ER physi-cians compared to out-of-network ER physicians. Since some kinds of medical conditions requiremedical care from primary care physicians and hospitals, while other conditions require primarycare or hospital care only, the model allows plans to imperfectly substitute between primary carephysicians and ER physicians.
This section proceeds in three steps. First, I solve the cost minimization problem for a repre-sentative managed care plan. Second, I discuss how provider plans can form exclusive networkswith their physicians, which affects the marginal cost to insurers of forming their own physiciannetworks. Third, I relate the discussion to Florida’s reform markets and show how the entry ofdifferent types of provider plans generates different predictions for Florida’s markets.
3.1 Cost Minimization Problem
Background: Prior to Florida’s Medicaid reform, approximately 50% of Medicaid beneficia-ries were enrolled in the state’s fee-for-service (FFS) system. Figure 2 presents a stylized descrip-tion of how FFS operated. Patients could visit primary care providers or hospital emergency roomsto receive medical care. Florida Medicaid reimbursed primary care providers and hospitals with afee for every service that they provided the patients.
Post-reform, Medicaid beneficiaries were required to choose a managed care plan. Figure 3depicts the types of plans that were available. Patients could choose (1) insurer-owned plans, (2)hospital-owned plans, or (3) physician-owned plans. Once they chose a plan, they were locked intotheir plan for a year. Plans were available at the county-level, so beneficiaries in different coun-ties had different options. Beneficiaries in Southeast Florida could choose between insurer-ownedplans, physician-owned plans, and a physician-hospital hybrid plan. Beneficiaries in NortheastFlorida could choose between insurer-owned plans and a hospital-owned plan. The fact that insur-ers operated in both markets, but different types of provider plans entered different markets, allowsme to test whether the insurers’ strategies to reduce costs could have been affected by competitionwith different types of provider plans.
Agents: At the start of reform, plans expect that their enrollees will require a fixed amount of
13
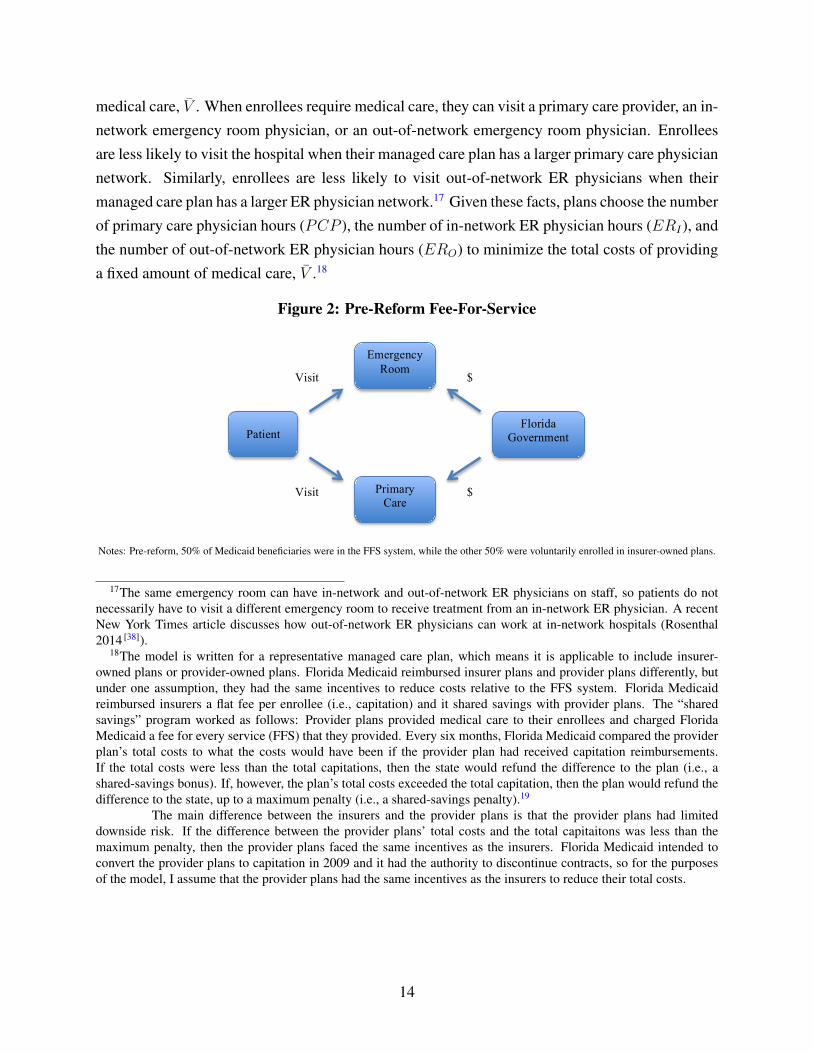
medical care, V̄ . When enrollees require medical care, they can visit a primary care provider, an in-network emergency room physician, or an out-of-network emergency room physician. Enrolleesare less likely to visit the hospital when their managed care plan has a larger primary care physiciannetwork. Similarly, enrollees are less likely to visit out-of-network ER physicians when theirmanaged care plan has a larger ER physician network.17 Given these facts, plans choose the numberof primary care physician hours (PCP ), the number of in-network ER physician hours (ERI), andthe number of out-of-network ER physician hours (ERO) to minimize the total costs of providinga fixed amount of medical care, V̄ .18
Figure 2: Pre-Reform Fee-For-Service
1. Pre-Reform Diagram
2. Post-Reform Plan Choice
Patient
Physician Plan
Hospital Plan
Insurer Plan
Florida Government
Admin +/- Bonus
Admin +/- Bonus
Capitation
Patient
Primary Care
Emergency Room
Florida Government
Visit
Visit
$
$
Choice
Choice
Notes: Pre-reform, 50% of Medicaid beneficiaries were in the FFS system, while the other 50% were voluntarily enrolled in insurer-owned plans.
17The same emergency room can have in-network and out-of-network ER physicians on staff, so patients do notnecessarily have to visit a different emergency room to receive treatment from an in-network ER physician. A recentNew York Times article discusses how out-of-network ER physicians can work at in-network hospitals (Rosenthal2014 [38]).
18The model is written for a representative managed care plan, which means it is applicable to include insurer-owned plans or provider-owned plans. Florida Medicaid reimbursed insurer plans and provider plans differently, butunder one assumption, they had the same incentives to reduce costs relative to the FFS system. Florida Medicaidreimbursed insurers a flat fee per enrollee (i.e., capitation) and it shared savings with provider plans. The “sharedsavings” program worked as follows: Provider plans provided medical care to their enrollees and charged FloridaMedicaid a fee for every service (FFS) that they provided. Every six months, Florida Medicaid compared the providerplan’s total costs to what the costs would have been if the provider plan had received capitation reimbursements.If the total costs were less than the total capitations, then the state would refund the difference to the plan (i.e., ashared-savings bonus). If, however, the plan’s total costs exceeded the total capitation, then the plan would refund thedifference to the state, up to a maximum penalty (i.e., a shared-savings penalty).19
The main difference between the insurers and the provider plans is that the provider plans had limiteddownside risk. If the difference between the provider plans’ total costs and the total capitaitons was less than themaximum penalty, then the provider plans faced the same incentives as the insurers. Florida Medicaid intended toconvert the provider plans to capitation in 2009 and it had the authority to discontinue contracts, so for the purposesof the model, I assume that the provider plans had the same incentives as the insurers to reduce their total costs.
14

Figure 3: Post-Reform Plan Choice
1. Pre-Reform Diagram
2. Post-Reform Plan Choice
Patient
Physician Plan
Hospital Plan
Insurer Plan
Florida Government Shared Savings
Shared Savings
Capitation
Patient
Primary Care
Emergency Room
Government
Visit
Visit
$
$
Choice
Choice
Choice
Notes: Post-reform, Medicaid beneficiaries in the reform counties were mandated to enroll in (1) insurer-owned plans, (2) a hospital-owned plan,or (3) physician-owned plans. Insurers received capitation reimbursements from the state, while the hospital plan and the physician plans receivedshare-savings reimbursements. Different plans were available in different counties, so beneficiaries in different counties did not necessarily havethe same options. Post-reform, Medicaid beneficiaries in the non-reform counties had the same options that they had pre-reform: they could stay inthe fee-for-service system or they could voluntarily enroll in a managed care plan.
Exogenous Variables: Each plan minimizes its total costs to produce a fixed amount of med-ical output, V̄ . Total costs include the costs to treat patients plus the costs to keep physiciansin-network. The cost to treat patients varies with physician type, so C̄PCP is the hourly cost ofprimary care physicians, C̄ERI is the hourly cost of an in-network ER physician, and C̄ERO isthe hourly cost of an out-of-network ER physician. I assume that all medical tests, procedures,supplies, facility fees, ancillary staff, etc. are contained in these hourly costs, and I assume thatC̄PCP < C̄ERI < C̄ERO .20 The costs to keep physicians in-network equal W ×H , where W is thehourly price per physician andH is the number of physician hours the plan chooses for its network.W ×H can be decomposed into the price to keep primary care physicians in-network (wPCP ) andthe price to keep ER physicians in-network (wER), so W ×H = wPCPPCP + wERERI .
Production Function for Medical Care: The production function for medical care is Cobb-Douglas with constant returns to scale and an elasticity of substitution equal to one. It takes theform,
V̄ = ERαIER
βOPCP
1−α−β, 0 < α < 1, 0 < β < 1, 0 ≤ α + β ≤ 1
20These cost functions could be much more complex, but this simple model has enough structure to capture theintuition behind the plans’ optimization problem.
15

Solving the production function for ERO gives,
ERO = V̄1βER
−αβ
I PCPα+β−1
β
Cost Minimization Problem: Now each plan chooses the number of primary care physicianhours (PCP ), the number of in-network ER physician hours (ERI), and the number of out-of-network ER physician hours (ERO) to solve:
minPCP,ERI ,ERO
TC = C̄PCPPCP + C̄ERIERI + C̄EROERO + wPCPPCP + wERIERI
st : ERO = V̄1βER
−αβ
I PCPα+β−1
β
minPCP,ERI
TC = (C̄PCP + wPCP )PCP + (C̄ERI + wER)ERI + C̄ERO V̄1βER
−αβ
I PCPα+β−1
β
First-Order Conditions: The FOCs of the plan’s cost minimization problem are:
∂TC
∂PCP= C̄PCP + wPCP + C̄ERO
(α + β − 1
β
)V̄
1βER
−αβ
I PCPα−1β = 0
∂TC
∂ERI
= C̄ERI + wERI + C̄ERO
(−αβ
)V̄
1βER
−α−ββ
I PCPα+β−1
β = 0
Model Solution: Solving the system yields:
PCP ∗ = V̄ × (1− α− β)α+β
ααββ×
[MCα
ERI×MCβ
ERO
MCα+βPCP
]
ER∗I = V̄ × α1−α
ββ(1− α− β)1−α−β×
[MC1−α−β
PCP ×MCβERO
MC1−αERI
]
ER∗O = V̄ × β1−β
αα(1− α− β)1−α−β
[MC1−α−β
PCP ×MCαERI
MC1−βERO
]
where MCPCP is the marginal cost of one additional primary care physician hour, MCERI is themarginal cost of one additional in-network ER physician hour, and MCERO is the marginal costone additional out-of-network ER physician hour. I assume that all marginal costs are positive.
16

Specifically,
MCPCP = C̄PCP + wPCP > 0
MCERI = C̄ERI + wER > 0
MCERO = C̄ERO > 0
Comparative Statics: It can be seen quite easily that the own-price elasticities of demand arenegative while the cross-price elasticities of demand are positive. To illustrate, I show how theoptimal demand for primary care physician hours (PCP ∗) changes with respect to the marginalcost of primary care physician hours (MCPCP ), the marginal cost of in-network ER physicianhours (MCERI ), and the marginal cost of out-of-network ER physician hours (MCERO).21 Asthe marginal cost of primary care physicians increases, plans substitute away from primary carephysicians and toward ER physicians. Similarly, as the marginal cost of in-network or out-of-network ER physicians increases, plans substitute away from ER physicians and toward primarycare physicians.
∂PCP ∗
∂MCPCP= (−α− β)× V̄ × (1− α− β)α+β
ααββ×
[MCα
ERI×MCβ
ERO
MCα+β+1PCP
]< 0
∂PCP ∗
∂MCERI= α× V̄ × (1− α− β)α+β
ααββ×
[MCα−1
ERI×MCβ
ERO
MCα+βPCP
]> 0
∂PCP ∗
∂MCERO= β × V̄ × (1− α− β)α+β
(αβ)α×
[MCα
ERI×MCβ−1
ERO
MCα+βPCP
]> 0
Equilibrium Predictions: The model generates optimal labor demand functions for a repre-sentative plan for every quantity of medical output that the plan produces. Importantly, the modelshows what would happen in a baseline case when, for example, insurers only compete with otherinsurers in the same market.22 The model predicts that insurers will choose a combination ofprimary care physician hours, in-network ER physician hours, and out-of-network ER physicianhours to produce a given amount of medical care. Because insurers optimize their primary care andER physician networks, they will reduce their total costs by reducing both the number of hospitalvisits and the average cost per visit relative to the FFS system. The model’s comparative statics,however, generate two additional hypotheses that can be tested empirically.
21The full set of comparative statics appear in Appendix B.22I assume that insurer-owned plans are not vertically-integrated and do not form exclusive networks with their
physicians.
17

Hypothesis 1: If the cost to keep ER physicians in-network (wER) increases, then plans willsubstitute away from ER physicians and toward primary care physicians. Assuming that the sub-stitution effect dominates, plans will choose larger primary care physician networks and smallerER physician networks compared to the baseline case where wER does not change.23 Therefore,an increase in wER will lead to a decrease in the number of unnecessary hospitalizations and anincrease in the average cost per hospital visit relative to the baseline case.
Hypothesis 2: If the cost to keep primary care physicians in-network (wPCP ) increases, thenplans will substitute away from primary care physicians and toward ER physicians. Assumingthat the substitution effect dominates, plans will choose smaller primary care physician networksand larger ER physician networks compared to the baseline case where wPCP does not change.Therefore, an increase in wPCP will lead to an increase in the number of unnecessary hospitalvisits and a decrease in the average cost per hospital visit relative to the baseline case.
3.2 The Effects of Exclusive Networks
The model predicts that entry by provider plans will affect insurers’ strategies to reduce costsand that the effects will depend on which types of provider plans enter the market. The previoussection showed that insurers will minimize their total costs by choosing the number of primarycare physicians and ER physicians for their networks. Their optimal choices will result in fewerhospital visits and lower average costs per hospital visit relative to the FFS system. This sectionand the next section use the intuition of a market foreclosure model to show that insurers have fewerstrategies when provider plans enter the market. Market foreclosure occurs when a downstreambuyer (insurer) is denied access to an upstream supplier (provider), and it can occur when theupstream supplier has increased market power as a result of vertical integration (Asker 2005 [3]).
Market foreclosure is possible under Florida’s Medicaid reform because Florida encourages en-try of vertically-integrated, provider-owned plans. Florida’s three types of managed care plans in-clude (1) insurer-owned plans, (2) hospital-owned plans, and (3) physician-owned plans. Hospital-owned plans and physician-owned plans are vertically-integrated plans, meaning that they ownsome of the upstream production of medical care. Hospital plans own the upstream production ofhospital care, but they create networks of primary care physicians. Physician plans own the up-stream production of primary care, but they create networks of hospitals. Insurers are not verticallyintegrated, so they create networks of primary care physicians and hospitals.
Vertical integration means that the upstream firm can form an exclusive contract with the down-stream firm.24 In the case of Florida’s reform, the vertically-integrated physicians (upstream firms)
23For example, if plans cannot adjust V̄ in the short run, then the substitution effect will necessarily dominate.24Please see Gaynor and Town (2011) [20] for a review of the theoretical literature on vertical restraints in healthcare.
There is very little empirical literature on the effects of vertical restraints in healthcare because it is a relatively new
18

formed exclusive networks, rather than exclusive contracts, with their downstream partners. Theexclusive networks prohibited the vertically-integrated physicians from joining other plan networks(other downstream firms). The exclusive networks did not necessarily preclude the vertically-integrated physicians from treating out-of-network patients, but it did preclude them from treatingout-of-network patients at in-network costs.
As in the foreclosure model, the provider plans’ exclusive networks restricted the short runsupply of physicians available for the insurers’ networks. As the short run supply of physicians de-creased, the marginal cost of recruiting the remaining physicians to an insurer network increased.For example, when a large hospital formed a vertically integrated plan in Northeast Florida, thecost to insurers of forming networks with the remaining ER physicians, wER, increased. Similarly,when physician groups formed vertically integrated plans in Southeast Florida, the cost to insurersof forming networks with the remaining primary care physicians, wPCP , increased. As a result, in-surers in Northeast Florida chose smaller ER physician networks and insurers in Southeast Floridachose smaller primary care physician networks compared to what they would have chosen in theabsence of provider plan entry.
3.3 Application to Florida’s Reform Markets
This paper shows that Florida’s managed care plans reduced hospital costs relative to the FFSsystem; however, it also shows that insurers in different markets adopted different strategies toreduce costs. Solving the representative plan’s cost minimization problem shows that its optimalstrategies depend on the relative costs of using primary care physicians, in-network ER physicians,and out-of-network ER physicians to treat patients. This section discusses how the marginal costsof adding primary care and ER physicians to insurer networks differed across Florida’s two reformmarkets and how competition with different provider plans explains the differences across markets.
Northeast Florida
The Northeast Florida market featured a hospital-owned plan and four insurer-owned plans. TheUniversity of Florida at Shands-Jacksonville Hospital (Shands-Jacksonville) created a vertically-integrated hospital plan in 2006, and it operated with 20% market share, while the insurer-ownedplans had a combined 80% market share. When the Shands-Jacksonville plan entered the reformmarket, it formed an exclusive network with its ER physicians, thereby reducing the short runsupply of ER physicians available to the insurers. As the supply of ER physicians decreased,insurers faced higher costs of adding ER physicians to their networks. As a result, insurers in
phenomenon. Gaynor and Town write, “Nonetheless, there are reports that vertical integration and exclusive deals areon the increase in healthcare, in part because of elements in the healthcare reform law.”
19

Northeast Florida substituted away from ER physicians and toward primary care physicians, whichresulted in fewer nonemergency hospital visits, but higher average costs per visit relative to whatwould have happened under insurer-insurer competition. From the model,
(1) wER increased post-reform.
(2) From the optimal demand functions, ∂ER∗I
∂wER< 0 and ∂PCP ∗
∂wER> 0.
(3) Insurers in Northeast Florida increased the number of primary care physician hours and de-creased the number of in-network ER physician hours.
(4) As the number of primary care physician hours increased, the number of nonemergency hos-pital visits decreased. As the number of ER physicians decreased, the average cost per visitincreased.
(5) The total costs to producing the same amount of medical output increased relative to whatthey would have been under insurer-insurer competition.
Southeast Florida
The Southeast Florida market featured two physician plans, a physician-hospital hybrid plan, andnine insurer plans.25 The physician plans had 22% market share, while the insurers had 78% marketshare. When the physician plans became reform plans in 2006, they formed exclusive networkswith their primary care physicians, which reduced the short run supply of primary care physiciansavailable to the insurers. As the supply of primary care physicians decreased, insurers faced highercosts of adding primary care physicians to their networks. As a result, insurers in Southeast Floridasubstituted away from primary care physicians and toward ER physicians, which resulted in morenonemergency hospital visits, but lower average costs per hospital visit relative to what would havehappened under insurer-insurer competition. From the model,
(1) wPCP increased post-reform.
(2) From the optimal demand functions, ∂ER∗I
∂wPCP> 0 and ∂PCP ∗
∂wPCP< 0.
(3) Insurers in Southeast Florida increased the number of in-network ER physician hours anddecreased the number of primary care physician hours.
25The physician-hospital hybrid was a partnership between two hospital systems that spanned 8 hospitals and 2physician groups. The physician-hospital hybrid plan had been operating as a managed care plan since 2001 and,perhaps due to the fact that it was a partnership, I find no evidence that it formed exclusive networks with its physicians.Thus, for simplification, I classify the physician-hospital hybrid plan as a physician plan that did not participate inforeclosure.
20

(4) As the number of in-network ER physician hours increased, the average cost per hospital visitdecreased. As the number of primary care physicians decreased, the number of nonemer-gency hospital visits increased.
(5) The total costs to producing the same amount of medical output increased relative to whatthey would have been under insurer-insurer competition.
Conclusion: When provider plans entered the reform markets, they increased the marginalcost of physicians to insurer-owned plans. If insurers could have adjusted their output, V̄ , thenthey would have produced less medical output in response to the increase in the price of one oftheir inputs. However, if their medical output was fixed in the short run, then insurers would haveproduced the same amount of output, but at higher total costs. Therefore, the results suggest thatinsurers may have been able to decrease their total costs by more if the provider plans had notentered the markets or if the provider plans had not formed exclusive networks.
4 Hospital Discharge Data and the Empirical Method
This section describes the empirical strategy that tests the model’s predictions from the previoussection. First, I estimate a difference-in-difference model to determine whether managed care plansreduced hospital costs post-reform. The model compares total hospital costs for Medicaid bene-ficiaries in reform counties to similar beneficiaries in non-reform counties pre- and post-reform.Second, I investigate whether plans in different markets reduced costs in different ways. Estimat-ing the heterogeneous effects of the reform across different markets tests whether market structurecould have affected plan strategies to reduce costs.
4.1 Sample
The empirical analysis uses two types of data. The first data source is county-level enrollment datafrom the Florida Agency for Healthcare Administration (FL AHCA). The enrollment data showhow enrollment in fee-for-service (FFS), insurer-owned plans, and provider-owned plans changedpost-reform. The AHCA data show that Florida’s reform dramatically increased enrollment inmanaged care plans. The second data source is visit-level emergency room (ER) and hospitaliza-tion discharge data for the years 2005-2008.26 The ER and hospitalization data contain informationabout hospital care for all types of patients pre- and post-reform. To evaluate the effects of the re-form, I restrict the sample to Medicaid visits for non-pregnant patients ages 0-64 in reform and
26The time period is restricted to 2005-2008 because the ER data is not available before 2005.
21

non-reform counties. I restrict the sample in this way because these are the types of patients whowere targeted by the reform.
4.2 Reform versus Non-Reform Counties
Since the empirical strategy is a difference-in-difference model across the reform and non-reformcounties, it is important to consider why the reform counties were chosen and how the reformand non-reform counties differed. One concern is that Baker, Broward, Clay, Duval, and Nassauwere endogenously chosen, for example, because Florida Medicaid believed that those countieswould perform particularly well under reform. If that were the case, then this paper’s results wouldhave limited applicability in other settings, so this section shows that the reform counties were notvery different from the non-reform counties and that the counties were chosen largely because thesenators who designed the Medicaid Reform Bill represented those districts.
The reform counties were chosen very early in the legislative process. Senator Paeden and hissix Senate Bill sponsors chose the reform counties before they introduced the Medicaid ReformBill to the Florida Senate in January 2005. Four of the seven bill sponsors were representativesfrom the reform county districts. Since the Bill’s sponsors represented the reform counties andsince local government cooperation was critical to implementation, it is likely that the reformcounties were chosen because the Senators wanted credit for implementing the reform.
Conversations with Florida Medicaid staff revealed two additional reasons why Baker, Broward,Clay, Duval, and Nassau were chosen as reform counties. The two explanations were that (1) thecounties have racially diverse Medicaid populations and the senators wanted the reform to affecta diverse set of beneficiaries, and (2) the counties’ local governments were willing to help imple-ment choice counseling. Choice counseling occurs when Medicaid beneficiaries switch from FFSto managed care plans. Medicaid Reform required counselors to be physically and telephonicallypresent to help beneficiaries choose their plans. Reform also required counselors to perform face-to-face education and outreach.27 Therefore, local government participation was crucial for thereform’s implementation.
To test whether the reform and non-reform counties differed in systematic ways, Table 1 showsdescriptive statistics for beneficiaries in reform and non-reform counties in the pre-reform period.Table 1 shows that the reform and non-reform counties had similar numbers of beneficiaries en-rolled in FFS and managed care plans prior to the reform.28 It also shows that total hospital costs,total hospital visits, and the share of visits for different types of medical conditions were similaracross reform and non-reform counties in the pre-reform period. The only characteristics that ap-
27Florida Medicaid Reform Quarterly Progress Report July 1, 2006 - September 30, 2006: http://www.fdhc.state.fl.us/medicaid/medicaid_reform/quarterly.shtml
28Recall that Medicaid beneficiaries could voluntarily choose to enroll in insurer-owned plans pre-reform.
22

pear to differ across the reform and non-reform counties are race and ethnicity. Patients in reformcounties were more likely to be black and less likely to be white or Hispanic, which is consistentwith Florida Medicaid’s observation that the reform counties are more racially diverse than non-reform counties. Despite differences in demographic characteristics, patient health status appearssimilar. There are not meaningful differences in the percentages of patients with comorbidities orwith various types of medical conditions. In sum, it appears that the reform counties do not differin meaningful ways from the non-reform counties; nevertheless, Section 5.3 presents a full set ofrobustness checks to ensure that the results do not depend on differential trends across the reformand non-reform counties.
Table 1: Comparing Reform and Non-Reform Counties in the Pre-Reform Period
Non-Reform Reform DifferencePre-Reform Period Counties Counties p-value
Enrollment Target Population 105,225 105,259 p = 0.997Fee-for-Service 45,652 43,487 p = 0.497Managed Care 59,572 61,771 p = 0.665# Managed Care Plans 3.01 3.27 p = 0.560
DemographicsAverage Age 18.77 18.97 p = 0.262% Children 0.62 0.61 p = 0.156% Female 0.57 0.58 p = 0.153% White 0.41 0.33 p = 0.002% Black 0.30 0.50 p = 0.000% Hispanic 0.26 0.13 p = 0.000
Medical Conditions% Comorbidities 0.17 0.17 p = 0.681% Infectious Disease 0.05 0.05 p = 0.630% Cancer 0.02 0.02 p = 0.404% Endocrine Disorder 0.01 0.02 p = 0.000% Disease of Blood 0.00 0.01 p = 0.000% Mental Illness 0.03 0.04 p = 0.072% Nervous System Disorder 0.08 0.08 p = 0.032% Circulatory System Disorder 0.02 0.02 p = 0.407% Respiratory System Disorder 0.18 0.18 p = 0.121% Digestive System Disorder 0.08 0.08 p = 0.083% Genitourinary Disorder 0.05 0.05 p = 0.067% Skin Disorder 0.05 0.05 p = 0.896% Muscular Tissue Disorder 0.04 0.04 p = 0.519% Injuries 0.18 0.18 p = 0.067% Ill-Defined Conditions 0.20 0.20 p = 0.024
OutcomesTotal Hospital Costs 39,145,924 39,863,889 p = 0.844Total Hospital Visits 20,348 22,617 p = 0.112
% Nonemergency Visits 0.45 0.44 p = 0.130% Emergency Visits 0.55 0.56 p = 0.130% Preventable Visits 0.04 0.04 p = 0.142% Chronic Condition Visits 0.09 0.10 p = 0.054
N 434 35
Notes: Each cell reflects the average per county per year-quarter in the pre-reform period. There are 5 reform counties, 62 non-reform counties, and7 quarters in the pre-reform period. Means are weighted by the number of beneficiaries in the target population.
23

4.3 Enrollment in FFS and Managed Care Plans
The objective of Florida’s Medicaid Reform was to switch beneficiaries from the state’s FFS sys-tem into managed care plans. Using county-level enrollment data from Florida AHCA, I testwhether the reform accomplished its enrollment objective. Figure 4 shows how the percentageof Medicaid beneficiaries on the FFS system changed pre- and post-reform across the reform andnon-reform counties from Q1-2005 to Q4-2008. The red line indicates September 2006 when thereform was first implemented in the two largest counties. There is a nearly 100% decline in thepercentage of Medicaid beneficiaries on FFS in the reform counties post-reform; meanwhile, thepercentage of FFS beneficiaries in the non-reform counties remains relatively constant.
Figure 4: Changes in Fee-For-Service Enrollment
0.1
.2.3
.4.5
%En
rolle
d in
FFS
2005 2006 2007 2008 2009
Reform Counties Non−Reform Counties
®
Notes: This figure shows how the percentage of Medicaid beneficiaries in the fee-for-service system changed in the reform and non-reform countiespre- and post-reform. The percentage is constructed using the target population, so the numerator equals the number of beneficiaries on the FFS(MediPass) system and the denominator equals the number of beneficiaries on FFS (MediPass) plus the number of beneficiaries on insurer-ownedplans plus the number of beneficiaries on provider-owned plans.
Next, I show how enrollment in managed care plans changed as a result of reform. Figure5 shows that 50% of the targeted Medicaid beneficiaries were voluntarily enrolled in an insurer-owned plan prior to reform, but the percentage increased to nearly 80% when beneficiaries weremandated to choose managed care plans. Insurer-owned plan enrollment declined at the end of2008 because some insurers exited the reform markets in 2009; however, the percentage of benefi-ciaries on insurer-owned plans remained higher in the reform counties than the non-reform coun-ties. Figure 6 shows that there were very few Medicaid beneficiaries in provider-owned plansprior to reform. Post-reform, however, provider plans enrolled up to 20% of the target populationsin reform counties. Overall, the figures demonstrate that Florida’s Medicaid reform successfully
24
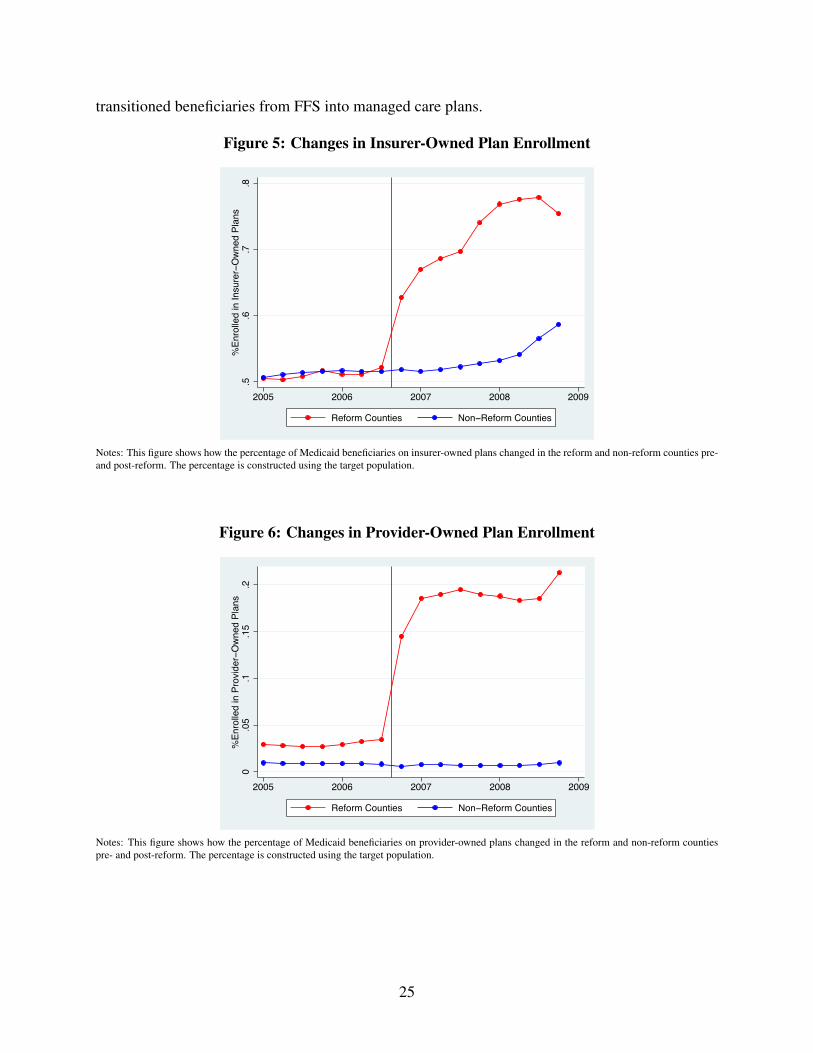
transitioned beneficiaries from FFS into managed care plans.
Figure 5: Changes in Insurer-Owned Plan Enrollment
.5.6
.7.8
%En
rolle
d in
Insu
rer−
Ow
ned
Plan
s
2005 2006 2007 2008 2009
Reform Counties Non−Reform Counties
®
Notes: This figure shows how the percentage of Medicaid beneficiaries on insurer-owned plans changed in the reform and non-reform counties pre-and post-reform. The percentage is constructed using the target population.
Figure 6: Changes in Provider-Owned Plan Enrollment
0.0
5.1
.15
.2%
Enro
lled
in P
rovi
der−
Ow
ned
Plan
s
2005 2006 2007 2008 2009
Reform Counties Non−Reform Counties
®
Notes: This figure shows how the percentage of Medicaid beneficiaries on provider-owned plans changed in the reform and non-reform countiespre- and post-reform. The percentage is constructed using the target population.
25

4.4 County-Level Analysis
I estimate two sets of analyses in this paper, which correspond to the two types of data sets thatare available. The first set of analysis is a difference-in-difference model at the county-level toquantify the effects of Florida’s Medicaid reform on total enrollment, enrollment in managed careplans, the number of hospital visits, and the total costs for hospital visits. The second set of analysisis a difference-in-difference model at the visit-level to determine how Florida’s reform affected theaverage cost per hospital visit. The county-level difference-in-difference model is specified in thefollowing equation,
Yct = β1ReformcY ear1 + β2ReformcY ear2 +K ∗Xct + θc + λt + δc ∗ t+ εct (1)
where c indexes the county in quarter-year t and K ∗ Xct is a vector of average patient char-acteristics constructed from the sample of hospital visits. Average patient characteristics appearin Table 1 and include patient gender, age, race, and ethnicity. θc is a county fixed effect, λt is aquarter*year fixed effect, and δc ∗ t allows for differential linear time trends across counties. β1and β2 capture the average effects of switching from FFS to managed care in the first two yearspost-reform.29 To estimate the effects of the reform on enrollment, Yct includes log(total enroll-ment), enrollment in FFS, enrollment in insurer-owned plans, and enrollment in provider-ownedplans. To estimate the effects of reform on hospital costs and visits, Yct includes log(total costs),30
log(total visits), log(nonemergency visits),31 log(emergency visits),32 log(preventable visits),33 and
29The time period is the year-quarter because the emergency room and hospitalization data are only available on aquarterly basis.
30Hospital costs come from the hospital discharge records. I pre-multiply the total charges on the hospital recordby the Cost-to-Charge Ratio (CCR) in each hospital-year. The CCR comes from the Healthcare Cost and UtilizationProject (HCUP) (http://www.hcup-us.ahrq.gov/db/state/costtocharge.jsp). I use the hospitalgroup CCR because it is available for all hospitals in the sample. Pre-multiplying the charges by the CCR makeshospital costs comparable across hospitals over time.
31New York University’s Wagner School developed an algorithm to classify emergency room visits based on the pa-tient’s primary diagnosis (http://wagner.nyu.edu/faculty/billings/nyued-background). Eachvisit receives a probability that it is a nonemergency visit or a visit that is treatable by a primary care physician.I combine the Wagner School’s nonemergency visits and primary-care-treatable visits into one measure that I call“nonemergency visits” because the purpose is to classify all visits that could be treated by primary care physicians.Since the measure is a probability between 0 and 1, I adjust it based on the ER’s CPT code for the initial patientevaluation. If the ER determined that the patient’s case was high severity or life-threatening (by issuing a CPT codeequal to 99284 or 9925), then I code nonemergency=0. Similarly, if the ER determined that the patient’s case wasminor or low-severity (by issuing a CPT code equal to 99281 or 99282), then I code nonemergency=1. Otherwise,the nonemergency visit variable reflects the Wagner School’s probabilities. The results are not sensitive to theseclassifications.
32Pr(emergency = 1) = 1− Pr(nonemergency = 1)33The Agency for Healthcare Research and Quality (AHRQ) publishes Prevention Quality Indicators (PQIs) that
categorize preventable hospital visits. A guide to AHRQ’s PQIs can be found here: http://www.ahrq.gov/downloads/pub/ahrqqi/pqiguide.pdf
26

Table 2: The Effect of Reform on Enrollment in FFS and Managed Care Plans
(1) (2) (3) (4) (5)Enrollment Log(Total) Total FFS Insurer Plans Provider Plans
Year 1 0.023 58 -27,702*** 14,659*** 13,101***(0.019) (1,043) (2,506) (1,590) (1,956)
Year 2 0.019 53 -27,269*** 15,187*** 12,135***(0.042) (3,201) (3,002) (2,628) (1,608)
Dept Variable Mean 10.98 105,379 36,590 62,960 5,827
N 1,072 1,072 1,072 1,072 1,072
Notes: Each column represents estimates from a separate regression and the unit of analysis is the county-year-quarter. “Total” equals the numberof Medicaid beneficiaries in the target population, which is the number of beneficiaries on FFS (MediPass) plus the number of beneficiaries oninsurer-owned plans plus the number of beneficiaries on provider-owned plans. The regressions control for county fixed effects, year*quarter fixedeffects, county-linear time trends, and average demographic characteristics (average age, % female, % white, % black, % Hispanic). Regressionsare weighted by the number of Medicaid beneficiaries in the target population. Standard errors are clustered at the county-level and are reported inparentheses. +p < 0.10, *p < 0.05, **p < 0.01, ***p < 0.001
log(visits for chronic conditions).34 The regressions are weighted by the number of beneficiariesin the target population in each county-year-quarter and the standard errors are clustered at thecounty-level.
Results for enrollment appear in Table 2 and the results for total costs and visits are presentedin Section 5. Consistent with Figures 4-6, there is a nearly 100% decline in enrollment in fee-for-service. Approximately 55% of beneficiaries who were previously enrolled in FFS switched toinsurer-owned plans and the remaining 45% of beneficiaries switched to provider-owned plans. Tosummarize, the reform successfully transitioned Medicaid beneficiaries from FFS into managedcare plans and that the vast majority of beneficiaries switched plans within the first three monthsof reform.
4.5 Visit-Level Analysis
The second set of analysis is a difference-in-difference model at the visit-level using emergencyroom and hospitalization data from the Florida Agency for Healthcare Administration (FL AHCA).These visit-level data contain information about every emergency room visit and hospitalizationthat occurred in Florida from 2005-2008. The visit-level model is the same as the county-levelmodel except that it is estimated at the visit-level, so it includes visit i as a subscript,
34Florida Medicaid monitored how well managed care plans managed five chronic conditions under reform. Thechronic conditions were asthma, congestive heart failure, diabetes, HIV/AIDs, and hypertension.
27

Yict = β1ReformcY ear1 + β2ReformcY ear2 +K ∗Xict + θc + λt + δc ∗ t+ εict (2)
The sample of hospital visits is the same for both models. The purpose of estimating the visit-level model in addition to the county-level model is to understand how the switch from FFS tomanaged care affected the average cost per hospital visit and the average amount of treatmentprovided per visit. Yict now includes the average cost per visit (Log(Cost)), the probability thepatient was admitted to the hospital conditional on the visit (Pr(Admit=1)), the patient’s lengthof stay conditional on visit (LOS), and the number of Relative Value Units on the visit record(Log(RVU)).35 The standard errors are also clustered at the county-level.
4.6 Differences Across Healthcare Markets
The Medicaid managed care literature shows that switching from FFS to managed care can havedifferent effects in different contexts. The different effects stem from institutional differencesacross state managed care programs, but they also stem from differences within states in the typesof managed care plans that are available (Duggan 2004; [18] Marton et al. 2014 [33]). If managedcare plans take different strategies to reduce costs, and some of those strategies are more successfulthan others, then research should explore and highlight those strategies. In other words, it is notenough to know that managed care plans sometimes reduces costs; it is more informative to knowwhen managed care plans reduce costs and why.
In this paper I show that managed care plans in different healthcare markets took differentstrategies to reduce costs. Florida’s reform affected two healthcare markets, Northeast and South-east Florida, and different types of provider plans entered each market. Beneficiaries in bothmarkets could choose among insurer-owned plans, but a hospital plan entered the Northeast mar-ket, while physician plans entered the Southeast market. Table 3 summarizes these differences andshows that the insurers had 80% market share in both markets, while the provider plans had 20%market share. Moreover, Appendix Tables A1-2 show that every insurance plan that operated inNortheast Florida also operated in Southeast Florida.
35RVUs are the building blocks for the Medicare physician fee schedule. The Center for Medicare and MedicaidServices (CMS) establishes RVUs for every Current Procedural Terminology (CPT) procedure. RVUs measure theamount of resources that are used to treat the patient, including physician time and effort. More resource-intenseprocedures have higher RVUs. To calculate the log(Total RVU) measure, I sum all RVUs for all procedures on thepatient record and take the log.
28

Table 3: The Types of Managed Care Plans in Florida’s Reform Markets
Post-Reform: As of 12/2008
Northeast Florida Market Share # PlansInsurer-owned plans 80% 4Hospital-owned plans 20% 1Physician-owned plans 0% 0
Southeast Florida Market Share # PlansInsurer-owned plans 78% 11Hospital-owned plans 0% 0Physician-owned plans 22% 3
Notes: The table is constructed using county-level enrollment data. Insurer-owned plans are managed care plans that are owned by health insurancecompanies, hospital-owned plans are owned by hospitals, and physician-owned plans are owned by primary care physician groups. An exceptionis the South Florida Community Care Network (SFCCN), which is a physician-hospital hybrid plan in Southeast Florida. Section 3.3 discusses thedifference between SFCCN and a traditional hospital plan, so for simplicity in this table, I classify SFCCN as a physician plan. The table excludesChildren’s Medical Services (CMS), a statewide, government-operated plan that only serves disabled children. The table classifies Access HealthSolutions as an insurer-owned plan despite its 2003 origins as a minority physician network. Access was purchased in 2007 by Centene Corporationand officially transformed into an insurer-owned plan in 2009. The market share measure excludes beneficiaries still enrolled in FFS or CMS.
Because different types of provider plans entered different markets, I allow the effects of thereform to differ for Northeast Florida compared to Southeast Florida. Specifically, I estimate
Yct = β1RefcY ear1Hospc + β2RefcY ear2Hospc + γ1RefcY ear1Physc + γ2RefcY ear2Physc
+ K ∗Xct + θc + λt + δc ∗ t+ εct (3)
where Hospc equals one in the Northeast Florida reform counties and zero otherwise. Hospcequals one in the Northeast Florida reform counties because a hospital plan entered that market.Similarly, Physc equals one in the Southeast Florida reform county and zero otherwise. Physcequals one in the Southeast Florida reform county because physician plans entered that market.The rest of the equation is the same as in equations (1) and (2) and I estimate the heterogeneouseffects of the reform at both the county-level and the visit-level.
It is worth noting that the difference-in-difference estimates reflect the total effect of the reformin each market. The total effect of the reform shows what happened to hospital costs when benefi-ciaries switched from FFS to either insurer plans or provider plans. It does not show what wouldhave happened to total hospital costs if beneficiaries had switched from FFS to insurer plans only.Similarly, the total effect of the reform is determined by the strategies of both the insurers andthe provider plans in the market. The provider plans only had 20% market share, however, so theaverage effects from the difference-in-difference estimation will be driven by the strategies of theinsurers. Since the model from Section 3 specifically predicts the insurers’ strategies in differentmarkets, Section 5.2 confirms that the average effects of the reform are driven by the insurers’
29

strategies, not the provider plans’ strategies.It may seem unconventional to focus on the heterogeneous effects of managed care, but explor-
ing the heterogeneity is critical for understanding how competition with different types of providerplans may have affected the insurers’ strategies to reduce costs. I show that hospital costs declinedin both markets, but it is arguably more interesting to determine why costs declined, and the an-swer is obfuscated when I only estimate average treatment effects using both markets. As I willshow in Section 5, hospital costs declined in Northeast Florida because insurers steered patientsaway from emergency rooms, and hospital costs declined in Southeast Florida because insurerssteered beneficiaries toward in-network ER physicians who provided less care per visit. Insurerswere unable to reduce both the number of visits and the average cost per visit because they wereconstrained by provider plan entry.
5 Total Hospital Costs
Do managed care plans reduce hospital costs, and if so, how do plans reduce costs? Table 4 showsthat Florida’s managed care plans reduced total hospital costs by 7% in the first year of reformand by 12% in the second year of reform. It is reassuring to see that the estimates do not changemarkedly after controlling for demographic characteristics or county linear time trends. To testwhether the effect is robust to changes in enrollment in the reform and non-reform counties, Fig-ure 7 shows how the average hospital costs per beneficiary changed in the reform counties relativeto the non-reform counties pre- and post-reform. The figure shows that there is no difference inhospital costs per beneficiary in the pre-reform period, but that hospital costs decreased in the re-form counties immediately after the reform. To summarize, Florida’s switch from FFS to managedcare reduced total hospital costs and hospital costs per beneficiary, and the decrease in hospitalcosts was larger in the second year of reform than the first.
5.1 Plan Strategies to Reduce Hospital Costs
While the previous section showed that switching Medicaid beneficiaries from fee-for-service(FFS) to managed care plans reduced total costs, this section shows how managed care plans re-duced costs. Total hospital costs can be decomposed into the number of hospital visits times theaverage cost per visit, so this section determines whether the number of hospital visits decreased orwhether the average cost per visit decreased or whether plans took a combination of both strategies.This section shows that insurers in Northeast Florida reduced the number of hospital visits, whileinsurers in Southeast Florida reduced the average cost per hospital visit. The fact that insurers indifferent markets took different strategies to reduce costs is one of the main contributions of this
30

paper.
Table 4: Managed Care Plans Reduced Total Costs
(1) (2) (3)Total Hospital Costs Log(Costs) Log(Costs) Log(Costs)
Year 1 -0.056* -0.062* -0.073***(0.027) (0.027) (0.013)
Year 2 -0.090* -0.101** -0.124***(0.041) (0.031) (0.019)
County Fixed Effects Y Y YYear*Quarter Fixed Effects Y Y YWeight = # Target Population Y Y YPatient Characteristics Y YCounty Linear Time Trends Y
N 1,072 1,072 1,072
Notes: Each column presents estimates from a separate regression. The unit of analysis is the county-year-quarter. The dependent variable is thelog of total hospital costs. Total costs are constructed by pre-multiplying total charges on the hospital record by the cost-to-charge ratio for eachhospital and summing across all visits for patients from each county. Regressions are weighted by the number of Medicaid beneficiaries in thetarget population. Patient characteristics include gender, age, race, and ethnicity. Standard errors are clustered at the county-level and are reportedin parentheses. +p < 0.10, *p < 0.05, **p < 0.01, ***p < 0.001
Figure 7: Managed Care Plans Reduced Total Costs Per Beneficiary
−.2
−.1
0.1
Year t−2 Year t−1 Year t+1 Year t+26−month−intervals from reform
Difference−in−Difference Estimates
®
Notes: The figure plots estimates from a difference-in-difference model with binary variables corresponding to each 6 months around the date of thereform. The unit of analysis is the county-year-quarter. The outcome variable is the log(total costs per beneficiary) where total costs per beneficiary= total costs / #beneficiaries in the target population. The regression controls for county fixed effects, year-quarter fixed effects, county linear timetrends, and average patient characteristics in the county. Standard errors are clustered at the county-level and appear as red dashed lines.
31

5.1.1 Plans Reduced the Number of Visits
The Medicaid managed care literature discusses the trade-off between hospital visits and primarycare visits. It posits that primary care visits and hospital visits are substitutable to some degree,so if Medicaid beneficiaries have better access to primary care access, then they are less likelyto visit the hospital. The reasoning is straightforward. If Medicaid patients visit the hospital fornonemergency conditions when their primary care physician is unavailable, then improving accessto primary care physicians can reduce the number of nonemergency hospital visits. Similarly, ifbeneficiaries visit the hospital for conditions that could have been prevented with better primarycare, then increasing access to primary care could also reduce the number of hospital visits forpreventable conditions.
Consistent with the hypothesis that managed care plans can improve access to primary care,Table 5 shows that the number of hospital visits decreased 7-10% when a hospital plan enteredthe Northeast Florida reform market. Column (3) shows that the total number of visits decreasedbecause the number of nonemergency visits decreased 14-18%. Column (4) shows that there is nostatistically significant decrease in emergency visits, which is consistent with the hypothesis thatplans can decrease nonemergency hospital visits by increasing access to primary care, but there isnot much they can do about emergency visits. Table 5 also shows that total hospital costs decreasedby the same amount in both reform markets, but the number of hospital visits did not change inthe Southeast Florida market, so plans in Southeast Florida must have reduced the average cost perhospital visit instead. The results from Table 5 suggest that plans in Northeast Florida increasedaccess to primary care physicians, which decreased the number of times Medicaid beneficiariessought nonemergency medical care at the hospital.
The fact that managed care plans in Northeast Florida reduced the number of hospital visitsis consistent with the model’s predictions in Section 3. In the model, plans trade-off among threelabor inputs to minimize total costs: (1) the number of primary care physician (PCP) hours, (2)the number of in-network ER physician hours, and (3) the number of out-of-network physicianhours. The model predicts that competition between insurers and hospital plans results in greateraccess to primary care physicians relative to in-network ER physicians. The intuition is that whenhospital plans form exclusive networks with their ER physicians, they increase the relative costof ER physicians to insurers, so insurers substitute toward primary care physicians. The modelpredicts that insurers will have smaller ER physician networks and larger primary care physiciannetworks in markets where hospital plans form exclusive networks. When insurers expand theirprimary care networks, they reduce the number of hospital visits, which reduces their total hospitalcosts.
To support the hypothesis that Northeast Florida plans increased primary care access, I provide
32
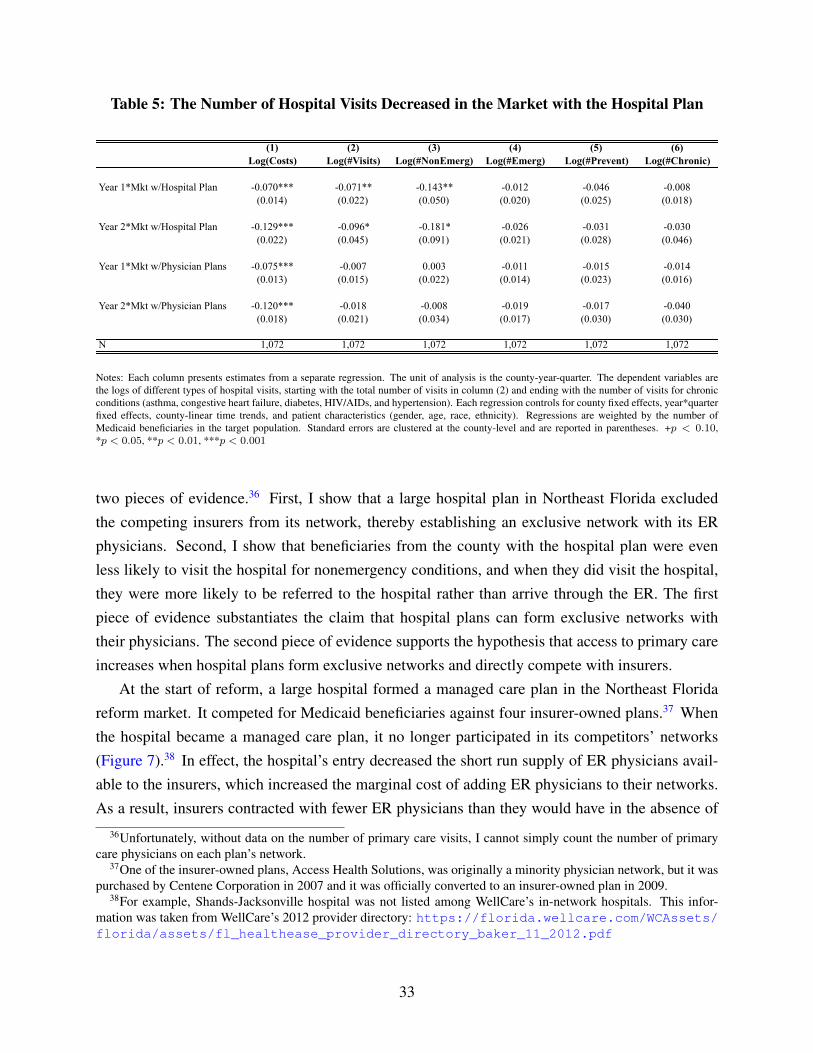
Table 5: The Number of Hospital Visits Decreased in the Market with the Hospital Plan
(1) (2) (3) (4) (5) (6)Log(Costs) Log(#Visits) Log(#NonEmerg) Log(#Emerg) Log(#Prevent) Log(#Chronic)
Year 1*Mkt w/Hospital Plan -0.070*** -0.071** -0.143** -0.012 -0.046 -0.008(0.014) (0.022) (0.050) (0.020) (0.025) (0.018)
Year 2*Mkt w/Hospital Plan -0.129*** -0.096* -0.181* -0.026 -0.031 -0.030(0.022) (0.045) (0.091) (0.021) (0.028) (0.046)
Year 1*Mkt w/Physician Plans -0.075*** -0.007 0.003 -0.011 -0.015 -0.014(0.013) (0.015) (0.022) (0.014) (0.023) (0.016)
Year 2*Mkt w/Physician Plans -0.120*** -0.018 -0.008 -0.019 -0.017 -0.040(0.018) (0.021) (0.034) (0.017) (0.030) (0.030)
N 1,072 1,072 1,072 1,072 1,072 1,072
Notes: Each column presents estimates from a separate regression. The unit of analysis is the county-year-quarter. The dependent variables arethe logs of different types of hospital visits, starting with the total number of visits in column (2) and ending with the number of visits for chronicconditions (asthma, congestive heart failure, diabetes, HIV/AIDs, and hypertension). Each regression controls for county fixed effects, year*quarterfixed effects, county-linear time trends, and patient characteristics (gender, age, race, ethnicity). Regressions are weighted by the number ofMedicaid beneficiaries in the target population. Standard errors are clustered at the county-level and are reported in parentheses. +p < 0.10,*p < 0.05, **p < 0.01, ***p < 0.001
two pieces of evidence.36 First, I show that a large hospital plan in Northeast Florida excludedthe competing insurers from its network, thereby establishing an exclusive network with its ERphysicians. Second, I show that beneficiaries from the county with the hospital plan were evenless likely to visit the hospital for nonemergency conditions, and when they did visit the hospital,they were more likely to be referred to the hospital rather than arrive through the ER. The firstpiece of evidence substantiates the claim that hospital plans can form exclusive networks withtheir physicians. The second piece of evidence supports the hypothesis that access to primary careincreases when hospital plans form exclusive networks and directly compete with insurers.
At the start of reform, a large hospital formed a managed care plan in the Northeast Floridareform market. It competed for Medicaid beneficiaries against four insurer-owned plans.37 Whenthe hospital became a managed care plan, it no longer participated in its competitors’ networks(Figure 7).38 In effect, the hospital’s entry decreased the short run supply of ER physicians avail-able to the insurers, which increased the marginal cost of adding ER physicians to their networks.As a result, insurers contracted with fewer ER physicians than they would have in the absence of
36Unfortunately, without data on the number of primary care visits, I cannot simply count the number of primarycare physicians on each plan’s network.
37One of the insurer-owned plans, Access Health Solutions, was originally a minority physician network, but it waspurchased by Centene Corporation in 2007 and it was officially converted to an insurer-owned plan in 2009.
38For example, Shands-Jacksonville hospital was not listed among WellCare’s in-network hospitals. This infor-mation was taken from WellCare’s 2012 provider directory: https://florida.wellcare.com/WCAssets/florida/assets/fl_healthease_provider_directory_baker_11_2012.pdf
33
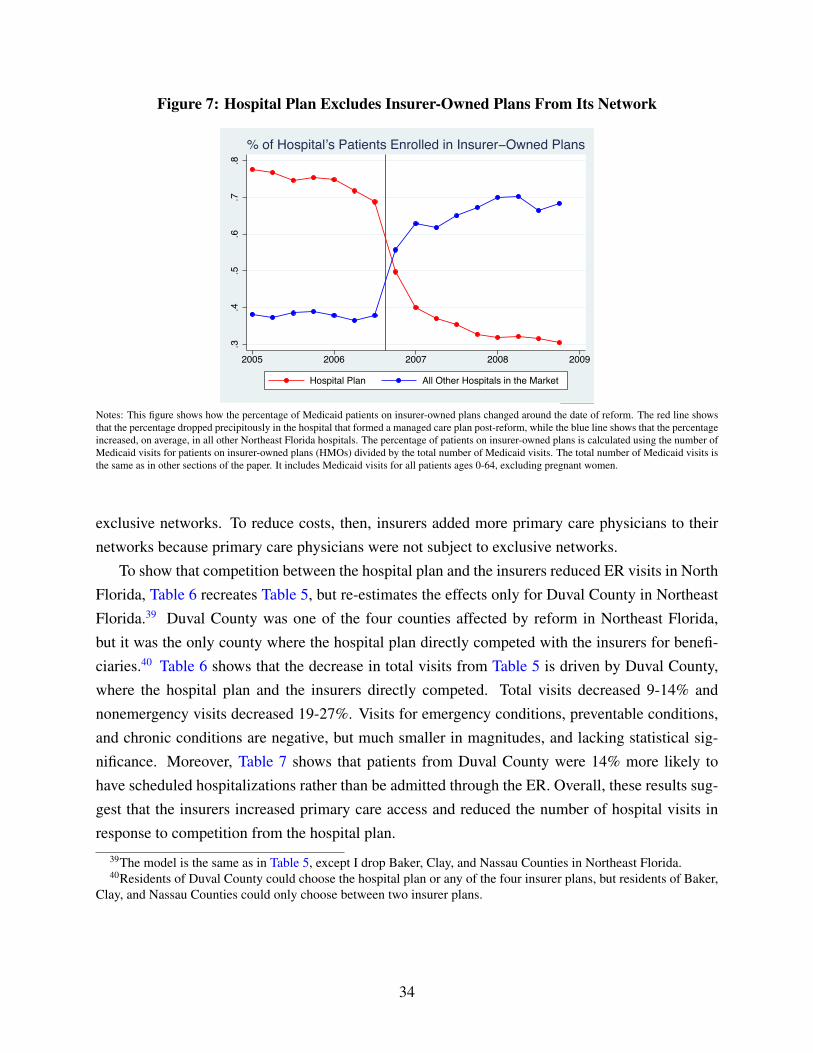
Figure 7: Hospital Plan Excludes Insurer-Owned Plans From Its Network
.3.4
.5.6
.7.8
2005 2006 2007 2008 2009
Hospital Plan All Other Hospitals in the Market
% of Hospital’s Patients Enrolled in Insurer−Owned Plans
®
Notes: This figure shows how the percentage of Medicaid patients on insurer-owned plans changed around the date of reform. The red line showsthat the percentage dropped precipitously in the hospital that formed a managed care plan post-reform, while the blue line shows that the percentageincreased, on average, in all other Northeast Florida hospitals. The percentage of patients on insurer-owned plans is calculated using the number ofMedicaid visits for patients on insurer-owned plans (HMOs) divided by the total number of Medicaid visits. The total number of Medicaid visits isthe same as in other sections of the paper. It includes Medicaid visits for all patients ages 0-64, excluding pregnant women.
exclusive networks. To reduce costs, then, insurers added more primary care physicians to theirnetworks because primary care physicians were not subject to exclusive networks.
To show that competition between the hospital plan and the insurers reduced ER visits in NorthFlorida, Table 6 recreates Table 5, but re-estimates the effects only for Duval County in NortheastFlorida.39 Duval County was one of the four counties affected by reform in Northeast Florida,but it was the only county where the hospital plan directly competed with the insurers for benefi-ciaries.40 Table 6 shows that the decrease in total visits from Table 5 is driven by Duval County,where the hospital plan and the insurers directly competed. Total visits decreased 9-14% andnonemergency visits decreased 19-27%. Visits for emergency conditions, preventable conditions,and chronic conditions are negative, but much smaller in magnitudes, and lacking statistical sig-nificance. Moreover, Table 7 shows that patients from Duval County were 14% more likely tohave scheduled hospitalizations rather than be admitted through the ER. Overall, these results sug-gest that the insurers increased primary care access and reduced the number of hospital visits inresponse to competition from the hospital plan.
39The model is the same as in Table 5, except I drop Baker, Clay, and Nassau Counties in Northeast Florida.40Residents of Duval County could choose the hospital plan or any of the four insurer plans, but residents of Baker,
Clay, and Nassau Counties could only choose between two insurer plans.
34

Table 6: Hospital Visits Decrease the Most in the County with the Hospital Plan
(1) (2) (3) (4) (5)Log(#Visits) Log(Total) Log(NonEmerg) Log(Emerg) Log(Prevent) Log(Chronic)
Year 1*Cty w/Hospital Plan -0.087*** -0.191*** -0.002 -0.045 -0.023(0.014) (0.021) (0.013) (0.022) (0.016)
Year 2*Cty w/Hospital Plan -0.137*** -0.270*** -0.028 -0.036 -0.067*(0.024) (0.039) (0.019) (0.032) (0.032)
Year 1*Mkt w/Physician Plans -0.009 -0.002 -0.011 -0.018 -0.015(0.016) (0.022) (0.014) (0.024) (0.017)
Year 2*Mkt w/Physician Plans -0.023 -0.015 -0.022 -0.021 -0.043(0.022) (0.035) (0.017) (0.032) (0.031)
N 1,024 1,024 1,024 1,024 1,024
Notes: This table replicates Table 5, but drops Baker, Clay, and Nassau Counties in Northeast Florida because the hospital-owned plan only enrolledresidents from Duval County in Northeast Florida. +p < 0.10, *p < 0.05, **p < 0.01, ***p < 0.001
Table 7: Scheduled Hospitalizations Increase in the County with the Hospital-Owned Plan
Pr(Scheduled Visit=1)
Year 1*Mkt w/Hospital Plan 0.027***(0.006)
Year 2*Mkt w/Hospital Plan 0.051***(0.006)
Year 1*Mkt w/Physician Plans -0.007(0.006)
Year 2*Mkt w/Physician Plans 0.004(0.006)
Dependent Variable Mean 0.28
N 795,462R2 0.06
Notes: The unit of analysis is the hospitalization-year-quarter. The dependent variable is the probability that the hospitalization was scheduled.Scheduled hospitalizations include referrals or transfers to the hospital. Unscheduled hospitalizations include patients admitted through the ER.The sample is restricted to hospitalized patients because the non-hospitalized records do not contain the visit source. The regression controls forcounty fixed effects, year*quarter fixed effects, county-linear time trends, and patient characteristics (gender, age, race, ethnicity). Standard errorsare clustered at the county-level and are reported in parentheses. +p < 0.10, *p < 0.05, **p < 0.01, ***p < 0.001
5.1.2 Plans Reduced the Average Cost Per Visit
The previous section showed that managed care plans in Northeast Florida reduced the number ofhospital visits. The managed care plans in Southeast Florida, however, did not reduce the number
35
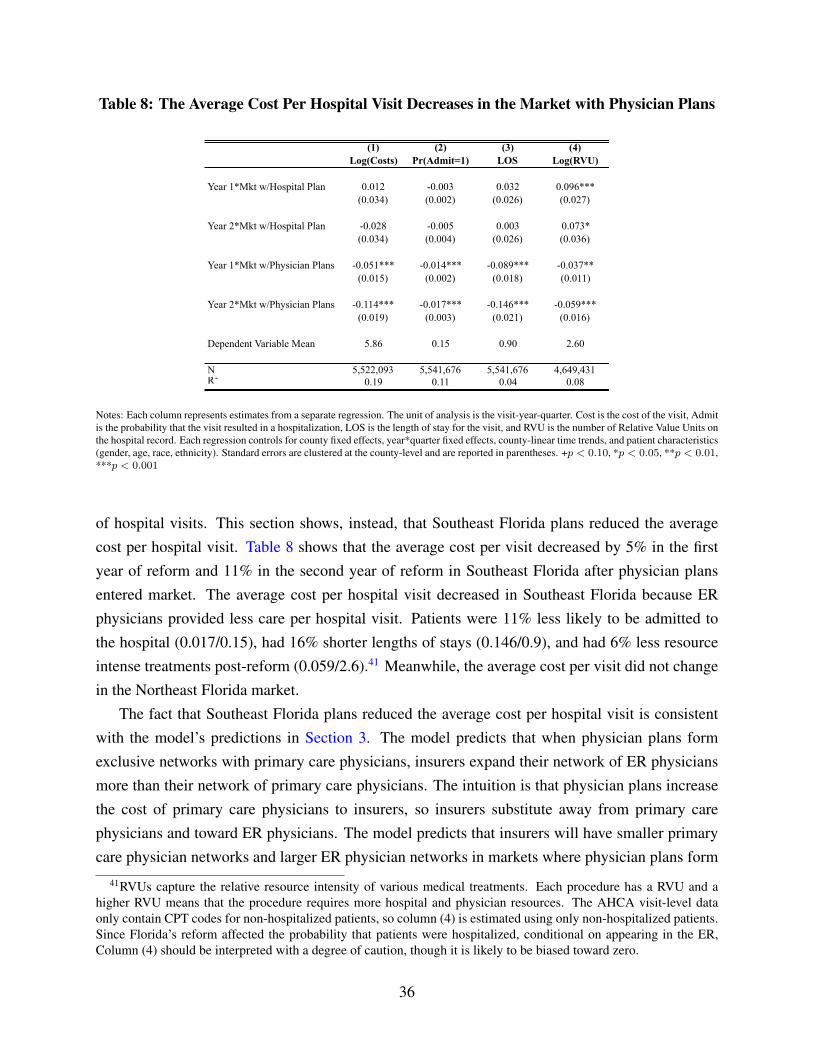
Table 8: The Average Cost Per Hospital Visit Decreases in the Market with Physician Plans
(1) (2) (3) (4)Log(Costs) Pr(Admit=1) LOS Log(RVU)
Year 1*Mkt w/Hospital Plan 0.012 -0.003 0.032 0.096***(0.034) (0.002) (0.026) (0.027)
Year 2*Mkt w/Hospital Plan -0.028 -0.005 0.003 0.073*(0.034) (0.004) (0.026) (0.036)
Year 1*Mkt w/Physician Plans -0.051*** -0.014*** -0.089*** -0.037**(0.015) (0.002) (0.018) (0.011)
Year 2*Mkt w/Physician Plans -0.114*** -0.017*** -0.146*** -0.059***(0.019) (0.003) (0.021) (0.016)
Dependent Variable Mean 5.86 0.15 0.90 2.60
N 5,522,093 5,541,676 5,541,676 4,649,431R2 0.19 0.11 0.04 0.08
Notes: Each column represents estimates from a separate regression. The unit of analysis is the visit-year-quarter. Cost is the cost of the visit, Admitis the probability that the visit resulted in a hospitalization, LOS is the length of stay for the visit, and RVU is the number of Relative Value Units onthe hospital record. Each regression controls for county fixed effects, year*quarter fixed effects, county-linear time trends, and patient characteristics(gender, age, race, ethnicity). Standard errors are clustered at the county-level and are reported in parentheses. +p < 0.10, *p < 0.05, **p < 0.01,***p < 0.001
of hospital visits. This section shows, instead, that Southeast Florida plans reduced the averagecost per hospital visit. Table 8 shows that the average cost per visit decreased by 5% in the firstyear of reform and 11% in the second year of reform in Southeast Florida after physician plansentered market. The average cost per hospital visit decreased in Southeast Florida because ERphysicians provided less care per hospital visit. Patients were 11% less likely to be admitted tothe hospital (0.017/0.15), had 16% shorter lengths of stays (0.146/0.9), and had 6% less resourceintense treatments post-reform (0.059/2.6).41 Meanwhile, the average cost per visit did not changein the Northeast Florida market.
The fact that Southeast Florida plans reduced the average cost per hospital visit is consistentwith the model’s predictions in Section 3. The model predicts that when physician plans formexclusive networks with primary care physicians, insurers expand their network of ER physiciansmore than their network of primary care physicians. The intuition is that physician plans increasethe cost of primary care physicians to insurers, so insurers substitute away from primary carephysicians and toward ER physicians. The model predicts that insurers will have smaller primarycare physician networks and larger ER physician networks in markets where physician plans form
41RVUs capture the relative resource intensity of various medical treatments. Each procedure has a RVU and ahigher RVU means that the procedure requires more hospital and physician resources. The AHCA visit-level dataonly contain CPT codes for non-hospitalized patients, so column (4) is estimated using only non-hospitalized patients.Since Florida’s reform affected the probability that patients were hospitalized, conditional on appearing in the ER,Column (4) should be interpreted with a degree of caution, though it is likely to be biased toward zero.
36

exclusive networks. When insurers expand their ER physician networks, they reduce the averagecost per visit.
I provide two pieces of evidence to support the hypothesis that Southeast Florida plans in-creased access to in-network ER physicians. First, I show that insurers had the legal authority toadd ER physicians to their networks and to request that their in-network ER physicians treat theirpatients at the hospital. Second, I show that Southeast Florida patients were treated by differentER physicians post-reform, whereas patients from other parts of Florida were not treated by dif-ferent ER physicians. The first piece of evidence shows that adding ER physicians to a network isa feasible strategy for insurers and the second piece of evidence shows that the Southeast Floridaplans were more likely to have their in-network ER physicians treat their patients.
The first piece of evidence comes from the Florida Medicaid’s managed care contract for re-form plans, which states that plans can recruit hospital staff to their networks and that plans canrequest that in-network hospital staff treat their patients at the hospital. In reference to emergencyroom care, the reform contract stipulates that, “If the provider determines that an Emergency Med-ical Condition exists [...], the Hospital must make a reasonable attempt to notify the Enrollee’sPCP [...] or Health Plan [...]. If the Enrollee’s PCP responds to the Hospital’s notification, [...] theHealth Plan may have a member of the Hospital staff with whom it has a Participating Providercontract participate in the treatment of the Enrollee.”42
Table 9 shows that Southeast Florida patients were more likely to be treated by different ERphysicians post-reform. Patients were 12% less likely to be treated by high-cost physicians (col-umn 1) and 1.5% more likely to be treated by hospitalists (column 2). Patients were also treated byphysicians who had 3.4% higher managed care patient volume pre-reform (column 3). In contrast,patients in Northeast Florida were no less likely to be treated by high-cost ER physicians, and theywere actually less likely to be treated by hospitalists, which is consistent with the hypothesis thatthey had greater access to their primary care physicians. Overall, Table 9 suggests that insurersrequested that in-network ER physicians treat their patients in response to physician plans enteringthe market.
5.2 Insurer Strategies versus Provider Plan Strategies
This paper’s results thus far have reflected the combined efforts of insurance plans and providerplans to reduce hospital costs. I showed that plans in Northeast Florida reduced the number ofhospital visits and I claimed that the effect was driven by the strategies of insurer plans that have80% market share. Similarly, I showed that the plans in Southeast Florida reduced the averagecost per visit and I claimed that the effect was driven by the strategies of insurer plans that have
42http://ahca.myflorida.com/MCHQ/Managed_Health_Care/MHMO/med_prov_0912.shtml
37
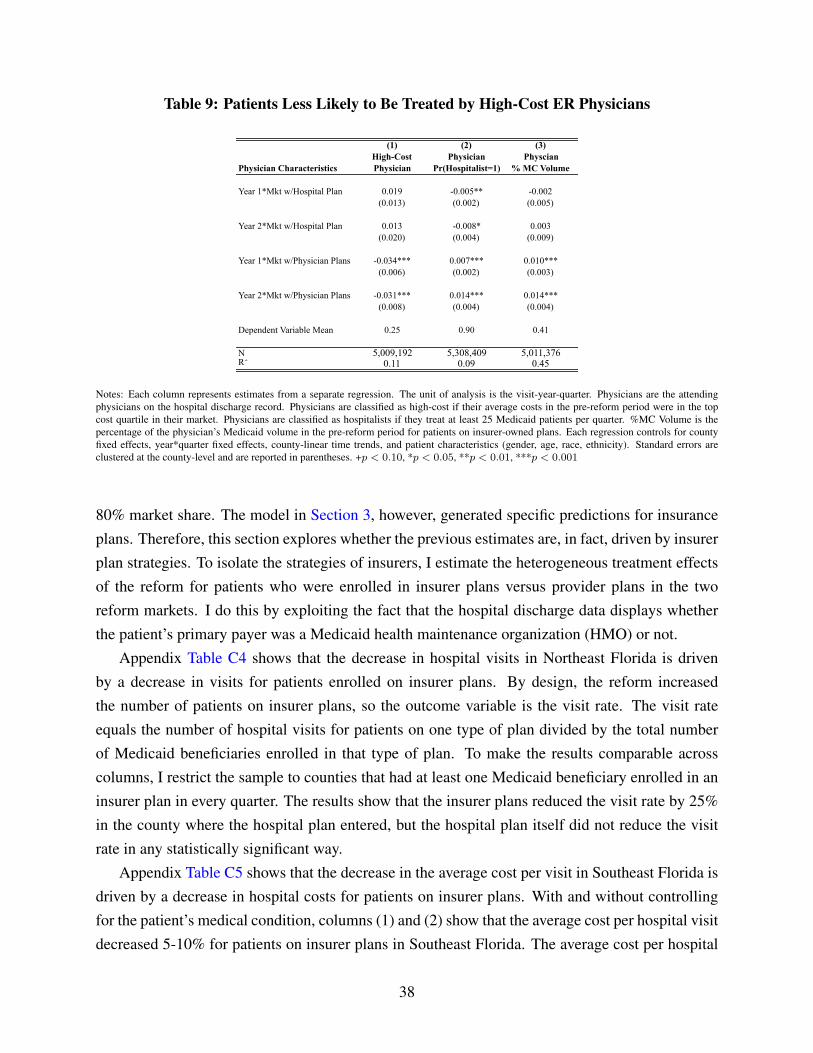
Table 9: Patients Less Likely to Be Treated by High-Cost ER Physicians
(1) (2) (3)High-Cost Physician Physcian
Physician Characteristics Physician Pr(Hospitalist=1) % MC Volume
Year 1*Mkt w/Hospital Plan 0.019 -0.005** -0.002(0.013) (0.002) (0.005)
Year 2*Mkt w/Hospital Plan 0.013 -0.008* 0.003(0.020) (0.004) (0.009)
Year 1*Mkt w/Physician Plans -0.034*** 0.007*** 0.010***(0.006) (0.002) (0.003)
Year 2*Mkt w/Physician Plans -0.031*** 0.014*** 0.014***(0.008) (0.004) (0.004)
Dependent Variable Mean 0.25 0.90 0.41
N 5,009,192 5,308,409 5,011,376R2 0.11 0.09 0.45
Notes: Each column represents estimates from a separate regression. The unit of analysis is the visit-year-quarter. Physicians are the attendingphysicians on the hospital discharge record. Physicians are classified as high-cost if their average costs in the pre-reform period were in the topcost quartile in their market. Physicians are classified as hospitalists if they treat at least 25 Medicaid patients per quarter. %MC Volume is thepercentage of the physician’s Medicaid volume in the pre-reform period for patients on insurer-owned plans. Each regression controls for countyfixed effects, year*quarter fixed effects, county-linear time trends, and patient characteristics (gender, age, race, ethnicity). Standard errors areclustered at the county-level and are reported in parentheses. +p < 0.10, *p < 0.05, **p < 0.01, ***p < 0.001
80% market share. The model in Section 3, however, generated specific predictions for insuranceplans. Therefore, this section explores whether the previous estimates are, in fact, driven by insurerplan strategies. To isolate the strategies of insurers, I estimate the heterogeneous treatment effectsof the reform for patients who were enrolled in insurer plans versus provider plans in the tworeform markets. I do this by exploiting the fact that the hospital discharge data displays whetherthe patient’s primary payer was a Medicaid health maintenance organization (HMO) or not.
Appendix Table C4 shows that the decrease in hospital visits in Northeast Florida is drivenby a decrease in visits for patients enrolled on insurer plans. By design, the reform increasedthe number of patients on insurer plans, so the outcome variable is the visit rate. The visit rateequals the number of hospital visits for patients on one type of plan divided by the total numberof Medicaid beneficiaries enrolled in that type of plan. To make the results comparable acrosscolumns, I restrict the sample to counties that had at least one Medicaid beneficiary enrolled in aninsurer plan in every quarter. The results show that the insurer plans reduced the visit rate by 25%in the county where the hospital plan entered, but the hospital plan itself did not reduce the visitrate in any statistically significant way.
Appendix Table C5 shows that the decrease in the average cost per visit in Southeast Florida isdriven by a decrease in hospital costs for patients on insurer plans. With and without controllingfor the patient’s medical condition, columns (1) and (2) show that the average cost per hospital visitdecreased 5-10% for patients on insurer plans in Southeast Florida. The average cost per hospital
38

visit did not decrease by nearly as much or as consistently for patients on provider plans. Theaverage cost per hospital visit for patients on insurer plans actually increased in Northeast Florida,which is what would happen if the composition of hospital visits changed after insurers reducedthe number of visits for nonemergency medical conditions. Once I control for the patient’s medicalcondition, however, there is no change in the average cost per visit for patients on insurer plans inNortheast Florida. Taken together, the results suggest that insurers reduced the number of hospitalvisits in Northeast Florida and insurers reduced the average cost per hospital visit in SoutheastFlorida, but insurers were unable to do both in the same market.
5.3 Robustness
This section shows robustness tests for the difference-in-difference estimates that were presentedin the previous sections. In general, there are two types of threats that could produce inconsis-tent estimates in the difference-in-difference model. The first threat is that reform and non-reformcounties could have differential trends in the outcome variables. If the reform markets had differ-ent pre-existing non-linear trends than the non-reform markets, then the difference-in-differenceestimators will generate inconsistent results.
The second threat is that the reform can affect the composition of the sample of hospital visits.For example, Currie and Fahr (2001) [12] show that the introduction of managed care plans canaffect Medicaid take-up, which can affect the composition of Medicaid beneficiaries post-reform.Another example from Aizer et al. (2007) [2] shows that beneficiaries may move into or out ofreform counties as a result of reform. These papers show that healthcare reforms can generatesample selection post-reform, so without unique patient identifiers, the difference-in-differenceestimates may be biased. This section offers two robustness tests that test for differential trendsacross reform and non-reform counties and three robustness tests that test for compositional bias.
5.3.1 Differential Trends Across Reform and Non-Reform Counties
I address the threat from differential trends in two ways, first focusing on differential trends in thecounty-level regressions, then turning to differential trends in the visit-level regressions. First, Iestimate the same county-level difference-in-difference results from Table 5, but I include a leadingdummy variable that captures the effect of the reform in the 6 months before the reform started.43
If the county-specific linear time trends adequately control for the differences across reform andnon-reform counties, then the 6-month lead coefficient should not be negative and statisticallysignificant. Appendix Table D1 shows that the leading coefficient is negative, but it is very small
43I use the 6 months pre-reform because the data only date back to 1.5 years pre-reform.
39

and not statistically significant for all outcome variables. I take this as evidence that confoundingtrends in the county-level outcome variables are unlikely.
Next, I turn to the threat of differential trends in the visit-level regressions. I re-estimate theresults from Table 8, this time using a triple-difference estimator. The triple-difference estima-tor compares Medicaid to non-Medicaid hospital visits in reform and non-reform counties pre-and post-reform. The non-Medicaid visits are comparable to Medicaid visits because I restrictthe sample to patients ages 0-64 years old and exclude childbirths. The triple-difference estima-tor is meant to control non-linear trends in the outcome variables that may be biasing the results.Appendix Table D2 shows that the triple-difference estimates are almost exactly identical to theoriginal difference-in-difference estimates; that is, the average cost per visit decreases in the South-east Florida (column (1)), but does not change in Northeast Florida reform market (column (2)).From these results, I conclude that differential trends across the reform and non-reform countiesare unlikely to be responsible for the results.
5.3.2 Compositional Changes to the Sample
I address the threat from compositional bias in three ways and I focus on the average cost per visitin the visit-level regressions because that is where the bias is likely to appear. First, I estimate theeffect of the reform with and without controlling for patient characteristics to see if the controlsaffect the estimates. Second, I use a different data set to create a panel of patients who visitedthe hospital before and after the reform.44 Column (1) of Appendix Table D3 shows the effectsof the reform on the average cost per visit without controlling for patient characteristics, column(2) shows the results after controlling for patient characteristics, and column (3) shows the resultsfor the panel of patients who visited the hospital before and after the reform. The results areremarkably consistent across columns, indicating that the average cost of a hospital visit decreasedin Southeast Florida, and did not change in Northeast Florida.
Third, I estimate the effect of the reform on the average cost per visit, but I control for thepatient’s medical condition. The results from Section 5.2.1 revealed that Medicaid beneficiariesfrom Northeast Florida were less likely to visit the hospital for nonemergency conditions post-reform. Therefore, the post-reform sample of patients from Northeast Florida may have beenrelatively sicker than patients from the non-reform counties, which would make the reform andnon-reform counties less comparable post-reform. So column (4) of Appendix Table D3 shows theresults for the average cost per visit with controls for the number of comorbidities on the record
44To construct the panel, I use the Healthcare Cost and Utilization Project (HCUP) State Inpatient and EmergencyDepartment Databases for Florida from 2005-2008. HCUP data access was provided by the National Bureau ofEconomic Research (NBER). I use the Revisit Files, including the visitlink and daystoevent variables, to track thesame patients before and after the reform was implemented.
40
and whether the visit was for a nonemergency, preventable, or chronic condition. Average costsper visit are still 5-10% lower in Southeast Florida (because the composition of visits did notchange), but the average costs per visit are now 3-8% lower in Northeast Florida as well. However,the results from the previous section revealed that the decrease in the average cost per visit inNortheast Florida was driven by the hospital plan, not the insurers. The insurer plans in NortheastFlorida reduced the number of hospital visits, but did not reduce the average cost per hospitalvisit, which is consistent with the model’s predictions in Section 3. To summarize, this sectionpresented five pieces of evidence to show that differential time trends and compositional changesto the sample are unlikely to have driven the paper’s results.
6 Discussion
As public health insurance expenditures have increased over time, policymakers have expressedinterest in switching Medicaid and Medicare beneficiaries from the fee-for-service (FFS) systemto managed care plans. Forty-two states have implemented Medicaid managed care programs withrisk-based reimbursements and at least ten states plan to expand their managed care programs.45,46
In 1997, the federal government formally created a managed care program for Medicare benefi-ciaries, and in 2009, the federal government added Accountable Care Organizations to the list ofmanaged care options that Medicare beneficiaries could choose from.47 With the public health in-surance markets evolving to include new forms of healthcare delivery, it is important to understandhow switching beneficiaries from FFS to managed care affects healthcare utilization, costs, andoutcomes.
This paper shows that shifting Medicaid beneficiaries from fee-for-service to managed careplans can reduce hospital costs by 7-12%. Hospital costs are costs associated with emergencyroom visits and hospitalizations and they account for the largest share of Medicaid expenditures.To estimate the impact of switching from FFS to managed care, I use Florida’s 2006 MedicaidReform, which mandated that children, families, aged and disabled beneficiaries in two healthcaremarkets switch from the state’s FFS system to (1) insurer-owned plans, (2) hospital-owned plans,or (3) physician-owned plans. Using a difference-in-difference estimator across the reform andnon-reform markets pre- and post-reform, I show that insurers reduced costs in different ways indifferent markets. Insurers reduced the number of hospital visits in Northeast Florida, but reduced
45Managed care statistics are available from Kaiser State Health Facts: http://kff.org/medicaid/state-indicator/medicaid-enrollment-in-comprehensive-risk-based-managed-care/
46California, Florida, Louisiana, Kentucky, New Jersey, New York, Ohio, South Carolina, Washington, and Wis-consin have submitted CMS waivers to expand their managed care programs (Iglehart 2011 [29]).
47The Medicare Advantage plans from 1997-onward are insurer-owned plans, while the Accountable Care Organi-zations are provider-owned plans.
41

the average cost per visit in Southeast Florida.I explain how insurers choose their strategies to reduce costs and I show that competition with
provider plans affects their strategies to reduce costs. Insurers expanded access to primary carephysicians in Northeast Florida because the competing hospital plan increased the cost of addingER physicians to the insurers’ networks. Insurers expanded access to in-network ER physiciansin Southeast Florida because the competing physician plans increased the cost of adding primarycare physicians to their networks. This is the first paper to model competition between insurers andprovider plans in the Medicaid market and to generate different predictions for different markets.The results suggest that insurers have leverage in how they reduce costs, but their leverage may berestricted by provider plan entry.
This paper has two limitations that I plan to address in future research. One limitation isthat I do not show how switching from FFS to managed care affected patient health outcomes.I have shown that patients in Southeast Florida received less care per hospital visit, which mayhave resulted in worse health outcomes. Because I use hospital discharge data, however, I do notobserve health outcomes that occur after the hospital visit. Another limitation of the paper is that Iestimate the short-run effects of switching from FFS to managed care. I have shown that insurers indifferent markets reduced costs in different ways in the short run, but it is possible that the insurersadjusted their strategies in the long run. Moreover, if the entry of provider plans caused insurersto exit the market, which can occur in a market foreclosure model, then there is another reasonto expect the reform to have different long run effects. These two questions remain open areas ofresearch.48
48In September 2014, I received a dissertation grant from the Agency for Healthcare Research and Quality thatwill sponsor the purchase of Medicaid claims data (CMS MAX). The Medicaid claims data include all healthcareencounters and mortality records for Florida’s Medicaid beneficiaries from 2003-2011 and the data can be linkedwithin beneficiaries over time. I plan to use these data in future research.
42

References
[1] Aitken, Murray. 2013. “Shift from Fee-for-Service to Managed Medicaid: What is the Im-pact on Patient Care?” IMS Institute for Healthcare Informatics Report.
[2] Aizer, Anna, Janet Currie, and Enrico Moretti. 2007. “Does Managed Care Hurt Health?Evidence from Medicaid Mothers.” Review of Economics and Statistics, 89: 385-399.
[3] Asker, John. 2005. Diagnosing Foreclosure Due to Exclusive Dealing. NYU Working PaperNo. EC-04-36.
[4] Baker, Laurence and Christopher Afendulis. 2005. “Medicaid Managed Care and HealthCare for Children.” Health Services Research, 40: 19-38.
[5] Basu, Jayasree, Bernard Friedman, and Helen Burstein. 2004. “Managed Care and Pre-ventable Hospitalization among Medicaid Adults.” Health Services Research, 39(3): 489-509.
[6] Bindman, Andrew B., Arpita Chattopadyay, Dennis H. Osmond, William Huen, and PeterBacchetti. 2005. “The Impact of Medicaid Managed Care on Hospitalizations for Ambula-tory Care Sensitive Conditions.” Health Services Research, 40(1): 19-38.
[7] Boyd, Donald. 2014. “The Potential Impact of Alternative Health Care Spending Scenarioson Future State and Local Government Budgets.” Engelberg Center for Health Care Reformat Brookings. http://www.brookings.edu/research/papers/2014/04/11-health-care-spending-state-local-budgets-boyd
[8] Carroll, John. 2011. “Stressed States Open Doors to Medicaid Managed Care.” ManagedCare Magazine. http://www.managedcaremag.com/archives/1103/1103.medicaid.html
[9] Center for Medicare and Medicaid Services. 2013. “National Health ExpendituresHighlights.” http://www.cms.gov/Research-Statistics-Data-and-Systems/Statistics-Trends-and-Reports/NationalHealthExpendData/NationalHealthAccountsProjected.html
[10] Conover, Christopher J., Peter J. Rankin, and Frank A. Sloan. 2001. “Effects of TennesseeMedicaid Managed Care on Obstetrical Care and Birth Outcomes.” Journal of Health Poli-
tics, 26(6): 1291-1324.
[11] Coughlin, Teresa, Sharon Long, and John Graves. 2009. “Does Managed Care ImproveAccess to Care for Medicaid Beneficiaries with Disabilities? A National Study.” Inquiry,45: 395-407.
43

[12] Currie, Janet and John Fahr. 2001. “Hospitals, Managed Care, and the Charity Caseload inCalifornia.” Journal of Health Economics, 23: 421-442.
[13] Currie, Janet and John Fahr. 2005. “Medicaid Managed Care: Effects on Children’s Medi-caid Coverage and Utilization.” Journal of Public Economics, 89: 85-108.
[14] Cutler, David M., Mark McClellan, and Joseph P. Newhouse. 2000. “How Does ManagedCare Do It?” RAND Journal of Economics, 31: 526-548.
[15] “Distribution of Medicaid Spending on Acute Care.” 2012. Kaiser State Health Facts.http://kff.org/medicaid/state-indicator/spending-on-acute-care/
[16] Dombkowski, Kevin J., Rachel Stanley, and Sarah J. Clark. 2004. “Influence of MedicaidManaged Care Enrollment on Emergency Department Utilization by Children.” Pediatric
Adolescent Medicine, 158(1): 17-21.
[17] Draper, Debra A., Robert E. Hurley, and Ashley C. Short. 2004. “Medicaid Managed Care:The Last Bastion of the HMO?” Health Affairs, 23(2): 155-167.
[18] Duggan, Mark. 2004. “Does Contracting Out Increase the Efficiency of Government Pro-grams? Evidence from Medicaid HMOs.” The Journal of Public Economics, 88: 2549-2572.
[19] Duggan, Mark and Tamara Hayford. 2011. “Has the Shift to Managed Care Reduced Medi-caid Expenditures? Evidence from State and Local-Level Mandates.” NBER Working Paper
No. 17236.
[20] Gaynor, Martin and Robert Town. 2011. “Competition in Health Care Markets.”Handbook of Health Economics, Mark V. Pauly, Thomas G. McGuire, and Pedro P. Bar-ros (eds) (Amsterdam: North Holland) volume 2.
[21] Garret, B., A. Davidoff, and A. Yemane. 2003. “Effects of Medicaid Managed Care Pro-grams on Health Services Access and Use.” Health Services Research, 32: 575-594.
[22] Gleid, Sherri. 2000. “Managed Care.” Handbook of Health Economics, A.J. Culyer and J.P.Newhouse (eds) (Amsterdam: North Holland) volume 1A.
[23] Goin, Dana, and Stephen Zuckerman. 2012. “How Much Will Medicaid Physician Fees forPrimary Care Rise in 2013? Evidence from a 2012 Survey of Medicaid Physician Fees.”The Kaiser Commisson on Medicaid and the Uninsured.
44

[24] Harman, Jeffrey S., Christy H. Lemak, Mona Al-Amin, Allyson G. Hall, and Robert PaulDuncan. 2011. “Changes in Per Member Per Month Expenditures after Implementation ofFlorida’s Medicaid Reform Demonstration.” Health Services Research, 46(3): 787-804.
[25] Harman, Jerry S., Allyson G. Hall, Christy H. Lemak, and R. Paul Duncan. 2014. “DoProvider Service Networks Result in Lower Expenditures Compared with HMOs or PrimaryCare Case Management in Florida’s Medicaid Program?” Health Services Research, 49: 858877.
[26] Herring, Brad and Kathleen E. Adams. 2010. “Using HMOs to Serve the Medicaid Pop-ulation: What are the Effects on Utilization and Does the Type of HMO Matter?” Health
Economics, 20: 446-460.
[27] Holahan, John, Stephen Zuckerman, Alison Evans, and Suresh Rangarajan. 1998. “Medi-caid Managed Care in Thirteen States.” Health Affairs, 17(3): 43-63.
[28] Howell, Embry A., Ashley Palmer, and Fiona Adams. 2012. “Medicaidand CHIP Risk-Based Managed Care in 20 States.” The Urban Institute.http://www.urban.org/publications/412617.html
[29] Iglehart, John K. 2011. “Desperately Seeking Savings: States Shift More Medicaid En-rollees to Managed Care.” Health Affairs, 30(9): 1627-1629.
[30] Kaestner, Robert, Lisa Dubay, and Genevieve Kenney. 2005. “Managed Care and InfantHealth: An Evaluation of Medicaid in the US.” Social Science and Medicine, 60: 1815-1833.
[31] Levinson, Arik and Frank Ullman. 1998. “Medicaid Managed Care and Infant Health.” Jour-
nal of Health Economics, 17: 351-368.
[32] Libersky, Jenna, Allison Hedley Dodd, and Shinu Verghese. 2013. “National and StateTrends in Enrollment and Spending for Dual Eligibles Under Age 65 in Medicaid ManagedCare.” Disability and Health Journal, 6: 87-94.
[33] Marton, James, Aaron Yelowitz, and Jeffrey C. Talbert. 2014. “A Tale of Two Cities? TheHeterogeneous Impact of Medicaid Managed Care.” Journal of Health Economics, 36: 47-68.
[34] McGuire, Thomas G. 2000. “Physician Agency.” Handbook of Health Economics, A.J. Cu-lyer and J.P. Newhouse (eds) (Amsterdam: North Holland) volume 1A.
45

[35] Moewe, M.C. 2006. “Shands Invests Millions to Launch Medicaid Plan” Jacksonville Busi-
ness Journal. http://www.bizjournals.com/jacksonville/stories/2006/07/10/story5.html
[36] National Governors Association and the National Association of State Budget Officers.2011. “The Fiscal Survey of the States: An Update of State Fiscal Conditions.”
[37] State Budget Crisis Task Force. 2012. “Report of the State Budget Crisis Task Force.”http://www.statebudgetcrisis.org/wpcms/wp-content/images/Report-of-the-State-Budget-Crisis-Task-Force-Full.pdf
[38] Rosenthal, Elisabeth. 2014. “Costs Can Go Up Fast When E.R. Is in Network but DoctorsAre Not.” The New York Times.
[39] Rudowitz, Robin. 2014. “A Look at CBO Projections for Medicaid and CHIP.” The KaiserCommission on Medicaid and the Uninsured.
[40] “Status of State Action on the Medicaid Expansion Decision.” 2014. Kaiser StateHealth Facts. http://kff.org/health-reform/state-indicator/state-activity-around-expanding-medicaid-under-the-affordable-care-act/
[41] Truffer, Christopher J., John D. Klem, Christian J. Wolfe, Kathryn E. Rennie, and Jessica F.Shuff. 2012. “2012 Actuarial Report on the Financial Outlook for Medicaid.” Office of theActuary, Centers for Medicare and Medicaid Services, and the United States Department ofHealth and Human Services.
[42] Wennberg, John E. 2010. Tracking Medicine: A Researcher’s Quest to Understand Healthcare,Oxford University Press.
46

Appendix A: Medicaid Enrollment by Plan Type
Table 1A: Southeast Florida Managed Care Plans
Plan Name Plan Type Enrollment
Southeast FloridaAccess Health Solutions Insurer 2,936Amerigroup Insurer 14,889Freedom Insurer 1,019Humana Insurer 12,088Preferred Medical Plan Insurer 2,504Total Health Choice Insurer 3,621United Healthcare Insurer 755Universal Insurer 810Vista dba Buena Vista Insurer 6Vista Healthplan S. Florida Insurer 6WellCare Insurer 41,549
Pediatric Associates Provider 9,254South Florida Community Care Network Provider 8,205NetPass Provider 5,138
Total 102,070
Notes: This table shows the number of Medicaid beneficiaries who were enrolled in managed care plans post-reform. These enrollment figurescome from a county-level enrollment report from December 2008, which was published by the FL AHCA.
Table 2A: Northeast Florida Managed Care Plans
Plan Name Plan Type Enrollment
Northeast FloridaAccess Health Solutions Insurer 18,322WellCare Insurer 37,253United Healthcare Insurer 14,291Universal Insurer 2,554
Shands-Jacksonville Hospital Provider 18,502
Total 90,922
Notes: This table shows the number of Medicaid beneficiaries who were enrolled in managed care plans post-reform. These enrollment figurescome from a county-level enrollment report from December 2008, which was published by the FL AHCA.
47

Appendix B: Comparative Statics
PCP ∗: Below I show how optimal demand for primary care physician hours (PCP ∗) changeswith respect to the marginal cost of primary care physician hours, the marginal cost of in-network ER physician hours, and the marginal cost of out-of-network ER physicians hours.
∂PCP ∗
∂MCPCP= (−α− β)× V̄ × (1− α− β)α+β
ααββ×
[MCα
ERI×MCβ
ERO
MCα+β+1PCP
]< 0
∂PCP ∗
∂MCERI= α× V̄ × (1− α− β)α+β
ααββ×
[MCα−1
ERI×MCβ
ERO
MCα+βPCP
]> 0
∂PCP ∗
∂MCERO= β × V̄ × (1− α− β)α+β
(αβ)α×
[MCα
ERI×MCβ−1
ERO
MCα+βPCP
]> 0
ER∗I: Below I show how optimal demand for in-network ER physician hours (ER∗
I) changes withrespect to the marginal cost of primary care physician hours, the marginal cost of in-networkER physician hours, and the marginal cost of out-of-network ER physicians hours.
∂ER∗I
∂MCPCP= (1− α− β)× V̄ × α1−α
ββ(1− α− β)1−α−β×
[MC−α−β
PCP ×MCβERO
MC1−αERI
]> 0
∂ER∗I
∂MCERI= (α− 1)× V̄ × α1−α
ββ(1− α− β)1−α−β×
[MC1−α−β
PCP ×MCβERO
MC2−αERI
]< 0
∂ER∗I
∂MCERO= β × V̄ × α1−α
ββ(1− α− β)1−α−β×
[MC1−α−β
PCP ×MCβ−1ERO
MC1−αERI
]> 0
ER∗O: Below I show how optimal demand for in-network ER physician hours (ER∗
O) changes withrespect to the marginal cost of primary care physician hours, the marginal cost of in-networkER physician hours, and the marginal cost of out-of-network ER physicians hours.
∂ER∗O
∂MCPCP= (1− α− β)× V̄ × β1−β
αα(1− α− β)1−α−β
[MC−α−β
PCP ×MCαERI
MC1−βERO
]> 0
∂ER∗O
∂MCERI= α× V̄ × β1−β
αα(1− α− β)1−α−β
[MC1−α−β
PCP ×MCα−1ERI
MC1−βERO
]> 0
∂ER∗O
∂MCERO= (β − 1)× V̄ × β1−β
αα(1− α− β)1−α−β
[MC1−α−β
PCP ×MCαERI
MC2−βERO
]< 0
48
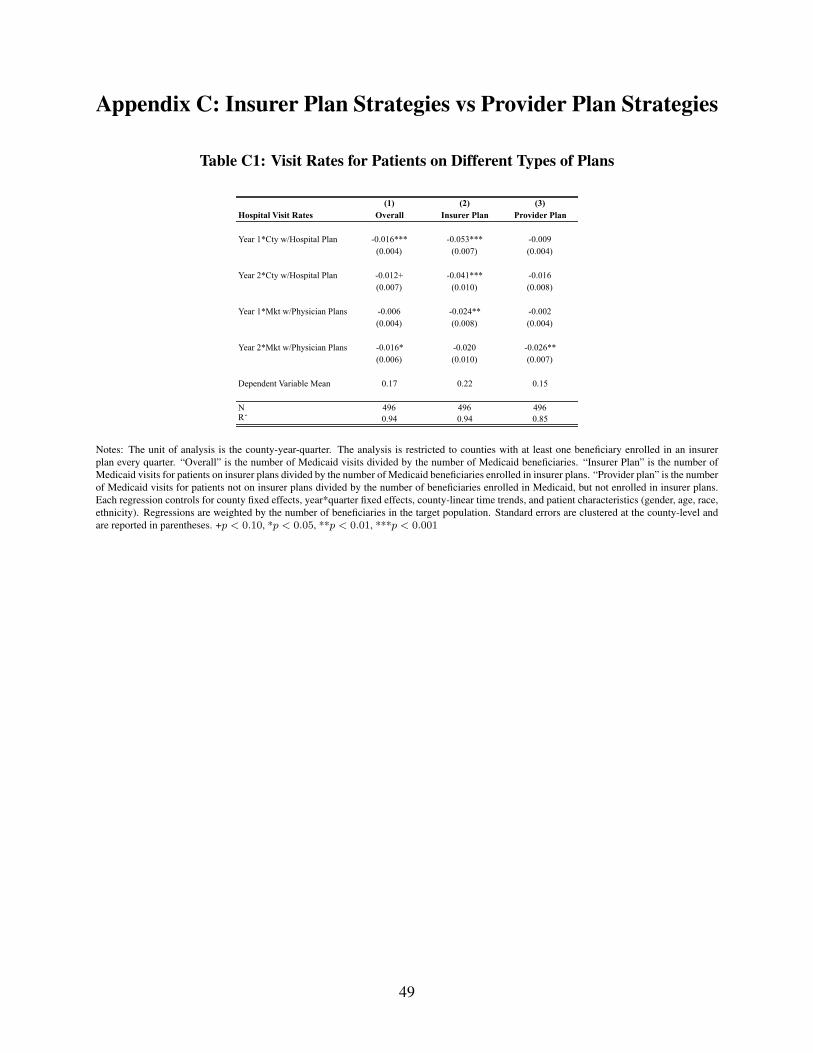
Appendix C: Insurer Plan Strategies vs Provider Plan Strategies
Table C1: Visit Rates for Patients on Different Types of Plans
(1) (2) (3)Hospital Visit Rates Overall Insurer Plan Provider Plan
Year 1*Cty w/Hospital Plan -0.016*** -0.053*** -0.009(0.004) (0.007) (0.004)
Year 2*Cty w/Hospital Plan -0.012+ -0.041*** -0.016(0.007) (0.010) (0.008)
Year 1*Mkt w/Physician Plans -0.006 -0.024** -0.002(0.004) (0.008) (0.004)
Year 2*Mkt w/Physician Plans -0.016* -0.020 -0.026**(0.006) (0.010) (0.007)
Dependent Variable Mean 0.17 0.22 0.15
N 496 496 496R2 0.94 0.94 0.85
Notes: The unit of analysis is the county-year-quarter. The analysis is restricted to counties with at least one beneficiary enrolled in an insurerplan every quarter. “Overall” is the number of Medicaid visits divided by the number of Medicaid beneficiaries. “Insurer Plan” is the number ofMedicaid visits for patients on insurer plans divided by the number of Medicaid beneficiaries enrolled in insurer plans. “Provider plan” is the numberof Medicaid visits for patients not on insurer plans divided by the number of beneficiaries enrolled in Medicaid, but not enrolled in insurer plans.Each regression controls for county fixed effects, year*quarter fixed effects, county-linear time trends, and patient characteristics (gender, age, race,ethnicity). Regressions are weighted by the number of beneficiaries in the target population. Standard errors are clustered at the county-level andare reported in parentheses. +p < 0.10, *p < 0.05, **p < 0.01, ***p < 0.001
49

Table C2: Average Cost Per Visit for Patients on Different Types of Plans
(1) (2) (3) (4)
Log(Costs) Mkt w/Physician Plans Mkt w/Physician Plans Mkt w/Hospital Plan Mkt w/Hospital Plan
Year 1*Insurer Plan -0.052** -0.040* 0.073* 0.012(0.017) (0.015) (0.029) (0.017)
Year 2*Insurer Plan -0.116*** -0.109*** 0.077* -0.010(0.019) (0.016) (0.032) (0.023)
Year 1*Provider Plan 0.014 -0.002 0.009 -0.024(0.016) (0.015) (0.024) (0.014)
Year 2*Provider Plan -0.020 -0.038* -0.073* -0.095***(0.021) (0.016) (0.030) (0.024)
Insurer Plan Y Y Y YCounty Fixed Effects Y Y Y YYear*Quarter Fixed Effects Y Y Y YCounty Linear Time Trends Y Y Y YPatient Characteristics Y Y Y YPatient Medical Condition Y Y
N 5,151,513 5,151,513 5,086,178 5,086,178R2
0.20 0.34 0.20 0.35
Notes: The unit of analysis is the visit-year-quarter. The first two columns compare the Northeast Florida reform counties to all other countiesin Florida and the second two columns compare the Southeast Florida reform county to all other counties in Florida. The second column in eachsequence controls for the type of medical visit. The types of medical visits include (1) nonemergency (vs emergency), (2) preventable, (3) chronic,and (4) the number of comorbidities on the record. Each regression controls for whether the patient is on an insurer plan, county fixed effects,year*quarter fixed effects, county-linear time trends, and patient characteristics (gender, age, race, ethnicity). Standard errors are clustered at thecounty-level and are reported in parentheses. +p < 0.10, *p < 0.05, **p < 0.01, ***p < 0.001
50

Appendix D: Robustness
Table D1: Testing for Pre-Trends
(1) (2) (3) (4) (5)All Counties Log(#Visits) Log(#Non-Emerg) Log(#Emerg) Log(Prevent) Log(Chronic)
6 months pre-reform -0.010 -0.008 -0.015 -0.052 0.019(0.013) (0.023) (0.013) (0.050) (0.043)
Year 1*Mkt w/Hospital Plan -0.080* -0.150* -0.025 -0.092 0.009(0.031) (0.063) (0.026) (0.052) (0.048)
Year 2*Mkt w/Hospital Plan -0.110+ -0.192+ -0.047 -0.103 -0.004(0.057) (0.111) (0.031) (0.080) (0.088)
Year 1*Mkt w/Physician Plans -0.017 -0.005 -0.026 -0.064 0.004(0.023) (0.032) (0.022) (0.053) (0.041)
Year 2*Mkt w/Physician Plans -0.033 -0.019 -0.042 -0.093 -0.012(0.029) (0.045) (0.027) (0.079) (0.065)
N 1,072 1,072 1,072 1,072 1,072
Notes: This table replicates Table 5, but adds a dummy variable for the reform counties in the six months pre-reform. The dummy variableshows whether there were pre-trends prior to the reform’s implementation. Each regression controls for county fixed effects, year*quarter fixedeffects, county-linear time trends, and patient characteristics (gender, age, race, ethnicity). Regressions are weighted by the number of Medicaidbeneficiaries in the target population. Standard errors are clustered at the county-level and are reported in parentheses. +p < 0.10, *p < 0.05,**p < 0.01, ***p < 0.001
Table D2: Triple-Difference Estimator
(1) (2)Log(Costs) Log(Costs)
All Counties Mkt w/Hospital Plan Mkt w/Physician Plans
Year 1*Reform*Medicaid 0.003 -0.035**(0.025) (0.011)
Year 2*Reform*Medicaid 0.032 -0.091***(0.024) (0.016)
Medicaid*Reform County Y YPost*Reform County Y YMedicaid*Post Y YMedicaid Fixed Effect Y YCounty Fixed Effects Y YYear*Quarter Fixed Effects Y YMedicaid Time Trend Y YCounty Linear Time Trends Y YPatient Characteristics Y Y
N 20,361,731 20,948,107R2
0.19 0.18
Notes: This table replicates the first two columns of Table 8, but uses a triple-difference estimator across reform and non-reform counties, pre-and post-reform, for Medicaid and non-Medicaid patients. Columns (1) and (3) give results for Southeast Florida compared to all other countiesin Florida. Columns (2) and (4) give results for Northeast Florida compared to all other counties in Florida. Regressions also control for countyfixed effects, year*quarter fixed effects, county-linear time trends, a Medicaid time trend, and patient characteristics (gender, age, race, ethnicity).Standard errors are clustered at the county-level and are reported in parentheses. +p < 0.10, *p < 0.05, **p < 0.01, ***p < 0.001
51
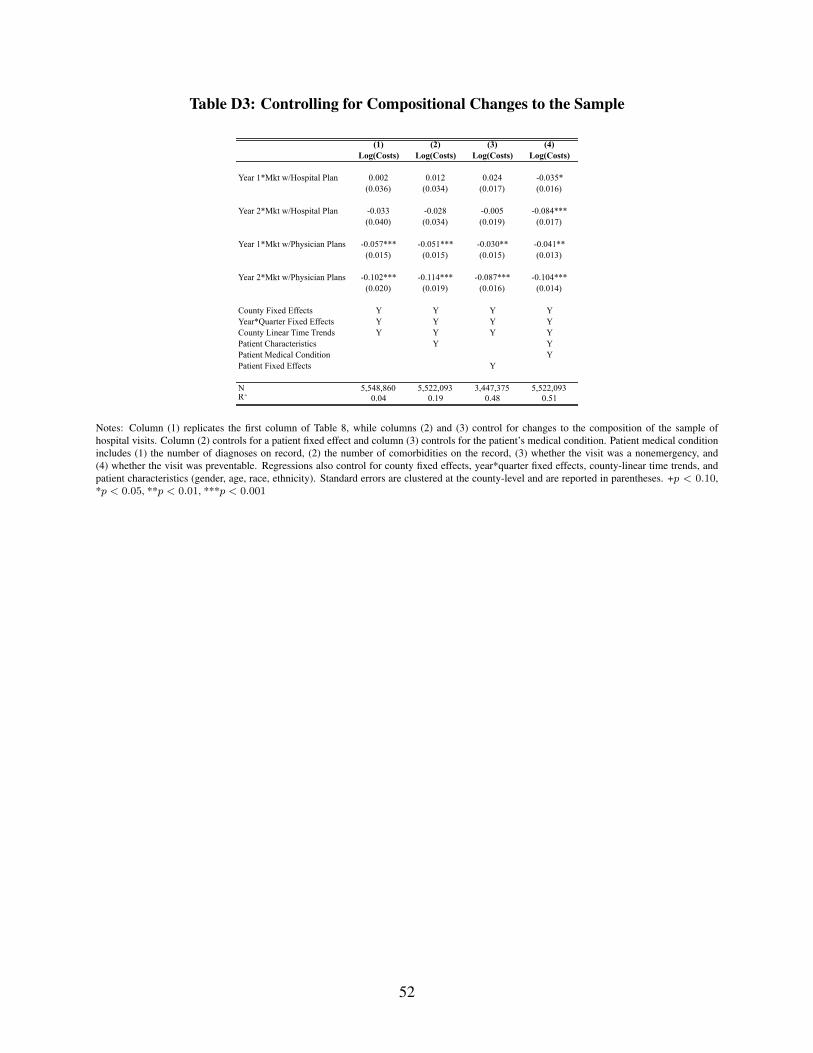
Table D3: Controlling for Compositional Changes to the Sample
(1) (2) (3) (4)Log(Costs) Log(Costs) Log(Costs) Log(Costs)
Year 1*Mkt w/Hospital Plan 0.002 0.012 0.024 -0.035*(0.036) (0.034) (0.017) (0.016)
Year 2*Mkt w/Hospital Plan -0.033 -0.028 -0.005 -0.084***(0.040) (0.034) (0.019) (0.017)
Year 1*Mkt w/Physician Plans -0.057*** -0.051*** -0.030** -0.041**(0.015) (0.015) (0.015) (0.013)
Year 2*Mkt w/Physician Plans -0.102*** -0.114*** -0.087*** -0.104***(0.020) (0.019) (0.016) (0.014)
County Fixed Effects Y Y Y YYear*Quarter Fixed Effects Y Y Y YCounty Linear Time Trends Y Y Y YPatient Characteristics Y YPatient Medical Condition YPatient Fixed Effects Y
N 5,548,860 5,522,093 3,447,375 5,522,093R2 0.04 0.19 0.48 0.51
Notes: Column (1) replicates the first column of Table 8, while columns (2) and (3) control for changes to the composition of the sample ofhospital visits. Column (2) controls for a patient fixed effect and column (3) controls for the patient’s medical condition. Patient medical conditionincludes (1) the number of diagnoses on record, (2) the number of comorbidities on the record, (3) whether the visit was a nonemergency, and(4) whether the visit was preventable. Regressions also control for county fixed effects, year*quarter fixed effects, county-linear time trends, andpatient characteristics (gender, age, race, ethnicity). Standard errors are clustered at the county-level and are reported in parentheses. +p < 0.10,*p < 0.05, **p < 0.01, ***p < 0.001
52