how do firms combine different internationalisation modes? a multivariate probit approach
TRANSCRIPT
ORI GIN AL PA PER
How do firms combine different internationalisationmodes? A multivariate probit approach
Pinuccia Calia • Maria Rosaria Ferrante
Published online: 28 August 2013
� Kiel Institute 2013
Abstract Most of the literature on the relationship between firm’s participation in
international markets and firm heterogeneity focuses on export and foreign direct
investment. This paper considers a wider range of forms of internationalisation that
firms could combine into different patterns. With the purpose of analysing the
selection of heterogeneous firms into different internationalisation patterns, we
jointly model the decisions on the forms of internationalisation through a multi-
variate probit. This model allows us to avoid any a priori assumption about the
firm’s behaviour. In this context we study the complementarity/substitutability
relationships between forms of internationalisation. The results obtained show that:
(i) neglecting some forms could lead to an incomplete representation about the
firm’s internationalisation strategy, (ii) different firm’s characteristics influence the
choice of internationalisation pattern, i.e. some types of firm are more prone to
choosing one type of process over another, (iii) complementarity between forms of
internationalisation seems to be preferred over substitution, but some heterogeneity
also arises in this context.
Keywords Forms of internationalisation � Firm heterogeneity � Complementarity/
substitutability relationship � Multivariate choice model � Maximum
simulated likelihood
JEL Classification C35 � F13 � F23 � L24
P. Calia � M. R. Ferrante (&)
Department of Statistics, University of Bologna, Via Belle Arti, 41, 40126 Bologna, BO, Italy
e-mail: [email protected]
P. Calia
e-mail: [email protected]
123
Rev World Econ (2013) 149:663–696
DOI 10.1007/s10290-013-0162-5
1 Introduction
In the last decade, international trade has become one of the fastest growing
economic activities worldwide. This remarkable expansion of firms across national
borders has stimulated new theoretical developments and a considerable amount of
empirical literature, emphasising the role of firm heterogeneity in decisions relating
to the internationalisation process (for a review, see Greenaway and Kneller 2007,
and Wagner 2007, 2012).
The literature mainly focuses on forms of internationalisation such as export and
foreign direct investments (FDI) but, in the last decades, offshoring (for a review see
Wagner 2011) and non-equity forms of internationalisation have experienced a
rapid growth (Chen 2003; Palmberg and Pajarinen 2005). Besides it has been
observed that industrialised countries, in addition to the offshoring of materials, also
engage in the international outsourcing of services (Amiti and Wei 2005, 2006). In
other words, alongside the more traditional forms of internationalisation, a firm
deciding on its internationalisation process may adopt other forms of international
activity, such as strategic alliances, commercial penetration, cooperative agreements
and service outsourcing.
Despite the complexity of firm internationalisation patterns in the age of
globalization, in the literature on internationalisation we find a limited number of
empirical studies that have attempted to jointly consider a broader set of forms of
internationalisation beyond export.1
In terms of the econometric tools used to jointly model firm internationalisation
choices, multiple-choice models (ordered or unordered) have generally been used.
Benfratello and Razzolini (2009) adopt a multinomial logit model for the categories
of ‘‘no internationalisation’’, ‘‘only export’’ and ‘‘export plus horizontal FDI’’ so
they accumulate two categories by excluding the ‘‘only horizontal FDI’’ one. Also
Bougheas and Gorg (2008) estimate a multinomial logit model for the categories of
‘‘export’’, ‘‘international outsourcing of production’’ and ‘‘ownership of foreign
plant’’ by excluding some combination of them from the analysis. Basile et al.
(2003) consider the categories ‘‘export’’, ‘‘export and penetration operations’’, and
‘‘export, penetration operations and FDI’’, by modelling them with a univariate
ordered probit, thereby assuming that the three categories are ordered and that the
internationalisation process is cumulative. Recently, Oberhofer and Pfaffermayr
(2012) use a bivariate probit to model the choice between export and FDI. In the real
world, the set of choices available to a firm consist of ‘‘no internationalisation’’ and
of all the possible combinations of different internationalisation modes (where
combinations can be defined by considering two modes, three modes, and so on).
For example, if we consider modes as being export, penetration operations and FDI,
and for each mode we denote the ‘‘absence’’/‘‘presence’’ categories respectively
with 0 and 1 codes, a firm can choose the following patterns: (a) (0,0,0), indicating a
domestic firm, (b) (1,0,0) denoting firms performing only export, (c) (1,1,0)
characterising firms jointly performing export and penetration operations, and so on
1 See Basile et al. (2003); Benfratello and Razzolini (2009); Castellani and Zanfei (2007); Tomiura
(2007); Bougheas and Gorg (2008); Oberhofer and Pfaffermayr (2012).
664 P. Calia, M. R. Ferrante
123

until the category (1,1,1) that denotes firms performing all the modes considered. In
this context, choices are exhaustive and mutually exclusive and the firm chooses
only one combination of the whole set of modes available: the one that maximises
its profit function. Multiple-choice models as multinomial logit or probit become
cumbersome when a large number of forms of internationalisation is considered,
because the different forms can be combined and each combination defines a choice
representing a category of the outcome variable. Note that the number of possible
combinations to be modelled for the example presented above is equal to 9, but this
number quickly increases with the number of internationalisation modes considered
(i.e. 4 modes results in 16 choices). The solution adopted in the above-mentioned
empirical literature in order to limit the number of choices to be modelled, consists
in disregarding the information about some forms of internationalisation, or in
formulating an a priori selection of the combination of forms to be considered. The
only exception is Oberhofer and Pfaffermayr (2012): the bivariate probit can predict
all patterns of internationalisation that arise from export and FDI.
Turning to the dimensions defining the heterogeneity of firms, the literature has
largely focused on productivity. Recently, the role of other characteristics of firms
besides productivity have been stressed, including innovative behaviour, proprietary
assets, skill composition, organisational choices, accumulation of technology
(Helpman 2006).
This paper contributes to explanations of the nature of firm internationalisation
processes and of their connection to firm heterogeneity in two ways.
Firstly, to better represent the behaviour of firms, we consider a wide range of
forms of internationalisation, adding to the more traditional export modes such as
commercial penetration operations and agreements, the offshoring of production
and the outsourcing of services abroad. In this framework, we illustrate the
relevance of considering a pattern of choices that is as wide as possible in the study
of firm internationalisation strategy. We show that neglecting some choices can lead
to a partial description.
Secondly, in order to take into account the entire set of available combinations of
different forms of internationalisation and the relationships between them, we
analyse the complexity of internationalisation processes in a multivariate frame-
work. To this end, we use a multivariate probit model (MVP) that provides us with
some advantages compared to other discrete choice models already used in the
literature. In this light, our approach is similar to that taken by Oberhofer and
Pfaffermayr (2012). These authors consider two forms of internationalisation and
the resulting model is estimated with standard techniques. In the MVP model, every
internationalisation mode corresponds to a binary choice (yes/no) and an equation is
specified for each of them. In this way the number of outcome variables considered
corresponds to the number of modes, and the simultaneous choice of some modes
can be addressed through joint probabilities. At the same time, we do not need to
establish an order within the patterns of internationalisation or to exclude some
patterns from the analysis in order to limit the number of choices to be modelled.
We draw directly from predictions about how different internationalisation options
are associated and how these patterns combine with the various dimensions of firm
heterogeneity. Besides, different binary choices are modelled jointly through
A multivariate probit approach 665
123
correlations between disturbances, and this improves model estimates when
correlations are significantly different from zero. In addition, we highlight how
predictions are sensitive to the set of forms of internationalisation included in the
estimated model. By exploiting the output produced by the estimation of the MVP
model, which includes the estimated joint and conditional probabilities and their
connection with the covariates, we can address the question of complementarity
versus substitutability relationships between internationalisation modes, even if we
are limited to a simplified setting where the host market features are overcome. We
can also highlight which types of firm are more prone to choosing one type of
strategy over another.
For our analysis, we rely on data for years 2001–2003 provided by a sample
survey on Italian manufacturing firms with more than ten employees conducted
every 3 years by Capitalia Observatory,2 a very rich micro-level dataset that
includes information about various forms of international involvement. We use a
large range of covariates besides productivity to describe the heterogeneity of firms.
The paper is organised as follows: in Sect. 2 we provide a review of the literature
on the international involvement of firms; Sect. 3 presents the MVP model; Sect. 4
contains a description of the data and some descriptive statistics; Sect. 5 describes
the model specification; in Sect. 6, we present the model estimates and the results
concerning the relationship between heterogeneity and internationalisation patterns;
and Sect. 7 concludes.
2 A review of the theoretical and empirical literature
In his pioneering paper, Melitz (2003) builds a dynamic theoretical industry model
that considers the interaction between the heterogeneity of firms within the same
industry and export. Helpman et al. (2004) extend the Melitz model, highlighting
that only the most productive firms engage in foreign activity and that, among firms
that serve the foreign market, only the most productive engage in FDI. An extensive
stream of empirical literature has grown from these theoretical developments,
testing the relationship between internationalisation modes and firm heterogeneity,
with the latter typically represented by productivity. A number of studies show a
ranking of performance indicators across firms internationally involved and firms
serving only domestic markets (Head and Ries 2003; Helpman et al. 2004; Girma
et al. 2004, 2005, Greenaway and Kneller 2007). This literature focuses almost
exclusively on export and offshoring (mainly realised through FDI). For other forms
of international activity, empirical evidence is available to a much lesser extent
(Wagner 2010), whereas the study of the whole set of different options available to
firms would be essential to fully understand the behaviour of firms that operate in
the global market.
In the following, we briefly review the literature where, besides the most
frequently analysed export and FDI, other forms of internationalisation have been
considered and we mainly focus on the few studies that deal with the interaction
2 Capitalia was one of the largest Italian banks. It was recently acquired by the Unicredit group.
666 P. Calia, M. R. Ferrante
123
between the different forms. Furthermore, we also illustrate, where present, the
main results obtained in these studies in terms of determinants of the various
internationalisation modes.
Barba Navaretti et al. (2011) report the results of a survey conducted in the
framework of the European Community FP7 project ‘‘European Firms In a Global
Economy’’ (EFIGE) and involving seven European countries. The authors, besides
FDI, consider international outsourcing, achieved through arm’s-length agreements
with companies located abroad. The empirical evidence shows that, in all countries,
the majority of firms choose only one of the two modes and the low percentage of
firms engaging in both modes varies from country to country (from 13 % in Austria
to 0 % in Hungary). The estimate of a linear probability model explaining the
choice between FDI and international outsourcing shows that firm size is a dominant
factor.
Basile et al. (2003) propose a ‘‘foreign expansion index’’, which, by assuming the
categories of ‘‘export’’, ‘‘export and penetration operations’’, and ‘‘export,
penetration operations and FDI’’, accumulates various internationalisation modes.
The most important factors explaining variations in the index, detected by
estimating a univariate ordered probit model, are: firm size, vertical and horizontal
relations with other firms, various types of innovation and firm location.
A theoretical model that allows for a wide set of alternative forms of
internationalisation is proposed in Bougheas and Gorg (2008). These authors
estimate a multinomial logit on some selected combinations of export, FDI and
international outsourcing, using, as covariates, labour productivity, whether or not
the firm performs R&D activity and whether or not it provides formal training. The
results obtained show that the choice only to export relative to a purely domestic
plant is not related to productivity, but otherwise is positively related to size, R&D
and to training. They also find that the choice of whether to engage in all three
activities simultaneously is positively related to all the considered covariates, as is
the choice of whether to engage in exporting and FDI, but not in outsourcing.
Besides, they find that the choice of exporting and outsourcing, but not FDI, with
respect to the domestic choice, is not related to productivity or training activity. The
results obtained also prove the disadvantages of neglecting some of the alternatives.
In a descriptive statistical framework, Tomiura (2007) compares the productivity
of firms realizing FDI, export, and international outsourcing and investigates the
complementarity between the various globalization modes. The obtained results
show that foreign outsourcers and exporters tend to be less productive than the firms
active in FDI or in multiple globalization modes but more productive than domestic
firms. These findings are robust even controlling for other firms characteristics.
Castellani and Zanfei (2007) analyse the relationship between firm performance
and internationalisation. They distinguish between domestic firms, exporters and
two types of multinational firms, those engaged in international production and
those that control only non-manufacturing activities in foreign markets. This latter is
considered to be a sort of intermediate category between export and the creation of
foreign manufacturing affiliates. Turning to the relationship between firm hetero-
geneity and internationalisation forms, results show that the highest productivity
premium and the highest R&D efforts and innovative performances characterize
A multivariate probit approach 667
123
firms with manufacturing activities abroad. However, multinationals with a lower
involvement in foreign markets, i.e. with only non-manufacturing activities abroad,
do show levels of productivity that are lower than those of multinationals with
manufacturing activities abroad, but are higher than those of exporters; innovation
does not differently characterize the internationalisation modes.
Grandinetti and Mason (2012) investigate the relationships between export, FDI,
international alliances and international outsourcing by assuming that the last three
internationalisation modes mentioned can be considered as a determining factor for
export performance. They find that, besides strategic and organizational covariates,
also FDI, alliances and outsourcing have a significant and positive effect on export
intensity (measured by the export sales ratio).
In the study of the variety of modes whereby firms can serve a foreign market, the
relationship of substitution versus complementarity between the various forms may
be addressed. Following the proximity-concentration trade-off paradigm (Brainard
1997) a firm tends to invest abroad when transport costs are high and economies of
scale are small. Helpman et al. (2004) develop a model where firms choose between
export and FDI, concluding that firms enter the international market with ‘‘light’’
and indirect forms of internationalisation, denoted by low sunk costs and by a low
international commitment. When firms are able to assume higher risks associated
with international activities, they abandon these indirect forms by substituting them
for forms requiring higher experience, investments and commitment. Summarizing,
the more productive firms substitute their export through FDI. The alternative
hypothesis of a complementary internationalisation process suggests that firms
gradually accumulate different and more demanding forms to enlarge their
international involvement. Another line of thought in the literature states that, in
a single-product setting, exports and FDI are substituted, whereas complementarity
refers to multi-product firms, and exports and FDI become positively correlated if
there are horizontal and vertical complementarities across product lines (Head and
Ries 2004; Helpman 2006). The hypothesis of substitutive versus complementary/
cumulative internationalisation processes has been explicitly addressed by Basile
et al. (2003) in an empirical framework. This study, to the best of our knowledge, is
the only one that, besides export and FDI, also considers penetration operations, as a
form of internationalisation midway between the polar cases. The result obtained
acts in support of a cumulative process.
In Oberhofer and Pfaffermayr (2012) the substitution/complementarity assump-
tion is evaluated by considering that the optimal model for a firm serving the foreign
market can differ between host countries. Distant markets, requiring higher
transportation costs, may be served through FDI, whereas small markets nearby tend
to be served through export. As generally happens in firm level data sets, they have
not information on which country ‘‘hosts’’ export so the empirical analysis evaluates
the influence of firm characteristics on the internationalisation strategy. The results
obtained show that the majority of firms tend to simultaneously adopt different
strategies. Nevertheless, they observe that an increase in productivity determines an
increase (decrease) in the probability of only investing abroad (exporting), and this
supports the substitution relationship.
668 P. Calia, M. R. Ferrante
123
3 A statistical model for internationalisation choices
To model the whole set of internationalisation forms we adopt a MVP, where a
binary choice (yes/no) corresponds to each internationalisation category depending
on a function of covariates specified through different equations and allowing the
simultaneity of internationalisation choices. MVP dates back to Ashford and
Sowden (1970) and it finds applications in the context of limited dependent variable
models and simultaneous equation models (Maddala 1983). Because a firm could
simultaneously pursue more than one mode of internationalisation, the main
advantage of this model is that we do not need to select a priori the
internationalisation patterns to be modelled. No restrictions on the structure of
relationships among alternatives (i.e. on correlations between disturbances) are
required in the MVP, whereas this kind of restriction is imposed in multiple-choice
models. Relationships among forms of internationalisation are modelled through
correlation parameters that have to be estimated. These correlations tell us if there
are unobserved factors, besides those explicitly considered, that simultaneously
affect different choices around foreign expansion. Further, the MVP model allows
the use of a different set of covariates for each alternative, whereas, in the ordered
probit model the covariate set is the same for each alternative.
Formally, considering M internationalisation categories for each observation,
there are M equations each describing a latent dependent variable which
corresponds to the observed binary outcome (the observation subscript has been
suppressed for notational convenience):
y�m ¼ b0mxm þ em m ¼ 1; . . .;M
ym ¼ 1 if y�m [ 0 and 0 otherwiseð1Þ
where xm is a vector of p covariates for the m-th equation (m = 1, …, M), b0m is the
corresponding vector of parameters, and e ¼ ½em�m¼1;...;M is the error term vector
distributed as multivariate normal, with a zero mean and variance–covariance
matrix V. The leading diagonal elements of V are normalised to one and the off-
diagonal elements are the correlations qmj ¼ qjm for m, j = 1,…, M and m = j. If
we assume that em are distributed independently and identically with a univariate
normal distribution, Eq. (1) defines M univariate probit models (UVP). The
assumption of the independence of the error terms means that information about the
firm’s choice of the mode of internationalisation does not affect the prediction of the
probability of choosing another mode of internationalisation for the same firm. If the
unobserved correlations among outcomes are ignored, each of the M equations in
(1) could be estimated separately by a UVP. However, neglecting correlations leads
to inefficient estimated coefficients and could produce biased results in significance
tests. In principle, a MVP is an extension of the standard bivariate probit to more
than two outcome variables. The practical obstacle to this extension is the evalu-
ation of higher-order multivariate normal integrals, an M-dimensional integral
without a closed analytical form (Greene 2003).
The probability of the observed outcomes for any observation is the joint
cumulative distribution UMðl ; XÞ; where UMð�Þ is the M-variate standard normal
A multivariate probit approach 669
123
cumulative distribution function with arguments l and X that vary with
observations; for each observation, l ¼ ðj1b01x1; j2b
02x2; . . .; jMb0mxMÞ are
upper integration points, jM are sign variables defined as jm ¼ 2ym � 1; being
equal to 1 or -1 depending on whether the observed binary outcomes equal 1 or 0,
and m = 1, …, M. Matrix X has constituent elements Xmj; where Xmm ¼ 1 and
Xmj ¼ Xjm ¼ jjjmqjm:
Recently, methods of producing quite accurate estimates of multivariate normal
integrals based on simulation have been proposed.3 The estimates of the equation
parameters and correlation terms are obtained through the simulated maximum
likelihood (SML) estimator which results by maximising the simulated log-
likelihood function (Hajivassiliou and Ruud 1994; Cappellari and Jenkins 2003,
2006):
~‘ ¼Xn
i¼1
log ~UMðli; XiÞ ð2Þ
where each individual term ~UMðli; XiÞ is a simulation of a multivariate normal
probability calculated using the Geweke–Hajivassiliou–Keane (GHK) simulator
(Borsch-Supan and Hajivassiliou 1993; Keane 1994) at each iteration of the max-
imisation process for a given value of the parameters.
One important hypothesis to test is that all cross-equation correlation coefficients
are simultaneously equal to zero. If this is the case, we could equivalently fit
M independent univariate probits for each form of internationalisation. On the
contrary, if the null hypothesis is rejected, fitting M independent probits leads to
unbiased but not efficient estimates. A correlation coefficient between a pair of
choices different from zero, after controlling for firm characteristics, indicates that
there are unobserved factors affecting both choices.
4 The data
The data come from the 9th wave (covering the years 2001–2003) of the ‘‘Survey on
manufacturing firms’’ conducted every 3 years by the Capitalia Observatory.4 The
survey has a long history dating back to 1968.
The target population consists of Italian manufacturing firms with more than ten
employees; firms with more than 500 employees are sampled in entirety whereas
firms with less than 500 employees are selected on the basis of a sample. In order to
guarantee representativeness the sample is stratified by five classes of size (based on
the number of employees), four classes of activity sector (defined by the Pavitt
classification), and two classes of geographical location (North, Centre-South). The
size and the composition of the sample for firms with less than 500 employees are
obtained by the Neyman allocation using as auxiliary variable the mean value added
in the stratum in the year 2001. Capitalia ensures the accuracy of survey data in
3 See Greene (2003) for a brief textbook exposition.4 ‘‘Survey on Italian Enterprises. Report on the productive system and industrial policy’’, Observatory on
Small and Medium Enterprises, Capitalia, IX Report, 2005 (in Italian).
670 P. Calia, M. R. Ferrante
123

several ways: pilot surveys are realized in order to verify the accuracy of the
planned survey methods, a sub-sample of firms is re-interviewed with the aim of
checking the reliability of collected data, checks of logical and internal coherence of
data are performed, correction for missing data arising from total and partial non-
responses is adopted. Detailed information on the survey and on the sample design
are presented on a report published by Capitalia. The sample consists of 4,289 firms.
The survey data are linked to firm’s balance sheet data for each year of the period
2001–2003 covered by the survey, available for 3,450 firms.
The survey collects detailed quantitative and qualitative information on
ownership and businesses relationships, labour force, investments, innovation and
R&D, internationalisation, markets, and finance. Several studies with application in
different fields use data provided by the Capitalia survey.5 Moreover, since a wide
and detailed section of the questionnaire is devoted to internationalisation choices, a
number of paper focusing on different aspects of internationalisation of Italian firms
are based on this data set (among others, Antonietti and Cainelli 2008; Basile et al.
2003; Benfratello and Razzolini 2009; Sterlacchini 2001).
In order to identify the different modes that firms operate in the international
markets we follow the review of the empirical literature on firms’ foreign activities
presented by Crino (2009):
(a) export, EXP (y1);
(b) commercial penetration operations and agreements, COMM (y2), concerning
the set up of sales outlets abroad directly in charge of the firm, sales outlets in
charge of foreign local traders, sales outlets handled by foreign firms
belonging to the group, other promotional initiatives, and trade arrangements
with foreign firms;
(c) offshoring of production (or material offshoring), which relates to foreign
relocation of purely productive stages of intermediate or final goods, that can
take place through FDI or through arm’s length contracts with foreign
unaffiliated parties (as subcontracting, manufacturing contracts, licensing of
activities, etc.), OFFPROD (y3); data do not provide enough information to
distinguish between offshoring via FDI or through arm’s length contracts with
foreign unaffiliated parties (referred to in the literature as international
outsourcing).
(d) outsourcing of services abroad, which pertains to the acquisition of business
services, like transportation, insurance, communications, financial services,
computer-related services, R&D services, and engineering and design from
abroad, SERVOUT (y4).
In Table 6 of the ‘‘Appendix’’ we report the survey questions used to gather
information for the definition of the dependent variables.
Each variable, considered as binary choice (yes/no), is the dependent variables of
one out of four equations defining the MVP model. All the variables are measured
5 See Benfratello et al. (2008); Bianco and Nicodano (2006); Filatotchev et al. (2003); Hall et al. (2009);
Minetti and Zhu (2011); Parisi et al. (2006).
A multivariate probit approach 671
123

with reference to the time span 2001–2003, except for export which is measured at
2003.
The original sample size of 4,289 is reduced due to two reasons. Since we use a
measure of total factor productivity (TFP) as a covariate this imply conditioning
only on observations with accounting data (3,450 out of 4,289). Besides, because of
missing data on outcome variables and covariates, the final sample has 3,211 firms.
To evaluate the representativeness of the final sample, we compare the distributions
of the initial and the final sample by industry and size. Results (Table 7 in the
‘‘Appendix’’) show that distributions are sufficiently similar.
The estimated percentages of firms taking on each form of internationalisation
show that the majority of the firms export (69 %) and about the 31 % of them conduct
commercial penetration operations and agreements. The percentage of firms that take
on production offshoring is quite small, representing the 7 % of the total, the least-
chosen mode, whereas a larger portion of firms (12 %) outsources services abroad.
In order to verify the representativeness of the sample in terms of the percentage
of exporting firms, we also calculate the percentage of exporting manufacturing
firms with more than ten employees in the population combining information on
exporting firm’s population provided by the Italian Institute for Foreign Trade and
information in the Archive of Active Enterprises provided by the Italian Statistical
Institute (ISTAT 2004). We find a percentage of exporting firms equal to 65 %, a
value close to our estimate. These figures are consistent with those in Minetti and
Zhu (2011) who report a percentage of exporting firms for Italian manufacturing
firms with more than ten employees which ranges between 63 and 70 % for each
year between 1998 and 2005.
Summarizing, we conclude that the Capitalia survey can be considered
adequately representative of the population of firms with more than ten employees.
This does not mean that the sample is representative of the whole population of
Italian manufacturing firms since micro firms (with less than 10 employees) are
excluded from the target population. Consequently the results we present in this
paper cannot be generalised to the whole population of Italian manufacturing firms,
also considering that the number of micro firms is large in the Italian case.
The sampling distribution of the more frequently chosen patterns of internation-
alisation is reported in Table 1.
The first nine combinations (ordered by frequency) account for 98 % of all the firms.
Of these firms, 22 % do not engage in any form of internationalisation while 32 % are
only exporters. Firms exporting and conducting commercial penetration constitute
21 % of the firms and another 8 % have also outsourced services abroad. Other
combinations of modes of internationalisation are less frequent, but the majority of
them involve exporting. Under the category ‘‘Others’’ are combinations with a
frequency smaller than 1 % that, as a whole, accounts for about the 2.2 % of the firms.
5 The model specification
In this section we briefly discuss the choice of the covariates. Detailed definition of
outcome variables and covariates are reported in Tables 6 and 8 of the ‘‘Appendix’’.
672 P. Calia, M. R. Ferrante
123

Basic structural characteristics are size, economic activity, and geographical
location.6 Although it is believed that a firm should be large to compete in the global
market and the empirical evidence generally confirms this expectation, still some
results are no so clear cut. For example, limiting ourselves to the Italian case,
Sterlacchini (2001) finds a positive relation between export and size extending only
until an upper limit above which the size of a firm does not increase its export
propensity, while Basile et al. (2003) find that the effect of size is very small for
firms engaging in export, commercial penetration, and FDI and even negative for
firms engaging only in export. To account for different effects of the size level, we
use a five-class specification for the numbers of employees in the year 2003; the
same that is used for stratification in the sample design (classes are defined in
Table 7 of the ‘‘Appendix’’). In this way we control also for the different sampling
rates in the strata. The Pavitt classification,7 rather than the NACE-based industry
classification, is used in order to control for the sample design. However, the Pavitt
classification is meaningful itself because it identifies sectoral patterns of
technological change that are strongly industry-specific (Sterlacchini 2001). Four
dummies are used to indicate activity in the sectors Supplier dominated, Scale
intensive, Specialized suppliers, and Science based. We use four classes of
geographical location (North-West, North-East, Centre, South and Islands) and a
dummy for location in industrial districts. Evidence of a positive effect of the firm’s
location in an industrial district on export performance has been found in Becchetti
Table 1 Distribution of
pattern of internationalisation
y1 = EXP, y2 = COMM,
y3 = OFFPROD,
y4 = SERVOUT
y1, y2, y3, y4 Number Freq. Cum. percent
1 0 0 0 1,029 32.05 32.05
0 0 0 0 701 21.83 53.88
1 1 0 0 662 20.62 74.5
1 1 0 1 269 8.38 82.88
1 0 0 1 169 5.26 88.14
1 1 1 0 105 3.27 91.41
1 1 1 1 82 2.55 93.96
1 0 1 0 81 2.52 96.48
0 1 0 0 42 1.31 97.79
Others 71 2.21 100.00
Tot 3,211 100.00
6 Some authors (see, e.g. Aw and Lee 2008; Oberhofer and Pfaffermayr 2012) find that firm age have a
crucial role in explaining the firms decision to serve foreign markets. We also include, in a first exercise,
the age of the firm in the regressions together with the other covariates but its coefficient was never
significant. For this reason and because of the presence of missing data in this variable that should lead to
lost observations from our sample, we decide to not include it in our final model. As for other results in
our analysis (see next in the paper), the lack of any effect of firm age on the decision to serve foreign
market could have one possible explanation in the absence of micro-firms in our sample, which usually
are younger than larger firms.7 The Pavitt taxonomy is a classification of economic sectors based on technological opportunities,
innovations, R&D intensity, and knowledge. For details on categories, see Table 8 of the ‘‘Appendix’’.
A multivariate probit approach 673
123
et al. (2007). All structural variables are measured with reference to the end of year
2003.
Internationalisation is expected to be positively associated with an higher
proportion of skilled workers because it usually requires more white collar activities
or because of skill upgrading due to the offshoring of low-skill production activities
(Lipsey 2002). However, a negative sign may arise when the choice of offshoring or
outsourcing originates from the lack of in-house specialised skills or equipment
(Abraham and Taylor 1996). This variable is measured by the share of white collars
to total employment at 2003. We also consider an indicator of capital intensity (the
ratio of fixed assets to employment measured at 2003). As far as offshoring and
outsourcing are concerned, a negative association with capital intensity implies that
firms are more willing to outsource labour-intensive activities (Antonietti and
Cainelli 2008).
Foreign-owned firms are likely to be part of international networks and linked to
other affiliates overseas; this may facilitate the commercial penetration of
international markets as well as the outsourcing of services or production activities
(Girma et al. 2004, Cusmano et al. 2010). Foreign ownership is introduced as a
dummy variable which indicates whether one or more foreign subjects control the
company and own any share of its equity. Group membership might provide firms
with the necessary marketing and financial resources to internationalise (Sterlac-
chini 2001, Benfratello and Razzolini 2009). We define three dummies which
identify the membership to a business group depending on the firm’s position within
the group (leading, intermediate, subsidiary). By joining a consortium, partners are
able to exploit economies of scale and scope that cannot be pursued by individual
firms (Basile et al. 2003). A dummy is used to indicate whether a firm joins a
consortium.
The relationship with productivity has been already discussed in Sect. 2.
Different measures of the TFP have been used in literature depending on the amount
of available information. We adopt the approach proposed by Levinsohn and Petrin
(2003). The TFP is measured at the firm level by estimating a two factor Cobb–
Douglas production function separately for groups of industries defined by the
NACE (rev. 1) classification at two-digit level, with value added as output, total
costs of labour as labour input and the book value of fixed and intangible assets as
capital input. All variables are provided by balance sheets for years 2001, 2002 and
2003, and deflated by proper index numbers. Estimated firm-specific TFP is scaled
with respect to industry mean so that it provides a relative measure of how specific
firm TFP diverges from the average. We use TFP estimates at 2001 in order to
circumvent endogeneity problems in the model.
The literature has recently revealed the role of technological innovation in
improving exports and FDI (Castellani and Zanfei 2007). Basile et al. (2003) find
that innovative activities have positive effects on other forms of internationalisation
as well (commercial penetration and trade and technical agreement). We measure
innovative activity with different variables: a dummy for formal R&D expenditures
in the period 2001–2003, two dummies for innovation in products or processes
introduced during 2001–2003, a dummy for organisational innovation due to
product or process innovation introduced in the same time span, a dummy for
674 P. Calia, M. R. Ferrante
123
investment in information and communication technologies (ICT) during
2001–2003.8
Sample averages and standard deviations of covariates are reported in Table 9 of
the ‘‘Appendix’’ for each group of firms which engage in different forms of
internationalisation and for the group of domestic firms. For each group the sample
consists mainly of firms with less than 250 employees (the 80 % or more), located
in the North (the 57 % or more) and which operate in the supplier-dominated
(traditional) sectors (the 47 % or more). However we can point out some differences
between groups. In general, as expected, firms which operate in international
markets are larger, and more frequently than domestic firms invest in R&D (54 % or
more), ICT (72 % or more), innovate products (48 % or more) and process (46 % or
more). The percentages are smaller for exporter than for other forms of
internationalisation but still higher than for domestic firms. Moreover, foreign-
owned firms and members of business group are more frequent among offshoring
and outsourcing firms: even 13 % of foreign-owned firms for outsourcing and
47–48 % of members of business group for offshoring and service outsourcing.
Offshoring firms, as expected, have smaller capital intensity than domestic firms and
also compared to others forms of internationalisation. It is worthy to note that
among domestic firms we observe a greater frequency of firms operating in scale-
intensive sectors and a lower frequency of firms operating in specialized-supplier
sectors than among internationalised firms. Moreover, domestic firms have a higher
frequency of firms located in South. As far as TFP is concerned, average TFPs of
internationalised firms are greater compared to the average TFP of domestic ones.
6 Model estimates and results
6.1 Marginal probabilities
Correlation coefficient estimates (Table 10 in the ‘‘Appendix’’) are all positive and
significant and the hypothesis that all correlation coefficients are jointly equal to
zero is rejected.9 This confirms that the MVP model is a better specification than the
four distinct UVP for the observed data. A correlation coefficient different from
zero between a pair of choices means that there are unobservable factors affecting
both choices and reveals an association after controlling for firm characteristics.
After accounting for observable firm heterogeneity, a relevant positive correlation
between some pairs of choices still remains.
Results on estimated MVP coefficients are reported in Table 11 of the
‘‘Appendix’’. Distinct Wald tests for the hypothesis that all the coefficients in each
equation are jointly equal to zero reject the null hypothesis as well as the hypothesis
that the vectors of coefficients are equal across the four equations.
8 The survey collects data on the amount of R&D expenditures and investment in ICT, but we did not use
them due to the large amount of missing data.9 The model has been estimated using STATA (version 9) ml command, with a self-supplied code for the
log-likelihood calculation, and the modules mdraws and mvnp developed by Cappellari and Jenkins
(2006).
A multivariate probit approach 675
123
We summarise the results by focusing on the marginal effects (MEs) on marginal
probabilities for each dependent variable (Table 2). In other words, we consider the
probability of choosing each internationalisation mode, irrespective of the choice of
the remaining modes. Each ME represents the change in probability of success
given a one-unit change in the associated regressor (a change from zero to one for
binary variables). For the m-th equation and the k-th continuous covariate, the
marginal effect is calculated using oEðymjxmkÞ=oxmk ¼/ b0mxm
� �bmk at mean values
for the covariates (Greene 2003). For the k-th binary variable, the difference Pðym ¼1jxmk ¼ 1Þ � Pðym ¼ 1jxmk ¼ 0Þ is calculated holding all other covariates constant
at mean values.10 Here, bmk is the coefficient estimate of the covariate xmk from the
mode-type m equation, and /ð�Þ is the probability density function of a standard
normal distribution with zero mean and unit variance. In the following we refer to
marginal effects as marginal effects at the mean (MEM).
The first row of Table 2 reports the estimated predicted probability (henceforth
PPR) at mean values of the covariates. The probability for each internationalisation
mode generally increases with size.11 The Pavitt sector has significant associations
with export, commercial penetration, and the offshoring of production. Specialised
suppliers are those that mostly export and carry out commercial penetration, while
firms in the supplier-dominated sector (which comprises ‘‘traditional’’ industries)
choose offshore production more frequently than others. It may be argued that firms
in the traditional sectors resort to offshoring in their attempts to reduce production
costs. Scale-intensive firms are less likely to engage in any form of internation-
alisation. There are not significant differences across geographical areas in the
probability of participation in international markets except for commercial
penetration operation and firms located in the South of Italy, more than others,
venture commercial penetration abroad. However, it may happen that the variable
defining the location in an industrial district captures some of the geographical
variability, because most of the districts are located in the North.12 The share of
skilled workers is significantly and positively associated with all internationalisation
modes. Results confirm previous findings that firms located in industrial districts
export more than others, but we do not find significant associations with other
internationalisation modes. Group membership is associated with the internation-
alisation process, but this relationship depends on the firm’s position in the group.
Leading firms in a group have a greater probability of performing commercial
penetration and engaging in offshoring. Firms in the intermediate position also have
10 Because marginal effects are a non-linear combination of model parameters, standard errors (not
reported) were estimated by the Delta method and significance was tested by a Wald test. Detailed results
are available from the authors upon request.11 To check the robustness of estimates to the specification of the size variable, we also estimate the
model using the number of employees instead of the four dummies for the size. The marginal effect (at
mean) of the size is positive and significant on each internationalization choice and increasing at different
level of size, as in the presented results. The sign of the other coefficients and MEMs are all confirmed.12 In a previous estimation exercise not reported here, with no industrial district indicator and a dummy
for investments in fixed capital instead of capital intensity, we found a strong positive association between
locations in the North of Italy and exports.
676 P. Calia, M. R. Ferrante
123
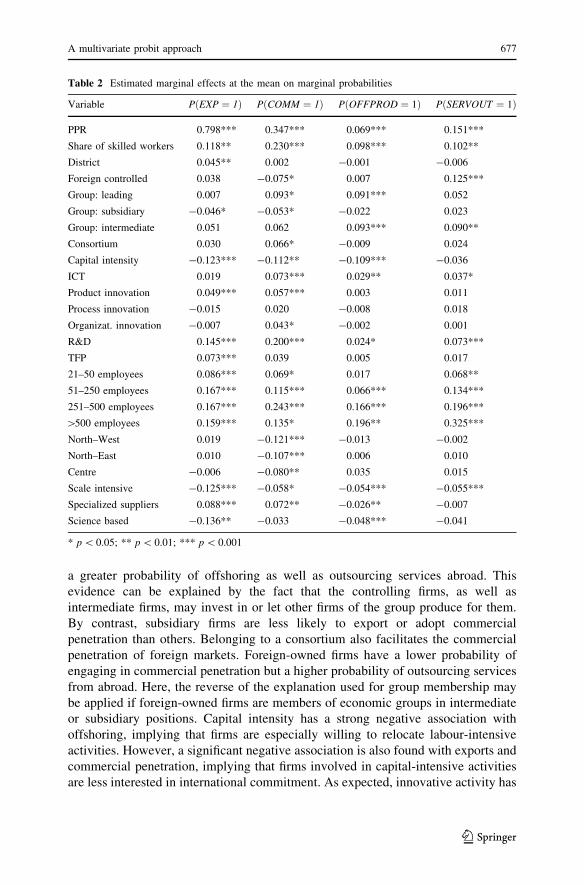
a greater probability of offshoring as well as outsourcing services abroad. This
evidence can be explained by the fact that the controlling firms, as well as
intermediate firms, may invest in or let other firms of the group produce for them.
By contrast, subsidiary firms are less likely to export or adopt commercial
penetration than others. Belonging to a consortium also facilitates the commercial
penetration of foreign markets. Foreign-owned firms have a lower probability of
engaging in commercial penetration but a higher probability of outsourcing services
from abroad. Here, the reverse of the explanation used for group membership may
be applied if foreign-owned firms are members of economic groups in intermediate
or subsidiary positions. Capital intensity has a strong negative association with
offshoring, implying that firms are especially willing to relocate labour-intensive
activities. However, a significant negative association is also found with exports and
commercial penetration, implying that firms involved in capital-intensive activities
are less interested in international commitment. As expected, innovative activity has
Table 2 Estimated marginal effects at the mean on marginal probabilities
Variable P EXP ¼ 1ð Þ P COMM ¼ 1ð Þ P OFFPROD ¼ 1ð Þ P SERVOUT ¼ 1ð Þ
PPR 0.798*** 0.347*** 0.069*** 0.151***
Share of skilled workers 0.118** 0.230*** 0.098*** 0.102**
District 0.045** 0.002 -0.001 -0.006
Foreign controlled 0.038 -0.075* 0.007 0.125***
Group: leading 0.007 0.093* 0.091*** 0.052
Group: subsidiary -0.046* -0.053* -0.022 0.023
Group: intermediate 0.051 0.062 0.093*** 0.090**
Consortium 0.030 0.066* -0.009 0.024
Capital intensity -0.123*** -0.112** -0.109*** -0.036
ICT 0.019 0.073*** 0.029** 0.037*
Product innovation 0.049*** 0.057*** 0.003 0.011
Process innovation -0.015 0.020 -0.008 0.018
Organizat. innovation -0.007 0.043* -0.002 0.001
R&D 0.145*** 0.200*** 0.024* 0.073***
TFP 0.073*** 0.039 0.005 0.017
21–50 employees 0.086*** 0.069* 0.017 0.068**
51–250 employees 0.167*** 0.115*** 0.066*** 0.134***
251–500 employees 0.167*** 0.243*** 0.166*** 0.196***
[500 employees 0.159*** 0.135* 0.196** 0.325***
North–West 0.019 -0.121*** -0.013 -0.002
North–East 0.010 -0.107*** 0.006 0.010
Centre -0.006 -0.080** 0.035 0.015
Scale intensive -0.125*** -0.058* -0.054*** -0.055***
Specialized suppliers 0.088*** 0.072** -0.026** -0.007
Science based -0.136** -0.033 -0.048*** -0.041
* p \ 0.05; ** p \ 0.01; *** p \ 0.001
A multivariate probit approach 677
123

a strong and positive association with internationalisation. The probability of
exporting is greater for firms investing in research and development and producing
innovative products. Effects on the probability of engaging in commercial
penetration are even higher: plus 20 % points for firms investing in R&D, plus
about 5 % points for firms producing innovative products and introducing
innovations in organisation, plus 7 % points for firms investing in ICT. Firms
investing in R&D and ICT also have a greater probability of offshoring and
outsourcing services. This may suggest that offshoring is also carried out by firms
whose core activity is not producing innovative products, but who wish to improve
their competitiveness by reducing production costs in low-wage countries. TFP is
found to be significantly and positively associated only with export.13 This last
result seems surprising in view of the recent empirical evidence of significant
productivity differentials between domestic firms, exporters and multinational firms,
so we expect that the higher the productivity, the greater the commitment to
international activity. We have to stress, however, that each marginal probability
evaluates the choice of participating versus not participating in international
markets by means of a specific form. Because productivity does not significantly
affect the chance of offshoring (neither of outsourcing or commercial penetration)
this means that, for example, offshoring firms are not more productive than non-
offshoring firms, but it may be the case that firms not offshoring are still
internationally involved in some way. On the other hand, exporting firms are more
productive than non-exporting firms, but the latter may be not involved at all in
international markets. We will come back to this point in the next section.
Nevertheless, the weak impact of the TFP could also be explained by missing of
micro-firms in the sample, expected to be less productive and more likely to serve
the domestic market only. Furthermore, less productive firms are more likely to exit
the market but we can not control for market exit due to the lack of this information
in our data.
6.2 Comparing marginal and joint probabilities: the ‘‘added value’’ of the MVP
The advantage of the MVP model over the UVP is that it allows us to better evaluate
the relationships between internationalisation forms, taking into account the
correlations between participation decisions via unobservable factors. To give a
reasonable base for comparing the estimated relationships using the MVP model
relative to the UVP approach, we estimate a UVP model for each of the four
international participation modes.
In Table 3 we compare marginal and some joint probabilities predicted by the
MVP and UVP models. The joint probabilities for the latter are obtained as the
product of the estimated marginal probabilities. While we obtain similar predictions
for marginal probabilities from MVP and UVP, we observe different predictions for
most of the joint probabilities. For instance, the predicted probability for not
13 In order to check the robustness of this result for TFP, we use a Tornquist-type index number to
measure the firm’s TFP (Caves et al. 1982) an approach already used in the context of analysis of firms’
internationalization (Delgado et al. 2002; Girma et al. 2005). We re-estimate the model by using this TFP
measure: coefficient does not change sensibly and its significance does not change at all.
678 P. Calia, M. R. Ferrante
123

participating in international markets is 17 % using MVP, as against 10 % by the
UVP model. Furthermore, predicted joint probabilities using MVP are closer to the
observed probabilities reported in Table 1 than those predicted using the UVP
model.
To further highlight the extra insight provided by the MVP model and the
relevance of simultaneously considering the whole set of choices faced by firms, we
show that the MEMs of an explanatory factor can also be very different for marginal
and joint probabilities.
We discuss this point comparing the marginal probability of exporting,14 reported
in Table 2, with the probability of exporting considered jointly with other
internationalisation channels (see Table 4 and description in Sect. 6.3).
As can be seen, the estimated MEMs are quite different. Comparing the marginal
probability of exporting in Table 2 with columns B–F in Table 4, representing
probabilities of exporting considered jointly with different sets of alternatives, we
see that the MEM of many covariates change significance and even sign. The
proportion of skilled workers, product innovation, investment in R&D, size, and
even productivity have a significant positive association with the marginal
probability of exporting, but their effect is very different depending on whether
the firms’ participation in international markets through other channels is considered
or not. While exporting firms as a whole are larger, have more skilled workers, and
Table 3 Predicted marginal and joint probabilities by UVP and MVP model
UVP MVP
Coefficient SE Coefficient SE
P(EXP = 1) 0.7978*** 0.0081 0.7975*** 0.0081
P(COMM = 1) 0.3471*** 0.0090 0.3474*** 0.0089
P(OFFPROD = 1) 0.0682*** 0.0051 0.0687*** 0.0051
P(SERVOUT = 1) 0.1514*** 0.0069 0.1509*** 0.0068
A: P(0000) 0.1044*** 0.0050 0.1707*** 0.0073
B: P(1000) 0.4119*** 0.0077 0.3878*** 0.0098
C: P(1100) 0.2189*** 0.0065 0.2213*** 0.0769
D: P(1101) 0.0391*** 0.0023 0.0744*** 0.0050
E: P(1001) 0.0735*** 0.0034 0.0514*** 0.0040
F: P(1111) 0.0029*** 0.0003 0.0099*** 0.0015
A : PðEXP ¼ 0; COMM ¼ 0; OFFPROD ¼ 0; SERVOUT ¼ 0ÞB : PðEXP ¼ 1; COMM ¼ 0; OFFPROD ¼ 0; SERVOUT ¼ 0ÞC : PðEXP ¼ 1; COMM ¼ 1; OFFPROD ¼ 0; SERVOUT ¼ 0ÞD : PðEXP ¼ 1; COMM ¼ 1; OFFPROD ¼ 0; SERVOUT ¼ 1ÞE : PðEXP ¼ 1; COMM ¼ 0; OFFPROD ¼ 0; SERVOUT ¼ 1ÞF : PðEXP ¼ 1; COMM ¼ 1; OFFPROD ¼ 1; SERVOUT ¼ 1Þ* p \ 0.05; ** p \ 0.01; *** p \ 0.001
14 The estimates of MEMs referred to the remaining probabilities are available from the author upon
request.
A multivariate probit approach 679
123
Ta
ble
4E
stim
ated
mar
gin
alef
fect
sat
the
mea
non
sele
cted
join
tpro
bab
ilit
ies
Var
iab
leA
BC
DE
F
PP
R0
.170
7*
**
0.3
87
8*
**
0.2
21
3*
**
0.0
74
4*
**
0.0
51
4*
**
0.0
09
9*
**
Sh
are
of
skil
led
wo
rker
s-
0.1
20
3*
**
-0
.15
55
***
0.0
90
7*
0.0
68
8*
*0
.004
60
.02
50
***
Dis
tric
t-
0.0
33
8*
0.0
36
2*
0.0
09
2-
0.0
01
6-
0.0
00
1-
0.0
00
4
Fo
reig
nco
ntr
oll
ed-
0.0
35
50
.01
18
-0
.089
7*
**
0.0
30
60
.074
9*
**
0.0
05
5
Gro
up
:le
adin
g-
0.0
26
4-
0.1
01
7*
**
0.0
04
30
.023
00
.000
40
.01
92
***
Gro
up
:su
bsi
d.
0.0
40
0*
-0
.00
19
-0
.043
2*
*0
.003
10
.016
3-
0.0
02
6
Gro
up
:in
term
.-
0.0
56
7*
-0
.07
08
*-
0.0
22
00
.035
2*
0.0
21
20
.02
32
***
Con
sort
ium
-0
.029
9-
0.0
27
90
.040
60
.022
60
.001
70
.00
10
Cap
ital
inte
nsi
ty0
.121
6*
**
0.0
24
7-
0.0
46
7-
0.0
21
9-
0.0
00
1-
0.0
14
4*
**
ICT
-0
.027
7*
-0
.06
09
**
0.0
28
60
.022
7*
*0
.003
60
.00
63
***
Pro
du
ctin
no
v.
-0
.079
2*
**
-0
.00
63
0.0
67
3*
**
0.0
23
2*
*-
0.0
02
10
.00
32
Pro
cess
inno
v.
0.0
09
8-
0.0
28
50
.005
20
.010
70
.003
70
.00
02
Org
aniz
at.
inno
v.
0.0
02
7-
0.0
36
60
.028
30
.007
5-
0.0
05
70
.00
04
R&
D-
0.1
35
0*
**
-0
.06
30
***
0.1
13
1*
**
0.0
61
0*
**
0.0
05
60
.01
03
***
TF
P-
0.0
58
3*
**
0.0
15
80
.026
60
.014
10
.004
40
.00
24
21
–50
emp
loyee
s-
0.0
77
0*
**
-0
.01
49
0.0
20
40
.040
0*
*0
.020
8*
0.0
07
4*
51
–25
0em
plo
yee
s-
0.1
51
3*
**
-0
.02
78
0.0
18
00
.069
9*
**
0.0
40
1*
**
0.0
20
1*
**
25
1–5
00
emp
loyee
s-
0.1
47
2*
**
-0
.15
30
***
0.0
21
10
.106
5*
**
0.0
21
00
.06
62
***
[5
00
emp
loyee
s-
0.1
41
2*
**
-0
.15
47
***
-0
.089
1*
*0
.112
2*
*0
.085
8*
*0
.08
57
**
No
rth
–W
est
-0
.004
90
.10
41
***
-0
.074
3*
**
-0
.017
40
.018
7-
0.0
03
4
No
rth
–E
ast
-0
.002
00
.07
38
**
-0
.076
4*
**
-0
.013
00
.020
2-
0.0
00
2
Cen
tre
0.0
05
20
.02
83
-0
.069
4*
*-
0.0
11
40
.015
30
.00
38
Sca
lein
ten
siv
e0
.113
2*
**
-0
.01
43
-0
.015
0-
0.0
27
0*
**
-0
.017
4*
*-
0.0
09
3*
**
680 P. Calia, M. R. Ferrante
123

Ta
ble
4co
nti
nu
ed
Var
iab
leA
BC
DE
F
Sp
ecia
lize
dsu
ppli
er-
0.0
69
8*
**
0.0
28
30
.073
2*
**
0.0
12
0-
0.0
07
0-
0.0
02
7
Sci
ence
bas
ed0
.114
1*
*-
0.0
48
7-
0.0
09
2-
0.0
17
9-
0.0
14
9-
0.0
07
4*
**
A:
PðE
XP¼
0;
CO
MM¼
0;
OF
FP
RO
D¼
0;
SE
RV
OU
T¼
0Þ
B:
PðE
XP¼
1;
CO
MM¼
0;
OF
FP
RO
D¼
0;
SE
RV
OU
T¼
0Þ
C:
PðE
XP¼
1;
CO
MM¼
1;
OF
FP
RO
D¼
0;
SE
RV
OU
T¼
0Þ
D:
PðE
XP¼
1;
CO
MM¼
1;
OF
FP
RO
D¼
0;
SE
RV
OU
T¼
1Þ
E:
PðE
XP¼
1;
CO
MM¼
0;
OF
FP
RO
D¼
0;
SE
RV
OU
T¼
1Þ
F:
PðE
XP¼
1;
CO
MM¼
1;
OF
FP
RO
D¼
1;
SE
RV
OU
T¼
1Þ
*p\
0.0
5;
**
p\
0.0
1;
**
*p\
0.0
01
A multivariate probit approach 681
123
are more innovative and productive than firms not exporting (positive and
significant MEMs on marginal probability), the same is true only for exporting
firms which pursue other strategies (columns C–F), while firms that participate in
international markets only through export (column B) are smaller, have fewer
skilled workers, and do not innovate or invest in R&D. In particular, higher
productivity increases the (marginal) probability of exporting and decreases the
chance of not exporting, but does not affect either of the joint probabilities.
To summarise, these results show the advantages of adopting a multivariate
setting in analysing internationalisation strategies and that any conclusion
concerning patterns of internationalisation and their link with firm characteristics
depends on the set of internationalisation modes considered. Looking simulta-
neously at different forms of internationalisation allows us to understand the
relationships between the different modes of participation in international markets
and the influence of a firm’s characteristics on participation better than looking at
each internationalisation mode separately.
6.3 Firm heterogeneity and internationalisation strategies
Now, we turn to the multivariate part of the analysis. The estimate of a MVP
produces a very rich and informative output in terms of joint and conditional
probabilities and of the corresponding MEMs. In this section, we analyse the
selection of heterogeneous firms into different internationalisation patterns.
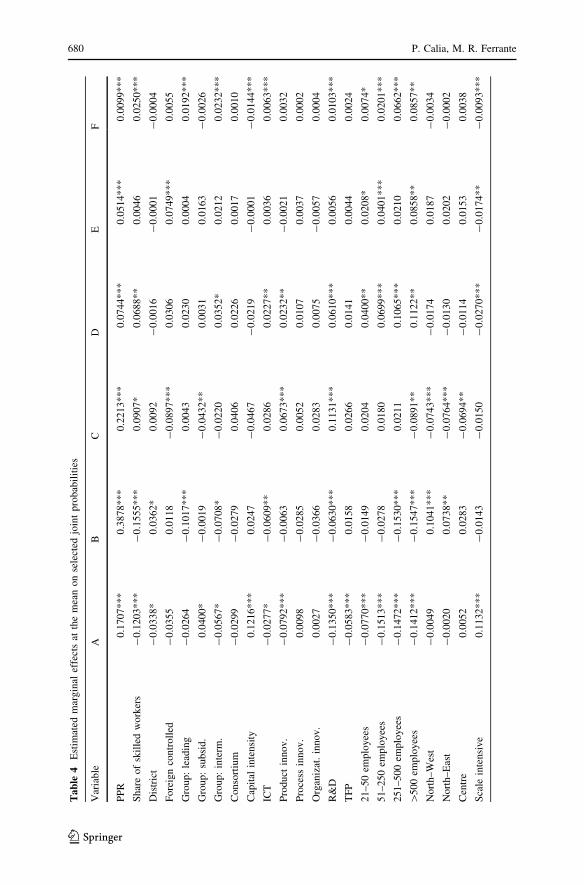
In Table 4 we report predicted joint probabilities (at mean values of covariates)
of the entire set of the internationalisation modes considered. We focus on the
patterns with the highest occurrence (sample frequency above 5 %). The last
column reports the probability of adopting the entire set of internationalisation
modes. We also present the corresponding MEMs.15
As expected, the PPRs are similar to the observed frequencies in the descriptive
analysis reported in Sect. 4. The estimated MEMs show that the covariates affect the
selection of firms into different internationalisation patterns. The probability of
being domestic (A) is greater for firms that have a smaller share of skilled workers,
are smaller in size, and do not belong to a district. Furthermore, innovating products
and investing in ICT and R&D reduce the probability of being domestic, whereas
this probability increases with capital intensity. Firms in scale-intensive and
science-based sectors are more likely to be domestic than specialised and traditional
firms. Subsidiary firms in a group have a higher probability to be domestic too.
Finally, as expected, less productive firms have a higher probability of being
domestic: this means that the most productive firms have a higher probability of
being internationally involved in some way.
15 Conditional and joint probabilities are highly nonlinear in both parameters and covariates, which
prevent a tractable analytical solution of MEMs and standard errors (SEs) that are then calculated using
simulation and numerical gradients. In particular, we simulate 500 sets of parameters from an asymptotic
multivariate normal distribution, each time calculating the predicted probability, and its numerical
derivatives with respect to the relevant covariates evaluated at the means of all covariates. We thereby
obtain 500 sets of PPR and MEMs, and sample SEs are calculated as estimates of the SEs for the PPR and
MEMs.
682 P. Calia, M. R. Ferrante
123
Only exporters (B) are similar to domestic firms in many respects: the MEMs of
the proportion of skilled workers, firm size, ICT and R&D show the same sign in A
and B. Yet, the chance of participating in international markets only through export
is higher for firms belonging to a district and located in the North, while it is lower
for leading firms in a group.
The probability of adopting both export and commercial penetration abroad
(C) is greater for firms with a higher proportion of skilled workers, which innovate
products and invest in R&D, for firms located in northern regions, and for foreign-
owned and subsidiary firms.
The probability of adopting export, commercial penetration, and the international
outsourcing of services (D) increases with size, proportion of skilled workers,
investment in ICT and R&D, and product innovation. Firms operating in scale-
intensive industries are less likely than other industries to adopt all three forms of
internationalisation.
The probability of both exporting and outsourcing services from abroad (E) is
higher for foreign-owned firms that are larger in size and located in the North, but it
is lower for firms operating in scale-intensive industries.
Finally, the probability of participating in international markets via all four
strategies (F) is greater for large firms with a larger proportion of skilled workers,
investing in ICT and R&D, and which are members of a group in a leading or
intermediate position. Firms with higher capital intensity and that belong to scale-
intensive or science-based industries are less likely to pursue all the internation-
alisation strategies than firms belonging to other sectors.
Summarizing, domestic and, to some extent, only exporting firms have, as
expected, a lower proportion of skilled workers and a smaller size. They do not
perform innovative activities, have higher capital intensity, and operate in the scale-
intensive and science-based sectors. Domestic firms are also less productive. Firms
engaging in export and commercial penetration differ from the groups described
above. They have a larger proportion of skilled workers, innovation and R&D
potential, and belong to a group in a leading or intermediate position. Firms
engaging in the outsourcing of services and export are most likely to be foreign-
owned, larger in size, and located in the northern region of the country. Finally,
firms with the most complex internationalisation patterns (which engage in export,
commercial penetration and outsourcing of services or in the whole set of choices
considered) are large firms that belong to a group in a leading or intermediate
position and operate in traditional or specialised-supplier sectors, investing in R&D
and in ICT, but with a lower capital intensity. Productivity lowers the probability of
being domestic but has no particular effects on the choice of any specific pattern of
internationalisation. It appears that productivity affects the choice between
remaining domestic or entering the international markets, but does not affect the
choice between the different internationalisation entry modes. This conclusion
agrees with the results in Sect. 6.2: non-exporting firms are generally domestic, i.e.
do not pursue any internationalisation strategy, whereas firms operating in
international markets are almost all exporting.
A multivariate probit approach 683
123
6.4 Complementarity/substitution of internationalisation modes
In this section we evaluate whether the relationship between internationalisation
strategies can be considered complementary or substitutive. As the available data
does not contain information about internationalisation modes for each foreign
outlet market, we cannot properly test the substitution/complementary assumption
in the sense highlighted by Oberhofer and Pfaffermayr (2012), illustrated in Sect. 2.
We focus on the probabilities of performing a given mode, conditional to whether
the firm performs one or more of the other modes, in a framework where the
differences between foreign markets is overcome.
We first compare the conditional probabilities of carrying out each internation-
alisation mode between exporters and non-exporters:
ðA) PðCOMM ¼ 1jEXP ¼ 1Þ � PðCOMM ¼ 1jEXP ¼ 0Þ;ðBÞ PðSERVOUT ¼ 1jEXP ¼ 1Þ � PðSERVOUT ¼ 1jEXP ¼ 0Þ;ðC) PðOFFPROD ¼ 1jEXP ¼ 1Þ � PðOFFPROD ¼ 1jEXP ¼ 0Þ:
These differences can be regarded as the ‘‘treatment effects’’ (TE) of exporting on
the probability of participation in other internationalisation modes. Positive (neg-
ative) value means that exporting makes it more (less) likely to engage in other
internationalisation modes than not exporting. Hence, when the effect is positive,
we interpret this as evidence of complementarity versus the substitutability rela-
tionship between participation strategies (the opposite is true for negative values). In
the same way, we can also look at the TE of engaging in any, or all, of the other
strategies on the probability of offshoring:
ðD) PðOFFPROD ¼ 1jCOMM ¼ 1Þ � PðOFFPROD ¼ 1jCOMM ¼ 0ÞðEÞ PðOFFPROD ¼ 1jSERVOUT ¼ 1Þ � PðOFFPROD ¼ 1jSERVOUT ¼ 0ÞðFÞ PðOFFPROD ¼ 1jEXP ¼ 1; COMM ¼ 1Þ
� PðOFFPROD ¼ 1jEXP ¼ 0; COMM ¼ 0ÞðGÞ PðOFFPROD ¼ 1jEXP ¼ 1;COMM ¼ 1Þ
� PðOFFPROD ¼ 1jEXP ¼ 0; COMM ¼ 0ÞðHÞ PðOFFPROD ¼ 1jEXP ¼ 1; COMM ¼ 1; SERVOUT ¼ 1Þ
� PðOFFPROD ¼ 1jEXP ¼ 0; COMM ¼ 0; SERVOUT ¼ 0Þ:
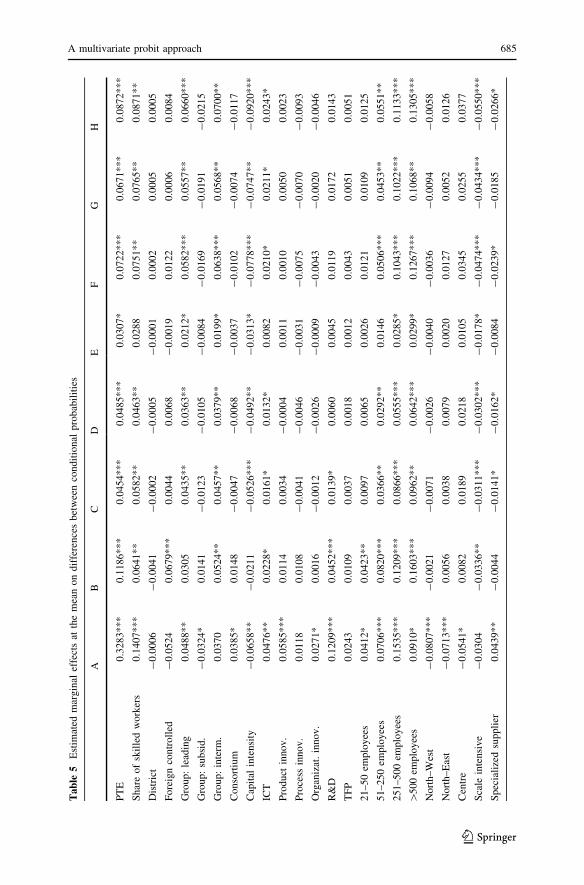
We consider the estimated MEMs of covariates on the TE above as well: a
covariate’s MEM measures the effect of the covariate on the difference in the
probability of adopting a specific internationalisation strategy between firms that
pursue other strategies and firms that do not. To explain the point, we refer to the TE
of exporting on the probability of offshoring (C) and first consider the MEM of
investing in R&D. The estimated MEM, significant and equal to 0.014, means that
the TE of exporting on the probability of offshoring is greater (by 1.4 % points) for
firms that invest in R&D than for firms that do not invest in R&D. As result, firms
that invest in R&D are more likely, compared to firms not investing, to complement
export and offshoring instead of substituting offshoring for export. In contrast,
684 P. Calia, M. R. Ferrante
123
Tab
le5
Est
imat
edm
argin
alef
fect
sat
the
mea
non
dif
fere
nce
sbet
wee
nco
ndit
ional
pro
bab
ilit
ies
AB
CD
EF
GH
PT
E0
.32
83
***
0.1
18
6*
**
0.0
45
4*
**
0.0
48
5*
**
0.0
30
7*
0.0
72
2*
**
0.0
67
1*
**
0.0
87
2*
**
Sh
are
of
skil
led
wo
rker
s0
.14
07
***
0.0
64
1*
*0
.05
82
**
0.0
46
3*
*0
.028
80
.07
51
**
0.0
76
5*
*0
.087
1*
*
Dis
tric
t-
0.0
00
6-
0.0
04
1-
0.0
00
2-
0.0
00
5-
0.0
00
10
.00
02
0.0
00
50
.000
5
Fo
reig
nco
ntr
oll
ed-
0.0
52
40
.067
9*
**
0.0
04
40
.006
8-
0.0
01
90
.01
22
0.0
00
60
.008
4
Gro
up
:le
adin
g0
.04
88
**
0.0
30
50
.04
35
**
0.0
36
3*
*0
.021
2*
0.0
58
2*
**
0.0
55
7*
*0
.066
0*
**
Gro
up
:su
bsi
d.
-0
.03
24
*0
.014
1-
0.0
12
3-
0.0
10
5-
0.0
08
4-
0.0
16
9-
0.0
19
1-
0.0
21
5
Gro
up
:in
term
.0
.03
70
0.0
52
4*
*0
.04
57
**
0.0
37
9*
*0
.019
9*
0.0
63
8*
**
0.0
56
8*
*0
.070
0*
*
Co
nso
rtiu
m0
.03
85
*0
.014
8-
0.0
04
7-
0.0
06
8-
0.0
03
7-
0.0
10
2-
0.0
07
4-
0.0
11
7
Cap
ital
inte
nsi
ty-
0.0
65
8*
*-
0.0
21
1-
0.0
52
6*
**
-0
.049
2*
*-
0.0
31
3*
-0
.07
78
***
-0
.074
7*
*-
0.0
92
0*
**
ICT
0.0
47
6*
*0
.022
8*
0.0
16
1*
0.0
13
2*
0.0
08
20
.02
10
*0
.021
1*
0.0
24
3*
Pro
du
ctin
no
v.
0.0
58
5*
**
0.0
11
40
.00
34
-0
.000
40
.001
10
.00
10
0.0
05
00
.002
3
Pro
cess
inn
ov
.0
.01
18
0.0
10
8-
0.0
04
1-
0.0
04
6-
0.0
03
1-
0.0
07
5-
0.0
07
0-
0.0
09
3
Org
aniz
at.
innov.
0.0
271*
0.0
016
-0
.00
12
-0
.002
6-
0.0
00
9-
0.0
04
3-
0.0
02
0-
0.0
04
6
R&
D0
.12
09
***
0.0
45
2*
**
0.0
13
9*
0.0
06
00
.004
50
.01
19
0.0
17
20
.014
3
TF
P0
.02
43
0.0
10
90
.00
37
0.0
01
80
.001
20
.00
43
0.0
05
10
.005
1
21
–5
0em
plo
yee
s0
.04
12
*0
.042
3*
*0
.00
97
0.0
06
50
.002
60
.01
21
0.0
10
90
.012
5
51
–2
50
emplo
yee
s0
.07
06
***
0.0
82
0*
**
0.0
36
6*
*0
.029
2*
*0
.014
60
.05
06
***
0.0
45
3*
*0
.055
1*
*
25
1–
50
0em
plo
yee
s0
.15
35
***
0.1
20
9*
**
0.0
86
6*
**
0.0
55
5*
**
0.0
28
5*
0.1
04
3*
**
0.1
02
2*
**
0.1
13
3*
**
[5
00
emplo
yee
s0
.09
10
*0
.160
3*
**
0.0
96
2*
*0
.064
2*
**
0.0
29
9*
0.1
26
7*
**
0.1
06
8*
*0
.130
5*
**
No
rth–
Wes
t-
0.0
80
7*
**
-0
.002
1-
0.0
07
1-
0.0
02
6-
0.0
04
0-
0.0
03
6-
0.0
09
4-
0.0
05
8
No
rth–
Eas
t-
0.0
71
3*
**
0.0
05
60
.00
38
0.0
07
90
.002
00
.01
27
0.0
05
20
.012
6
Cen
tre
-0
.05
41
*0
.008
20
.01
89
0.0
21
80
.010
50
.03
45
0.0
25
50
.037
7
Sca
lein
ten
siv
e-
0.0
30
4-
0.0
33
6*
*-
0.0
31
1*
**
-0
.030
2*
**
-0
.017
8*
-0
.04
74
***
-0
.043
4*
**
-0
.055
0*
**
Sp
ecia
lize
dsu
ppli
er0
.04
39
**
-0
.004
4-
0.0
14
1*
-0
.016
2*
-0
.008
4-
0.0
23
9*
-0
.018
5-
0.0
26
6*
A multivariate probit approach 685
123
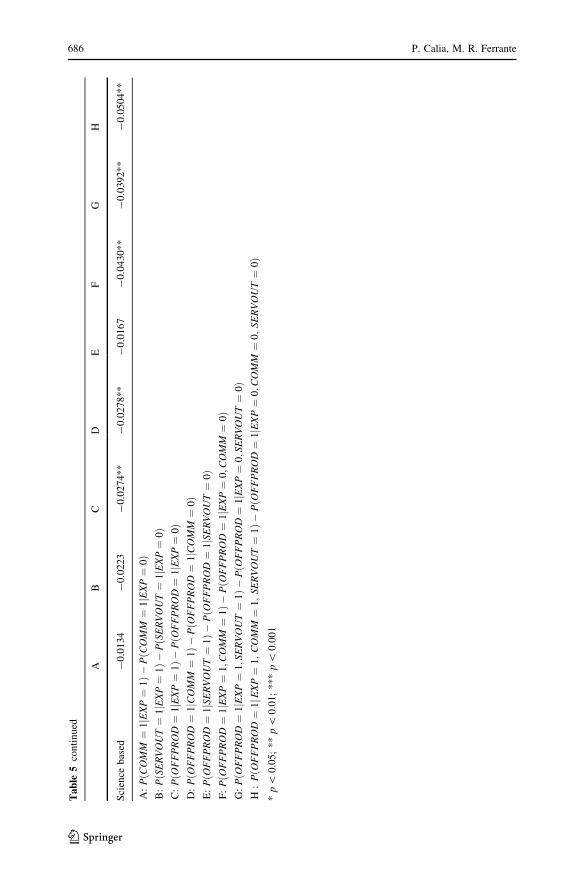
Tab
le5
con
tin
ued
AB
CD
EF
GH
Sci
ence
bas
ed-
0.0
13
4-
0.0
22
3-
0.0
27
4*
*-
0.0
27
8*
*-
0.0
16
7-
0.0
43
0*
*-
0.0
39
2*
*-
0.0
50
4*
*
A:
PðC
OM
M¼
1jE
XP¼
1Þ�
PðC
OM
M¼
1jE
XP¼
0Þ
B:
PðS
ER
VO
UT¼
1jE
XP¼
1Þ�
PðS
ER
VO
UT¼
1jE
XP¼
0Þ
C:
PðO
FF
PR
OD¼
1jE
XP¼
1Þ�
PðO
FF
PR
OD¼
1jE
XP¼
0Þ
D:
PðO
FF
PR
OD¼
1jC
OM
M¼
1Þ�
PðO
FF
PR
OD¼
1jC
OM
M¼
0Þ
E:
PðO
FF
PR
OD¼
1jS
ER
VO
UT¼
1Þ�
PðO
FF
PR
OD¼
1jS
ER
VO
UT¼
0Þ
F:
PðO
FF
PR
OD¼
1jE
XP¼
1;C
OM
M¼
1Þ�
PðO
FF
PR
OD¼
1jE
XP¼
0;C
OM
M¼
0Þ
G:
PðO
FF
PR
OD¼
1jE
XP¼
1;S
ER
VO
UT¼
1Þ�
PðO
FF
PR
OD¼
1jE
XP¼
0;S
ER
VO
UT¼
0Þ
H:
PðO
FF
PR
OD¼
1jE
XP¼
1;
CO
MM¼
1;
SE
RV
OU
T¼
1Þ�
PðO
FF
PR
OD¼
1jE
XP¼
0;C
OM
M¼
0;
SE
RV
OU
T¼
0Þ
*p\
0.0
5;
**
p\
0.0
1;
**
*p\
0.0
01
686 P. Calia, M. R. Ferrante
123
increasing capital intensity above average reduces (by 5 % points) the effect of
exporting on the probability of offshoring. Furthermore, because the value of MEM
(0.053) is greater, in absolute value, than the value of the TE (0.045), firms with
above average capital intensity are more likely to offshore in the absence of
exporting (substitute offshoring for exporting). The whole set of results is reported
in Table 5.16
The predicted TE obtained as difference in conditional probabilities (PTE in the
first row of Table 6) shows that the effects of exporting (or adopting commercial
penetration or offshoring of services) on the probability of adopting any other
strategy are, on average, always positive. This finding suggests that firms prefer to
complement alternatives rather than substitute them. Firms that engage in exporting
have a 33 % points higher probability of engaging in commercial penetration and a
12 % points higher probability of engaging in offshoring with respect to non-
exporting firms. Moreover, engaging in export, commercial penetration and/or
outsourcing of services always increases the chance of engaging in offshoring: the
TEs are smaller (less than 9 % points) but still significant and positive, and increase
as the firm broadens the channels it uses to participate in international markets.
Looking at the MEMs, all the considered effects vary according to the same set of
characteristics, with MEMs that are similar in magnitude.
The effect of exporting (and of the other strategies) on the probability of
engaging in each internationalisation mode increases as the proportion of skilled
workers increases above the average (with an increase of almost 50 % points for the
effect of exporting on commercial penetration), and is higher for firms that are
members of a group in a leading or intermediate position, have a larger size, and
invest in ICT. In contrast, the effect of exporting on participation in other
internationalisation modes decreases as capital intensity increases above average,
and is smaller for firms belonging to sectors other than supplier-dominated, so they
are less likely to jointly adopt the various modes considered. More in detail, with
reference to the whole set of effects on the probability of offshoring, the estimated
MEMs are negative and greater than the respective TEs: increasing the capital
intensity reverses the sign of the effect, becoming negative, thus supporting the
substitutive relationship. This last result suggests that firms involved in more
capital-intensive activities have a lower probability of engaging in some interna-
tionalisation mode when they export (hence supporting the substitution relation-
ship). Finally, the effect of export on the probability of performing commercial
penetration is positively associated with some other covariates: firms that invest
more in R&D, that carry out product and organizational innovation, located in the
South of Italy and that belong to a consortium are more likely to complement export
with commercial penetration.
To summarise, complementarity among internationalisation strategies seems to
be generally preferred: firms jointly adopt different forms of internationalisation
instead of replacing forms that require low sunk costs with more demanding forms.
This conclusion concerns the relationship between traditional internationalisation
16 Obviously, a number of other combinations of the four internationalisation modes could have been
considered, but here we limit the analysis to those that we deem as the most remarkable.
A multivariate probit approach 687
123

modes (offshoring and export), but also applies to strategies that have less
frequently been considered in the literature, such as commercial penetration and the
outsourcing of services.
7 Conclusions
Most of the literature on the relationship between firm’s participation in
international markets and firm heterogeneity focuses on export and foreign direct
investment. This paper considers a wider range of forms of internationalisation that
firms could combine into different patterns. With the purpose of analysing the
selection of heterogeneous firms into different internationalisation patterns, we
jointly model the decisions on the forms of internationalisation through a
multivariate probit.
The consideration of other forms of internationalisation, in addition to the more
traditional exports and FDI, allows for a more comprehensive description of firm
behaviour in expanding abroad. A considerable proportion of firms adopt diverse,
non-equity forms of internationalisation rather than export, an alternative that is
generally neglected in the literature.
The adoption of the MVP allows us to generate multivariate outcomes
corresponding to all possible combinations of internationalisation choices. We
show that disregarding some alternatives faced by the firms can lead to an
incomplete representation of the patterns of internationalisation and of their links
with firm characteristics.
The empirical evidence presented in this study confirms the idea, present in the
most recent literature, that firm heterogeneity, described by means of a multiplicity
of firm characteristics in addition to productivity, influences the selection into
different internationalisation patterns. Groups of domestic firms, or of firms
adopting only export, contain a smaller proportion of skilled workers and are
smaller in size, do not perform innovative activities, have high capital intensity, and
operate in the scale-intensive and science-based sectors. Domestic firms are also less
productive than firms engaging in international activities. The group of firms that
engage in other forms, besides export, has very different characteristics compared to
the groups described above. This group mainly consists of firms with a larger share
of skilled workers, with innovation and R&D potential, which belongs to a group
not in a subsidiary position. Firms that jointly engage in service outsourcing and
export are most likely to be foreign-owned, of a larger size, and located in the North
of Italy. Firms adopting the entire set of forms are very rare; they are large firms
belonging to a group in a leading or intermediate position and in traditional or
specialised-supplier sectors, investing in R&D and in ICT, but with lower capital
intensity. Regarding productivity, our results suggest that it affects the choice of
whether to remain domestic or to become internationally involved in some way, but
not the choice between different internationalisation modes.
Although we could not properly test the complementarity against the substitut-
ability hypothesis of modes of internationalisation, we get evidence that firms
pursue simultaneously different channels in order to penetrate into international
688 P. Calia, M. R. Ferrante
123
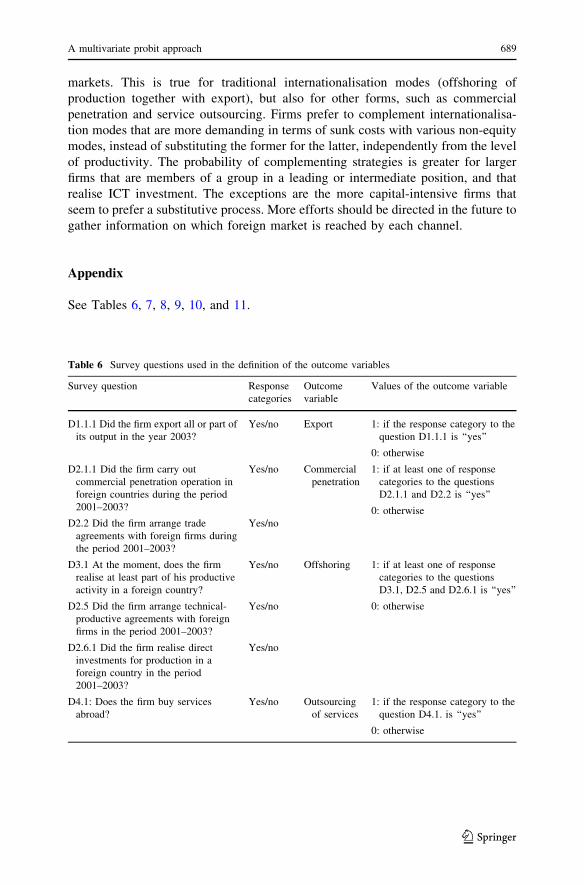
markets. This is true for traditional internationalisation modes (offshoring of
production together with export), but also for other forms, such as commercial
penetration and service outsourcing. Firms prefer to complement internationalisa-
tion modes that are more demanding in terms of sunk costs with various non-equity
modes, instead of substituting the former for the latter, independently from the level
of productivity. The probability of complementing strategies is greater for larger
firms that are members of a group in a leading or intermediate position, and that
realise ICT investment. The exceptions are the more capital-intensive firms that
seem to prefer a substitutive process. More efforts should be directed in the future to
gather information on which foreign market is reached by each channel.
Appendix
See Tables 6, 7, 8, 9, 10, and 11.
Table 6 Survey questions used in the definition of the outcome variables
Survey question Response
categories
Outcome
variable
Values of the outcome variable
D1.1.1 Did the firm export all or part of
its output in the year 2003?
Yes/no Export 1: if the response category to the
question D1.1.1 is ‘‘yes’’
0: otherwise
D2.1.1 Did the firm carry out
commercial penetration operation in
foreign countries during the period
2001–2003?
Yes/no Commercial
penetration
1: if at least one of response
categories to the questions
D2.1.1 and D2.2 is ‘‘yes’’
0: otherwise
D2.2 Did the firm arrange trade
agreements with foreign firms during
the period 2001–2003?
Yes/no
D3.1 At the moment, does the firm
realise at least part of his productive
activity in a foreign country?
Yes/no Offshoring 1: if at least one of response
categories to the questions
D3.1, D2.5 and D2.6.1 is ‘‘yes’’
0: otherwiseD2.5 Did the firm arrange technical-
productive agreements with foreign
firms in the period 2001–2003?
Yes/no
D2.6.1 Did the firm realise direct
investments for production in a
foreign country in the period
2001–2003?
Yes/no
D4.1: Does the firm buy services
abroad?
Yes/no Outsourcing
of services
1: if the response category to the
question D4.1. is ‘‘yes’’
0: otherwise
A multivariate probit approach 689
123
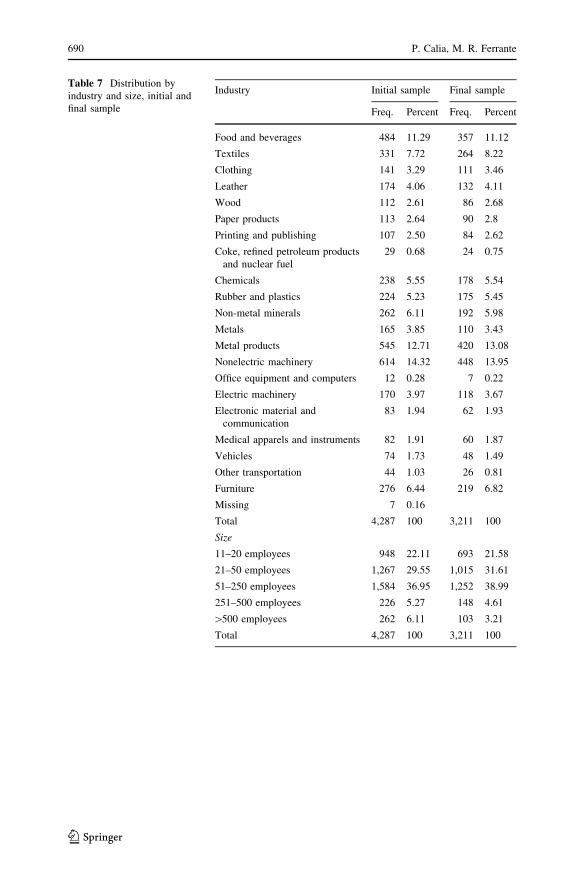
Table 7 Distribution by
industry and size, initial and
final sample
Industry Initial sample Final sample
Freq. Percent Freq. Percent
Food and beverages 484 11.29 357 11.12
Textiles 331 7.72 264 8.22
Clothing 141 3.29 111 3.46
Leather 174 4.06 132 4.11
Wood 112 2.61 86 2.68
Paper products 113 2.64 90 2.8
Printing and publishing 107 2.50 84 2.62
Coke, refined petroleum products
and nuclear fuel
29 0.68 24 0.75
Chemicals 238 5.55 178 5.54
Rubber and plastics 224 5.23 175 5.45
Non-metal minerals 262 6.11 192 5.98
Metals 165 3.85 110 3.43
Metal products 545 12.71 420 13.08
Nonelectric machinery 614 14.32 448 13.95
Office equipment and computers 12 0.28 7 0.22
Electric machinery 170 3.97 118 3.67
Electronic material and
communication
83 1.94 62 1.93
Medical apparels and instruments 82 1.91 60 1.87
Vehicles 74 1.73 48 1.49
Other transportation 44 1.03 26 0.81
Furniture 276 6.44 219 6.82
Missing 7 0.16
Total 4,287 100 3,211 100
Size
11–20 employees 948 22.11 693 21.58
21–50 employees 1,267 29.55 1,015 31.61
51–250 employees 1,584 36.95 1,252 38.99
251–500 employees 226 5.27 148 4.61
[500 employees 262 6.11 103 3.21
Total 4,287 100 3,211 100
690 P. Calia, M. R. Ferrante
123
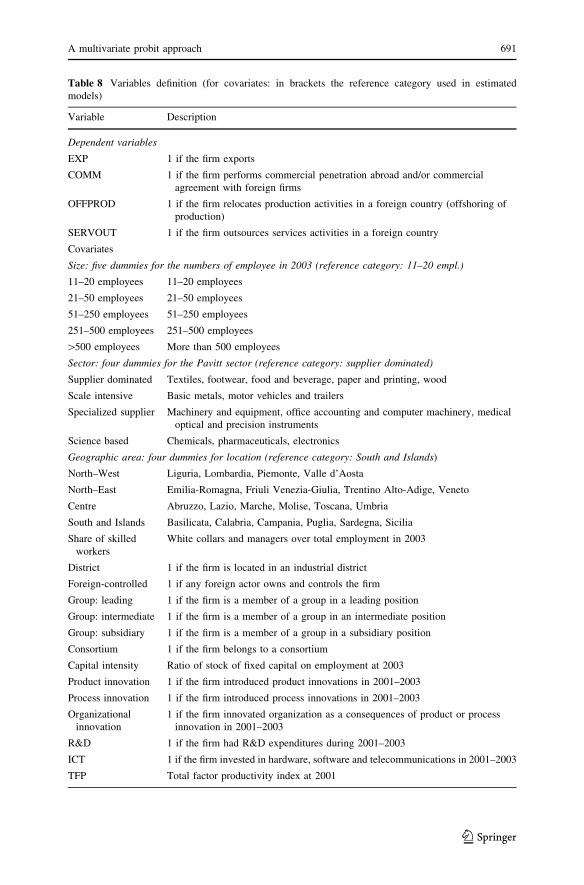
Table 8 Variables definition (for covariates: in brackets the reference category used in estimated
models)
Variable Description
Dependent variables
EXP 1 if the firm exports
COMM 1 if the firm performs commercial penetration abroad and/or commercial
agreement with foreign firms
OFFPROD 1 if the firm relocates production activities in a foreign country (offshoring of
production)
SERVOUT 1 if the firm outsources services activities in a foreign country
Covariates
Size: five dummies for the numbers of employee in 2003 (reference category: 11–20 empl.)
11–20 employees 11–20 employees
21–50 employees 21–50 employees
51–250 employees 51–250 employees
251–500 employees 251–500 employees
[500 employees More than 500 employees
Sector: four dummies for the Pavitt sector (reference category: supplier dominated)
Supplier dominated Textiles, footwear, food and beverage, paper and printing, wood
Scale intensive Basic metals, motor vehicles and trailers
Specialized supplier Machinery and equipment, office accounting and computer machinery, medical
optical and precision instruments
Science based Chemicals, pharmaceuticals, electronics
Geographic area: four dummies for location (reference category: South and Islands)
North–West Liguria, Lombardia, Piemonte, Valle d’Aosta
North–East Emilia-Romagna, Friuli Venezia-Giulia, Trentino Alto-Adige, Veneto
Centre Abruzzo, Lazio, Marche, Molise, Toscana, Umbria
South and Islands Basilicata, Calabria, Campania, Puglia, Sardegna, Sicilia
Share of skilled
workers
White collars and managers over total employment in 2003
District 1 if the firm is located in an industrial district
Foreign-controlled 1 if any foreign actor owns and controls the firm
Group: leading 1 if the firm is a member of a group in a leading position
Group: intermediate 1 if the firm is a member of a group in an intermediate position
Group: subsidiary 1 if the firm is a member of a group in a subsidiary position
Consortium 1 if the firm belongs to a consortium
Capital intensity Ratio of stock of fixed capital on employment at 2003
Product innovation 1 if the firm introduced product innovations in 2001–2003
Process innovation 1 if the firm introduced process innovations in 2001–2003
Organizational
innovation
1 if the firm innovated organization as a consequences of product or process
innovation in 2001–2003
R&D 1 if the firm had R&D expenditures during 2001–2003
ICT 1 if the firm invested in hardware, software and telecommunications in 2001–2003
TFP Total factor productivity index at 2001
A multivariate probit approach 691
123

Table 9 Sample means and standard deviation of covariates
Variables EXP COMM OFFPROD SERVOUT DOMESTIC
Mean SD Mean SD Mean SD Mean SD Mean SD
Share of skilled
workers
0.339 0.179 0.360 0.180 0.374 0.203 0.360 0.192 0.305 0.194
District 0.474 0.499 0.458 0.498 0.466 0.500 0.453 0.498 0.384 0.487
Foreign controlled 0.065 0.247 0.060 0.237 0.091 0.288 0.130 0.337 0.026 0.158
Group: leading 0.081 0.273 0.113 0.317 0.189 0.392 0.123 0.329 0.040 0.196
Group: subsid. 0.170 0.376 0.158 0.365 0.127 0.334 0.218 0.413 0.163 0.369
Group: interm. 0.076 0.265 0.095 0.294 0.173 0.379 0.134 0.340 0.023 0.149
Consortium 0.130 0.337 0.148 0.355 0.121 0.326 0.141 0.348 0.103 0.304
Capital intensity 0.212 0.222 0.207 0.233 0.166 0.165 0.211 0.228 0.280 0.346
ICT 0.719 0.450 0.791 0.407 0.831 0.376 0.812 0.391 0.562 0.496
Product innovation 0.484 0.500 0.585 0.493 0.547 0.499 0.568 0.496 0.217 0.412
Process innovation 0.456 0.498 0.529 0.499 0.495 0.501 0.550 0.498 0.348 0.477
Organizat. Innovation 0.372 0.483 0.451 0.498 0.436 0.497 0.452 0.498 0.257 0.437
R&D 0.544 0.498 0.675 0.468 0.651 0.477 0.675 0.469 0.195 0.397
TFP 1.027 0.399 1.048 0.399 1.105 0.392 1.089 0.453 0.893 0.366
11–20 employees 0.166 0.372 0.135 0.342 0.104 0.306 0.084 0.278 0.372 0.484
21–50 employees 0.307 0.461 0.291 0.455 0.205 0.405 0.232 0.422 0.340 0.474
51–250 employees 0.433 0.496 0.453 0.498 0.485 0.501 0.506 0.500 0.260 0.439
251–500 employees 0.055 0.227 0.073 0.261 0.114 0.318 0.086 0.281 0.019 0.135
[500 employees 0.039 0.195 0.047 0.211 0.091 0.288 0.091 0.288 0.010 0.099
North–West 0.366 0.482 0.350 0.477 0.309 0.463 0.362 0.481 0.302 0.460
North–East 0.332 0.471 0.333 0.472 0.365 0.482 0.351 0.478 0.265 0.442
Centre 0.171 0.376 0.170 0.376 0.231 0.422 0.174 0.379 0.205 0.404
South and Islands 0.131 0.337 0.147 0.354 0.094 0.293 0.112 0.316 0.227 0.419
Supplier dominated 0.515 0.500 0.475 0.500 0.586 0.493 0.496 0.500 0.544 0.498
Scale intensive 0.134 0.341 0.127 0.333 0.078 0.269 0.121 0.327 0.285 0.452
Specialized supplier 0.312 0.464 0.348 0.476 0.296 0.457 0.332 0.471 0.123 0.328
Science based 0.039 0.194 0.050 0.219 0.039 0.194 0.051 0.220 0.049 0.215
Table 10 Estimates of
correlation coefficients
a The q indexes refer to the
equations: 1 = EXP,
2 = COMM, 3 = OFFPROD,
4 = SERVOUT
* p \ 0.05; ** p \ 0.01;
*** p \ 0.001
Parametera Coefficient SE p-value 95 % CI
q21 0.567*** 0.030 0.000 0.509 0.625
q31 0.233*** 0.055 0.000 0.125 0.341
q32 0.213*** 0.042 0.000 0.130 0.296
q41 0.344*** 0.043 0.000 0.260 0.428
q42 0.367*** 0.032 0.000 0.304 0.430
q43 0.114*** 0.046 0.013 0.024 0.205
Wald test: q21 = q31 = _ = q65 = 0, v(6) = 509.36,
p-value = 0.000
692 P. Calia, M. R. Ferrante
123
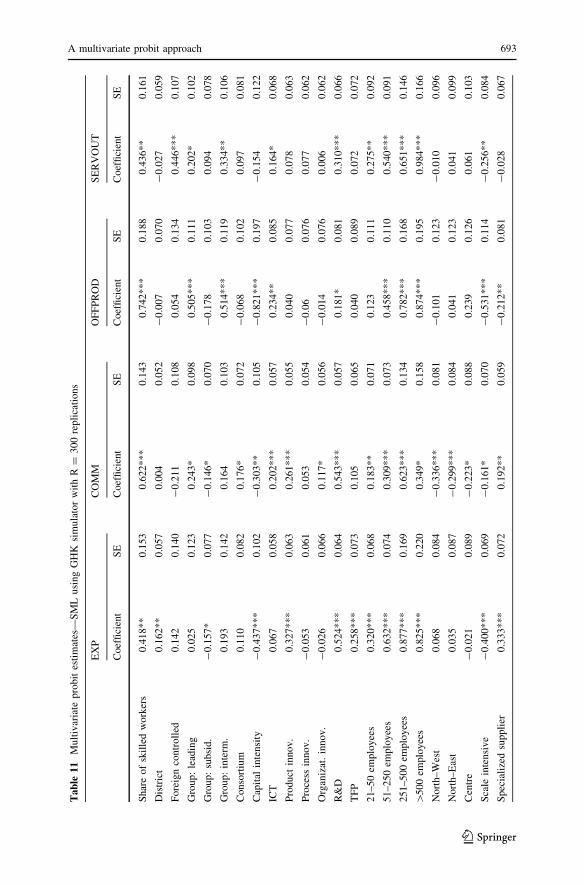
Tab
le1
1M
ult
ivar
iate
pro
bit
esti
mat
es—
SM
Lusi
ng
GH
Ksi
mula
tor
wit
hR
=3
00
repli
cati
on
s
EX
PC
OM
MO
FF
PR
OD
SE
RV
OU
T
Coef
fici
ent
SE
Coef
fici
ent
SE
Coef
fici
ent
SE
Coef
fici
ent
SE
Sh
are
of
skil
led
wo
rker
s0
.41
8*
*0
.153
0.6
22
**
*0
.143
0.7
42
**
*0
.188
0.4
36
**
0.1
61
Dis
tric
t0
.16
2*
*0
.057
0.0
04
0.0
52
-0
.007
0.0
70
-0
.027
0.0
59
Fo
reig
nco
ntr
oll
ed0
.14
20
.140
-0
.211
0.1
08
0.0
54
0.1
34
0.4
46
**
*0
.107
Gro
up
:le
adin
g0
.02
50
.123
0.2
43
*0
.098
0.5
05
**
*0
.111
0.2
02
*0
.102
Gro
up
:su
bsi
d.
-0
.15
7*
0.0
77
-0
.146
*0
.070
-0
.178
0.1
03
0.0
94
0.0
78
Gro
up
:in
term
.0
.19
30
.142
0.1
64
0.1
03
0.5
14
**
*0
.119
0.3
34
**
0.1
06
Co
nso
rtiu
m0
.11
00
.082
0.1
76
*0
.072
-0
.068
0.1
02
0.0
97
0.0
81
Cap
ital
inte
nsi
ty-
0.4
37
**
*0
.102
-0
.303
**
0.1
05
-0
.821
**
*0
.197
-0
.154
0.1
22
ICT
0.0
67
0.0
58
0.2
02
**
*0
.057
0.2
34
**
0.0
85
0.1
64
*0
.068
Pro
du
ctin
no
v.
0.3
27
**
*0
.063
0.2
61
**
*0
.055
0.0
40
0.0
77
0.0
78
0.0
63
Pro
cess
inno
v.
-0
.05
30
.061
0.0
53
0.0
54
-0
.06
0.0
76
0.0
77
0.0
62
Org
aniz
at.
innov.
-0
.02
60
.066
0.1
17
*0
.056
-0
.014
0.0
76
0.0
06
0.0
62
R&
D0
.52
4*
**
0.0
64
0.5
43
**
*0
.057
0.1
81
*0
.081
0.3
10
**
*0
.066
TF
P0
.25
8*
**
0.0
73
0.1
05
0.0
65
0.0
40
0.0
89
0.0
72
0.0
72
21
–5
0em
plo
yee
s0
.32
0*
**
0.0
68
0.1
83
**
0.0
71
0.1
23
0.1
11
0.2
75
**
0.0
92
51
–2
50
emplo
yee
s0
.63
2*
**
0.0
74
0.3
09
**
*0
.073
0.4
58
**
*0
.110
0.5
40
**
*0
.091
25
1–
50
0em
plo
yee
s0
.87
7*
**
0.1
69
0.6
23
**
*0
.134
0.7
82
**
*0
.168
0.6
51
**
*0
.146
[5
00
emplo
yee
s0
.82
5*
**
0.2
20
0.3
49
*0
.158
0.8
74
**
*0
.195
0.9
84
**
*0
.166
No
rth–
Wes
t0
.06
80
.084
-0
.336
**
*0
.081
-0
.101
0.1
23
-0
.010
0.0
96
No
rth–
Eas
t0
.03
50
.087
-0
.299
**
*0
.084
0.0
41
0.1
23
0.0
41
0.0
99
Cen
tre
-0
.02
10
.089
-0
.223
*0
.088
0.2
39
0.1
26
0.0
61
0.1
03
Sca
lein
ten
siv
e-
0.4
00
**
*0
.069
-0
.161
*0
.070
-0
.531
**
*0
.114
-0
.256
**
0.0
84
Sp
ecia
lize
dsu
ppli
er0
.33
3*
**
0.0
72
0.1
92
**
0.0
59
-0
.212
**
0.0
81
-0
.028
0.0
67
A multivariate probit approach 693
123

Tab
le1
1co
nti
nued
EX
PC
OM
MO
FF
PR
OD
SE
RV
OU
T
Coef
fici
ent
SE
Coef
fici
ent
SE
Coef
fici
ent
SE
Coef
fici
ent
SE
Sci
ence
bas
ed-
0.4
20
**
0.1
36
-0
.092
0.1
27
-0
.527
**
0.1
82
-0
.192
0.1
41
Co
nst
ant
-0
.38
8*
**
0.1
17
-1
.196
**
*0
.117
-1
.978
**
*0
.176
-1
.934
**
*0
.141
H0:b
1=
0v(
24
)=
49
5.2
7p
-va
lue
=0
.000
0
H0:b
2=
0v(
24
)=
50
7.5
1p
-va
lue
=0
.000
0
H0:b
3=
0v(
24
)=
23
1.3
6p
-va
lue
=0
.000
0
H0:b
4=
0v(
24
)=
30
2.5
2p
-va
lue
=0
.000
0
H0:b
1=
b2
=b
3=
b4
v(72
)=
31
1.5
4p
-va
lue
=0
.000
0
*p\
0.0
5;
**
p\
0.0
1;
**
*p\
0.0
01
694 P. Calia, M. R. Ferrante
123
References
Abraham, K. G., & Taylor, S. K. (1996). Firm’s use of outside contractors: Theory and evidence. Journal
of Labor Economics, 14(3), 394–424.
Amiti, M., & Wei, S. J. (2005). Fear of service outsourcing: Is it justified? Economic Policy, 20(42),
308–347.
Amiti, M., & Wei, S. J. (2006). Service offshoring and productivity: Evidence from the United States
(NBER Working Paper 11926). Cambridge, MA: National Bureau of Economic Research.
Antonietti, R., & Cainelli, G. (2008). Spatial agglomeration, technology and outsourcing of knowledge
intensive business services. Empirical insights from Italy. International Journal of Services,
Technology and Management, 10(2–4), 273–298.
Ashford, J. R., & Sowden, R. R. (1970). Multi-variate probit analysis. Biometrics, 26(3), 535–546.
Aw, B. Y., & Lee, Y. (2008). Firm heterogeneity and location choice of Taiwanese multinationals.
Journal of International Economics, 75(1), 167–179.
Barba Navaretti, G., Bugamelli, M., Schivardi, F., Altomonte, C., Horgos, D., & Maggioni, D. (2011).
The global operations of European firms. The second Efige Policy Report. Bruegel Blueprint Series
12, Brussels: Bruegel.
Basile, R., Giunta, A., & Nugent, J. (2003). Foreign expansion by Italian manufacturing firms in the
nineties: An ordered probit analysis. Review of Industrial Organization, 23(1), 1–24.
Becchetti, L., De Panizza, A., & Oropallo, F. (2007). Role of Industrial district externalities in export and
value-added performance: Evidence from the population of Italian firms. Regional Studies, 41(5),
601–621.
Benfratello, L., & Razzolini, T. (2009). Firms’ productivity and internationalisation choices: Evidence for
a large sample of manufacturing firms. In L. Piscitello & G. Santangelo (Eds.), Multinationals and
local competitiveness. Franco Angeli: Milano.
Benfratello, L., Schiantarelli, F., & Sembenelli, A. (2008). Banks and innovation: Microeconometric
evidence on Italian firms. Journal of Financial Economics, 90(2), 197–217.
Bianco, M., & Nicodano, G. (2006). Pyramidal groups and debt. European Economic Review, 50(4),
937–961.
Borsch-Supan, A., & Hajivassiliou, V. A. (1993). Smooth unbiased multivariate probability simulators for
maximum likelihood estimation of limited dependent variable models. Journal of Econometrics,
58(3), 347–368.
Bougheas, S., & Gorg H. (2008). Organizational forms for global engagement of firms (GEP Discussion
Paper 08/33). University of Nottingham: Leverhulme Centre for Research on Globalisation and
Economic Policy. Available at SSRN: http://ssrn.com/abstract=1448554.
Brainard, L. (1997). An empirical assessment of the proximity-concentration trade-off between
multinational sales and trade. The American Economic Review, 87(4), 520–544.
Cappellari, L., & Jenkins, S. P. (2003). Multivariate probit regression using simulated maximum
likelihood. The Stata Journal, 3(3), 278–294.
Cappellari, L., & Jenkins, S. P. (2006). Calculation of multivariate normal probabilities by simulation,
with applications to maximum simulated likelihood estimation. The Stata Journal, 6(2), 156–189.
Castellani, D., & Zanfei, A. (2007). Internationalisation, innovation and productivity: How do firms differ
in Italy? The World Economy, 30(1), 156–176.
Caves, D. W., Christensen, L. R., & Diewert, W. E. (1982). Multilateral comparisons of output, input, and
productivity using superlative index numbers. The Economic Journal, 92(365), 73–86.
Chen, Z. A. (2003). Theory of international strategic alliance. Review of International Economics, 11(5),
758–769.
Crino, R. (2009). Offshoring, multinationals and labour market: a review of the empirical literature.
Journal of Economic Surveys, 23(2), 197–249.
Cusmano, L., Mancusi, M. L., & Morrison, A. (2010). Globalisation of production and innovation: How
outsourcing is reshaping an advanced manufacturing area. Regional studies, 44(3), 235–252.
Delgado, M. A., Farinas, J. C., & Ruano, S. (2002). Firm productivity and export markets: A non-
parametric approach. Journal of International Economics, 57(2), 397–422.
Filatotchev, I., Piga, C., & Dyomina, N. (2003). Network positioning and R&D activity: A study of Italian
groups. RD Management, 33(1), 37–48.
Girma, S., Gorg, H., & Strobl, E. (2004). Exports, international investment and plant performance.
Evidence from a non-parametric test. Economics Letters, 83(3), 317–324.
A multivariate probit approach 695
123

Girma, S., Kneller, R., & Pisu, M. (2005). Exports versus FDI: An empirical test. Review of World
Economics/Weltwirtschaftliches Archiv, 141(2), 193–218.
Grandinetti, R., & Mason, M. C. (2012). Internationalisation modes other than exporting: The missing
determinant of export performance. European Business Review, 24(3), 236–254.
Greenaway, D., & Kneller, R. (2007). Firm heterogeneity, exporting and foreign direct investment: A
survey. Economic Journal, 117(517), F134–F161.
Greene, W. H. (2003). Econometric Analysis. Upper Saddle River, NJ: Prentice–Hall.
Hajivassiliou, V. A., & Ruud, P. (1994). Classical estimation methods for LDV models using simulation.
In R. Engle & D. McFadden (Eds.), Handbook of econometrics (Vol. IV, pp. 2383–2441).
Amsterdam: North-Holland.
Hall, B., Lotti, F., & Mairesse, J. (2009). Innovation and productivity in SMEs: Empirical evidence for
Italy. Small Business Economics, 33(1), 13–33.
Head, K., & Ries, J. (2003). Heterogeneity and the FDI versus export decision of Japanese manufacturers.
Journal of the Japanese and International Economies, 17(4), 448–467.
Head, K., & Ries, J. (2004). Exporting and FDI as alternative strategies. Oxford Review of Economic
Policy, 20(3), 409–423.
Helpman, E. (2006). Trade, FDI and the organization of firms. Journal of Economic Literature, 44(3),
589–630.
Helpman, E., Meliz, M., & Yeaple, S. (2004). Export versus FDI with heterogeneous firms. American
Economic Review, 94(1), 300–316.
ISTAT (2004). Commercio estero e attivita internazionali delle imprese—Annuario 2003. Annuari n. 6.
Keane, M. P. (1994). A computationally practical simulation estimator for panel data. Econometrica,
62(1), 95–116.
Levinsohn, J., & Petrin, A. (2003). Estimating production functions using inputs to control for
unobservables. Review of Economic Studies, 70(2), 317–342.
Lipsey, R. E. (2002). Home and host country effects of FDI (NBER Working Paper 9293). Cambridge,
MA: National Bureau of Economic Research.
Maddala, G. S. (1983). Limited-dependent and qualitative variables in econometrics. Cambridge:
Cambridge University Press.
Melitz, M. (2003). The impact of trade on aggregate industry productivity and intra-industry reallocation.
Econometrica, 71(6), 1695–1725.
Minetti, R., & Zhu, C. S. (2011). Credit constraints and firms export: Microeconometric evidence from
Italy. Journal of International Economics, 83(2), 109–125.
Oberhofer, H., & Pfaffermayr, M. (2012). FDI vs export: Multiple host countries and empirical evidence.
The World Economy, 35(3), 316–330.
Palmberg, C., & Pajarinen, M. (2005). Internationalisation through strategic alliances-determinants of
non-equity alliances of Finnish firms. Finnish Journal of Business Economics, 4, 489–509.
Parisi, M. L., Schiantarelli, F., & Sembenelli, A. (2006). Productivity, innovation and R&D: Micro
evidence for Italy. European Economic Review, 50(8), 2037–2061.
Sterlacchini, A. (2001). The determinants of export performance: A firm-level study of Italian
manufacturing. Review of World Economics/Weltwirtschaftliches Archiv, 137(3), 450–472.
Tomiura, E. (2007). Foreign outsourcing, exporting, and FDI: A productivity comparison at the firm level.
Journal of International Economics, 72(1), 113–127.
Wagner, J. (2007). Exports and productivity: A survey of the evidence from firm-level data. The World
Economy, 30(1), 60–82.
Wagner, J. (2010). International activities and firm performance: Introduction. The World Economy,
33(3), 311–314.
Wagner, J. (2011). Offshoring and firm performance: Self-selection, effects on performance, or both?
Review of World Economics/Weltwirtschaftliches Archiv, 147(2), 217–247.
Wagner, J. (2012). International trade and firm performance: A survey of empirical studies since 2006.
Review of World Economics/Weltwirtschaftliches Archiv, 148(2), 235–267.
696 P. Calia, M. R. Ferrante
123