how cpg supply chains are preparing for seismic change · pdf file68 supply chain leaders ......
TRANSCRIPT

GROCERY MANUFACTURERS ASSOCIATIONJANUARY 2018
How CPG Supply Chains Are Preparing for Seismic ChangeElfrun von Koeller, Peter Dawe, and Alicia Pittman

The Grocery Manufacturers Association (GMA) is the trade organization representing the world’s leading food, beverage and consumer products companies and associated partners. The U.S. food, beverage and consumer packaged goods industry plays a unique role as the single largest U.S. manufacturing employment sector, with 2.1 million jobs in 30,000 communities across the country that deliver products vital to the wellbeing of people in our nation and around world. Founded in 1908, GMA has a primary focus on product safety, science-based public policies and industry initiatives that seek to empower people with the tools and information they need to make informed choices and lead healthier lives. For more information, visit gmaonline.org.
The Boston Consulting Group (BCG) is a global management consulting firm and the world’s leading advisor on business strategy. We partner with clients from the private, public, and not-for-profit sectors in all regions to identify their highest-value opportunities, address their most critical challenges, and transform their enterprises. Our customized approach combines deep insight into the dynamics of companies and markets with close collaboration at all levels of the client organization. This ensures that our clients achieve sustainable competitive advantage, build more capable organizations, and secure lasting results. Founded in 1963, BCG is a private company with more than 90 offices in 50 countries. For more information, please visit bcg.com.
CONTENTS
AT A GLANCE . . . . . . . . . . . . . . . . . . . . . . . . . . . . . . . . . . . . . . . . . . 1
INTRODUCTION . . . . . . . . . . . . . . . . . . . . . . . . . . . . . . . . . . . . . . . . 2About the Study . . . . . . . . . . . . . . . . . . . . . . . . . . . . . . . . . . . . . . 2
SURVEY FINDINGS: A MIXED BAG . . . . . . . . . . . . . . . . . . . . . . . . . 3Managing the Cost–Service Tradeoff . . . . . . . . . . . . . . . . . . . . . . 3 Service Rebounded . . . . . . . . . . . . . . . . . . . . . . . . . . . . . . . . . . . . . . 6 . . .As Customer Expectations Grew . . . . . . . . . . . . . . . . . . . . . . . . 7 Cash Flow Improved, but Inventory Management Results Were Mixed . . . . . . . . . . . . . . . . . . . . . . . . . . . . . . . . . . . . 8
KEEPING UP WITH AN EVER-RISING BAR . . . . . . . . . . . . . . . . . . . 8 Gearing Up for E-Commerce . . . . . . . . . . . . . . . . . . . . . . . . . . . . 9
FIVE MUST-DOS FOR CPG COMPANIES . . . . . . . . . . . . . . . . . . . . 10
APPENDIX . . . . . . . . . . . . . . . . . . . . . . . . . . . . . . . . . . . . . . . . . . . 13
i THE GROCERY MANUFACTURERS ASSOCIATION • THE BOSTON CONSULTING GROUP

AT A GLANCE
Disruption has come to grocery and, with it, major changes for leading consumer packaged goods (CPG) companies. E-commerce has gained momentum, and competition among retailers is at a fever pitch. With more participants and more routes to market, getting goods from plant to shelf involves more hurdles and more complexity than ever before.
Costs Have Eased, but Service Remains a ChallengeIn the past few years, service performance has improved for most CPG companies (aided by lower fuel prices and better weather), yet many have still fallen short of their goals . Channel proliferation appears to be the greatest impediment to on-time delivery; rates for service to small-format and online retailers were lower than for traditional large-format customers . Not surprising, nearly half of respondents to a survey conducted by the Grocery Manufacturers Association and BCG ranked customer service and logistics costs among their top three concerns .
Trickle-Down Pressures As channels continue to proliferate, service performance becomes harder to manage . The slow-growth environment, along with the rapid rise of e-commerce, is straining retail’s fragile economics . In response, mainstream retailers are turning up the pressure on CPG companies with greater service requirements . These companies will soon face rising customer demands, further repercussions from channel proliferation, looming transportation constraints, and the need for more frequent network redesign .
1 THE GROCERY MANUFACTURERS ASSOCIATION • THE BOSTON CONSULTING GROUP

Amere few years ago, in 2014, leading consumer packaged goods (CPG) companies were facing a freight capacity squeeze, crushing transportation costs, and a harsh winter . Since then, capacity pressures have eased, fuel prices have gone down, and the weather has improved . The
environment for supply chains, however, has not .
Disruption has come to grocery and, with it, major change for CPG companies . E-commerce is gaining momentum, empowering smaller, nimbler competitors to threaten grocery’s Goliaths . Competition among retailers is at a fever pitch, reigniting cost pressures and challenging manufacturers to dig deeper for more efficiency in the supply chain . For CPG companies, scale no longer confers the same supply chain advantage it once did . With more participants and more routes to market, moving goods from plant to shelf involves more hurdles and more complexity .
How are outbound CPG supply chains faring in this tumultuous period? This report, one of a series, sheds light on that question . The report is based on the findings of an in-depth benchmarking study by the Grocery Manufacturers Association (GMA) and The Boston Consulting Group of more than 30 leading CPG companies . (See the sidebar “About the Study .”)
For the first time since 2010, CPG companies have improved their service levels, although not without incurring more cost . For some of our study participants, the improvements came automatically—primarily through lower fuel costs and milder winters . For others, the performance gains were the result of deliberate efforts . Overall, the performance of manufacturers of ambient products differed substantially from that of manufacturers of temperature-controlled products: freight costs for the vast majority of ambient shippers fell, while those for most temperature-controlled shippers rose .
2 THE GROCERY MANUFACTURERS ASSOCIATION • THE BOSTON CONSULTING GROUP
About the Study
The 2017 Supply Chain Benchmarking Study, conducted by GMA and BCG, is the sixth in a series on US CPG manufacturers’ outbound supply chains.
The study is based on four components: surveys of 30 leading CPG companies; in-depth interviews with 68 supply chain leaders (with an emphasis this year on e-commerce); interviews with industry experts; and BCG research on e-commerce and supply chain trends and practices. The study was conducted in 2017 and is based on 2015 and 2016 data.
Participants included manufacturers of food, household, and beauty products with ambient and temperature-controlled (both refrigerated and frozen) supply chains. Gross annual revenues for these companies range from $165 million to more than $32 billion. For multinational participants, we confined our study to their US operations.
BCG analyzed and interpreted the study findings and is wholly responsible for all analyses, conclusions, and recommendations. To ensure data validity and quality, we cleaned the data extensively, followed up with individuals, and compared outliers with peers and with historical data. We also segregated findings
by product category and temperature mode.
Survey Findings: A Mixed Bag
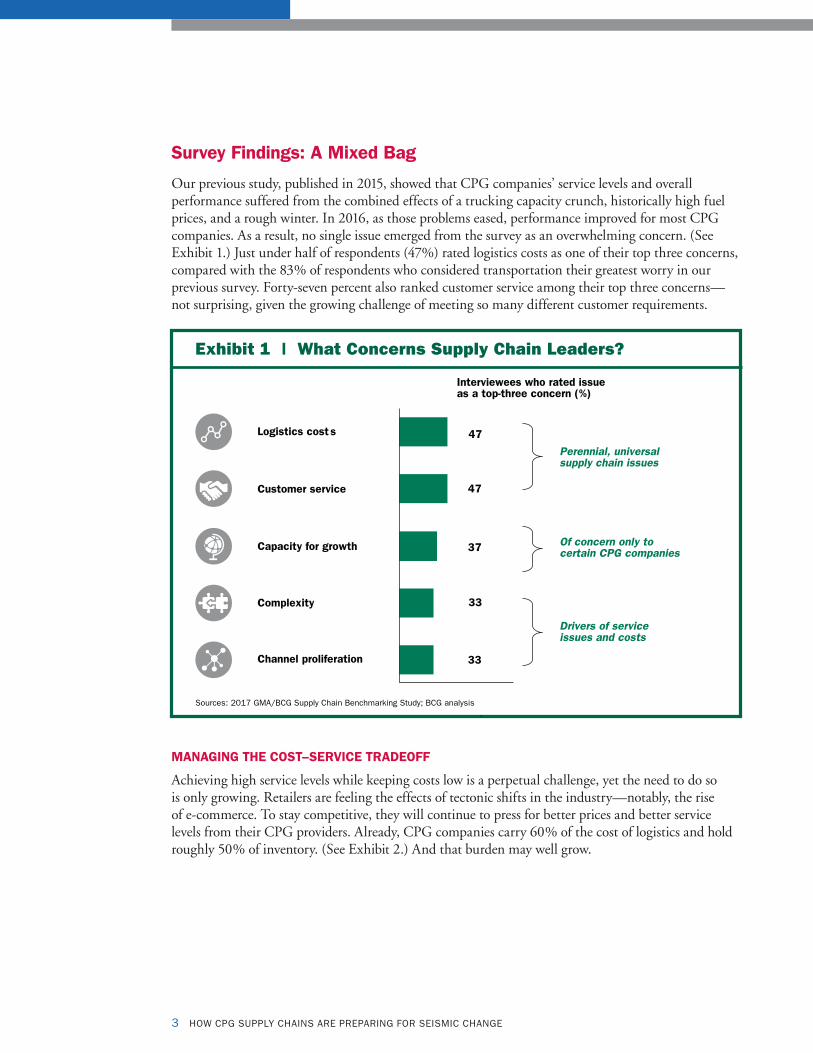
Our previous study, published in 2015, showed that CPG companies’ service levels and overall performance suffered from the combined effects of a trucking capacity crunch, historically high fuel prices, and a rough winter . In 2016, as those problems eased, performance improved for most CPG companies . As a result, no single issue emerged from the survey as an overwhelming concern . (See Exhibit 1 .) Just under half of respondents (47%) rated logistics costs as one of their top three concerns, compared with the 83% of respondents who considered transportation their greatest worry in our previous survey . Forty-seven percent also ranked customer service among their top three concerns—not surprising, given the growing challenge of meeting so many different customer requirements .
MANAGING THE COST–SERVICE TRADEOFF
Achieving high service levels while keeping costs low is a perpetual challenge, yet the need to do so is only growing . Retailers are feeling the effects of tectonic shifts in the industry—notably, the rise of e-commerce . To stay competitive, they will continue to press for better prices and better service levels from their CPG providers . Already, CPG companies carry 60% of the cost of logistics and hold roughly 50% of inventory . (See Exhibit 2 .) And that burden may well grow .
3 HOW CPG SUPPLY CHAINS ARE PREPARING FOR SEISMIC CHANGE
Exhibit 1 | What Concerns Supply Chain Leaders?
Logistics costs
Customer service
Capacity for growth
Complexity
Channel proliferation
Interviewees who rated issue as a top-three concern (%)
Sources: 2017 GMA/BCG Supply Chain Benchmarking Study; BCG analysis.
47
47
37
33
33
Perennial, universal supply chain issues
Of concern only to certain CPG companies
Drivers of service issues and costs

Some companies have managed the cost-service tradeoff more deftly than others . (See Exhibit 3 .) Among respondents who also participated in the 2015 survey, the median on-time case fill factor was 89 .7%—a 2 .4 percentage point improvement . But the median cost per case ($1 .58) represented a 4 .47 percentage point increase . (Cost per case includes replenishment freight, distribution center and warehouse operations, customer freight, and overhead .) Only three companies succeeded in improving service and reducing costs .
4 HOW CPG SUPPLY CHAINS ARE PREPARING FOR SEISMIC CHANGE
Exhibit 2 | CPG Companies Bear 60% of the Cost of Shipping from Plant to Store
Sources: 2017 GMA/BCG Supply Chain Benchmarking Study; BCG analysis .Note: Total cost per case based on ambient goods.
0.38
0.44
0.40
0.51
0.34
$2.19
Distribution center
Total cost per case
Other
0.06
Shipping Customer freight
Other Distribution center
0.06
Replenishment freight
CPG manufacturers Retailers
$1.28 $0.91
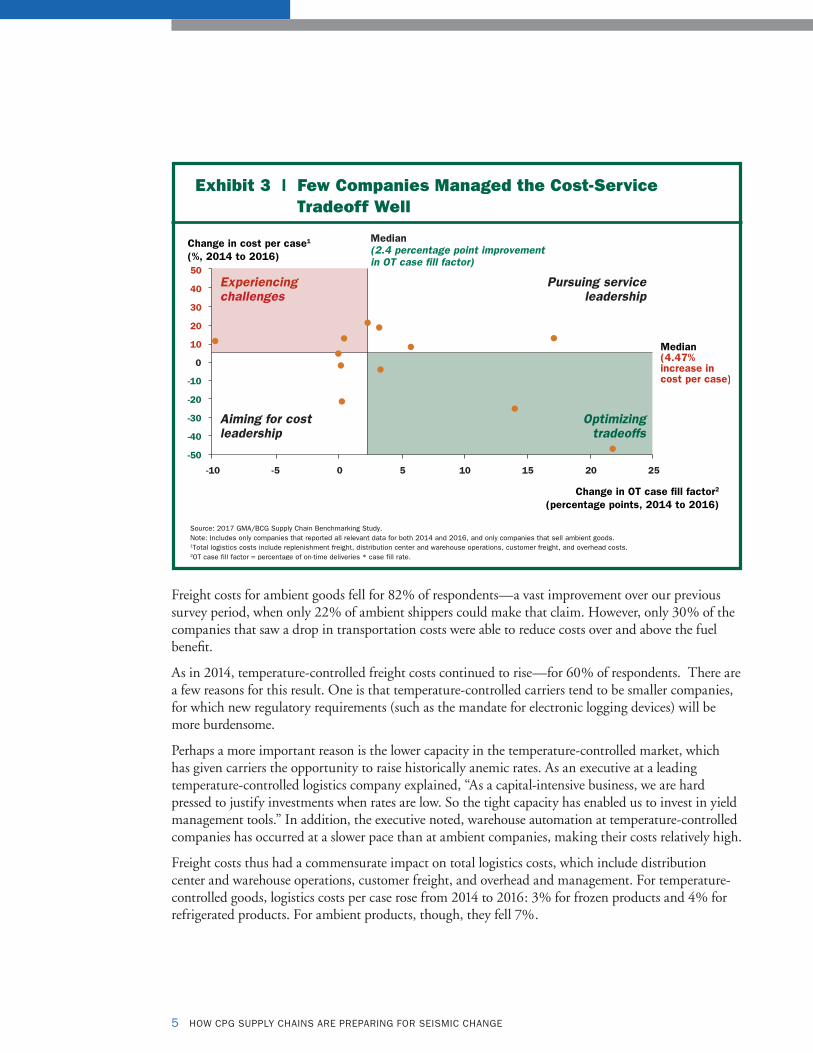
Freight costs for ambient goods fell for 82% of respondents—a vast improvement over our previous survey period, when only 22% of ambient shippers could make that claim . However, only 30% of the companies that saw a drop in transportation costs were able to reduce costs over and above the fuel benefit .
As in 2014, temperature-controlled freight costs continued to rise—for 60% of respondents . There are a few reasons for this result . One is that temperature-controlled carriers tend to be smaller companies, for which new regulatory requirements (such as the mandate for electronic logging devices) will be more burdensome .
Perhaps a more important reason is the lower capacity in the temperature-controlled market, which has given carriers the opportunity to raise historically anemic rates . As an executive at a leading temperature-controlled logistics company explained, “As a capital-intensive business, we are hard pressed to justify investments when rates are low . So the tight capacity has enabled us to invest in yield management tools .” In addition, the executive noted, warehouse automation at temperature-controlled companies has occurred at a slower pace than at ambient companies, making their costs relatively high .
Freight costs thus had a commensurate impact on total logistics costs, which include distribution center and warehouse operations, customer freight, and overhead and management . For temperature-controlled goods, logistics costs per case rose from 2014 to 2016: 3% for frozen products and 4% for refrigerated products . For ambient products, though, they fell 7% .
5 HOW CPG SUPPLY CHAINS ARE PREPARING FOR SEISMIC CHANGE
Exhibit 3 | Few Companies Managed the Cost-Service Tradeoff Well
6 HOW CPG SUPPLY CHAINS ARE PREPARING FOR SEISMIC CHANGE
SERVICE REBOUNDED…
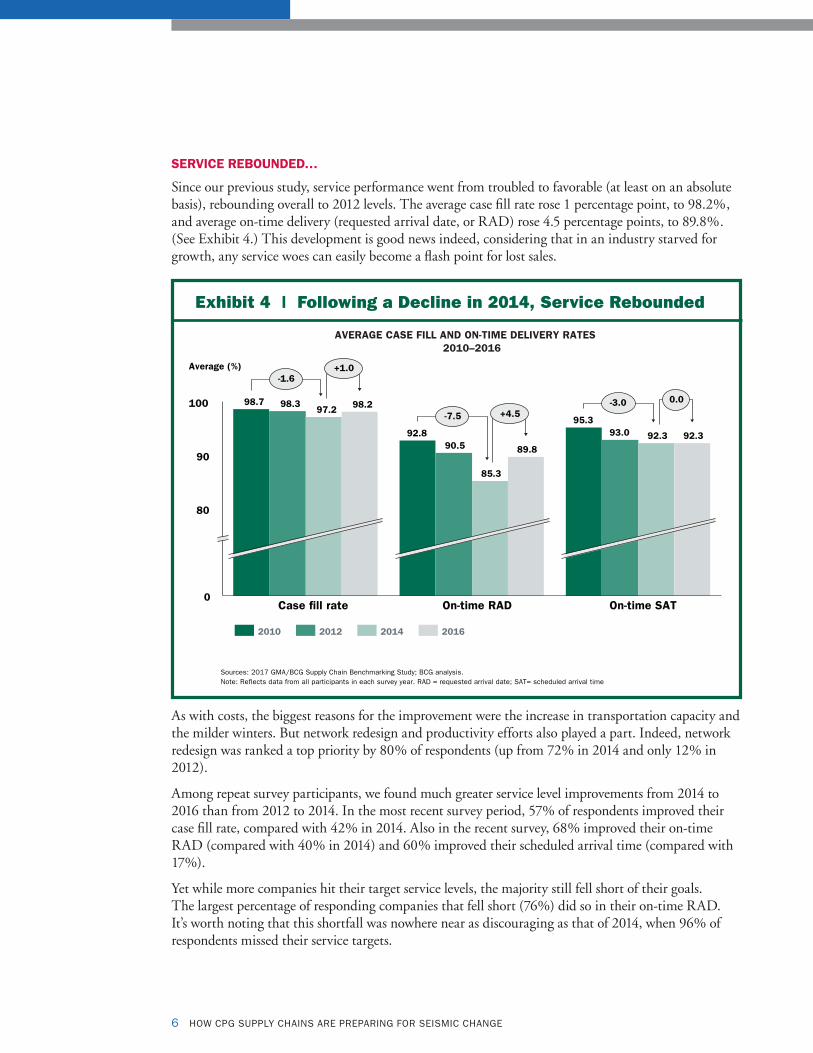
Since our previous study, service performance went from troubled to favorable (at least on an absolute basis), rebounding overall to 2012 levels . The average case fill rate rose 1 percentage point, to 98 .2%, and average on-time delivery (requested arrival date, or RAD) rose 4 .5 percentage points, to 89 .8% . (See Exhibit 4 .) This development is good news indeed, considering that in an industry starved for growth, any service woes can easily become a flash point for lost sales .
As with costs, the biggest reasons for the improvement were the increase in transportation capacity and the milder winters . But network redesign and productivity efforts also played a part . Indeed, network redesign was ranked a top priority by 80% of respondents (up from 72% in 2014 and only 12% in 2012) .
Among repeat survey participants, we found much greater service level improvements from 2014 to 2016 than from 2012 to 2014 . In the most recent survey period, 57% of respondents improved their case fill rate, compared with 42% in 2014 . Also in the recent survey, 68% improved their on-time RAD (compared with 40% in 2014) and 60% improved their scheduled arrival time (compared with 17%) .
Yet while more companies hit their target service levels, the majority still fell short of their goals . The largest percentage of responding companies that fell short (76%) did so in their on-time RAD . It’s worth noting that this shortfall was nowhere near as discouraging as that of 2014, when 96% of respondents missed their service targets .
Exhibit 4 | Following a Decline in 2014, Service Rebounded

7 HOW CPG SUPPLY CHAINS ARE PREPARING FOR SEISMIC CHANGE
Channel proliferation is the greatest impediment to on-time delivery performance . (See Exhibit 5 .) It’s no wonder that it (along with the related issue of complexity) ranked as a top-three concern for 33% of respondents . When we broke down median case fill rates and on-time delivery rates by channel, we found that CPG companies generally performed best in serving large-format retailers, such as club stores and grocery and mass sellers . That isn’t surprising, given that these segments have been CPG companies’ traditional target customers, and those with which they’ve developed joint planning systems . On-time delivery rates in serving smaller format retailers, especially online retailers, were lower . Tellingly, the range in on-time RAD rates was vast—from 37 .9% to 98 .5%—a reflection of just how far down the median has been pushed by CPG companies that are struggling to serve the e-commerce channel . As these companies continue to sell to a more diverse customer base, we expect these challenges to persist .
…AS CUSTOMER EXPECTATIONS GREW
Exhibit 5 may reflect future, as much as past, performance . As the number of alternative channels (such as convenience and drug stores) and e-commerce channels grows, service performance becomes trickier . Order requirements vary greatly from channel to channel and from customer to customer . CPG companies can no longer count on economies of scale achieved through a one-size-fits-all approach to their customers .
In a slow-growth environment, the increasing importance of alternative channels and of online retailers in particular represents a growing threat to traditional grocery and mass retailers . As a result, these
Exhibit 5 | Channel Proliferation Has Hurt Service, Especially Delivery Times
8 HOW CPG SUPPLY CHAINS ARE PREPARING FOR SEISMIC CHANGE
mainstream customers are turning up the pressure with more stringent on-time requirements . Seventy-six percent of CPG companies in our survey noted that their on-time requirements from grocery and mass channel customers have increased since 2014 . Walmart, notably, has raised its on-time in-full requirement to 95% . Sixty-three percent of respondents noted heightened requirements from their club store customers, too . It’s likely that retailers in other channels will follow suit as they attempt to hold on to their customers .
With their delivery time requirements, retailers mean business . They are increasingly imposing fines on CPG companies for missing these demands . At the same time, retailers are seeking to hold less inventory and reduce order quantities, both of which translate into more frequent shipments . As one survey respondent noted, “Customers are using service as a way to generate revenue .” Said another: “Retailers are doing what we did years ago, by measuring turns, out of stocks, and capacity taken up . They’re realizing that there’s a lot of money to be saved in a well-managed supply chain .”
CASH FLOW IMPROVED, BUT INVENTORY MANAGEMENT RESULTS WERE MIXED
If cash isn’t exactly king, it has certainly become a bigger priority for CPG companies, as more and more of them have instituted zero-based budgeting . These cash-flow-management efforts have paid off . On average, companies reduced their cash conversion cycle by 5 days, from 31 days in 2014 to 26 in 2016 . The number of days sales outstanding (DSO) fell by 2 (from 26 to 24), and their days payables outstanding (DPO) increased by 6 (from 40 to 46) .
The number of days of inventory on hand (DIOH), however, rose an average of 6 days (from 40 to 46)—on top of the average five-day increase from 2012 to 2014 . It’s important to note that for 43% of respondents, extending DIOH was a deliberate strategic move . Among them, 23% held inventory as a hedge, either during network redesign (to ensure the ability to fill orders promptly during the transition) or while assimilating an acquisition . The remaining 20% held excess inventory to bolster seasonal supply, hedge commodity prices, or support rapid volume growth .
Keeping Up with an Ever-Rising Bar
Amid plateauing retail sales, CPG companies have been experimenting with a wide range of strategies and tactics to maintain profitability, from ramping up their M&A activity to adopting zero-based budgeting in order to winnow out waste and inefficiency . And the pursuit of efficiencies is not over . Companies are expanding their digital capabilities to seek new technology-based efficiencies and to boost their service and e-commerce competence .
Grocery retailers, meanwhile, are increasingly under siege: Consumers today expect more product variety (organic, non-GMO, gluten-free) on mainstream retailers’ shelves . And Amazon’s acquisition of Whole Foods and the subsequent fallout among brick-and-mortar leaders marked a pivotal moment in the emergence of online grocery buying . With the aggressive discounting some retailers have unleashed to stem consumer defection, it’s unlikely these retailers will have either the latitude or the inclination to assume a bigger share of logistics costs .
In short, grocery retailers face challenges that are more permanent than cyclical . It’s difficult for them to avoid passing the pressures they’re experiencing on to their CPG suppliers, so the squeeze on CPG companies is unlikely to let up anytime soon . In the coming years, the following trends will likely prevail .

9 HOW CPG SUPPLY CHAINS ARE PREPARING FOR SEISMIC CHANGE
Gearing Up for E-Commerce
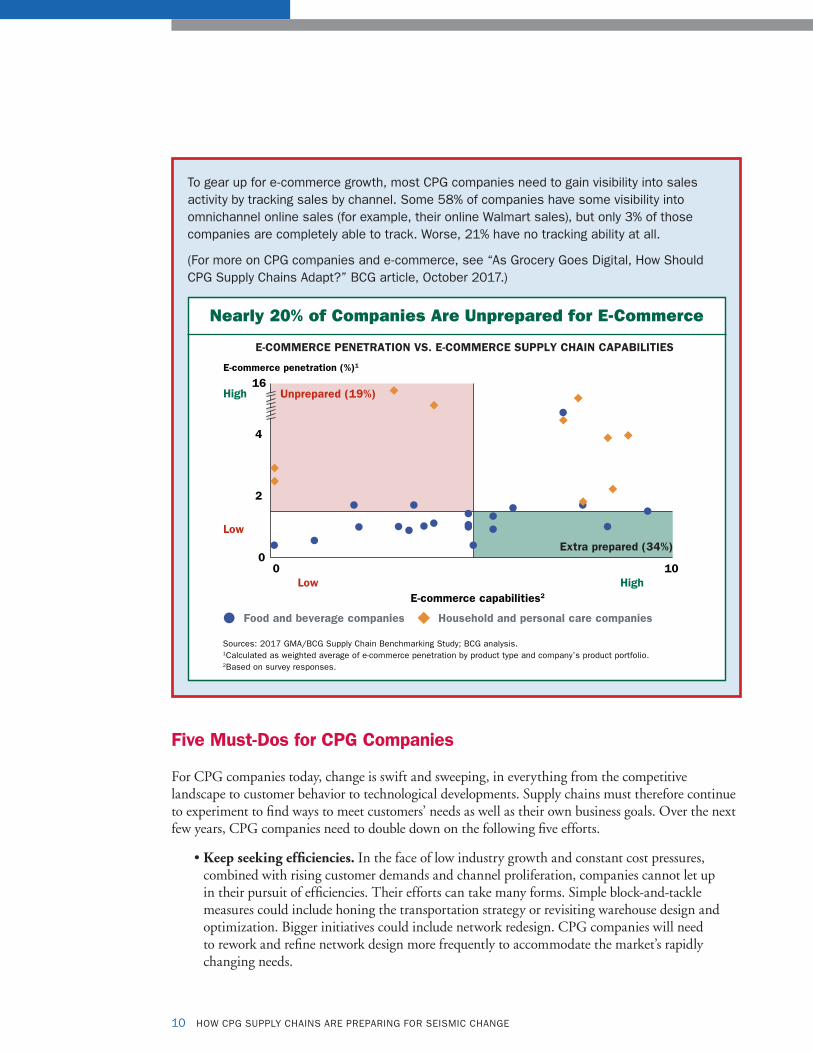
E-commerce sales represent just under 2%, on average, of the business of the CPG companies in our study, even among those that offer direct online sales to consumers. Still, some CPG companies are not taking any chances when it comes to building up their e-commerce capabilities. Some 34% with low e-commerce penetration report that they are “extra prepared.” (See the exhibit.)
Yet many whose product portfolios are well represented online are woefully unprepared for serving the online supply chain—and are clearly at risk of losing share as the e-commerce market grows. BCG’s analysis of online sales growth across a wide swath of industries shows that once online sales reach 10% of total sales, growth accelerates dramatically. While e-commerce is integrated in the general supply chains of 43% of our study participants, only two reported having a dedicated e-commerce supply chain team. Another 27% said their e-commerce supply chain was part of a cross-functional e-commerce team.
CPG companies were bolder in their expectations than in their preparation. Overall, respondents projected that in the next two years their e-commerce sales would grow by around 58% while brick-and-mortar sales would increase only 3%.
Rising Retailer Demands. As retail competition intensifies among and between brick-and-mortar and online sellers, retailers will continue to press for narrower delivery windows . Penalties for missing these demands will keep rising .
Further Repercussions from Channel Proliferation. Since our last study, channel proliferation has underscored the need to customize SKUs for new channels . It has also indirectly contributed to the reduction in order quantities . Complexity in SKUs, as supply chain leaders well know, is a fundamental driver of cost . At the same time, channel proliferation has fueled new consumer behaviors, which exacerbates volatility and complicates forecasting . (See “Segmentation in the Consumer Supply Chain: One Size Does Not Fit All,” BCG article, December 2015 .) If e-commerce’s growth seemed assured before, Amazon’s acquisition of Whole Foods suggests it will only accelerate . (See the sidebar “Gearing Up for E-Commerce .”)
More Frequent Network Redesign. Shifting customer demands have put further pressure on service levels, intensifying a trend that emerged in 2014, when more CPG companies were revamping their network structure . What used to be a once-a-decade exercise has become a more regular activity, as companies recognize the value of a more flexible, more adaptable supply chain .
Looming Transportation Constraints. Despite the recent respite in transportation costs and greater carrier capacity, CPG companies need to be vigilant about imminent and longer-term logistics risks . For one, the pool of truck drivers is aging, and although autonomous truck tests have been promising, it will probably be another five to ten years before those vehicles are in wide circulation on highways . In addition, the electronic logging requirement may once again create capacity constraints, as the small businesses that constitute the lion’s share of temperature-controlled carriers struggle to meet compliance costs .
10 HOW CPG SUPPLY CHAINS ARE PREPARING FOR SEISMIC CHANGE
To gear up for e-commerce growth, most CPG companies need to gain visibility into sales activity by tracking sales by channel. Some 58% of companies have some visibility into omnichannel online sales (for example, their online Walmart sales), but only 3% of those companies are completely able to track. Worse, 21% have no tracking ability at all.
(For more on CPG companies and e-commerce, see “As Grocery Goes Digital, How Should CPG Supply Chains Adapt?” BCG article, October 2017.)
Five Must-Dos for CPG Companies
For CPG companies today, change is swift and sweeping, in everything from the competitive landscape to customer behavior to technological developments . Supply chains must therefore continue to experiment to find ways to meet customers’ needs as well as their own business goals . Over the next few years, CPG companies need to double down on the following five efforts .
• Keep seeking efficiencies. In the face of low industry growth and constant cost pressures, combined with rising customer demands and channel proliferation, companies cannot let up in their pursuit of efficiencies . Their efforts can take many forms . Simple block-and-tackle measures could include honing the transportation strategy or revisiting warehouse design and optimization . Bigger initiatives could include network redesign . CPG companies will need to rework and refine network design more frequently to accommodate the market’s rapidly changing needs .
Nearly 20% of Companies Are Unprepared for E-Commerce
11 HOW CPG SUPPLY CHAINS ARE PREPARING FOR SEISMIC CHANGE
• Capitalize on big data and digital. For 78% of participating CPG companies, end-to-end data visibility—from point-of-sale data to GPS tracking data on shipments—is a priority . Although they are accumulating more, and more valuable, data, most companies lack the tools and systems to analyze it and apply insights from it .
Sophisticated companies use big data and digital tools to modernize their supply chain activities in a number of ways: They use predictive analytics for demand forecasting and capacity modeling, and scenario modeling to optimize manufacturing and distribution . Geo-analytics help them improve logistics flows and route planning and build a control tower to create end-to-end visibility in the supply chain . The potential payoff is significant: a BCG study found that leaders in digital supply chain management can increase product availability by up to 10 percentage points and accelerate response times to changes in market demand by more than 25% . New data architecture, built partly in the cloud, can link data seamlessly, enabling companies to leapfrog costly and lengthy ERP deployments . (See “Three Paths to Advantage with Digital Supply Chains,” BCG article, February 2016 .)
• Secure new skills. Analytical skills are sorely needed for all the new data streams . So are IT skills, to effect digital transformation throughout key systems . Roughly 58% of respondents expressed concerned about recruiting and retaining digital and analytical talent . This is most likely because such talent tends to be concentrated in trendy urban areas . CPG companies need to develop more competitive recruiting and retention practices, as well as foster a work environment that is attractive to tech types .
• Prepare for online growth. Despite the many questions concerning e-commerce—which business models will prevail, which products will take off, how customer expectations will change—CPG companies must take tangible steps to prepare for online growth . They need to consider which online business model or models are worth pursuing . They might prioritize initiatives that will give them the biggest bang for the buck, such as developing e-commerce SKUs and establishing separate planning processes . And they should take some “no-regrets” moves, such as developing KPIs to track product performance online .
• Sell customers on the benefits of collaboration. Channel proliferation, along with rising customer expectations, makes accurate forecasting and planning all the more critical for CPG companies . This takes more than technology: it requires cooperation with customers . However, customers from alternative and e-commerce channels are not accustomed to such relationships with suppliers, so forging them may require unusual efforts and some short-term investment . But the long-term payoff can be high . Between them, manufacturers and retailers have three months of inventory on hand . Imagine the value that could be unlocked through stronger collaboration .
Despite the disruption and heightened uncertainty in the current grocery environment, logistics and costs are at a manageable point . Now is an opportune time for CPG companies to set their supply chain priorities and shore up gaps .
Crafting a three-year vision is a smart move . Promising new waves of productivity year in and year out is unrealistic—CPG supply chain leaders are better off managing expectations in the C-suite while demonstrating that they have a multiyear plan . Above all, they must be relentless in securing the support and partnership of all relevant parties, both internal and external . It’s the only way to prevail in the turbulent new industry order .
12 HOW CPG SUPPLY CHAINS ARE PREPARING FOR SEISMIC CHANGE
About the Authors
Elfrun von Koeller is a partner and managing director in the New York office of The Boston Consulting Group . You may contact her by email at koeller .elfrun .von@bcg .com .
Peter Dawe is a partner and managing director in BCG’s Toronto office . You may contact him by email at dawe .peter@bcg .com .
Alicia Pittman is a partner and managing director in the firm’s Washington, DC office . You may contact her by email at pittman .alicia@bcg .com .
Acknowledgments
The research described in this report was sponsored by GMA’s Supply Chain Committee and was performed by BCG in partnership with GMA . The authors would like to thank the members of that committee as well as Daniel Triot, senior director at the Trading Partner Alliance .
In addition, the authors thank their BCG colleagues Eduardo Guemes, Byron Peyster, Meredith Ruskin, and Nathalia Mussi . They also thank Jan Koch for assisting with the writing of this report and Katherine Andrews, Gary Callahan, Kim Friedman, Abby Garland, Amy Halliday, and Sean Hourihan for their contributions to editing, design, and production .
For Further Contact
For further information about this report or the benchmarking study, please contact one of the authors or Daniel Triot at the Trading Partner Alliance at dtriot@gmaonline .org . To learn more about BCG’s capabilities in consumer products and operations, please contact one of the authors .

13 HOW CPG SUPPLY CHAINS ARE PREPARING FOR SEISMIC CHANGE
Appendix
Table 1 | Participating Companies
Bumble Bee Seafoods The Nature's Bounty CompanyCampbell Soup Company Nestlé S.A. Cavendish Farms Noosa YoghurtClorox Oasis BrandsChurch & Dwight PepsiCoCoca-Cola North America PharmaviteEdgewell Personal Care Pinnacle FoodsFrito-Lay North America Procter & Gamble General Mills S.C. Johnson & SonHershey Snyder's LanceHormel Foods Starbucks Irving Consumer Products Tyson FoodsKellogg UnileverKind Welch Foods Land O'Lakes Weston FoodsMaple Leaf Foods Wholesome SweetenersMcCormick & Company Mondelēz International
Source: 2017 GMA/BCG Supply Chain Benchmarking Study.
14 HOW CPG SUPPLY CHAINS ARE PREPARING FOR SEISMIC CHANGE
Appendix
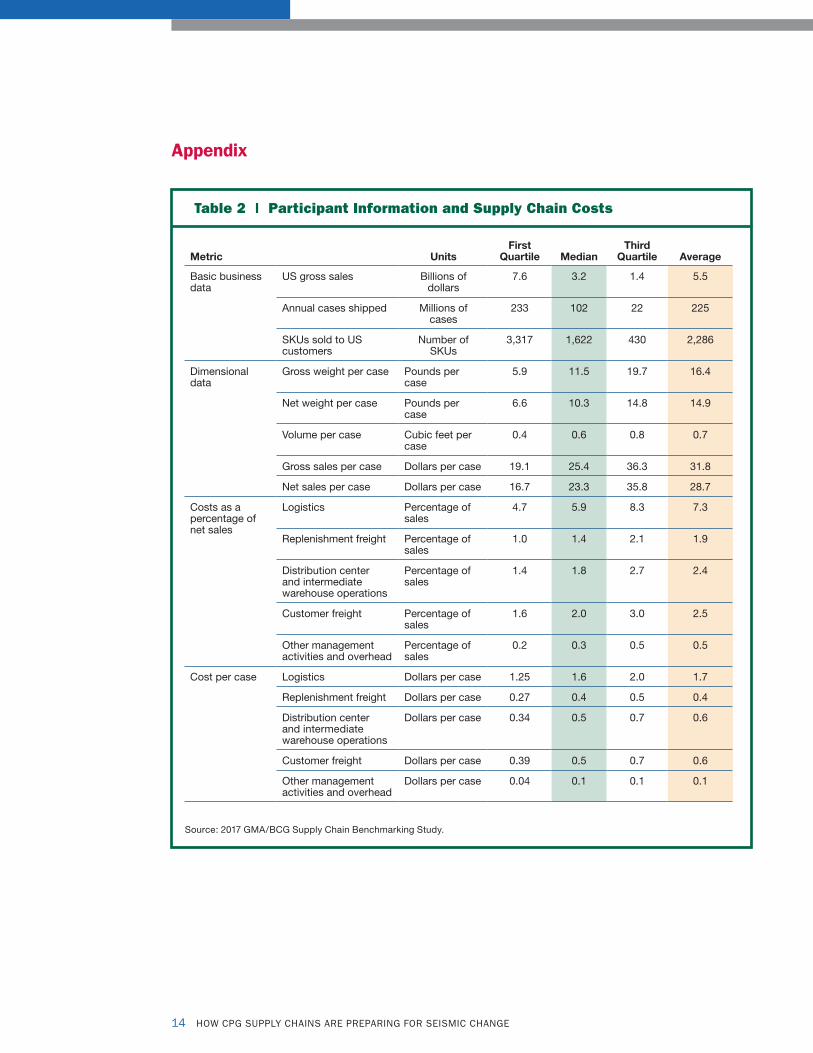
Table 2 | Participant Information and Supply Chain Costs
Metric UnitsFirst
Quartile MedianThird
Quartile Average
Basic business data
US gross sales Billions of dollars
7.6 3.2 1.4 5.5
Annual cases shipped Millions of cases
233 102 22 225
SKUs sold to US customers
Number of SKUs
3,317 1,622 430 2,286
Dimensional data
Gross weight per case Pounds per case
5.9 11.5 19.7 16.4
Net weight per case Pounds per case
6.6 10.3 14.8 14.9
Volume per case Cubic feet per case
0.4 0.6 0.8 0.7
Gross sales per case Dollars per case 19.1 25.4 36.3 31.8
Net sales per case Dollars per case 16.7 23.3 35.8 28.7
Costs as a percentage of net sales
Logistics Percentage of sales
4.7 5.9 8.3 7.3
Replenishment freight Percentage of sales
1.0 1.4 2.1 1.9
Distribution center and intermediate warehouse operations
Percentage of sales
1.4 1.8 2.7 2.4
Customer freight Percentage of sales
1.6 2.0 3.0 2.5
Other management activities and overhead
Percentage of sales
0.2 0.3 0.5 0.5
Cost per case Logistics Dollars per case 1.25 1.6 2.0 1.7
Replenishment freight Dollars per case 0.27 0.4 0.5 0.4
Distribution center and intermediate warehouse operations
Dollars per case 0.34 0.5 0.7 0.6
Customer freight Dollars per case 0.39 0.5 0.7 0.6
Other management activities and overhead
Dollars per case 0.04 0.1 0.1 0.1
Source: 2017 GMA/BCG Supply Chain Benchmarking Study.

15 HOW CPG SUPPLY CHAINS ARE PREPARING FOR SEISMIC CHANGE
Appendix
Table 3 | Supply Chain Performance
Metric UnitsFirst
Quartile MedianThird
Quartile Average
Service performance
Customer returns or allowance given
Percentage of sales 0.2 0.6 1.0 1.6
On-time delivery per-centage: Requested arrival date (RAD)
Percentage of deliveries
94.2 91.7 81.3 88.7
On-time delivery percentage: Scheduled arrival time (SAT)
Percentage of deliveries
95.9 92.8 90.5 92.6
Case fill rate Percentage of cases 99.2 98.2 97.0 98.1
Order fill rate Percentage of orders 95.2 86.4 74.7 84.5
Spoilage rate Percentage of sales 95.2 86.4 74.7 84.5
Cycle time (time between order and delivery)
Days 6.0 7.2 10.0 7.9
Warehouse performance
Cases picked Cases per employee hour
336.3 248.5 177.5 319.9
Full pallet pick Percentage of cases 84.0 70.5 50.0 63.2
Case pick (not full pallet) Percentage of cases 16.0 29.5 50.0 36.0
Loose case pick Percentage of cases 0.0 0.0 0.0 1.1
Average capacity utilization
Percentage of capacity 90.0 85.5 80.5 84.2
Peak capacity utilization
Percentage of capacity 99.4 95.0 92.0 92.7
Inventory and cash cycle performance
Average days finished- goods inventory on hand (DIOH)
Days 30.0 45.0 58.0 46.1
Days sales outstanding (DSO)
Days 18.0 23.0 26.0 23.5
Days payables outstanding (DPO)
Days 51.8 37.0 29.8 44.9
Average days finished- goods inventory held at top 10 retailers
Days 21.0 15.5 9.9 16.4
Forecast accuracy
National, 1-month lag, weighted average
Percentage error 18.8 25.3 28.9 25.5
National, 2-month lag, weighted average
Percentage error 23.6 32.0 35.9 30.6
National, 3- or 4-week lag, weighted average
Percentage error 29.0 42.0 45.8 40.6
By location, 1-month lag, weighted average
Percentage error 27.9 33.8 39.1 36.1
By location, 2-week lag, weighted average
Percentage error 33.9 41.9 50.4 43.1
By location, 3- or 4-week lag, weighted average
Percentage error 40.3 52.2 60.2 49.9
Source: 2017 GMA/BCG Supply Chain Benchmarking Study.
GROCERY MANUFACTURERS ASSOCIATION
1350 I Street, NW | Suite 300 | Washington, DC 20005 | ph 202-639-5900 | fx 202-639-5932
www.GMAonline.org | www.FactsAboutGMOs.org | www.SmartLabel.org | www.FactsUpFront.org
www.facebook.com/GroceryManufacturersAssociation | www.gmaonline.org/blog | @GroceryMakers
www.linkedin.com/company/grocery-manufacturers-association
©2018