how can cambodia, lao pdr, myanmar, and viet nam cope … · 29 contents abstract vii i....
TRANSCRIPT
ECONOMICS AND RESEARCH DEPARTMENT
ERD WORKING PAPER SERIES NO. 29
Kanokpan Lao-Araya
November 2002
Asian Development Bank
How can Cambodia, Lao PDR,
Myanmar, and Viet Nam
Cope with Revenue Lost
Due to AFTA Tariff Reductions?

25
ERD Working Paper No. 29
HOW CAN CAMBODIA, LAO PDR, MYANMAR, AND VIET NAM
COPE WITH REVENUE LOST
DUE TO AFTA TARIFF REDUCTIONS?
Kanokpan Lao-Araya
November 2002
Kanokpan Lao-Araya is an Economist at the Economics and Research Department. The author wishes tothank V.N. Gnanathurai and Teruo Ujiie for guidance and supervision of the study. The paper also benefitedfrom helpful comments from ADB colleagues Jayant Menon and Ernesto Pernia; and Tri Djandam and AnnaRobeniol of the ASEAN Secretariat.

ERD Working Paper No. 29HOW CAN CAMBODIA, LAO PDR, MYANMAR, AND VIET NAM COPE WITH REVENUE LOST DUE TO AFTA TARIFF REDUCTIONS?
26
Asian Development BankP.O. Box 7890980 ManilaPhilippines
2002 by Asian Development BankNovember 2002ISSN 1655-5252
The views expressed in this paperare those of the author(s) and do notnecessarily reflect the views or policiesof the Asian Development Bank.

27
Foreword
The ERD Working Paper Series is a forum for ongoing and recently completedresearch and policy studies undertaken in the Asian Development Bank or on its behalf.The Series is a quick-disseminating, informal publication meant to stimulate discussionand elicit feedback. Papers published under this Series could subsequently be revisedfor publication as articles in professional journals or chapters in books.

29
Contents
Abstract vii
I. INTRODUCTION 1
II. TAXATION IN DEVELOPING COUNTRIES 2
A. Developed versus Developing Countries 2B. ASEAN Countries 3
III. IMPACTS OF CEPT AGREEMENTS 7
A. CEPT and AFTA 7B. CEPT Product List 7C. Eligibility for CEPT Tariff Rate Reductions 9D. Strategic Compliance with the CEPT Scheme 9E. Revenue Impact of CEPT 11
IV. TAX REFORMS 19
A. Introduction of the Value Added Tax 19B. Surcharges on Luxuries and Nonessentials 20C. Simplification of Tax Structure 20D. Tax Administration Reforms 21
V. CONCLUSIONS 22
SELECTED REFERENCES 23

ERD Working Paper No. 29HOW CAN CAMBODIA, LAO PDR, MYANMAR, AND VIET NAM COPE WITH REVENUE LOST DUE TO AFTA TARIFF REDUCTIONS?
28
Abstract
In joining the Association of Southeast Asian Nations (ASEAN) and ASEAN FreeTrade Area (AFTA), the governments of Cambodia, Lao PDR, Myanmar, and Viet Namhave agreed to comply with the Common Effective Preferential Tariff (CEPT) Scheme,which reduces intra-ASEAN tariff rates on certain imports and may likely reducegovernment revenue. This study proposes tax structure and tax administration reformsand other complementary policies that these governments can introduce to safeguardand enhance revenue collection. First, they can strategically allocate goods among thefour CEPT scheme lists. Second, the new member countries can improve their tax systemsby replacing traditional general sales taxes with Value Added Tax and generallysimplifying their tax structures. Third, they can reduce inefficiencies that impede taxcollection by improving tax administration institutions and tools. Finally, they canimprove their overall legal systems so as to discourage tax avoidance and evasion andreduce corruption among tax officials.

1
I. INTRODUCTION
For many years before their recent accession to the Association of Southeast Asian Nations(ASEAN), the governments of Cambodia, Lao PDR, Myanmar, and Viet Nam (CLMV) reliedheavily on international trade taxes as a source of government revenue. As a precondition
of joining the trade association these new member countries agreed to comply with the terms ofthe Common Effective Preferential Tariff (CEPT) scheme, which requires that ASEAN membersreduce tariff rates for and eliminate quantitative restrictions and other nontariff barriers to intra-ASEAN trade. ASEAN adopted the CEPT scheme on the assumption that over the long termeliminating such tariffs will reduce the cost of and consequently increase the efficiency of intra-ASEAN trade. However, the new members, which are also sometimes collectively referred to asSoutheast Asian Transitional Economies (SEATEs), generally assume that the presumed increasein trade volume will not manifest itself immediately and, therefore, they expect that in the shortterm the reduction of trade tariff rates will reduce their overall government revenue.
Assuming that these circumstances will thus reduce the amount of revenue that they derivefrom trade tariffs, the governments of CLMV will be forced to take one or a combination of threepossible courses of action: reduce expenditure, borrow to finance increased deficit, or compensatefor revenue loss. The Asian economic crisis of 1997 made governments in Southeast Asia acutelyaware of the need to adequately fund poverty reduction and social protection programs. Therefore,the governments of CLMV are unlikely to be able to reduce expenditures substantially. In general,these countries are also reluctant to significantly increasing current levels of borrowing becausedoing so would not be fiscally sustainable in the long run, would indicate a lack of fiscal discipline,and would greatly increase public debt.
Without recourse to substantial expenditure cuts or increased borrowing, the new ASEANmember countries will need to reform their tax structures in order to find new sources of revenueto compensate for the shortfalls resulting from the reduction of revenue derived from trade tariffs.One major structural reform that some of these countries have already made is the substitutionof value added tax (VAT) for general sales tax. This reform is especially promising because VATis more broadly based than general sales tax and also because VAT complements a more export-oriented economic stance. This paper examines how this and other tax reforms are likely to helpthe new ASEAN members compensate for the expected short-term loss of revenue from trade tariffs.It also discusses other important tax administration and legal reforms that the governments ofCLMV should consider to safeguard revenue collection in general. In addition, the paper analyzeshow the new member countries can strategically participate in the CEPT scheme to make tariffrevenue reduction gradual and less severe.

ERD Working Paper No. 29HOW CAN CAMBODIA, LAO PDR, MYANMAR, AND VIET NAM COPE WITH REVENUE LOST DUE TO AFTA TARIFF REDUCTIONS?
2
II. TAXATION IN DEVELOPING COUNTRIES
A. Developed versus Developing Countries
In considering the most advisable program of tax reform for the governments of the newASEAN members, it is important to note that differing circumstances necessitate differingapproaches to taxation in developing countries compared to developed countries. The incidenceof market failure is higher in developing countries than in developed countries because developingmarkets are relatively less sophisticated and involve fewer market players. Developing countriesare also much more susceptible to the immense negative effects of extreme poverty. Therefore,developing countries have a strong justification to intervene in the economy by resorting to suchmeasures as corrective taxes and regulatory instruments. Given the magnitude of the economicand social problems that developing countries face, the potential advantages to be derived fromgovernmental intervention outweigh the potential cost of governments acting unsuccessfully.Therefore, the task of taxation in developing countries is likely to be more substantial than it isin developed countries (Burgess and Stern 1993).
In developing countries governments need substantial resources to finance their activities,but they raise less tax revenue than their more developed counterparts. Total tax revenue to GDPis higher and direct taxes to GDP form a greater portion of total revenue in developed countries.By contrast, in developing countries nontax revenue constitutes a relatively higher proportionof total revenue (see Table 1). However, nontax revenue is neither as consistent nor as sustainableas tax revenue. Nontax revenue is defined as revenue remitted by departmental and public
Table 1. Tax Revenue by Type of Tax in Industrial and Developing Countries
Income Taxes Domestic Taxes
Area Total Individual Corporate Other Total General Other Foreign Social Other NontaxSales, Taxes Security Taxes Revenue
Turnover,VAT
Industrial 33.47 24.31 8.99 0.17 29.00 18.60 10.40 0.89 26.41 1.08 9.14
Developing 21.21 9.37 11.41 0.44 31.90 21.31 10.59 16.15 17.06 -5.64 19.31
Africa 23.49 10.75 9.85 2.89 26.55 15.07 11.48 29.51 6.60 -1.49 15.34
Asia 25.76 10.53 16.56 -1.33 32.95 19.11 13.84 14.68 6.65 -1.59 21.56
Europe 14.74 7.83 7.52 -0.61 40.84 27.22 13.62 4.95 27.23 0.55 11.68
Middle East 17.75 13.10 10.34 -5.69 17.01 8.69 8.33 10.01 7.50 -0.90 48.63
WesternHemisphere 23.04 6.64 14.48 1.92 35.20 25.67 9.52 15.49 14.94 -5.30 16.63
Notes: Within the total of 108 developing countries there are 29 in Africa, 19 in Asia, 24 in Europe, 11 in the Middle East,and 25 in the Western Hemisphere region. The total number of industrial countries is 24.
Source: Government Finance Statistics Yearbook (IMF 2001).
3
enterprises from entrepreneurial and property income and administrative fees and charges. Manyliberalized developing countries plan to privatize public enterprises because the private sectorcan perform those economic functions more efficiently. Because nontax revenue will thereforedecline, these governments must garner more tax revenue. These facts all serve to suggest that,in consideration of overall economic priorities, developing countries urgently need to improve taxcollection more than developed countries.
B. ASEAN Countries
1. Tax Revenue Collection
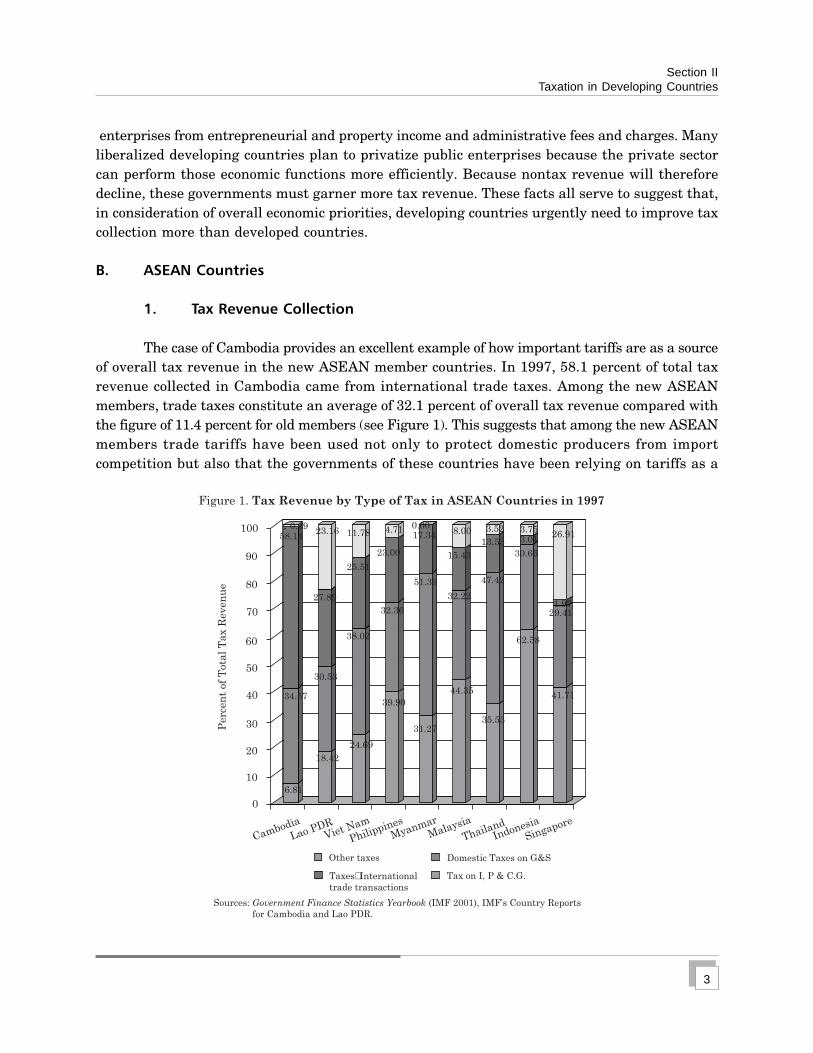
The case of Cambodia provides an excellent example of how important tariffs are as a sourceof overall tax revenue in the new ASEAN member countries. In 1997, 58.1 percent of total taxrevenue collected in Cambodia came from international trade taxes. Among the new ASEANmembers, trade taxes constitute an average of 32.1 percent of overall tax revenue compared withthe figure of 11.4 percent for old members (see Figure 1). This suggests that among the new ASEANmembers trade tariffs have been used not only to protect domestic producers from importcompetition but also that the governments of these countries have been relying on tariffs as a
Section IITaxation in Developing Countries
.100
90
80
70
60
50
40
30
20
10
0
6.81
0.49
18.42
24.69
39.90
62.58
41.71
31.27
44.35
35.53
23.16 11.78 4.71 0.008.00 3.52 3.75
26.913.01
1.9729.41
Perc
en
tof
Tota
lT
ax
Reven
ue
Cambodia
Lao PDRViet Nam
Philippines
Myanmar
Malaysia
ThailandIndonesia
Singapore
34.57
30.53
38.02
32.36
51.39
27.89
58.14
25.51
32.22
47.42
30.6623.00
17.34
15.43
13.53
Tax on I, P & C.G.
Domestic Taxes on G&S
Taxes International
trade transactions
�
Other taxes
Figure 1. Tax Revenue by Type of Tax in ASEAN Countries in 1997
Sources: (IMF 2001), IMF’s Country Reports
for Cambodia and Lao PDR.
Government Finance Statistics Yearbook

ERD Working Paper No. 29HOW CAN CAMBODIA, LAO PDR, MYANMAR, AND VIET NAM COPE WITH REVENUE LOST DUE TO AFTA TARIFF REDUCTIONS?
4
significant source of government revenue. Unfortunately for these countries, their adoption ofthe CEPT scheme is likely to reduce their overall revenue because the scheme reduces inter-ASEANtariff rates (see Figure 2). This change will be especially challenging for the new ASEAN membersbecause their tax bases have always been quite small, which means that they have limited optionsfor shifting this tax burden elsewhere. Informal and nonmonetarized activities, which by theirnature are not taxable, constitute a significant portion of the domestic economies of these countries.The bases for direct taxes on such items as income, profits, and capital gains are also highlyrestricted.
Cambodia Lao PDR Myanmar Viet Nam
1997
1998
1999
2000
70
60
50
40
30
20
10
0
Perc
en
tof
Tota
lR
even
ue
Sources: IMF Country Reports and Government Finance Statistics Yearbook 2001.
Figure 2. Taxes on International Trade in SEATEs 1997-2000
The tax bases of the new ASEAN member countries are restricted because there are veryfew taxpayers in their formal sectors who have high taxable income or consumption. Consequently,the governments of CLMV have low ratios of tax revenue to GDP. In Cambodia and Myanmartax revenue constitutes less than 10 percent of GDP (see Table 2). This suggests that Cambodiaand Myanmar are not putting enough effort into revenue collection and that perhaps excessiveadministrative constraints were already limiting their revenue regime prior to their ASEANaccessions. Since their accessions to ASEAN, the ratios of total revenue to GDP in CLMV havebeen falling. This phenomenon should motivate the governments of CLMV to begin efforts nowto compensate for such potential revenue loss throughout the 10-year period during which CEPTis to be implemented.

5
Section IITaxation in Developing Countries
Table 2. Total Revenue in the New ASEAN Member Countries
Fiscal Year 1995 1996 1997 1998 1999 2000 2001
Total Revenue to GDPCambodia n.a. n.a. 9.6 9.0 11.5 11.8 12.8b
Lao PDR n.a. n.a. 11.3 9.8 10.6 12.7e 14.9b
Myanmar n.a. n.a. 6.7 7.8 7.3 5.3e n.a.Viet Nam 22.6 22.3 20.0 19.6 19.2 20.7 18.5b
Tax Revenue to GDPCambodia n.a. n.a. 6.5 6.5 8.3 8.6 9.2b
Lao PDR n.a. n.a. 9.3 7.8 8.5 10.4e 11.8b
Myanmar n.a. n.a. 3.7 4.1 3.3 2.5e n.a.Viet Nam 17.5 18.5 15.8 15.4 15.2 14.9 14.4b
Tax on International Trade to GDPCambodia n.a. n.a. 3.8 3.6 3.8 3.3 2.9b
Lao PDR n.a. n.a. 3.2 2.7 2.9 2.7e 3.6b
Myanmar n.a. n.a. 0.1 0.1 0.0 0.0e n.a.Viet Nam 5.8 5.6 4.3 4.1 3.6 3.1 3.3b
Note: Superscript b denotes budget. Superscript e denotes estimation by IMF staff.Sources: Recent IMF Country Reports for Cambodia, Lao PDR, Myanmar, and Viet Nam.
2. Institutional Tax Structure
In considering the tax revenue disparity between developing and developed countries, itis tempting to assume that the cause stems from a difference between institutional structures,or in other words, that developed countries employ superior tax regimes and impose higher taxrates. However, upon closer examination, it becomes clear that the institutional structures andstatutory rates do not differ significantly, which in turn suggests that the solution to this problemmust be sought elsewhere. This section and Table 3 compare the personal income, corporate income,and domestic consumption tax rates of ASEAN and selected Organization for Economic Co-operationand Development (OECD) countries.
The rates for the top brackets of personal income tax in the selected developed countriesare higher than those of ASEAN-61 but comparable to those of the SEATEs, except for Cambodia.However, there are generally more brackets of taxable personal income in the ASEAN countriesthan in the selected OECD countries. This relatively larger number of income brackets suggeststhat the governments of the ASEAN countries are trying to use personal income tax to effect incomeredistribution.
Corporate income tax rates are generally the same in both ASEAN and OECD countries,the only noticeable difference being that some of the countries employ a single corporate incometax rate while others use multiple rates.
1 ASEAN-6 refers to the first six ASEAN members.

ERD Working Paper No. 29HOW CAN CAMBODIA, LAO PDR, MYANMAR, AND VIET NAM COPE WITH REVENUE LOST DUE TO AFTA TARIFF REDUCTIONS?
6
Table 3. Tax Rates for Major Taxes in ASEAN and Selected OECD Countries
Personal Income Tax Corporate Income Tax
Countries Tax Rates No. of Tax Rates No. of Consumption Tax(percent) Brackets (percent) Brackets Tax Rates & Type
ASEAN-6Brunei none none 30 1 NoneIndonesia 5-35 5 10, 15, 30 3 10% VATMalaysia 1-29 9 28 1 5, 10, 15% sales taxPhilippines 5-32 7 32 1 10% VATSingapore 3-26 9 26 1 3% sales taxThailand 5-33 5 30 1 7% VAT1
Southeast Asian Transitional Economies (SEATEs)Cambodia 5-20 4 9, 20, 30 3 10% VAT,
2% turnover taxLao PDR 5-40 8 20 1 5, 10% turnover taxMyanmar 3-50 11 5-25 10% VAT on services, and
multiple-rate(5-30%) turnover tax2
Viet Nam 10-50 6 45 1 5, 10, 20% VAT
Selected OECD CountriesJapan 10-37 4 30 1 5% sales taxUnited States 15-39.6 5 15-35 4 Different in each state
(0-8%), sales taxUnited Kingdom 10-40 3 10-30 5 17.5% VATGermany 19.9-48.5 3 25 1 16% VATFrance 8.25-53.25 6 33.33 1 19.6 VAT
Notes:1 VAT rate in Thailand will be reversed to 10% on 1 October 2002 if there is no further amendment.2 The turnover tax is called Commercial Tax. It is levied on domestically produced and imported goods and services.
In general, the OECD countries employ higher domestic consumption tax rates than theASEAN countries. Value Added Tax (VAT) is the most popular type of consumption tax both inOECD countries and among the original ASEAN member countries. Among the new ASEANmembers, Cambodia and Viet Nam have already adopted the VAT as their comprehensiveconsumption tax. However, Lao PDR is only considering adopting VAT in 2004 and Myanmar hasno plan to comprehensively implement VAT (see Table 4). At present Myanmar imposes VAT ona limited number of services, primarily on hotels in the capital region.

7
Table 4. Chronological History of ASEAN Membership and the VAT Adoption
ASEAN Membership
8 Aug 1967 ASEAN was established in Bangkok, Thailand, with five member countries:Indonesia, Malaysia, Philippines, Singapore, and Thailand
8 Jan 1984 Brunei Darussalam joined ASEAN.28 Jul 1995 Viet Nam joined ASEAN.24 Jul 1997 Lao PDR and Myanmar joined ASEAN.30 Apr 1999 Cambodia joined ASEAN.
VAT Introduction
1999 Cambodia1999 Viet Nam20041 Lao PDRNo plan Myanmar
1 According to Draft IMF/WB/ADB Report on Lao PDR: Public Expenditure Review (IMF 2002c).
III. IMPACTS OF CEPT AGREEMENTS
A. CEPT and AFTA
The CEPT scheme is a cooperative arrangement among ASEAN member countries thatreduces intraregional tariffs and nontariff barriers (NTBs). Signatory countries agree to removenontariff barriers within five years after joining CEPT. According to the scheme, members agreeto gradually reduce intraregional tariffs on imported goods2 to 0-5 percent over a 10-year period.ASEAN-6 countries started to implement the CEPT on 1 January 1993. Cambodia, Lao PDR,Myanmar, and Viet Nam will implement the CEPT Scheme on a different schedule. Viet Namwill reduce tariffs on all manufactured goods to 0-5 percent by 2006, Lao PDR and Myanmar by2008, and Cambodia by 2010.
The CEPT scheme is expected to make ASEAN’s manufacturing sector more efficient andcompetitive in the global market. AFTA has become a larger market for manufacturing producerswithin the region. Investors can enjoy economies of scale in production. Through this arrangement,ASEAN hopes to enhance competitiveness, improve the investment climate, and attract foreigndirect investment.
B. CEPT Product List
Under the CEPT scheme, each ASEAN member country must independently allocate goodsthat are subject to tariffs to one of four lists. The four lists determine the schedules according
Section IIIImpacts of CEPT Agreements
2 Imported goods include both (1) manufactured and processed agricultural products and (2) unprocessedagricultural and products. At least 40 percent of the contents must originate from any member of ASEAN inorder to be considered as ASEAN products.

ERD Working Paper No. 29HOW CAN CAMBODIA, LAO PDR, MYANMAR, AND VIET NAM COPE WITH REVENUE LOST DUE TO AFTA TARIFF REDUCTIONS?
8
to which each country will reduce tariff rates on listed goods. The names of the lists are: InclusionList (IL), Temporary Exclusion List (TEL), Sensitive List (SL), and General Exception List (GEL).The schedules for tariff rate reductions are also determined by the nature of the goods; manufacturedand processed agricultural products are subject to earlier rate reductions, not the nonprocessedagricultural products.
The IL contains goods on which each country agrees to reduce tariff rates within 10 yearsto 0-5 percent. The IL is also subdivided into two tracks, the Normal Track and the Fast Track.Each member is free to reduce tariff rates on goods in the Normal Track at any time over the10-year period. However, members are also encouraged to place as many goods as possible onthe Fast Track and to reduce tariff rates on goods in that track within five to eight years.
The TEL is intended to give countries leeway to put off tariff rate reductions on certaingoods of concern. Countries need not begin to reduce tariff rates on goods in the TEL during thefirst three years after joining CEPT. Thereafter, goods in the TEL are to be transferred to theIL gradually. The ASEAN secretariat recommends that members transfer goods from the TELto the IL in five equal installments so as to evenly distribute the revenue impact of tariff ratereductions.
The SL is meant to contain unprocessed agricultural goods that are of even greater concernto the member than those contained in the TEL. Eventually each member must reduce to 0-5percent the tariff rates on goods in the SL, but these reductions need not begin earlier than eightyears after joining CEPT, and members are given a period of nine years to complete those reductions.
Finally, the GEL contains goods that are not subject to tariff rate reductions. The provisionon General Exceptions in the CEPT Agreement is consistent with Article X of the GeneralAgreement on Tariffs and Trade (GATT). Goods may be placed on the GEL if such listing is deemednecessary for protecting national security, public morals, human/animal/plant life, and health.General Exception is also allowed for goods of artistic, historic, or archaeological value. GeneralException is normally applied to arms and weapons, alcoholic beverages,3 and tobacco products.
Once a member country has allocated goods to the four lists, it must submit its resultsto the ASEAN Council for approval. The lists are also reviewed annually and are thus subjectto annual revision. Since all members must reduce tariff rates on goods in the IL within 10 years,the ASEAN-6 countries must do so by 1 January 2003, Viet Nam by 2006, Lao PDR and Myanmarby 2008, and Cambodia by 2010. In addition to reducing tariff rates on goods in the IL, countriesmust remove quantitative restrictions and nontariff barriers on those goods (see Table 5).
3 Alcoholic beverages are classified under the GEL in all ASEAN countries except Myanmar, Philippines, andThailand.

9
Table 5. Schedule for Tariff Reduction under the CEPT Agreements
Country Manufactured and ProcessedAgricultural Goods Unprocessed Agricultural Goods
IL TEL IL TEL SL
ASEAN-6 (NT) 1993-2003(FT) 1993-2000 1996-2003 1996-2003 1997-2003 2001-2010
Viet Nam (NT) 1996-2006(FT) 1996-2003 1999-2006 1999-2006 2000-2006 2004-2013
Lao PDR and Myanmar (NT) 1998-2008(FT) 1998-2005 2001-2008 2001-2008 2002-2008 2006-2015
Cambodia (NT) 2000-2010(FT) 2000-2007) 2003-2010 2003-2010 2004-2010 2008-2017
Notes:1 IL means Inclusion List. Products in this list are subject to tariff rate reduction of 0-5 percent in 10 years.2 TEL means Temporary Exclusion List. Products in the TEL will be phased into the IL during the first five years in five
equal annual installments.3 SL means Sensitive List. This contains unprocessed agricultural products that will be phased in for tariff reduction in 10
years.4 NT means Normal Track. Products classified under NT are subject to tariff rate reduction of 0-5 percent in 10 years.5 FT means Fast Track. Products classified under FT are subject to tariff rate reduction of 0-5 percent in 5-8 years.Source: http://www.moc.go.th/thai/dbe/ecoco/rt/asean/afta.htm
C. Eligibility for CEPT Tariff Rate Reductions
In order for an exporter to enjoy reduced tariff rates under the CEPT scheme, the exportedgood must appear in the ILs of both the exporting and importing countries, must have been approvedby the AFTA Council as part of a tariff reduction program, and no less than 40 percent of its contentmust have originated from ASEAN member countries.4 Within the AFTA, each ASEAN membercountry has the right to set tariff rates on imports in accordance with the CEPT scheme. Therefore,one product may be subject to different tariff rates depending on which country in the free tradearea imports the good. Under other regional trade agreements such the European Union, all membercountries must apply the same tariff rates to the same imported goods.
D. Strategic Compliance with the CEPT Scheme
The AFTA is one of the least restrictive regional trading arrangements.5 Although membersmust remove barriers to intra-ASEAN trade, they are individually free to impose trade barriers
4 The local requirement refers to both single country and cumulative ASEAN content.5 Custom unions, common markets, and economic unions require that member countries adopt not only uniform
tariff rates on same products but also common external commercial relations such as a common external tariff.
Section IIIImpacts of CEPT Agreements
ERD Working Paper No. 29HOW CAN CAMBODIA, LAO PDR, MYANMAR, AND VIET NAM COPE WITH REVENUE LOST DUE TO AFTA TARIFF REDUCTIONS?
10
on nonmembers. This stands in contrast to the European Union (EU) and Mercosur (Argentina,Brazil, Paraguay, and Uruguay), in which members must impose uniform tariff rates on nonmembercountries. The CEPT scheme also gives members freedom to set tariffs on intra-ASEAN tradeat any rate between 0 and 5 percent. Furthermore, due to the Asian financial crisis of 1997, certainlong-standing member countries have not fully complied with requirements of the CEPT schemein spite of written deadlines, a fact that has not resulted in their exclusion from AFTA. Althoughthis is not to suggest that the new member countries should join the free trade area with theintention of not complying with CEPT requirements, they must take into consideration the actualbehavior of other members as well as any emergency circumstances that may arise.
According to the CEPT schedule, by 2017 all of the current ASEAN member countries mustreduce intra-ASEAN tariff rates on all but General Exception goods to a maximum of 5 percent(Table 5). Consequently, the new ASEAN members have considerable freedom to determine howthey will comply with the CEPT scheme. In one respect, the new members are free to set tariffrates on various goods in their IL anywhere in the range of 0-5 percent, which calls for carefulconsideration. The new ASEAN members must be careful to avoid overambitiously reducing tariffrates to 0 percent, as Lao PDR has done with certain goods. In another respect, the new membersare also free to determine which goods they will place on which list according to the strategicimportance of those goods.
It is important for the new ASEAN members to identify which goods they can or mightbe able to produce with a relative competitive edge so that they can add those products to theirILs and benefit from reduced tariffs when exporting those goods to other ASEAN countries. Atthe same time, they must also identify which of their own domestic industries need more timeto adjust to trade liberalization so that they can place those goods on their TELs or SLs.Unfortunately, it is not easy to identify which industries might enjoy a comparative advantage.Doing so requires that countries make accurate projections based on comprehensive informationfrom both the formal and informal sectors.
The ASEAN-6 member countries have not strictly observed CEPT tariff rate reductionschedules, especially since the outbreak of the 1997 Asian financial crisis. Certain countries haveyet to add numerous goods to their ILs even though their under-10-year limit has nearly expired.After the Asian financial crisis, the Malaysian government postponed the transfer of certainautomotive products from their TEL to their IL from the originally scheduled date of 1 January2003 to 2005.6 Some ASEAN members have recently been calling into question the practicalityof rules of origin for intra-ASEAN imports. It is particularly difficult for the less developed newASEAN member countries to identify the origins of imported goods’ content. Singapore has signedand is discussing more bilateral free trade agreements with several other non-ASEAN members.Some ASEAN member countries are concerned that goods from nonmember countries will flowinto ASEAN and enjoy the intra-ASEAN lower tariff rates via their routing through Singapore.
6 These are 218 line items in Malaysia’s TEL that are Completely Build-up and Completely Knock-Down automotiveproducts.
11
E. Revenue Impact of CEPT
The CEPT scheme seeks to make possible a freer flow of trade by reducing the inhibitingfactor of trade tariffs, which in turn is intended to facilitate local specialization and wealth creation.This advantage brings with it the expense of potentially reducing the revenue that member countriesderive from tariff revenues. Thus CEPT creates a trade-off between facilitating overall free tradeand reducing governmental tariff revenues. Countries that depend heavily on international tradetaxes as a source of governmental revenue stand to lose more than others. Thus, countries likeCambodia, where the majority of total tax revenue derives from trade taxes, are more concernedabout the revenue cost of participating in AFTA than they are about the benefit that ASEANmembership might bring in terms of export promotion (Menon 1998).
Menon (2000) analyzed the effect that the CEPT scheme would have on revenue in LaoPDR and concluded that the size of shortfall in revenue derived from tariffs would be moderate.Menon discussed several factors that suggest this conclusion, namely: (i) economic growth willlead to an increase in the volume of imports, (ii) a significant share of tariff revenue in the SEATEsis collected on goods that are in the GEL such as alcoholic beverages and cigarettes, and (iii) theshare of formal trade on which tariffs can be levied will increase, since there is less incentive forsmuggling when tariff rates are low. Menon also concluded that the overall impact of revenuefrom trade taxes in the absence of significant trade diversion would depend on (i) the size of thetariff reduction; (ii) the growth in recorded imports as a result of tariff cuts; and (iii) indirectly,through the increase in economic activity associated with trade liberalization.
The following sections investigate what impact joining the CEPT scheme will have on tariffrevenue in the new ASEAN member countries, taking into consideration how much revenue willbe lost as a result of tariff rate reduction, growth in imports, and tax reforms. Table 6 summarizesthe framework used to analyze the revenue impact of the CEPT.
1. Tax Revenue Reduction
This section estimates the baseline scenario in which import patterns do not change andno tax reforms are implemented. In estimating revenue loss, one must factor in the scheduledtransfers of line item goods from other lists to the Inclusion List. Each new ASEAN member hasadopted its own unique initial CEPT Product List and transferring schedule (see Table 5).
Ideally, the estimation for revenue loss should be based on all individual line items of theimported goods in the CEPT Product List. The latest schedule to which each country has committeditself for reducing tariff rates on each line item in the CEPT scheme, called 2001 CEPT package,is available for all member countries including the SEATEs. This information is posted on theASEAN Secretariat website. Table 7 summarizes the allocation of traded products among the fourCEPT lists.
Section IIIImpacts of CEPT Agreements

ERD Working Paper No. 29HOW CAN CAMBODIA, LAO PDR, MYANMAR, AND VIET NAM COPE WITH REVENUE LOST DUE TO AFTA TARIFF REDUCTIONS?
12
Table 6. Framework for Revenue Impact of the CEPT
Issues Considerations Criteria
Tax Revenue • Pre-accession tariff rates of tariff • The higher the proportion is for the low-Reduction lines in the CEPT Product List tariff-rate items in the CEPT List, the
• Nature of pre-AFTA imported goods: lower will be the lossGEL, SL, or normal goods • If a big share of imports will remain in
• Import concentration: from ASEAN the GEL, then the tariff revenue reductionor non-ASEAN countries will not be prominent
Growth in • Smuggling Premium (s), pre-AFTA (t(1)) • Unrecorded imports will transform(Recorded) Imports versus post-AFTA tariff rates (t(2)) to recorded imports if
• VAT on smuggling goods (v) in the t(1)> s+v > s > t(2).source country (see Menon 1999)
• Price elasticity of imported goods • Reduction in prices of imports induces ahigher volume of consumption such thatrevenue from trade taxes does not declinemuch
Tax Reforms • Surcharges on luxury imports • Surcharges on luxury and inelastic• Indirect taxes and direct taxes imports will lead to higher total trade tax
revenue despite lowering tariff rates• An introduction of VAT, a broad-based
consumption tax, can supplement taxrevenue collection
• Improvement of tax administration ofdirect taxes on individuals and companiescan lead to higher total tax revenue
Unfortunately, there are no widely disseminated statistics on either intra-ASEAN importvalue or on volume for each line item for each of the subject countries. Such statistics can onlybe obtained by inquiring with the customs departments of the respective countries. Due to resourcelimitations, that data was not available for this study. Customs departments are generally reluctantto publicly disclose detailed information about disaggregated values and volumes of trade becausegovernments normally use this information to set revenue targets. The sensitivity of such datamakes it difficult to quantitatively assess revenue loss from tariff rate reductions.
In lieu of the abovementioned data, it is also possible to assess revenue loss by examiningthe volume of each country’s intra-ASEAN imports along with its average tariff rate and theschedule of tariff reduction. The more each country relies on intra-ASEAN imports, the morerevenue will be lost from the reduction to tariff rates in the baseline scenario. Since the CEPTscheme will reduce tariff rates to 0-5 percent, any country that previously imposed tariff ratesmuch higher than 5 percent will lose relatively more revenue as a result of tariff rate reductions.

13
Section IIIImpacts of CEPT Agreements
Table 7. CEPT Product List for 2001
Country IL TEL SL GEL Total
ASEAN-6Brunei 6,284 0 6 202 6,492Indonesia 7,190 21 4 68 7,283Malaysia 9,654 218 83 53 10,008Philippines 5,622 6 50 16 5,694Singapore 5,821 0 0 38 5,859Thailand 9,104 0 7 0 9,111
ASEAN-6 Total 43,675 245 150 377 44,447(percent) (98.3) (0.6) (0.3) (0.8) (100.0)
SEATEsCambodia 3,115 3,523 50 134 6,822Lao PDR 1,673 1,716 88 74 3,551Myanmar 2,984 2,419 21 48 5,472Viet Nam 4,233 757 51 196 5,237
SEATEs Total 12,005 8,415 210 452 21,082(percent) (57.0) (39.9) (1.0) (2.1) (100.0)
ASEAN Total 55,680 8,660 829 360 65,529(percent) (84.7) (13.4) (1.3) (0.6) (100.0)
Source: ASEAN Secretariat (http://www.aseansec.org/economic/afta/tab3_14.htm).
It is difficult to find statistical evidence of the magnitude of intra-ASEAN imports forCambodia, Lao PDR, Myanmar, and Viet Nam. No single source states which of these countries’imports originate from ASEAN or non-ASEAN countries. The ASEAN website only provides thisinformation for the original ASEAN-6 countries. Fortunately, the Key Indicators 2002 (ADB 2002)does document the direction of imports from the top 10 imported sources. This information canbe used as a proxy for the import volume for the subject countries (see Table 8). The Handbookof Statistics 2001 (UNCTAD 2001) also provides some insights about imports from ASEAN forthese countries but there is no precise data (see Table 9). There is no such data in the IMF’s DOTStatistics Quarterly either.
Table 8 presents an approximation of intra-ASEAN imports for Cambodia, Lao PDR,Myanmar, and Viet Nam. In 2001 the ratio of imports from other ASEAN members to total importswas highest for Lao PDR (at least 82.7 percent), followed by Cambodia (at least 53.2 percent),Myanmar (at least 41.0 percent), and Viet Nam (at least 24.9 percent).

ERD Working Paper No. 29HOW CAN CAMBODIA, LAO PDR, MYANMAR, AND VIET NAM COPE WITH REVENUE LOST DUE TO AFTA TARIFF REDUCTIONS?
14
Table 8. Direction of Imports to SEATEs in 20011
Cambodia Lao PDR Myanmar Vietnam
Value (million US dollars)Total 2,183.4 859.7 2,806.2 16,652.7
Thailand 513.2 451.7 390.5 872.2Singapore 406.9 28.9 465.6 2315.7Malaysia 66.5 n.a. 224.5 523.5Viet Nam 100.7 230.8 n.a. 0.0Indonesia 73.8 n.a. 70.9 428.1
ASEAN2 1,161 711.4 1,151.5 4,139.5PRC 169.7 49.4 611.3 2032.9Hong Kong, China 288.5 9.8 79.8 602.6Korea, Rep. of 111.7 6.9 255.3 1904.8Japan 52.4 12.6 199.6 1986.2India n.a. n.a. 73.9 n.a.United States n.a. n.a. n.a. 499.6France 52.5 8.4 n.a. 442.4Germany n.a. 2.7 25.3 n.a.United Kingdom n.a. 3.6 n.a. n.a.
PercentageTotal 100.0 100.0 100.0 100.0Thailand 23.5 52.5 13.9 5.2Singapore 23.5 3.4 16.6 13.9Malaysia 3.0 n.a. 8.0 3.1Viet Nam 4.6 26.8 n.a. 0.0Indonesia 3.4 n.a. 2.5 2.6
ASEAN 53.2 82.7 41.0 24.9PRC 7.8 5.7 21.8 12.2Hong Kong, China 13.2 1.1 2.8 3.6Korea, Rep. of 5.1 0.8 9.1 11.4Japan 2.4 1.5 7.1 11.9India n.a. n.a. 2.6 n.a.United States n.a. n.a. n.a. 3.0France 2.4 1.0 n.a. 2.7Germany n.a. 0.3 0.9 n.a.United Kingdom n.a. 0.4 n.a. n.a.
1 From the first ten countries with the highest import value.2 This is not the total intra-ASEAN trade value. For the four member countries, statistics are only available for value of trade
with Indonesia, Malaysia, Singapore, Thailand, and Viet Nam.Source: Key Indicators 2002 (ADB 2002).
If a member country imported a certain volume of a line item from other ASEAN countriesprior to the reduction of tariff rates, one may assume that the country will continue to importat least that same volume, if not more. This is because the CEPT concessions will only reducethe cost of importing goods from another ASEAN member country. Hence, the ratio of intra-ASEANimports to total imports should increase and not decrease for goods in a country’s Inclusion List.

15
Table 9. Import Structure by Main Regions of Origin for SEATEs (percent)
Origin Developed Market Economy Developing CountriesCountries and Territories
Destination Year World Total EU US and Japan Eastern Total West Other(millions Canada European Asia1 Asia2
of USD) Countries
Cambodia 1990 56 37.5 25.7 0.0 9.0 2.5 60.0 3.5 55.81995 1573 15.6 6.9 2.0 5.4 0.1 82.6 0.0 82.51999 1241 18.6 7.4 3.4 6.0 0.9 68.4 0.0 68.32000 2002 12.1 6.0 1.7 3.1 0.3 79.0 0.0 78.9
Lao PDR 1990 149 25.9 9.0 0.8 14.5 0.0 73.6 0.1 73.21995 589 9.8 1.2 0.3 8.3 0.5 61.6 0.0 61.61999 629 10.4 5.8 0.2 4.0 0.9 86.6 0.0 86.62000 657 13.9 7.9 0.7 4.3 0.4 83.5 0.0 83.4
Myanmar 1980 785 78.0 20.9 7.0 43.7 3.8 18.1 0.0 15.71990 668 42.1 15.5 3.1 16.6 2.2 55.6 0.1 52.61995 2247 17.2 7.7 0.8 7.7 1.0 80.7 0.1 80.51999 2214 16.9 6.1 0.6 9.2 0.3 77.4 0.2 77.12000 2433 15.8 4.9 0.8 8.8 0.5 78.7 0.2 78.4
Viet Nam 1990 2842 16.4 9.4 0.2 5.9 11.4 28.5 0.0 28.11995 8155 23.5 8.1 1.9 11.2 2.5 54.7 0.0 54.71999 13232 28.4 9.3 2.7 13.6 2.2 53.6 0.2 52.82000 15878 27.2 7.8 2.6 14.0 2.0 55.6 0.2 54.9
Notes:1 West Asia includes Bahrain, Cyprus, Iraq, Iran, Jordan, Kuwait, Lebanon, Oman, Qatar, Saudi Arabia, Syria, Turkey, United
Arab Emirates, and Yemen.2 ASEAN countries are a subset of the category “Other Asia.” Other than ASEAN countries, other Asian countries in this
Handbook include Afghanistan; Bangladesh; Bhutan; People’s Republic of China; Hong Kong, China; India; Republic of Korea;Maldives; Mongolia; Nepal; Pakistan; Sri Lanka; and Taipei,China.
Source: Handbook of Statistics 2001 (UNCTAD 2001).
2. Average CEPT Tariff Rates
The average CEPT tariff rates on goods in the new members’ ILs vary considerably. In2001, the average CEPT tariff rate was highest for Cambodia, the newest ASEAN member, at10.4 percent; Myanmar had the lowest at 3.32 percent. Viet Nam is the oldest ASEAN memberamong SEATEs, but its average CEPT tariff rate was still relatively high at 7.09 percent the sameyear. The average CEPT tariff rate for Lao PDR in 2001 was 6.58 percent.
In addition to the evidence presented in Table 10, the effect that joining the CEPT schemewill have on the revenue of Cambodia, Lao PDR, Myanmar, and Viet Nam is indicated by (i) theportfolio of imported products in the CEPT lists presented in Table 7 and (ii) the degree and trendof each country’s dependence on imported taxes for overall tax revenue in Figures 1 and 2.
Section IIIImpacts of CEPT Agreements

ERD Working Paper No. 29HOW CAN CAMBODIA, LAO PDR, MYANMAR, AND VIET NAM COPE WITH REVENUE LOST DUE TO AFTA TARIFF REDUCTIONS?
16
Table 10. Average CEPT Tariff Rates by Countrya
2001 2002 2003
ASEAN-6Brunei 1.17 0.96 0.96Indonesia 4.36 3.73 2.16Malaysia 2.58 2.45 2.07Philippines 4.17 4.07 3.77Singapore 0.00 0.00 0.00Thailand 5.59 5.17 4.63
SEATEsCambodia 10.40 8.93 7.96Lao PDR 6.58 6.15 5.66Myanmar 3.32 3.31 3.19Viet Nam 7.09 n.a. n.a.
ASEAN-10Total 3.54 3.17 2.63
a Average rates are derived from weighted average of all products in the IL only.Source: ASEAN Secretariat.
Among the four countries, Cambodia will experience the greatest magnitude of tariff revenueloss as a result of committing to the CEPT scheme. This conclusion is suggested by the followingfacts: (i) Cambodia has the highest average tariff rate for goods in its IL, i.e. 10.40 percent; (ii)Cambodia has placed more goods on its TEL than Lao PDR, Myanmar, or Viet Nam;7 and (iii)a higher percentage of Cambodia’s total tax revenue derives from taxes on international tradethan any of the other new ASEAN members.
Imported goods are generally subject to trade tariffs, excise taxes, and domestic consumptiontaxes. Since the CEPT scheme reduces tariff rates, it should consequently reduce the amount thatconsumers pay for consumption taxes on imported products. However, from the perspective ofthe tax collector this implies both a direct and an indirect loss of tax revenue. In the first place,the government will be able to collect less revenue from tariffs because of reduced tariff rates.Secondly, because the cost of imports to consumers is lower, the government will also collect lessrevenue from consumption taxes.8 This point reemphasizes how important it is for Cambodia,Lao PDR, Myanmar, and Viet Nam to reform their tax structures in order to cushion the potentiallynegative impact on their tax revenue collection of accession to ASEAN.
3. Import Growth from Tariff Reduction
Trade liberalization in the form of reduced tariff rates may stimulate growth in recordedimports (i) because importers might choose to begin recording imports that they previously did
7 Without precise data on the volume of trade for each good, it is impossible to quantitatively predict how muchrevenue will be lost as a result of tariff rate reductions. Therefore, these predictions are based on the law ofpossibility.
8 Consumption tax collection can be calculated from the following formula: Consumption Tax Collection = [(importvalue + import duties) x average effective rate of consumption tax]

17
not report and (ii) because of the price effect. If this were to occur, then governments might beable to maintain previous levels of or even to increase the amount of revenue that they collectfrom tariffs, even though tariff rates are reduced. In the first instance, consumers of importedgoods will increasingly begin to record imports if they expect that the newly reduced tariff rateswill be less costly to them than the smuggling premium. This is particularly relevant to Cambodia,Lao PDR, Myanmar, and Viet Nam where unrecorded trade is prevalent. Empirical evidence thatthe price effect can stimulate growth in imports is provided by the case of the Philippines in thelate 1980s. At that time tax reforms and trade liberalization were accompanied by a new surchargeon nonoil imports. As a result, the ratio of trade taxes to GDP and to total tax revenue increasedsignificantly even as the rates of trade taxes declined modestly (Ebril et al. 1999, 11).
While they were implementing the CEPT scheme during the 1990s, recorded importsincreased in each of the ASEAN-6 countries. In fact, the average annual rate of growth in importswas higher in the 1990s than it was during the 1980s for all of the ASEAN-6 countries exceptSingapore and Thailand (see Table 11).
Table 11. Average Annual Growth Rate of Imports (percent)
1980- 1990- 1980- 1985- 1990- 1995- 1995- 1996- 1997- 1998- 1999-1990 2000 1985 1990 1995 2000 1996 1997 1998 1999 2000
World 6.1 6.5 -0.5 12.4 7.0 3.8 4.9 3.4 -1.4 4.3 12.4
DevelopedCountries 7.0 5.7 -0.4 13.3 5.1 4.2 3.7 2.2 2.4 5.2 10.0
DevelopingCountries 4.3 8.4 -1.6 12.7 12.6 3.0 6.5 5.7 -9.7 4.5 18.3
Asia 6.8 8.2 2.3 14.8 13.8 1.9 6.5 2.7 -14.9 7.5 22.5
People’s Republicof China 13.5 12.6 13.8 7.0 20.2 8.5 7.6 2.3 -1.3 18.2 24.3
ASEAN-6 7.2 7.9 0.6 21.5 16.5 -2.0 5.8 -1.0 -24.2 7.1 22.8Brunei 3.8 4.5 1.2 10.4 15.9 -7.4 20.0 -11.7 -29.6 38.3 -33.5Indonesia 2.6 2.7 -0.5 15.7 11.4 -8.5 5.7 -2.9 -34.4 -12.2 39.8Malaysia 7.7 9.7 3.8 21.5 20.3 -1.0 0.9 0.8 -26.2 11.4 32.4Philippines 2.9 12.0 -8.1 21.5 17.9 1.5 20.4 13.2 -18.5 3.4 3.8Singapore 8.0 7.8 1.6 20.4 15.6 -1.0 5.5 0.8 -20.9 6.1 21.1Thailand 12.7 5.0 1.0 32.7 15.5 -5.9 2.2 -13.1 -31.6 17.2 23.0
SEATEsCambodia -5.0 20.9 -18.7 24.6 46.2 0.9 -9.7 -0.7 3.1 4.8 4.3Lao PDR 6.6 12.6 15.3 -1.3 32.5 -4.7 17.1 2.4 -21.7 -5.1 -0.7Myanmar -4.7 22.6 -7.9 -4.8 29.9 14.4 1.8 50.0 30.9 -13.7 3.0Viet Nam 8.7 23.3 7.3 7.7 27.9 11.6 36.7 4.0 -0.8 15.1 20.0
Source: Handbook of Statistics 2001 (UNCTAD 2001).
While they were continuously reducing tariff rates on intra-ASEAN imports from 1994to 2000, the ratio of intra-ASEAN to total imports generally increased for all of the ASEAN-6countries (see Table 12 and Figure 3). By analogy, it is also expected that the new members’ intra-ASEAN imports will increase throughout the 10-year period within which Cambodia, Lao PDR,Myanmar, and Viet Nam will be implementing the CEPT scheme. However, the increased import
Section IIIImpacts of CEPT Agreements

ERD Working Paper No. 29HOW CAN CAMBODIA, LAO PDR, MYANMAR, AND VIET NAM COPE WITH REVENUE LOST DUE TO AFTA TARIFF REDUCTIONS?
18
volume under the new tariff regime may still not provide sufficient revenue for these governments.Government revenue under the new tariff reduction scheme must be kept consistent with thegovernments’ increasing responsibility in a changing environment. Even though the governmentsof these four countries have been reducing their activity as central planners, they should not allowthis to translate into reductions of effective social programs for the poor and underprivileged. Inorder to maintain such important social programs these governments must compensate for revenuelost from reduced rates on import duties by recourse to other buoyant taxes.
Table 12. Intra-ASEAN Imports as a Percentage of Total Import
1994 1995 1996 1997 1998 1999 2000
Brunei 49.16 47.50 64.23 42.27 46.31 52.06 50.05Indonesia 9.40 10.38 11.90 12.99 16.68 19.93 20.23Malaysia 19.19 17.53 19.50 19.28 21.22 19.49 20.01Philippines 11.57 11.50 14.13 13.56 14.93 14.51 15.79Singapore 22.72 22.28 22.17 22.36 23.30 23.64 24.72Thailand 12.98 12.15 13.47 12.87 14.05 16.53 17.00Total 17.55 16.83 18.31 18.15 19.89 20.32 20.95
Source: ASEAN Secretariat Website (http://www.asean.or.id/1024x768.html).
70
60
50
40
30
20
10
0
Perc
en
tof
Tota
lIm
port
1994 1995 1996 1997 1998 1999 2000
Brunei
Indonesia
Malaysia
Philippines
Singapore
Thailand
Total
Figure 3. Intra-ASEAN Imports as a Percentage of Total Imports

19
IV. TAX REFORMS
Due to their commitment to reduce tariff rates according to the schedules under the CEPTscheme, the governments of Cambodia, Lao PDR, Myanmar, and Viet Nam will have to rely lesson trade taxes as a source of total tax revenue. Consequently, these countries now realize theurgency of reforming their tax structures to cope with the expected losses in the medium to longterm. As Pich Rithi, Deputy Director-General of Ministry of Commerce, Cambodia stated in hisspeech (see http://www.moc.gov.kh/econo_intergration/impage_economic-trade.htm) on the impactof economic and trade liberalization on Cambodia, the first challenge that Cambodia will be facingin joining ASEAN is the expected loss of import tax revenue. He concluded that, “Cambodia needsto reform its tax structure in order to compensate for the expected loss of import duties in thecoming 10-15 years.”
Effecting the type of tax reforms referred to above normally involves replacing trade taxeswith domestic indirect taxes, which are less distorted in terms of resource allocation andconsumption. Developing countries generally tend to depend on import duties to generate revenueand to protect domestic import-substitution industries. These import duties raise the domesticprice of imported goods. Therefore, they discourage the domestic consumption of imported goodsand consequently encourage the allocation of resources to inefficiently produce the same goodsdomestically.
A. Introduction of the Value Added Tax
In order to facilitate trade liberalization, many developing countries have introduced ValueAdded Tax (VAT). Implementing VAT can help to compensate for the revenue that is often lostwhen a country reduces or eliminates import duties. This form of tax also complements a policyof trade promotion because VAT is broad-based and a trade-neutral, domestic indirect tax. VATis normally administrated using the credit mechanism and is based on the destination principle.The credit mechanism allows sellers to claim credit for any VAT that they pay when purchasinginputs that are required to produce the goods or services that they sell. The sellers are eligibleto redeem those VAT credits against any VAT that they are liable to pay when they sell the goodsor services. Sellers claim those VAT credits by providing invoices for the VAT that they paid ontheir inputs. In this regard, VAT has the advantage of discouraging tax evasion because taxpayersthemselves wish to pay and obtain receipts for VAT paid on inputs purchased in order to be ableto claim credit against the VAT they themselves will be required to pay at the point of sellingtheir end product or service. Since receipts are required at both ends of the transaction, taxpayersthemselves provide checks against one another. The same cannot be said for other types of generalsales taxes such as turnover tax and retail sales taxes.
The destination principle is consistent with the General Agreement on Tariffs and Trade(GATT) guidelines, which stipulate that taxes on goods and services be levied in the country wherethey are consumed (destination principle) rather than where they are produced (origin principle).
Section IVTax Reforms

ERD Working Paper No. 29HOW CAN CAMBODIA, LAO PDR, MYANMAR, AND VIET NAM COPE WITH REVENUE LOST DUE TO AFTA TARIFF REDUCTIONS?
20
In other words, the destination principle requires that taxes be imposed on imports while exportsare not subject to taxation. Therefore, domestic and foreign producers are able to compete on aneven playing field because their goods are subject to the same consumption tax rates.9
VAT is levied on a broad-based domestic consumption but effectively leaves a zero tax rateon exports. Therefore, VAT complements the type of export-oriented economic stance that all ofthe AFTA members have adopted. VAT collections in Cambodia and Viet Nam have proven tobe very buoyant. From 1996 to 1998 the government of Viet Nam collected an amount of revenuethrough turnover tax equivalent to 11.1 to 11.8 percent of its GDP. Since VAT replaced turnovertax in 1999 the government has collected through VAT revenue amounting to more than 17 percentof its GDP from 1999 to 2001 (IMF Country Report No. 02/5). In Cambodia, the sales tax-to-GDPratio prior the VAT introduction in 1999 was only 0.7 and 0.9 percent in 1997 and 1998. Since1999, the ratio increased to 2.7-3.2 percent from 1999 to 2001 (IMF Country Report No. 02/24).
B. Surcharges on Luxuries and Nonessentials
While reducing the intra-ASEAN tariff rates, new ASEAN member countries can temporarilyimpose surcharges on luxuries and nonessentials in order to safeguard tariff revenue loss.10
However, such surcharges must also be levied on domestically produced luxuries according to theGeneral Most-Favored-Nation Treatment Principle of the GATT. Most luxury products are notlocally produced in the new ASEAN member countries. This temporary revenue measure cancompensate the tariff revenue loss without damaging local industries during the transitional periodof greater liberalization. The governments of CLMV should also note that the GATT allows countriesthat experience a Balance of Payment Crisis to raise custom duties and impose quota restrictionof importation.11 However, such relief must be approved and is subject to periodic review by theWorld Trade Organization in consultation with the International Monetary Fund.
C. Simplification of Tax Structure
The governments of Cambodia, Lao PDR, Myanmar, and Viet Nam should simplify theirtax structures and make them more transparent in order to improve the efficiency of taxadministration and to make it easier for taxpayers to pay taxes. International experiences suggestthe following reforms. A single tax rate is preferred to multiple tax rates in corporate income taxand general consumption taxes (with exemptions on some necessary goods such as unprocessedfood and medicines). The corporate income tax should be levied in a single statutory rate equivalent
9 Of course, imported goods are subject to additional costs, such as overseas shipping and handling costs andimport duties before consumption taxes are levied. By contrast domestic goods are not subject to handling costsand import duties.
10 Examples of luxury goods include yachts, perfumes, chandeliers, lead crystals, air conditioners, wool carpets,cigars, etc.
11 See details in GATT Articles XII and XV.

21
to the highest personal income tax. The top marginal rates for personal income taxes should bekept between 30 to 50 percent so that they do not discourage individuals from earning more incomeor evading taxes. Tax exemptions and allowances or tax expenditures should be minimized. Theseprovisions not only erode the already narrow tax bases in developing countries, but also complicatetax administration (World Bank 1991).
D. Tax Administration Reforms
The governments of Cambodia, Lao PDR, Myanmar, and Viet Nam have considerable roomto improve both their tax administrations and their tax collecting efforts. These governmentscollected low levels of revenue as a percentage to GDP prior their ASEAN accessions. Thecommitment to the CEPT will only put more pressure on these governments to improve their taxefforts and administration while implementing other structural reforms.
Tax administration reforms involve the following issues: administrative and legalarrangements, organization, management, functions, and resources of tax administration.
1. Legal Arrangements, Organization, and Management
The responsibilities of the two main administration bodies responsible for tax collectionand tax and customs administration must be clearly defined and their efforts must be synchronizedwith the entire tax and public administrative systems. In order to establish efficient, effective,and targeted tax arrangements each government must assess the (i) respective levels ofadministrative capacity and (ii) must coordinate the activities of the tax and customsadministrations. Each government must decide which of the two administrations is responsiblefor collecting what aspect of VAT and under what circumstances. They also need to clearly definethe responsibilities of both national and subnational tax administrations. The governments shouldalso aim to improve coordination among all VAT collectors. Some recent innovations regardingtax administration organization include the creation of a separate Tax Police and a Large TaxpayerUnit. The purpose for establishing a Tax Police is to assess accuracy of tax filing and paymentso as to discourage both tax avoidance and evasion among taxpayers as well as rent-seeking activitiesamong tax collectors. The purpose for establishing a Large Tax Unit is to increase cost efficiencyin collecting taxes. Due to the existing high income disparity, large taxpayers contribute a relativelyhigher proportion to total revenue in Cambodia, Lao PDR, Myanmar, and Viet Nam than do largetaxpayers in other ASEAN member countries.
2. Functions and Resources
The main functions of tax administration include (i) information-related functions in dealingwith taxpayers, (ii) actual tax collection and sanctioning noncompliance, and (iii) internationaltax cooperation with other tax administrations.
Section IVTax Reforms

ERD Working Paper No. 29HOW CAN CAMBODIA, LAO PDR, MYANMAR, AND VIET NAM COPE WITH REVENUE LOST DUE TO AFTA TARIFF REDUCTIONS?
22
In dealing with taxpayer information, a tax administration largely involves gathering andprocessing information. To obtain information from taxpayers, an effective and efficient taxadministration must employ a good system for assigning identification numbers to and registeringtaxpayers. The information function also encompasses the tax withholding system, assessing assetownership, and educating taxpayers about tax compliance in order to keep their compliance costslow.
In terms of tax collection, an efficient filing system and accurate assessment of taxpayers’tax liability improve the efficiency and effectiveness of tax administration. A reliable and effectivetax auditing system is also necessary to improve tax compliance. Actual tax collection requiresmechanical collection of taxes from both taxpayers who make payments on time and from thosewho delay tax payments.
In an increasing globalized world, international tax cooperation with other administrationshas become increasingly beneficial to improve tax administration. Exchanging information on lessonslearned and cooperating in tax collection puts tax authorities in a better position to cope withtax collection problems in a more complex environment. In the Asian and Pacific region, the StudyGroup on Asian Tax Administration and Research (SGATAR) holds annual meetings to discussissues related to tax administration and cooperation among group members.12 The governmentsof CLMV have not yet been actively involved in SGATAR, but they should consider getting involvednow as they have been engaging in greater liberalization.
Computerization, modernization, and harmonization of import declarations should be madea priority in order to facilitate effective and efficient tax administration. More importantly, goodsystems and equipments must be operated by capable and honest tax officials.
V. CONCLUSIONS
Over the long term, the ASEAN seeks to improve the efficiency of trade among membercountries by reducing tariff barriers to intra-ASEAN trade. This objective assumes that free tradewill benefit all participants by allowing each to develop those goods and services that they canproduce more efficiently and cost effectively than can their competitors. Unfortunately, for latejoiners of the Association, ASEAN membership will likely reduce the amount of revenue that theirgovernments will be able to derive from trade tariffs because it forces governments to reduce tariffrates.
There are four measures that new ASEAN member countries can implement in order toreduce the negative impact on the amount of revenue that they derive from taxation. First, they
12 SGATAR was established in 1970 for organizing loose and informal meetings among selected Asian taxadministrations. Members of SGATAR include Australia; People’s Republic of China; Hong Kong, China;Indonesia; Japan; Republic of Korea; Malaysia; New Zealand; Philippines; Singapore; Taipei,China; and Thailand.So far, there are 31 meetings held in different member countries. The 32nd meeting is in Thailand in November2002.
23
Selected References
can strategically allocate goods among the four CEPT scheme lists so as to minimize the tariffsthat will be imposed on the goods that promote the production of goods that they most wish toexport while simultaneously maximizing the amount of revenue that they are able to garner fromimports. Second, the new member countries can improve their tax systems by replacing traditionalgeneral sales taxes with VAT and generally simplifying their tax structures. Third, they can reduceinefficiencies that impede tax collection by improving tax administration institutions and toolsof tax administration such as information systems, statistical indicators, etc. Finally, they canimprove their overall legal systems so as to discourage tax avoidance and evasion and reducecorruption among tax officials.
SELECTED REFERENCES
Abed, G. T., 1998. Fiscal Reforms in Low-Income Countries: Experience Under IMF-SupportedPrograms. IMF Occasional Paper 160, International Monetary Fund, Washington, D. C.
Asian Development Bank (ADB), 2002. Key Indicators 2002. Hong Kong, China: Oxford UniversityPress for the Asian Development Bank.
Bird, R. M., and M. Casanegra de Jantscher, eds. 1992. Improving Tax Administration In DevelopingCountries. International Monetary Fund, Washington, D. C.
Bird, R. M., 1992. Tax Policy and Economic Development. Baltimore: John Hopkins UniversityPress.
Burgess, R., and N. Stern, 1993. “Taxation and Development.” Journal of Economic DevelopmentXXXI:762-830.
De la Torre, O. and M. Kelly, 1992. Regional Trade Arrangements. International Monetary FundOccasional Paper No. 93, International Monetary Fund, Washington, D. C.
Ebril, L., J. Stotsky, and R. Gropp, 1999. Revenue Implications of Trade Liberalization. IMFOccasional Paper 180, International Monetary Fund, Washington, D. C.
Gillis, M., ed., 1989. Tax Reform in Developing Countries. Durham: Duke University Press.Gillis, M., C. Shoup, and G. Sicat, eds., 1990. Value Added Taxation in Developing Countries. The
World Bank, Washington, D. C..International Monetary Fund (IMF), 2001. Myanmar: Statistical Appendix. IMF Country Report
No. 01/8, Washington, D. C., 2002a. Vietnam: Selected Issues and Statistical Appendix. IMF Country Report No.
02/5, Washington, D. C., 2002b. Cambodia: Statistical Appendix. IMF Country Report No. 02/24, Washington,
D. C., 2002c. Lao People’s Democratic Republic: Selected Issues and Statistical Appendix.
IMF Country Report No. 02/61, Washington, D. C.Khalilzadeh-Shirazi, J., and A. Shah, eds., 1991. Tax Policy in Developing Countries. The World
Bank, Washington, D. C.

ERD Working Paper No. 29HOW CAN CAMBODIA, LAO PDR, MYANMAR, AND VIET NAM COPE WITH REVENUE LOST DUE TO AFTA TARIFF REDUCTIONS?
24
Lee, T. Y., 1994. “The ASEAN Free Trade Area.” Asia-Pacific Economic Literature 8(1):1-7.Menon, J., 1998. “The Expansion of the ASEAN Free Trade Area.” Asia-Pacific Economic Literature
12:10-22., 1999. “Transitional Economies in Free Trade Area: Lao PDR in AFTA.” Journal of
the Asia-Pacific Economy 4 (2):340-64.Mitra, P. K., 1994. “Tariff Design and Reform in a Revenue-Constrained Economy: Theory and
Illustration from India.” In A. Bagchi and N. Stern, eds., Tax Policy and Planning in DevelopingCountries. Delhi: Oxford University Press.
Newbery, D., and N. Stern, eds., 1987. The Theory of Taxation for Developing Countries. The WorldBank, Washington, D. C.
Ng, J., 2001. “AFTA and ‘East Asian Economic Zone’.” Available: http://www.npf.org.tw/Symposium/s90/900921-TE-2-2.htm.
Rithi, P., 2002. “Impact of Economic and Trade Liberalization on Cambodia.” Available: http://www.moc.gov.kh/econo_intergration/image_economic-trade.htm.
Tait, A. A., ed., 1991. Value-Added Tax: Adminsitrative and Policy Issues. IMF Occasional Paper180, International Monetary Fund, Washington, D. C.
Tan, J., ed., 1986. AFTA in the Changing International Economy. Singapore: Institute of SoutheastAsian Studies.
UNCTAD, 2001. Handbook of Statistics 2001. United Nations Conference on Trade andDevelopment, Geneva.
World Bank, 1991. Lessons of Tax Reforms. Washington, D. C.

25
PUBLICATIONS FROM THEECONOMICS AND RESEARCH DEPARTMENT
ERD WORKING PAPER SERIES (WPS)(Published in-house; Available through ADB Office of External Relations; Free of Charge)
No. 1 Capitalizing on Globalization—Barry Eichengreen, January 2002
No. 2 Policy-based Lending and Poverty Reduction:An Overview of Processes, Assessmentand Options—Richard Bolt and Manabu Fujimura
January 2002No. 3 The Automotive Supply Chain: Global Trends
and Asian Perspectives—Francisco Veloso and Rajiv Kumar
January 2002No. 4 International Competitiveness of Asian Firms:
An Analytical Framework—Rajiv Kumar and Doren Chadee
February 2002No. 5 The International Competitiveness of Asian
Economies in the Apparel Commodity Chain—Gary Gereffi
February 2002No. 6 Monetary and Financial Cooperation in East
Asia—The Chiang Mai Initiative and Beyond—Pradumna B. Rana
February 2002No. 7 Probing Beneath Cross-national Averages: Poverty,
Inequality, and Growth in the Philippines—Arsenio M. Balisacan and Ernesto M. Pernia
March 2002No. 8 Poverty, Growth, and Inequality in Thailand
—Anil B. DeolalikarApril 2002
No. 9 Microfinance in Northeast Thailand: Who Benefitsand How Much?—Brett E. Coleman
April 2002No. 10 Poverty Reduction and the Role of Institutions in
Developing Asia—Anil B. Deolalikar, Alex B. Brilliantes, Jr.,
Raghav Gaiha, Ernesto M. Pernia, Mary Raceliswith the assistance of Marita Concepcion Castro-Guevara, Liza L. Lim, Pilipinas F. QuisingMay 2002
No. 11 The European Social Model: Lessons forDeveloping Countries—Assar Lindbeck
May 2002No. 12 Costs and Benefits of a Common Currency for
ASEAN—Srinivasa Madhur
May 2002No. 13 Monetary Cooperation in East Asia: A Survey
—Raul FabellaMay 2002
No. 14 Toward A Political Economy Approachto Policy-based Lending—George Abonyi
May 2002No. 15 A Framework for Establishing Priorities in a
Country Poverty Reduction Strategy—Ron Duncan and Steve Pollard
June 2002No. 16 The Role of Infrastructure in Land-use Dynamics
and Rice Production in Viet Nam’s Mekong RiverDelta
—Christopher EdmondsJuly 2002
No. 17 Effect of Decentralization Strategy onMacroeconomic Stability in Thailand—Kanokpan Lao-Araya
August 2002No. 18 Poverty and Patterns of Growth
—Rana Hasan and M. G. QuibriaAugust 2002
No. 19 Why are Some Countries Richer than Others?A Reassessment of Mankiw-Romer-Weil’s Test ofthe Neoclassical Growth Model—Jesus Felipe and John McCombie
August 2002No. 20 Modernization and Son Preference in People’s
Republic of China—Robin Burgess and Juzhong Zhuang
September 2002No. 21 The Doha Agenda and Development: A View from
the Uruguay Round—J. Michael Finger
September 2002No. 22 Conceptual Issues in the Role of Education
Decentralization in Promoting Effective Schoolingin Asian Developing Countries—Jere R. Behrman, Anil B. Deolalikar, and Lee-
Ying SonSeptember 2002
No. 23 Promoting Effective Schooling through EducationDecentralization in Bangladesh, Indonesia, andPhilippines—Jere R. Behrman, Anil B. Deolalikar, and Lee- Ying Son
September 2002No. 24 Financial Opening under the WTO Agreement in
Selected Asian Countries: Progress and Issues—Yun-Hwan Kim
September 2002No. 25 Revisiting Growth and Poverty Reduction in
Indonesia: What Do Subnational Data Show?—Arsenio M. Balisacan, Ernesto M. Pernia, and Abuzar Asra October 2002
No. 26 Causes of the 1997 Asian Financial Crisis: WhatCan an Early Warning System Model Tell Us?—Juzhong Zhuang and J. Malcolm Dowling October 2002
No. 27 Digital Divide: Determinants and Policies withSpecial Reference to Asia—M. G. Quibria, Shamsun N. Ahmed, TedTschang, and Mari-Len Reyes-Macasaquit October 2002
No. 28 Regional Cooperation in Asia: Long-term Progress,Recent Retrogression, and the Way Forward—Ramgopal Agarwala and Brahm Prakash
October 2002No. 29 How can Cambodia, Lao PDR, Myanmar, and Viet
Nam Cope with Revenue Lost Due to AFTA TariffReductions?—Kanokpan Lao-Araya
November 2002
26
MONOGRAPH SERIES(Published in-house; Available through ADB Office of External Relations; Free of charge)
EDRC REPORT SERIES (ER)
ERD POLICY BRIEF SERIES (PBS)(Published in-house; Available through ADB Office of External Relations; Free of charge)
No. 1 Is Growth Good Enough for the Poor?—Ernesto M. Pernia, October 2001
No. 2 India’s Economic ReformsWhat Has Been Accomplished?What Remains to Be Done?—Arvind Panagariya, November 2001
No. 3 Unequal Benefits of Growth in Viet Nam—Indu Bhushan, Erik Bloom, and Nguyen MinhThang, January 2002
No. 4 Is Volatility Built into Today’s World Economy?—J. Malcolm Dowling and J.P. Verbiest,February 2002
No. 5 What Else Besides Growth Matters to PovertyReduction? Philippines—Arsenio M. Balisacan and Ernesto M. Pernia,February 2002
No. 6 Achieving the Twin Objectives of Efficiency andEquity: Contracting Health Services in Cambodia—Indu Bhushan, Sheryl Keller, and BradSchwartz,March 2002
No. 7 Causes of the 1997 Asian Financial Crisis: WhatCan an Early Warning System Model Tell Us?—Juzhong Zhuang and Malcolm Dowling,June 2002
No. 8 The Role of Preferential Trading Arrangementsin Asia—Christopher Edmonds and Jean-Pierre Verbiest,July 2002
No. 9 The Doha Round: A Development Perspective—Jean-Pierre Verbiest, Jeffrey Liang, and LeaSumulong, July 2002
No. 1 ASEAN and the Asian Development Bank—Seiji Naya, April 1982
No. 2 Development Issues for the Developing Eastand Southeast Asian Countriesand International Cooperation—Seiji Naya and Graham Abbott, April 1982
No. 3 Aid, Savings, and Growth in the Asian Region—J. Malcolm Dowling and Ulrich Hiemenz,
April 1982No. 4 Development-oriented Foreign Investment
and the Role of ADB—Kiyoshi Kojima, April 1982
No. 5 The Multilateral Development Banksand the International Economy’s MissingPublic Sector—John Lewis, June 1982
No. 6 Notes on External Debt of DMCs—Evelyn Go, July 1982
No. 7 Grant Element in Bank Loans—Dal Hyun Kim, July 1982
No. 8 Shadow Exchange Rates and StandardConversion Factors in Project Evaluation—Peter Warr, September 1982
No. 9 Small and Medium-Scale Manufacturing
Establishments in ASEAN Countries:Perspectives and Policy Issues—Mathias Bruch and Ulrich Hiemenz,
January 1983No. 10 A Note on the Third Ministerial Meeting of GATT
—Jungsoo Lee, January 1983No. 11 Macroeconomic Forecasts for the Republic
of China, Hong Kong, and Republic of Korea—J.M. Dowling, January 1983
No. 12 ASEAN: Economic Situation and Prospects—Seiji Naya, March 1983
No. 13 The Future Prospects for the DevelopingCountries of Asia—Seiji Naya, March 1983
No. 14 Energy and Structural Change in the Asia-Pacific Region, Summary of the ThirteenthPacific Trade and Development Conference—Seiji Naya, March 1983
No. 15 A Survey of Empirical Studies on Demandfor Electricity with Special Emphasis on PriceElasticity of Demand—Wisarn Pupphavesa, June 1983
No. 16 Determinants of Paddy Production in Indonesia:1972-1981–A Simultaneous Equation Model
ERD TECHNICAL NOTE SERIES (TNS)(Published in-house; Available through ADB Office of External Relations; Free of Charge)
No. 1 Contingency Calculations for EnvironmentalImpacts with Unknown Monetary Values—David Dole February 2002
No. 2 Integrating Risk into ADB’s Economic Analysisof Projects—Nigel Rayner, Anneli Lagman-Martin,
and Keith Ward June 2002
No. 3 Measuring Willingness to Pay for Electricity—Peter Choynowski
July 2002No. 4 Economic Issues in the Design and Analysis of a
Wastewater Treatment Project—David Dole
July 2002No. 5 An Analysis and Case Study of the Role of
Environmental Economics at the AsianDevelopment Bank—David Dole and Piya Abeygunawardena
September 2002

27
Approach—T.K. Jayaraman, June 1983
No. 17 The Philippine Economy: EconomicForecasts for 1983 and 1984—J.M. Dowling, E. Go, and C.N. Castillo,
June 1983No. 18 Economic Forecast for Indonesia
—J.M. Dowling, H.Y. Kim, Y.K. Wang,and C.N. Castillo, June 1983
No. 19 Relative External Debt Situation of AsianDeveloping Countries: An Applicationof Ranking Method—Jungsoo Lee, June 1983
No. 20 New Evidence on Yields, Fertilizer Application,and Prices in Asian Rice Production—William James and Teresita Ramirez, July 1983
No. 21 Inflationary Effects of Exchange RateChanges in Nine Asian LDCs—Pradumna B. Rana and J. Malcolm Dowling, Jr., December 1983
No. 22 Effects of External Shocks on the Balanceof Payments, Policy Responses, and DebtProblems of Asian Developing Countries—Seiji Naya, December 1983
No. 23 Changing Trade Patterns and Policy Issues:The Prospects for East and Southeast AsianDeveloping Countries—Seiji Naya and Ulrich Hiemenz, February 1984
No. 24 Small-Scale Industries in Asian EconomicDevelopment: Problems and Prospects—Seiji Naya, February 1984
No. 25 A Study on the External Debt IndicatorsApplying Logit Analysis—Jungsoo Lee and Clarita Barretto, February 1984
No. 26 Alternatives to Institutional Credit Programsin the Agricultural Sector of Low-IncomeCountries—Jennifer Sour, March 1984
No. 27 Economic Scene in Asia and Its Special Features—Kedar N. Kohli, November 1984
No. 28 The Effect of Terms of Trade Changes on theBalance of Payments and Real NationalIncome of Asian Developing Countries—Jungsoo Lee and Lutgarda Labios, January 1985
No. 29 Cause and Effect in the World Sugar Market:Some Empirical Findings 1951-1982—Yoshihiro Iwasaki, February 1985
No. 30 Sources of Balance of Payments Problemin the 1970s: The Asian Experience—Pradumna Rana, February 1985
No. 31 India’s Manufactured Exports: An Analysisof Supply Sectors—Ifzal Ali, February 1985
No. 32 Meeting Basic Human Needs in AsianDeveloping Countries—Jungsoo Lee and Emma Banaria, March 1985
No. 33 The Impact of Foreign Capital Inflowon Investment and Economic Growthin Developing Asia—Evelyn Go, May 1985
No. 34 The Climate for Energy Developmentin the Pacific and Asian Region:Priorities and Perspectives—V.V. Desai, April 1986
No. 35 Impact of Appreciation of the Yen onDeveloping Member Countries of the Bank—Jungsoo Lee, Pradumna Rana, and Ifzal Ali,
May 1986No. 36 Smuggling and Domestic Economic Policies
in Developing Countries—A.H.M.N. Chowdhury, October 1986
No. 37 Public Investment Criteria: Economic InternalRate of Return and Equalizing Discount Rate
—Ifzal Ali, November 1986No. 38 Review of the Theory of Neoclassical Political
Economy: An Application to Trade Policies—M.G. Quibria, December 1986
No. 39 Factors Influencing the Choice of Location:Local and Foreign Firms in the Philippines—E.M. Pernia and A.N. Herrin, February 1987
No. 40 A Demographic Perspective on DevelopingAsia and Its Relevance to the Bank—E.M. Pernia, May 1987
No. 41 Emerging Issues in Asia and Social CostBenefit Analysis—I. Ali, September 1988
No. 42 Shifting Revealed Comparative Advantage:Experiences of Asian and Pacific DevelopingCountries—P.B. Rana, November 1988
No. 43 Agricultural Price Policy in Asia:Issues and Areas of Reforms—I. Ali, November 1988
No. 44 Service Trade and Asian Developing Economies—M.G. Quibria, October 1989
No. 45 A Review of the Economic Analysis of PowerProjects in Asia and Identification of Areasof Improvement—I. Ali, November 1989
No. 46 Growth Perspective and Challenges for Asia:Areas for Policy Review and Research—I. Ali, November 1989
No. 47 An Approach to Estimating the PovertyAlleviation Impact of an Agricultural Project—I. Ali, January 1990
No. 48 Economic Growth Performance of Indonesia,the Philippines, and Thailand:The Human Resource Dimension—E.M. Pernia, January 1990
No. 49 Foreign Exchange and Fiscal Impact of a Project:A Methodological Framework for Estimation—I. Ali, February 1990
No. 50 Public Investment Criteria: Financialand Economic Internal Rates of Return—I. Ali, April 1990
No. 51 Evaluation of Water Supply Projects:An Economic Framework—Arlene M. Tadle, June 1990
No. 52 Interrelationship Between Shadow Prices, ProjectInvestment, and Policy Reforms:An Analytical Framework—I. Ali, November 1990
No. 53 Issues in Assessing the Impact of Projectand Sector Adjustment Lending—I. Ali, December 1990
No. 54 Some Aspects of Urbanizationand the Environment in Southeast Asia—Ernesto M. Pernia, January 1991
No. 55 Financial Sector and EconomicDevelopment: A Survey—Jungsoo Lee, September 1991
No. 56 A Framework for Justifying Bank-AssistedEducation Projects in Asia: A Reviewof the Socioeconomic Analysisand Identification of Areas of Improvement—Etienne Van De Walle, February 1992
No. 57 Medium-term Growth-StabilizationRelationship in Asian Developing Countriesand Some Policy Considerations—Yun-Hwan Kim, February 1993
No. 58 Urbanization, Population Distribution,and Economic Development in Asia—Ernesto M. Pernia, February 1993
No. 59 The Need for Fiscal Consolidation in Nepal:The Results of a Simulation—Filippo di Mauro and Ronald Antonio Butiong,
July 1993

28
No. 1 International Reserves:Factors Determining Needs and Adequacy—Evelyn Go, May 1981
No. 2 Domestic Savings in Selected DevelopingAsian Countries—Basil Moore, assisted by
A.H.M. Nuruddin Chowdhury, September 1981No. 3 Changes in Consumption, Imports and Exports
of Oil Since 1973: A Preliminary Survey ofthe Developing Member Countriesof the Asian Development Bank—Dal Hyun Kim and Graham Abbott,
September 1981No. 4 By-Passed Areas, Regional Inequalities,
and Development Policies in SelectedSoutheast Asian Countries—William James, October 1981
No. 5 Asian Agriculture and Economic Development—William James, March 1982
No. 6 Inflation in Developing Member Countries:An Analysis of Recent Trends—A.H.M. Nuruddin Chowdhury and
J. Malcolm Dowling, March 1982No. 7 Industrial Growth and Employment in
Developing Asian Countries: Issues andPerspectives for the Coming Decade—Ulrich Hiemenz, March 1982
No. 8 Petrodollar Recycling 1973-1980.Part 1: Regional Adjustments andthe World Economy—Burnham Campbell, April 1982
No. 9 Developing Asia: The Importanceof Domestic Policies—Economics Office Staff under the direction
of Seiji Naya, May 1982No. 10 Financial Development and Household
Savings: Issues in Domestic ResourceMobilization in Asian Developing Countries—Wan-Soon Kim, July 1982
No. 11 Industrial Development: Role of SpecializedFinancial Institutions—Kedar N. Kohli, August 1982
No. 12 Petrodollar Recycling 1973-1980.Part II: Debt Problems and an Evaluationof Suggested Remedies—Burnham Campbell, September 1982
No. 13 Credit Rationing, Rural Savings, and FinancialPolicy in Developing Countries—William James, September 1982
No. 14 Small and Medium-Scale ManufacturingEstablishments in ASEAN Countries:Perspectives and Policy Issues—Mathias Bruch and Ulrich Hiemenz, March 1983
No. 15 Income Distribution and EconomicGrowth in Developing Asian Countries
ECONOMIC STAFF PAPERS (ES)
—J. Malcolm Dowling and David Soo, March 1983No. 16 Long-Run Debt-Servicing Capacity of
Asian Developing Countries: An Applicationof Critical Interest Rate Approach—Jungsoo Lee, June 1983
No. 17 External Shocks, Energy Policy,and Macroeconomic Performance of AsianDeveloping Countries: A Policy Analysis—William James, July 1983
No. 18 The Impact of the Current Exchange RateSystem on Trade and Inflation of SelectedDeveloping Member Countries—Pradumna Rana, September 1983
No. 19 Asian Agriculture in Transition: Key Policy Issues—William James, September 1983
No. 20 The Transition to an Industrial Economyin Monsoon Asia—Harry T. Oshima, October 1983
No. 21 The Significance of Off-Farm Employmentand Incomes in Post-War East Asian Growth—Harry T. Oshima, January 1984
No. 22 Income Distribution and Poverty in SelectedAsian Countries—John Malcolm Dowling, Jr., November 1984
No. 23 ASEAN Economies and ASEAN EconomicCooperation—Narongchai Akrasanee, November 1984
No. 24 Economic Analysis of Power Projects—Nitin Desai, January 1985
No. 25 Exports and Economic Growth in the Asian Region—Pradumna Rana, February 1985
No. 26 Patterns of External Financing of DMCs—E. Go, May 1985
No. 27 Industrial Technology Developmentthe Republic of Korea—S.Y. Lo, July 1985
No. 28 Risk Analysis and Project Selection:A Review of Practical Issues—J.K. Johnson, August 1985
No. 29 Rice in Indonesia: Price Policy and ComparativeAdvantage—I. Ali, January 1986
No. 30 Effects of Foreign Capital Inflowson Developing Countries of Asia—Jungsoo Lee, Pradumna B. Rana,
and Yoshihiro Iwasaki, April 1986No. 31 Economic Analysis of the Environmental
Impacts of Development Projects—John A. Dixon et al., EAPI,
East-West Center, August 1986No. 32 Science and Technology for Development:
Role of the Bank—Kedar N. Kohli and Ifzal Ali, November 1986
No. 33 Satellite Remote Sensing in the Asianand Pacific Region
No. 60 A Computable General Equilibrium Modelof Nepal—Timothy Buehrer and Filippo di Mauro,
October 1993No. 61 The Role of Government in Export Expansion
in the Republic of Korea: A Revisit—Yun-Hwan Kim, February 1994
No. 62 Rural Reforms, Structural Change,and Agricultural Growth inthe People’s Republic of China—Bo Lin, August 1994
No. 63 Incentives and Regulation for Pollution Abatementwith an Application to Waste Water Treatment
—Sudipto Mundle, U. Shankar,and Shekhar Mehta, October 1995
No. 64 Saving Transitions in Southeast Asia—Frank Harrigan, February 1996
No. 65 Total Factor Productivity Growth in East Asia:A Critical Survey—Jesus Felipe, September 1997
No. 66 Foreign Direct Investment in Pakistan:Policy Issues and Operational Implications—Ashfaque H. Khan and Yun-Hwan Kim,
July 1999No. 67 Fiscal Policy, Income Distribution and Growth
—Sailesh K. Jha, November 1999

29
—Mohan Sundara Rajan, December 1986No. 34 Changes in the Export Patterns of Asian and
Pacific Developing Countries: An EmpiricalOverview—Pradumna B. Rana, January 1987
No. 35 Agricultural Price Policy in Nepal—Gerald C. Nelson, March 1987
No. 36 Implications of Falling Primary CommodityPrices for Agricultural Strategy in the Philippines—Ifzal Ali, September 1987
No. 37 Determining Irrigation Charges: A Framework—Prabhakar B. Ghate, October 1987
No. 38 The Role of Fertilizer Subsidies in AgriculturalProduction: A Review of Select Issues—M.G. Quibria, October 1987
No. 39 Domestic Adjustment to External Shocksin Developing Asia—Jungsoo Lee, October 1987
No. 40 Improving Domestic Resource Mobilizationthrough Financial Development: Indonesia—Philip Erquiaga, November 1987
No. 41 Recent Trends and Issues on Foreign DirectInvestment in Asian and Pacific DevelopingCountries—P.B. Rana, March 1988
No. 42 Manufactured Exports from the Philippines:A Sector Profile and an Agenda for Reform—I. Ali, September 1988
No. 43 A Framework for Evaluating the EconomicBenefits of Power Projects—I. Ali, August 1989
No. 44 Promotion of Manufactured Exports in Pakistan—Jungsoo Lee and Yoshihiro Iwasaki,
September 1989No. 45 Education and Labor Markets in Indonesia:
A Sector Survey—Ernesto M. Pernia and David N. Wilson,
September 1989No. 46 Industrial Technology Capabilities
and Policies in Selected ADCs—Hiroshi Kakazu, June 1990
No. 47 Designing Strategies and Policiesfor Managing Structural Change in Asia—Ifzal Ali, June 1990
No. 48 The Completion of the Single European Commu-
nity Market in 1992: A Tentative Assessment ofits Impact on Asian Developing Countries—J.P. Verbiest and Min Tang, June 1991
No. 49 Economic Analysis of Investment in PowerSystems—Ifzal Ali, June 1991
No. 50 External Finance and the Role of MultilateralFinancial Institutions in South Asia:Changing Patterns, Prospects, and Challenges—Jungsoo Lee, November 1991
No. 51 The Gender and Poverty Nexus: Issues andPolicies—M.G. Quibria, November 1993
No. 52 The Role of the State in Economic Development:Theory, the East Asian Experience,and the Malaysian Case—Jason Brown, December 1993
No. 53 The Economic Benefits of Potable Water SupplyProjects to Households in Developing Countries—Dale Whittington and Venkateswarlu Swarna,
January 1994No. 54 Growth Triangles: Conceptual Issues
and Operational Problems—Min Tang and Myo Thant, February 1994
No. 55 The Emerging Global Trading Environmentand Developing Asia—Arvind Panagariya, M.G. Quibria,
and Narhari Rao, July 1996No. 56 Aspects of Urban Water and Sanitation in
the Context of Rapid Urbanization inDeveloping Asia—Ernesto M. Pernia and Stella LF. Alabastro,
September 1997No. 57 Challenges for Asia’s Trade and Environment
—Douglas H. Brooks, January 1998No. 58 Economic Analysis of Health Sector Projects-
A Review of Issues, Methods, and Approaches—Ramesh Adhikari, Paul Gertler, and
Anneli Lagman, March 1999No. 59 The Asian Crisis: An Alternate View
—Rajiv Kumar and Bibek Debroy, July 1999No. 60 Social Consequences of the Financial Crisis in
Asia—James C. Knowles, Ernesto M. Pernia, and
Mary Racelis, November 1999
No. 1 Poverty in the People’s Republic of China:Recent Developments and Scopefor Bank Assistance—K.H. Moinuddin, November 1992
No. 2 The Eastern Islands of Indonesia: An Overviewof Development Needs and Potential—Brien K. Parkinson, January 1993
No. 3 Rural Institutional Finance in Bangladeshand Nepal: Review and Agenda for Reforms—A.H.M.N. Chowdhury and Marcelia C. Garcia,
November 1993No. 4 Fiscal Deficits and Current Account Imbalances
of the South Pacific Countries:A Case Study of Vanuatu—T.K. Jayaraman, December 1993
No. 5 Reforms in the Transitional Economies of Asia—Pradumna B. Rana, December 1993
No. 6 Environmental Challenges in the People’s Republicof China and Scope for Bank Assistance—Elisabetta Capannelli and Omkar L. Shrestha,
December 1993
No. 7 Sustainable Development Environmentand Poverty Nexus—K.F. Jalal, December 1993
No. 8 Intermediate Services and EconomicDevelopment: The Malaysian Example—Sutanu Behuria and Rahul Khullar, May 1994
No. 9 Interest Rate Deregulation: A Brief Surveyof the Policy Issues and the Asian Experience—Carlos J. Glower, July 1994
No. 10 Some Aspects of Land Administrationin Indonesia: Implications for Bank Operations—Sutanu Behuria, July 1994
No. 11 Demographic and Socioeconomic Determinantsof Contraceptive Use among Urban Women inthe Melanesian Countries in the South Pacific:A Case Study of Port Vila Town in Vanuatu—T.K. Jayaraman, February 1995
No. 12 Managing Development throughInstitution Building— Hilton L. Root, October 1995
No. 13 Growth, Structural Change, and Optimal
OCCASIONAL PAPERS (OP)

30
No. 1 Estimates of the Total External Debt ofthe Developing Member Countries of ADB:1981-1983—I.P. David, September 1984
No. 2 Multivariate Statistical and GraphicalClassification Techniques Appliedto the Problem of Grouping Countries—I.P. David and D.S. Maligalig, March 1985
No. 3 Gross National Product (GNP) MeasurementIssues in South Pacific Developing MemberCountries of ADB—S.G. Tiwari, September 1985
No. 4 Estimates of Comparable Savings in SelectedDMCs—Hananto Sigit, December 1985
No. 5 Keeping Sample Survey Designand Analysis Simple—I.P. David, December 1985
No. 6 External Debt Situation in AsianDeveloping Countries—I.P. David and Jungsoo Lee, March 1986
No. 7 Study of GNP Measurement Issues in theSouth Pacific Developing Member Countries.Part I: Existing National Accountsof SPDMCs–Analysis of Methodologyand Application of SNA Concepts—P. Hodgkinson, October 1986
No. 8 Study of GNP Measurement Issues in the SouthPacific Developing Member Countries.Part II: Factors Affecting IntercountryComparability of Per Capita GNP—P. Hodgkinson, October 1986
No. 9 Survey of the External Debt Situationin Asian Developing Countries, 1985—Jungsoo Lee and I.P. David, April 1987
No. 10 A Survey of the External Debt Situationin Asian Developing Countries, 1986—Jungsoo Lee and I.P. David, April 1988
No. 11 Changing Pattern of Financial Flows to Asianand Pacific Developing Countries—Jungsoo Lee and I.P. David, March 1989
No. 12 The State of Agricultural Statistics inSoutheast Asia—I.P. David, March 1989
No. 13 A Survey of the External Debt Situationin Asian and Pacific Developing Countries:1987-1988—Jungsoo Lee and I.P. David, July 1989
No. 14 A Survey of the External Debt Situation inAsian and Pacific Developing Countries: 1988-1989—Jungsoo Lee, May 1990
No. 15 A Survey of the External Debt Situationin Asian and Pacific Developing Countries: 1989-1992—Min Tang, June 1991
No. 16 Recent Trends and Prospects of External DebtSituation and Financial Flows to Asianand Pacific Developing Countries—Min Tang and Aludia Pardo, June 1992
No. 17 Purchasing Power Parity in Asian DevelopingCountries: A Co-Integration Test—Min Tang and Ronald Q. Butiong, April 1994
No. 18 Capital Flows to Asian and Pacific DevelopingCountries: Recent Trends and Future Prospects—Min Tang and James Villafuerte, October 1995
STATISTICAL REPORT SERIES (SR)
Poverty Interventions—Shiladitya Chatterjee, November 1995
No. 14 Private Investment and MacroeconomicEnvironment in the South Pacific IslandCountries: A Cross-Country Analysis—T.K. Jayaraman, October 1996
No. 15 The Rural-Urban Transition in Viet Nam:Some Selected Issues—Sudipto Mundle and Brian Van Arkadie,
October 1997No. 16 A New Approach to Setting the Future
Transport Agenda—Roger Allport, Geoff Key, and Charles Melhuish
June 1998No. 17 Adjustment and Distribution:
The Indian Experience—Sudipto Mundle and V.B. Tulasidhar, June 1998
No. 18 Tax Reforms in Viet Nam: A Selective Analysis—Sudipto Mundle, December 1998
No. 19 Surges and Volatility of Private Capital Flows toAsian Developing Countries: Implicationsfor Multilateral Development Banks—Pradumna B. Rana, December 1998
No. 20 The Millennium Round and the Asian Economies:An Introduction—Dilip K. Das, October 1999
No. 21 Occupational Segregation and the GenderEarnings Gap—Joseph E. Zveglich, Jr. and Yana van der MeulenRodgers, December 1999
No. 22 Information Technology: Next Locomotive ofGrowth?—Dilip K. Das, June 2000

31
Edited by S.Ghon Rhee & Yutaka Shimomoto, 1999$35.00 (paperback)
9. Corporate Governance and Finance in East Asia:A Study of Indonesia, Republic of Korea, Malaysia,Philippines and ThailandJ. Zhuang, David Edwards, D. Webb,& Ma. Virginita CapulongVol. 1, 2000 $10.00 (paperback)Vol. 2, 2001 $15.00 (paperback)
10. Financial Management and Governance IssuesAsian Development Bank, 2000Cambodia $10.00 (paperback)People’s Republic of China $10.00 (paperback)Mongolia $10.00 (paperback)Pakistan $10.00 (paperback)Papua New Guinea $10.00 (paperback)Uzbekistan $10.00 (paperback)Viet Nam $10.00 (paperback)Selected Developing Member Countries $10.00 (paperback)
11. Guidelines for the Economic Analysis of ProjectsAsian Development Bank, 1997$10.00 (paperback)
12. Handbook for the Economic Analysis of Water SupplyProjectsAsian Development Bank, 1999$15.00 (hardbound)
13. Handbook for the Economic Analysis of Health SectorProjectsAsian Development Bank, 2000$10.00 (paperback)
1. Rural Poverty in Developing AsiaEdited by M.G. QuibriaVol. 1: Bangladesh, India, and Sri Lanka, 1994$35.00 (paperback)Vol. 2: Indonesia, Republic of Korea, Philippines,and Thailand, 1996$35.00 (paperback)
2. External Shocks and Policy Adjustments:Lessons from the Gulf CrisisEdited by Naved Hamid and Shahid N. Zahid, 1995$15.00 (paperback)
3. Gender Indicators of Developing Asianand Pacific CountriesAsian Development Bank, 1993$25.00 (paperback)
4. Urban Poverty in Asia: A Survey of Critical IssuesEdited by Ernesto Pernia, 1994$20.00 (paperback)
5. Indonesia-Malaysia-Thailand Growth Triangle:Theory to PracticeEdited by Myo Thant and Min Tang, 1996$15.00 (paperback)
6. Emerging Asia: Changes and ChallengesAsian Development Bank, 1997$30.00 (paperback)
7. Asian ExportsEdited by Dilip Das, 1999$35.00 (paperback)$55.00 (hardbound)
8. Mortgage-Backed Securities Markets in Asia
SPECIAL STUDIES, ADB (SS, ADB)(Published in-house; Available commercially through ADB Office of External Relations)
1. Improving Domestic Resource Mobilization ThroughFinancial Development: Overview September 1985
2. Improving Domestic Resource Mobilization ThroughFinancial Development: Bangladesh July 1986
3. Improving Domestic Resource Mobilization ThroughFinancial Development: Sri Lanka April 1987
4. Improving Domestic Resource Mobilization ThroughFinancial Development: India December 1987
5. Financing Public Sector Development Expenditurein Selected Countries: Overview January 1988
6. Study of Selected Industries: A Brief ReportApril 1988
7. Financing Public Sector Development Expenditurein Selected Countries: Bangladesh June 1988
8. Financing Public Sector Development Expenditurein Selected Countries: India June 1988
9. Financing Public Sector Development Expenditurein Selected Countries: Indonesia June 1988
10. Financing Public Sector Development Expenditurein Selected Countries: Nepal June 1988
11. Financing Public Sector Development Expenditurein Selected Countries: Pakistan June 1988
12. Financing Public Sector Development Expenditurein Selected Countries: Philippines June 1988
13. Financing Public Sector Development Expenditurein Selected Countries: Thailand June 1988
14. Towards Regional Cooperation in South Asia:ADB/EWC Symposium on Regional Cooperationin South Asia February 1988
15. Evaluating Rice Market Intervention Policies:Some Asian Examples April 1988
16. Improving Domestic Resource Mobilization ThroughFinancial Development: Nepal November 1988
17. Foreign Trade Barriers and Export Growth
September 198818. The Role of Small and Medium-Scale Industries in the
Industrial Development of the PhilippinesApril 1989
19. The Role of Small and Medium-Scale ManufacturingIndustries in Industrial Development: The Experienceof Selected Asian CountriesJanuary 1990
20. National Accounts of Vanuatu, 1983-1987January 1990
21. National Accounts of Western Samoa, 1984-1986February 1990
22. Human Resource Policy and EconomicDevelopment: Selected Country StudiesJuly 1990
23. Export Finance: Some Asian ExamplesSeptember 1990
24. National Accounts of the Cook Islands, 1982-1986September 1990
25. Framework for the Economic and Financial Appraisalof Urban Development Sector Projects January 1994
26. Framework and Criteria for the Appraisaland Socioeconomic Justification of Education ProjectsJanuary 1994
27. Guidelines for the Economic Analysis of ProjectsFebruary 1997
28. Investing in Asia1997
29. Guidelines for the Economic Analysisof Telecommunication Projects1998
30. Guidelines for the Economic Analysisof Water Supply Projects1999
SPECIAL STUDIES, COMPLIMENTARY (SSC)(Published in-house; Available through ADB Office of External Relations; Free of Charge)
32
SERIALS(Co-published with Oxford University Press; Available commercially through Oxford University PressOffices, Associated Companies, and Agents)
1. Asian Development Outlook (ADO; annual)$36.00 (paperback)
2. Key Indicators of Developing Asian and Pacific Countries (KI; annual)$35.00 (paperback)
JOURNAL(Published in-house; Available commercially through ADB Office of External Relations)
1. Asian Development Review (ADR; semiannual)$5.00 per issue; $8.00 per year (2 issues)
1. Informal Finance: Some Findings from AsiaPrabhu Ghate et. al., 1992$15.00 (paperback)
2. Mongolia: A Centrally Planned Economyin TransitionAsian Development Bank, 1992$15.00 (paperback)
3. Rural Poverty in Asia, Priority Issues and PolicyOptionsEdited by M.G. Quibria, 1994$25.00 (paperback)
4. Growth Triangles in Asia: A New Approachto Regional Economic CooperationEdited by Myo Thant, Min Tang, and Hiroshi Kakazu1st ed., 1994 $36.00 (hardbound)Revised ed., 1998 $55.00 (hardbound)
5. Urban Poverty in Asia: A Survey of Critical IssuesEdited by Ernesto Pernia, 1994$18.00 (paperback)
6. Critical Issues in Asian Development:Theories, Experiences, and PoliciesEdited by M.G. Quibria, 1995$15.00 (paperback)$36.00 (hardbound)
7. From Centrally Planned to Market Economies:The Asian ApproachEdited by Pradumna B. Rana and Naved Hamid, 1995Vol. 1: Overview$36.00 (hardbound)Vol. 2: People’s Republic of China and Mongolia$50.00 (hardbound)Vol. 3: Lao PDR, Myanmar, and Viet Nam$50.00 (hardbound)
8. Financial Sector Development in AsiaEdited by Shahid N. Zahid, 1995$50.00 (hardbound)
9. Financial Sector Development in Asia: Country StudiesEdited by Shahid N. Zahid, 1995$55.00 (hardbound)
10. Fiscal Management and Economic Reformin the People’s Republic of ChinaChristine P.W. Wong, Christopher Heady,and Wing T. Woo, 1995$15.00 (paperback)
11. Current Issues in Economic Development:An Asian PerspectiveEdited by M.G. Quibria and J. Malcolm Dowling, 1996$50.00 (hardbound)
12. The Bangladesh Economy in TransitionEdited by M.G. Quibria, 1997$20.00 (hardbound)
13. The Global Trading System and Developing AsiaEdited by Arvind Panagariya, M.G. Quibria,and Narhari Rao, 1997$55.00 (hardbound)
14. Social Sector Issues in Transitional Economies of AsiaEdited by Douglas H. Brooks and Myo Thant, 1998$25.00 (paperback)$55.00 (hardbound)
15. Rising to the Challenge in Asia: A Study of FinancialMarketsAsian Development Bank, 1999Vol. 1 $20.00 (paperback)Vol. 2 $15.00 (paperback)Vol. 3 $25.00 (paperback)Vols. 4-12 $20.00 (paperback)
SPECIAL STUDIES, OUP (SS,OUP)(Co-published with Oxford University Press; Available commercially through Oxford University PressOffices, Associated Companies, and Agents)