how applying models in work group sessions can help to
TRANSCRIPT

How applying models in work group sessions can help to retrieve information for making FTA and
FMECA analysis.
Levi Andrè Berg Vigdal Dresser-Rand Gerrit Muller
Buskerud University College [email protected]
Mike Pennotti Stevens Institute of Technology
Copyright © 2011 by Levi Andrè Berg Vigdal. Published and used by INCOSE with permission.
Abstract. Dresser-Rand Kongsberg is a company with a long history of building radial gas turbines in the 2MW range. Since the first gas turbine was developed at Kongsberg, the turbine has been subject to several upgrades, the latest being called KG2-3E. To compete with radial gas turbines with newer technology, a decision was made to develop a completely new engine, (KG2-3G), based on the experience from the previous KG2 turbines. A gas turbine is a complex system; it is therefore challenging to prevent as many of the high risk failure modes as possible during the test and integration.
To identify high-risk failure modes a combination of Failure Mode Effect Criticality Analysis (FMECA) and Fault Tree Analysis (FTA) was applied. For the analysis, it was important to get input based on experience and knowledge within the company. Five senior engineers, who have been working with Gas Turbines for over 40 years, were the source of this knowledge. Work sessions were arranged to create discussions and extract as much “know-how” as possible. The challenge during these sessions was to enforce engagement, creativity and discussion around the theme of concern. Methods such as applying different annotated diagrams representing the current theme and different methods of capturing the information were used to accomplish this.
A comparison between central facilitation by electronic documents and active engagement of all participants by low-tech means was performed. The low-tech means of applying Post-It and flip charts seemed to be the superior method that made participants more engaged. Different models, such as FTA graphs, technical drawings, and simpler block diagrams were applied and compared. It was discovered that it is important that the models displayed something the participants could recognize. It was also clear that applying models that represented the theme of concern helped to improve engagement and creativity around that theme.
Introduction Dresser-Rand Kongsberg originates from Kongsberg Våpenfabrikk, and developed under the name Kongsberg Gas Turbines three different classes of radial gas turbines. The two more commercially successful of these were called KG2 and KG5. The KG2 is the oldest model and was first developed in the late 1960s. After this, the KG2 has been subjected to several upgrades, and the latest upgrade, called KG2-3E, is still in operation today. The 3E, being a modification of its predecessors, is based on old design and technology. This gives the 3E limited capabilities with regard to efficiency and emission rates compared to

competitors. It was therefore decided to develop a new gas turbine that could let Dresser-Rand keep and expand its market share within the 2MW range, (KG2-3G). The 3G is based on the same concept as the previous 3E version but uses more advanced technology to be able to run with higher efficiency and lower emissions. As with the previous versions, this is a radial gas turbine. That means that the hot gas after combustion enters radial on to the turbine wheel and exits axially. The radial turbine construction allows for more robust turbine blades and therefore a higher blade tip speed. With a higher tip speed, it is possible to have a higher pressure drop over one stage, simplifying the construction and increasing the robustness compared to a multistage axial turbine. The KG2-3G has four combustors and a centrifugal compressor. Figure 1 is a 3D model of the KG2-3G, the orange wheel is the turbine wheel, while the blue is the compressor wheel. Except for the combustion arrangement, a radial gas turbine is similar to a turbo charger. The air enters the engine top center and exits to the right.
0.5m
Figure 1 - Section cut KG2-3G gas turbine
A gas turbine is a fairly complex system of components and sub assemblies. A failure during test and integration would potentially be catastrophic to the engine and could postpone the delivery date by several months. In an effort to reduce the risk of the test and integration process, an FTA & FMECA analysis together with risk analysis was performed to highlight potential high risk areas.
A Fault Tree Analysis (Figure 2) is a method to trace down all possible causes for a given state. By using a FTA it is possible to find single and multi point failures which can lead to the state of concern. The basic building blocks of an FTA is the “AND” and “OR” blocks together with the “STATE” blocks. The state of concern is placed at the very top. From there the state is decomposed into what type of failure can directly lead to that state. If there are several failures which separately can lead to that state, they go through an “OR” block. If there are two failures that have to occur at the same time, they go through an “AND” block. The first level failure modes are then decomposed again. Decomposition is repeated until a sufficiently low level. The diamond shapes represent modes that can be further decomposed. [1]

Figure 2 - Fault Tree Analysis
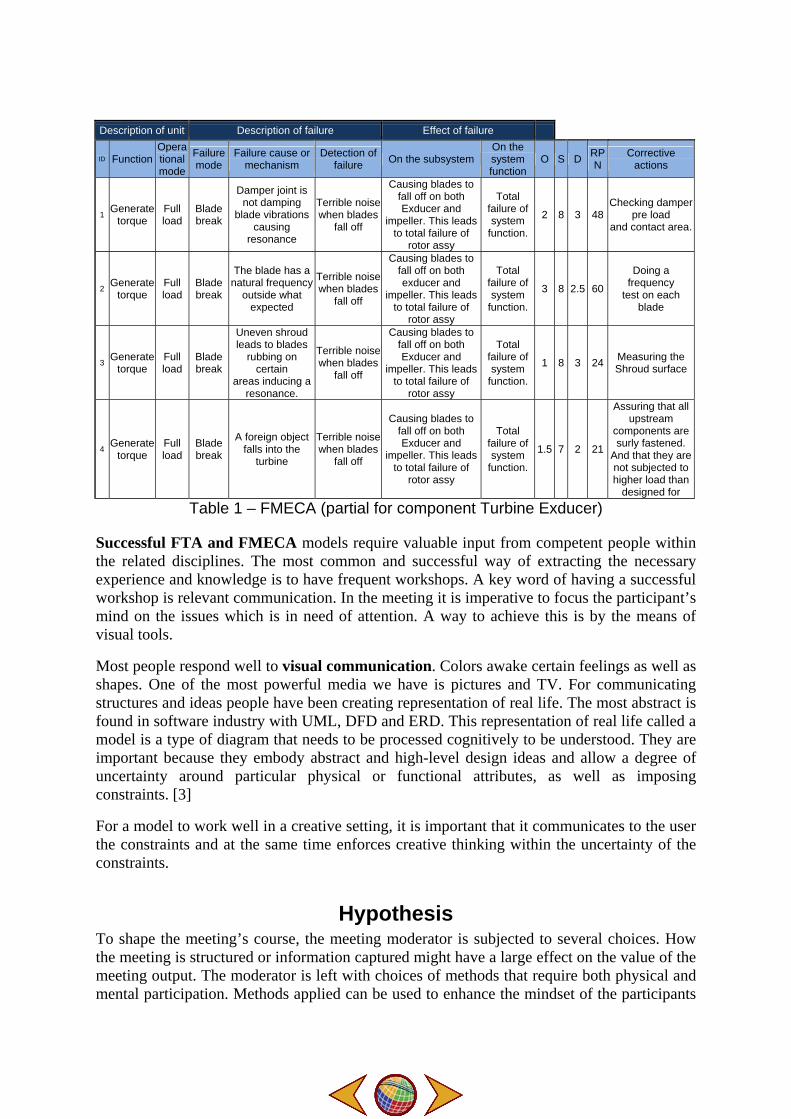
A Failure Mode Effect Criticality Analysis is a technique used to identify, prioritize, and eliminate potential failures from the system, design or process before they reach the customer (Omdahl 1988). The FMECA is usually constructed with the use of an extensive spreadsheet where risk is set as one of the input data, (Table 1). Like the FTA it can be a series of events that in FMECA’s case leads to one or multiple end effects. [2]
In order to define the criticality of a failure mode an element called risk priority number, (RPN), is introduced. The risk priority number is defined as RPN = S × O × D. A high-risk priority number means that the failure mode has a high grade of criticality and vice versa. As depicted in the RPN formula it is constructed out of four dimensions.
O = the rank of the occurrence of the failure mode. S = the rank of the severity of the failure mode. D = the rank of the likelihood the failure will be detected before the system reaches the end-user/customer. Each dimension is ranked on a scale from 1 to 10. [2]
Description of unit Description of failure Effect of failure
ID Function Operational mode
Failure mode
Failure cause or mechanism
Detection of failure On the subsystem
On the system function
O S D RPN
Corrective actions
1 Generate torque
Full load
Blade break
Damper joint is not damping
blade vibrations causing
resonance
Terrible noise when blades
fall off
Causing blades to fall off on both Exducer and
impeller. This leads to total failure of
rotor assy
Total failure of system
function.
2 8 3 48 Checking damper
pre load and contact area.
2 Generate torque
Full load
Blade break
The blade has a natural frequency
outside what expected
Terrible noise when blades
fall off
Causing blades to fall off on both exducer and
impeller. This leads to total failure of
rotor assy
Total failure of system
function.
3 8 2.5 60
Doing a frequency
test on each blade
3 Generate torque
Full load
Blade break
Uneven shroud leads to blades
rubbing on certain
areas inducing a resonance.
Terrible noise when blades
fall off
Causing blades to fall off on both Exducer and
impeller. This leads to total failure of
rotor assy
Total failure of system
function.
1 8 3 24 Measuring the Shroud surface
4 Generate torque
Full load
Blade break
A foreign object falls into the
turbine
Terrible noise when blades
fall off
Causing blades to fall off on both Exducer and
impeller. This leads to total failure of
rotor assy
Total failure of system
function.
1.5 7 2 21
Assuring that all upstream
components are surly fastened.
And that they are not subjected to higher load than
designed for
Table 1 – FMECA (partial for component Turbine Exducer)
Successful FTA and FMECA models require valuable input from competent people within the related disciplines. The most common and successful way of extracting the necessary experience and knowledge is to have frequent workshops. A key word of having a successful workshop is relevant communication. In the meeting it is imperative to focus the participant’s mind on the issues which is in need of attention. A way to achieve this is by the means of visual tools.
Most people respond well to visual communication. Colors awake certain feelings as well as shapes. One of the most powerful media we have is pictures and TV. For communicating structures and ideas people have been creating representation of real life. The most abstract is found in software industry with UML, DFD and ERD. This representation of real life called a model is a type of diagram that needs to be processed cognitively to be understood. They are important because they embody abstract and high-level design ideas and allow a degree of uncertainty around particular physical or functional attributes, as well as imposing constraints. [3]
For a model to work well in a creative setting, it is important that it communicates to the user the constraints and at the same time enforces creative thinking within the uncertainty of the constraints.
Hypothesis To shape the meeting’s course, the meeting moderator is subjected to several choices. How the meeting is structured or information captured might have a large effect on the value of the meeting output. The moderator is left with choices of methods that require both physical and mental participation. Methods applied can be used to enhance the mindset of the participants

to achieve a well functioning meeting. A well functioning method lets participants fit into the structure of the meeting and creates a more active and engaged participation.
For a participant to understand and discuss a problem in the meeting, he/she needs to create a mental representation of the problem. A mental model might vary from person to person and can be difficult to base discussions on. Applying visual representations that synchronize the mental models can be useful for the discussion. It is imperative when applying visual representations in a meeting that the participants subjected to the representation can understand it. A measure to make visual representations understandable might be to incorporate elements that are recognized by the participants.
H1: Working with flip chart and Post-It encourages a more active participation than working towards a shared document projected onto a large screen. When having a group session it is important to have a work process that encourages participation and discussion.
H2: When presented with a model, people respond better if the model has elements that they recognize.
H3: Using models that reflect the meeting theme helps in enforcing creativity and discussion around a failure mode causes and effects for a FTA and FMEA analysis. As the models help enforcing creativity and discussion, it also help the engineers to think of failure modes they did not view as critical or did not know at all.
The test subjects mainly consist of senior engineers that have been working with this subject for up to 40 years. The research does not go beyond the value of applying models to get information about failure modes and its effects and consequences.
Method Three experiments were applied through seven sessions in different combination. In Figure 3 “Way of work” is related to Hypothesis 1. Each session following the arrow from the box containing “Way of work” contains the method subjected to experimentation. The same principle applies for “Type of model applied” which is related to Hypothesis 2/3 and “Way of collecting feedback” which is the method applied to collect feedback. Between each session is a break where the lessons learned is reflected upon and used to plan the next step.
Way of work
Type of modelapplied
Way of collectingfeedback
Hirarcical noting in Microsoft
Word
Abstract
Observation
Discussion
Observation
E-Mail with questions
Observation
Discussion
Observation
Question sheet
Observation
Question sheet
LayoutAnnotated
Layout
Annotated Layout
(Rotor Figure4)
Annotated Layout
(Gear box)
Post-it and Flip-Over
Post-it and Flip-Over
Post-it and Flip-Over
Ref
lect
ove
r exp
erie
nce
& P
lan
next
ste
p
Observation
Question sheet
Semi Abstract(Test Facility)
Hirarcical noting in Microsoft
Word
Observation
Question sheet
Annotated Layout
(Combustion chamber)
Post-it and Flip-Over
Ref
lect
ove
r exp
erie
nce
& P
lan
next
ste
p
Ref
lect
ove
r exp
erie
nce
& P
lan
next
ste
p
Ref
lect
ove
r exp
erie
nce
& P
lan
next
ste
p
Ref
lect
ove
r exp
erie
nce
& P
lan
next
ste
p
Ref
lect
ove
r exp
erie
nce
& P
lan
next
ste
p
Ref
lect
ove
r exp
erie
nce
& D
raw
con
clus
ion
Session 2 Session 3 Session 4 Session 5 Session 6 Session 7Session 1
Semi Abstract(Test Facility)
Figure 3 – Model of Experimentation Process.
Experiment 1 Finding way of work Central facilitation by projecting a shared document was done using Microsoft Word 2003. In the beginning of the session a model was handed out to each of the participants. The theme
was to find top-level failure modes. A state was pre-selected and the defined theme was “what can cause this state to occur”. Causes were put down in a list form. As causes were decomposed, the line was moved one tab to the right.
Flip-over and Post-It were deployed as the other alternative. The group of engineers sat around a table, and in-between them a flip-over was positioned. In the centre of the flip-over a Post-It note with the failure mode of concern was attached. Two lines were drawn, above and below the Post-It. On the left side above the top line and below the bottom line respectively, cause and effect were written. Each participant was given its own stack of Post-Its to note on. The schedule was 10 minutes +- a couple of minutes on brainstorming about what series of events or single events can cause the failure mode of concern to occur. The procedure was repeated for effects. The series of events in this case would contain effects of the failure mode of concern.
The experience of central facilitation by projecting a shared document, was that the discussion became to a large degree about the format, spelling and how the description should be. The failure modes themselves somewhat lost focus. The experience was also that some of the engineers became passive, at least when working in a large group. The reason could be that the framework was not well enough defined. Combined with the fact that engineers were not required to do something actively themselves, made it easy to get into the passive role of a spectator. When working in a small group, all members where engaged and a fair amount of information was noted down. What was found difficult was to capture the series of events that led to the state of concern. The creativity around the topic discussed did not seem that large. This might also be because there in fact were a limited number of states that could happen in the area of focus.
Applying flip-over with Post-It notes, was a somewhat different experience. After the first time applying this method, it seemed easier to get the senior engineers more engaged. A small amount of time in the beginning had to be put down to explain the process. The senior engineers tended to note down root causes, without putting down the series of events from the root cause that led to the failure mode of concern. Some involvement was necessary to extract that knowledge. Less time was used to discuss the shape and wording of the causes, and the discussion and information flow seemed to increase. The senior engineers were asked what they thought about the way of work. Some thought it was a bit unstructured, and that it would be more structured to put it straight into an excel sheet, while the majority thought it was a good way of working. The decision after the meeting was to continue with using flip-over with Post-It. The continued experience was good. The engineers needed a couple of meetings to be able to use this method without any control from the meeting manager. Using Post-Its in a brainstorming meeting, forced the participants not only to be mentally engaged, but also physically. The structures of hierarchical decompositions were easily moved around as discussions went on, and many iterations where done in a short time. The more active and iterative way of working, also led to that new ideas arose based on the discussions of old ideas.
It might be that if there had been spent more time on the method using a computer, the success would have been greater. This was the first meeting and a lot of things needed to be explained. If there had been spent more time with this method, it might have gotten more refined and functional.
Experiment 2 Finding type of model The models were refined by the use of an iterative trial and error approach. The initial model applied was an abstract physical decomposition. Based on feedback a new model was created that again was to be applied and the procedure repeated.
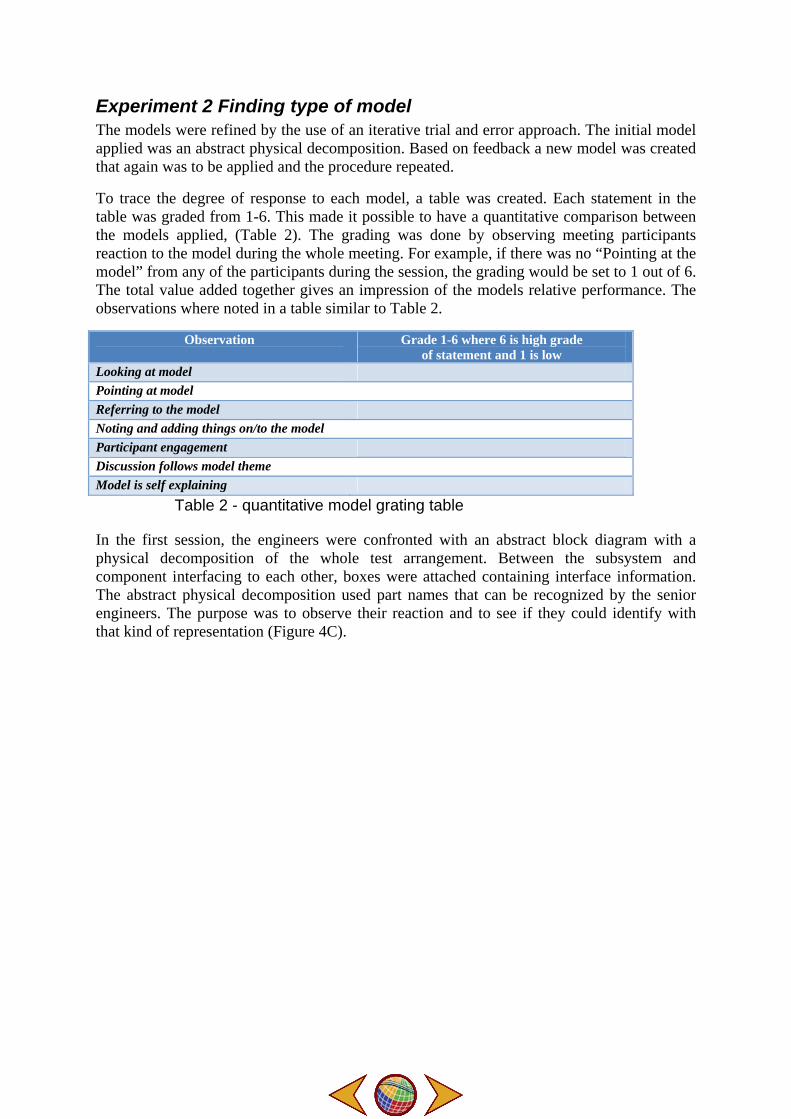
To trace the degree of response to each model, a table was created. Each statement in the table was graded from 1-6. This made it possible to have a quantitative comparison between the models applied, (Table 2). The grading was done by observing meeting participants reaction to the model during the whole meeting. For example, if there was no “Pointing at the model” from any of the participants during the session, the grading would be set to 1 out of 6. The total value added together gives an impression of the models relative performance. The observations where noted in a table similar to Table 2.
Observation Grade 1-6 where 6 is high grade of statement and 1 is low
Looking at model Pointing at model Referring to the model Noting and adding things on/to the model Participant engagement Discussion follows model theme Model is self explaining
Table 2 - quantitative model grating table
In the first session, the engineers were confronted with an abstract block diagram with a physical decomposition of the whole test arrangement. Between the subsystem and component interfacing to each other, boxes were attached containing interface information. The abstract physical decomposition used part names that can be recognized by the senior engineers. The purpose was to observe their reaction and to see if they could identify with that kind of representation (Figure 4C).

4A – Annotated diagram FIGURE 4 ‐ SEMI ABSTRACT MODEL OF TEST ARANGEMENT4B – Semi abstract model of test arrangement
4C - Abstract physical decomposition
Figure 5 - diagrams applied during sessions.
No direct questions to the model were received. Rather they asked “how is it supposed to be used?” This question can be defined as a camouflaged “what is this?” question. Many discussions and explanations followed, the conclusion was that this kind of diagram was not the way to go, but it was later found useful for the authors benefit. It was used so that the author could more easily trace down and decompose causes for certain undesired states during fault tree analysis. The physical decomposition was highly detailed and contained information all the way down to the tolerance of press fits between interfacing components. To make such a detailed decomposition required a substantial amount of time. In hindsight, the usefulness of the diagram does not weigh up the time invested into making it. That does not mean that creating a physical decomposition is a waste of time, but that it is important to limit the detail of the physical decomposition. “Time boxing” the work spent on creating the physical decomposition would be helpful to limit the work to what necessary.
The semi-abstract model (Figure 4B) was handed out to each of the individual engineers in the beginning of the meeting. In addition to the diagram itself, keywords pointing to possible areas of failure origin, (without being specific), were added to the model. The model used recognizable names, and the diagram layout of the abstract block was positioned so they corresponded to the actual layout. No explanation of the diagram was offered the participants. The senior engineers combined behavior towards the model was observed and graded in Table 2, results can be found in Table 3.
The engineers responded quite well to this model. It probably helped that it was constructed to represent the test cell physical layout. No explanation was needed to this model, and the

engineers were very positive towards it, wanting to use it for other purposes as well.
The turbine cross-section and the semi-abstract model were presented in the same session. They ignored the semiabstract model and focused only on the cross section. The reason for this might be that a cross-section was something they knew from before and had spent a lot of time on. Choosing between the two would then be easy, as something which is already known would feel safer. It was prominent that all failure modes suggested by the engineers where at a very detailed level. For each failure mode it was needed to ask questions to push them up to higher levels.
Annotated diagrams (Erreur ! Source du renvoi introuvable.A) were created to improve the performance of the clean layout. This diagram was also presented to the participants without any explanation. Each participant got their own printout of the model. The combined behavior towards the model was observed and graded in Table 2.
The layout cross section, which everybody responded to, was used to control the discussion theme more easily. Input to and outputs from the turbine as well as type of sensors were added. In addition the area of attention was highlighted and keywords pointing to the area of concern for that respective keyword added. An orange color was selected on the keyword annotations. This choice was due to the fact that it is widely accepted that orange enforces creative thinking in the human mind [4].
Experiment 3 Value of applying models Good feedback is invaluable in order to identify the value of applying the models. It is therefore of high importance to determine what kind of feedback is valuable such that a conclusion can be based upon it. The feedback came from two sources, observations from the meeting and from questioning the participants. It was determined that for the feedback from the participants a qualitative grading would be applied and for the observation a quantitative grading. Displayed in Figure is a small scheme with the kind of information that was needed to evaluate the value of system models applied in the sessions.
Figure 5 - INFROMATION NEEDED
Three methods were applied to get feedback from the group. One was to have a small session

after the meeting, where the participants discussed the value of using the system models. The second method was to hand out a question sheet to each participant. The third method was to send e-mails with the questions.
It was discovered when having a session after the meeting that the participants became influenced by each other's opinions, and tried to agree on the value. When sending the questions by e-mail, only 1 out of 5 responded. The reason is most likely that the engineers are being overloaded by e-mails, if they don't have time to answer it immediately, it is forgotten. When handing out question sheets at the end of the meeting 4 out of 5 responded. The feedback from the question sheets where more individual and therefore gave more diverse answers.
The method of handing out question sheets for gathering information was to become the most successful and therefore became the most widely used method.
The questions drafted were, as following.
• What do you think is the advantage of having these kinds of models?
• What do you think is the disadvantage of having these kinds of models?
• Did the models help you think of new issues?
• Did the meeting help you think of new issues (things you knew of but did not view as an issue?)
• If you could change something, what would you change?
During the meetings the participants where presented with a theme. Every member got a printout of a model that could work as a representation of the theme or a tool that could be referred to when discussing the theme. The models had features that represented parts of the system that were important and should not be overlooked.
An e-mail was sent with the models that were going to be used together with a description of the theme in order to make people more prepared for the meeting.
Research Findings
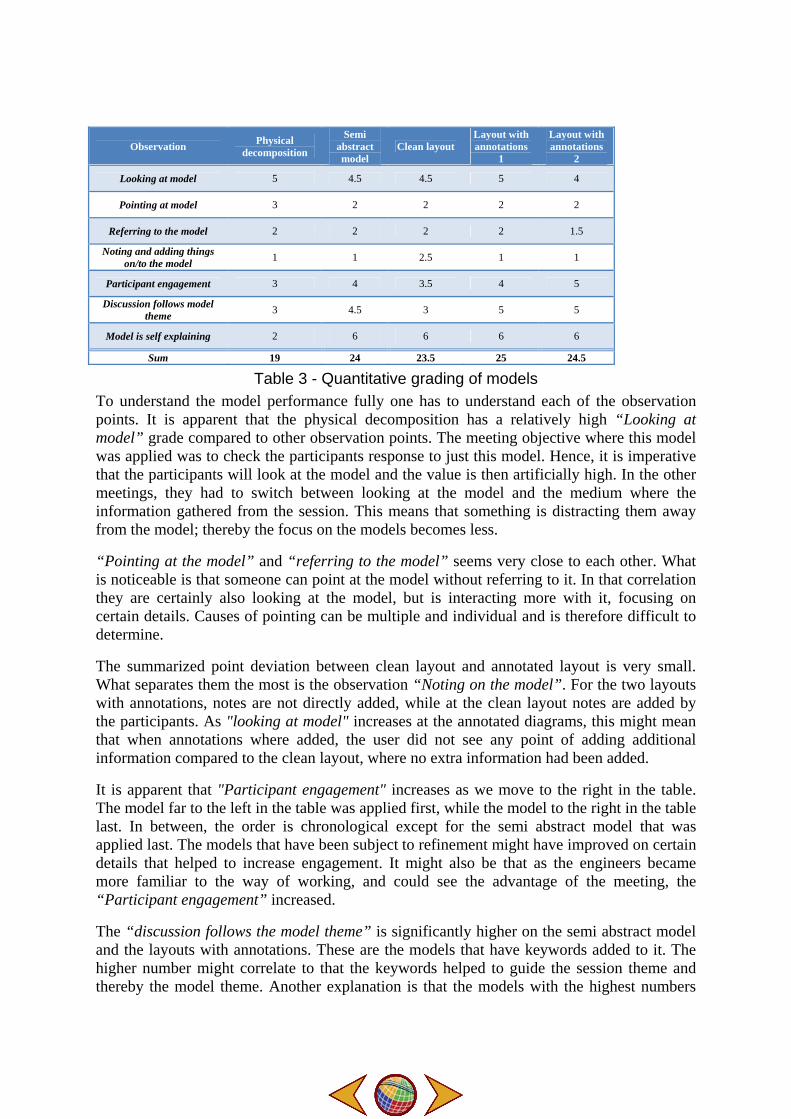
Finding type of models As mentioned, the interaction between senior engineers present in the sessions and the models applied was observed and graded. The resulting grading was collected into a single table (Table 3). When the values are summed up, it gives an indication of the overall performance of the model.
Observation Physical decomposition
Semi abstract model
Clean layout Layout with annotations
1
Layout with annotations
2
Looking at model 5 4.5 4.5 5 4
Pointing at model 3 2 2 2 2
Referring to the model 2 2 2 2 1.5
Noting and adding things on/to the model 1 1 2.5 1 1
Participant engagement 3 4 3.5 4 5
Discussion follows model theme 3 4.5 3 5 5
Model is self explaining 2 6 6 6 6
Sum 19 24 23.5 25 24.5
Table 3 - Quantitative grading of models To understand the model performance fully one has to understand each of the observation points. It is apparent that the physical decomposition has a relatively high “Looking at model” grade compared to other observation points. The meeting objective where this model was applied was to check the participants response to just this model. Hence, it is imperative that the participants will look at the model and the value is then artificially high. In the other meetings, they had to switch between looking at the model and the medium where the information gathered from the session. This means that something is distracting them away from the model; thereby the focus on the models becomes less.
“Pointing at the model” and “referring to the model” seems very close to each other. What is noticeable is that someone can point at the model without referring to it. In that correlation they are certainly also looking at the model, but is interacting more with it, focusing on certain details. Causes of pointing can be multiple and individual and is therefore difficult to determine.
The summarized point deviation between clean layout and annotated layout is very small. What separates them the most is the observation “Noting on the model”. For the two layouts with annotations, notes are not directly added, while at the clean layout notes are added by the participants. As "looking at model" increases at the annotated diagrams, this might mean that when annotations where added, the user did not see any point of adding additional information compared to the clean layout, where no extra information had been added.
It is apparent that "Participant engagement" increases as we move to the right in the table. The model far to the left in the table was applied first, while the model to the right in the table last. In between, the order is chronological except for the semi abstract model that was applied last. The models that have been subject to refinement might have improved on certain details that helped to increase engagement. It might also be that as the engineers became more familiar to the way of working, and could see the advantage of the meeting, the “Participant engagement” increased.
The “discussion follows the model theme” is significantly higher on the semi abstract model and the layouts with annotations. These are the models that have keywords added to it. The higher number might correlate to that the keywords helped to guide the session theme and thereby the model theme. Another explanation is that the models with the highest numbers

were applied in the later sessions. Therefore the participants might have gotten used to the way of working, adapting and better following the theme of concern.
Physical decomposition is separated from the other models mostly because it is more difficult to comprehend. The Physical decomposition scores 2 on the “Model is self explaining” scale. While the other models did not need any form of explanation and scored 6.
Value of applying models in a work group session to gather information for FTA and FMECA analysis. After reviewing the feedback from the engineers, it was evident that they could see a clear advantage of having the models present in the meeting. They even pointed out that having the keywords present in the model helped to start the brainstorming session. What was also pointed out was that the models helped to focus the thought process, stimulate mind and discussions as well as constraining the meeting within the objective. It was also indicated that using the correct type of models gave more involvement from the meeting participants.
What is important to remember is that applying models also might have its disadvantages. A model, as mentioned, helps focus the mind and promotes discussions on the theme represented at the model, but if the model has excluded important elements, those elements might lose focus. If the model is not constructed in a way that enforces new thinking, it might only enforce discussions around problems already identified and no new issues will appear.
It was evident that the session highlighted new issues which they either had not thought of before or had not viewed as an issue. What appeared to be difficult was to determine if the issues had appeared due to the models independently, the meeting itself or a combination. The feedback received implies that the model helped to a certain degree, but it was difficult to point out specific issues discovered due to the model. To trace the origin of the ideas leads to other implications, an idea originates seldom from only one source. It might be the combination of several sources. Whether all sources or just one of them can be traced back to the model applied, is very difficult to decide. One is therefore forced to trust the user feelings or opinions. There were few suggestions to change the meeting structure or model. It was suggested that having hardware available at the meeting may be an advantage. It might be that if the meeting participants were subjected to real hardware it would enforce engagement and creativity even more than having a well defined model. The accuracy of the feedback might have been deteriorated by some factors. The participants were told that all feedback is good feedback no matter if it gives a perceived positive or negative response. However, some unintentional goodwill may have affected the feedback.
Conclusion
In the restricted number of tests on the two different methods of gathering information, the result is more of an indication and is not conclusive. So far, the experience of using flip-over and Post-It to gather information was better than noting the information in a hierarchical order in a word document. The indication was that when subjected to a method that required a more physically active participation, the members seemed more engaged, and the discussions became more open. As for being able to draw a definite conclusion, more experiments are needed.
The theory was that applying models would promote discussion and engagement when applying it in a FTA and FMECA brainstorming session, but what is important to remember is that not all models will have the same response. From the experimental result in Table 3 it is seen that the model which has annotation added to a technical layout has the highest score. It was learned from the experiment that the engineers responded better to models where they could recognize a major element of the model. Adding annotations and keywords related to the model use, makes the model more valuable in meetings. The model's ability to be self explaining and valuable in meetings is closely related to whether the model helps enforcing engagement and creativity or not.
Looking at the feedback from the engineers present in the sessions, it is obvious that they thought it was useful to have this kind of model present. In this experiment most engineers have experience with working with gas turbines for up to 40 years. Still they thought that the models helped them to think of new types of failures. What is difficult to separate is if it truly was the model or the session itself that helped them to come up with the failure modes.
The feedback clearly suggests that it is beneficial to have well defined models present in brainstorming sessions. It helps focusing the discussion theme and enforces creativity.
Acknowledgments The author thanks Dresser-Rand for support and making it possible to conduct the research and to Dresser-Rand employees giving valuable feedback. Special acknowledgements are given to Dresser-Rand employees Tore Næss, Andrew Olsen and Erik Hewett for help and support. Acknowledgments are given to Even Engebakken and Arne Trandal for help, support and valuable feedback during all stages of the project.
REFERENCES [1] “Fault Tree Handbook” By: W. E. Vesely, F. F. Goldberg, N. H. Roberts & D. F. Haasl
[2] “System Analysis Failure Modes, Effects, and Criticality Analysis” By: Marvin Rausland
[3] “The Communication Effectiveness of System Models Using the UML versus Structured Techniques: A Field Experiment” By: Bruce C. Hungerford and Michael A Eierman.
[4] ”Fargene Forteller” By: Tove Steinbo
[5] “CAFCR: A Multi-view Method for Embedded Systems Architecting; Architectural Reasoning Explained” By: Gerrit Muller
Author Biography Levi Andrè Berg Vigdal received his BSc in Mechanics from Buskerud University College in 2006 and in 2010 he received his MSc in Systems Engineering from Stevens Institute of Technology. He is currently employed as a Product Engineer in the KG2-3G Department at Dresser-Rand Kongsberg.
Gerrit Muller received his Master’s degree in physics from the University of Amsterdam in 1979. He worked from 1980 until 1997 at Philips Medical Systems as a system architect, followed by two years at ASML as a manager of systems engineering, returning to Philips

(Research) in 1999. Since 2003 he has worked as a senior research fellow at the Embedded Systems Institute in Eindhoven, focusing on developing system architecture methods and the education of new system architects, receiving his doctorate in 2004. In January 2008 he became a full professor of systems engineering at Buskerud University College in Kongsberg, Norway.
Dr. Michael Pennotti is Associate Dean for Academics and Distinguished Service Professor in the School of Systems and Enterprises at Stevens Institute of Technology. A systems engineering leader for more than thirty years, Dr. Pennotti has broad experience with both technical and organizational systems. He spent twenty years at Bell Laboratories designing, analyzing, and improving the performance of three generations of anti-submarine warfare systems for the United States Navy. In 1990, he shifted his focus to business management, and over the next ten years, served on the senior leadership teams of three different businesses as Quality Director for AT&T Business Communications Systems, Human Resources Vice President for Lucent Technologies’ Enterprise Networks Group, and VP Quality for Avaya. Since joining Stevens in 2001, Dr. Pennotti has helped develop the SDOE Program into the largest graduate program in systems engineering in the world. He is a member of the International Council on Systems Engineering and a senior member of both the IEEE and the American Society for Quality. He holds Ph.D. and MS degrees in Electrical Engineering from the Polytechnic Institute of New York, a BEE from Manhattan College, and is a graduate of the AEA/Stanford Executive Institute for Technology Executives.