how aggressive do we get on lipids? christopher cannon, m.d. senior investigator, timi study group...
TRANSCRIPT
How Aggressive do How Aggressive do we get on Lipids? we get on Lipids?
Christopher Cannon, M.D.Christopher Cannon, M.D.Senior Investigator, TIMI Study GroupSenior Investigator, TIMI Study Group
Cardiovascular Division, Cardiovascular Division, Brigham and Women’s Hospital, Boston, MABrigham and Women’s Hospital, Boston, MA

CHD Event Rates in Secondary Prevention and ACS Trials
Updated from - O’Keefe, J. et al., J Am Coll Cardiol 2004;43:2142-6.
y = 0.1629x · 4.6776R² = 0.9029p < 0.0001
LDL Cholesterol (mg/dl)
CH
D E
ven
ts (
%)
PROVE-IT-PR
PROVE-IT-AT CARE-S
LIPID-S
HPS-S4S-S
HPS-P
CARE-P
LIPID-P
4S-P
0
5
10
15
20
25
30
30 50 70 90 110 130 150 170 190 210
TNT 80TNT 10A2Z 80
A2Z 20
IDEAL S20/40IDEAL A80

Cholesterol Trialist Collaboration Meta-Analysis of Dyslipidemia Trials
50%
40%
30%
20%
10%
0%
-10%
Adapted from CTT Collaborators. Lancet. 2005; 366:1267-78
0.5 1.0 1.5 2.0
Reduction in LDL Cholesterol (mmol/L)
Major Vascular EventsP
rop
ortio
nal R
educ
tion
in E
vent
Rat
e (S
E)
TNT
IDEAL

Recent Coronary IVUS Progression Trials
-1.2
-0.6
0
0.6
1.2
1.8
50 60 70 80 90 100 110 120
MedianChange
In PercentAtheromaVolume
(%)
Mean Low-Density Lipoprotein Cholesterol (mg/dL)
REVERSALpravastatin
REVERSALatorvastatin
CAMELOTplacebo
A-Plusplacebo
ACTIVATEplacebo
Relationship between LDL-C and Progression Rate
ASTEROIDrosuvastatin
r2= 0.95p<0.001
Nissen S. JAMA 2006

High-dose statin better High-dose statin worse
Odds Reduction
Event Rates
No./Total (%)
High Dose Std Dose
-16%3972/13798
(28.8)4445/13750
(32.3)
-16%1097/13798
(8.0)1288/13750
(9.4)
-12%462/13798
(3.3)520/13750
(3.8)
+3%340/13798
(2.5)331/13750
(2.4)
-6%808/13798
(5.9)857/13750
(6.2)
-18%316/13798
(2.3)381/13750
(2.8)
Coronary Death or Any Cardiovascular Event
Coronary Death or MI
Cardiovascular Death
Non-Cardiovascular Death
Total Mortality
Stroke
0.5 1 2.5
OR 0.8295% CI, 0.71-0.96p=0.012
Odds Ratio (95% CI)
Meta-Analysis of Intensive Statin Therapy All Endpoints
Cannon CP, et al.
OR, 0.9495% CI, 0.85-1.04P=0.20
OR, 1.0395% CI, 0.88-1.20p=0.73
OR, 0.8895% CI, 0.78-1.00p=.054
OR, 0.8495% CI, 0.77-0.91p=0.00003
OR, 0.8495% CI, 0.80-0.89p<0.0001
Cannon CP, et al. JACC 2006; 48: 438 - 445.
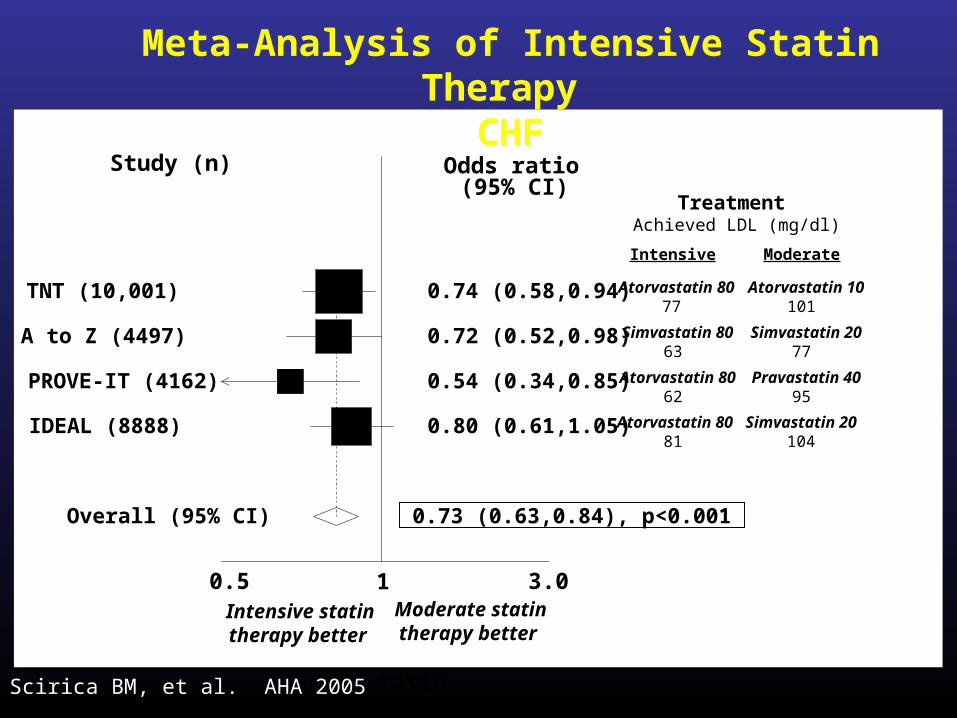
Odds ratio
0.5 1 3.0
Study (n)
Treatment Achieved LDL (mg/dl)
Odds ratio (95% CI)
0.74 (0.58,0.94) TNT (10,001) Atorvastatin 8077
0.72 (0.52,0.98) A to Z (4497) Simvastatin 8063
0.54 (0.34,0.85) PROVE-IT (4162) Atorvastatin 8062
0.80 (0.61,1.05) IDEAL (8888) Atorvastatin 8081
0.73 (0.63,0.84), p<0.001 Overall (95% CI)
Intensive statintherapy better
Moderate statintherapy better
Atorvastatin 10101
Simvastatin 2077
Pravastatin 4095
Simvastatin 20104
Intensive Moderate
Scirica BM, et al. AHA 2005
Meta-Analysis of Intensive Statin Therapy CHF
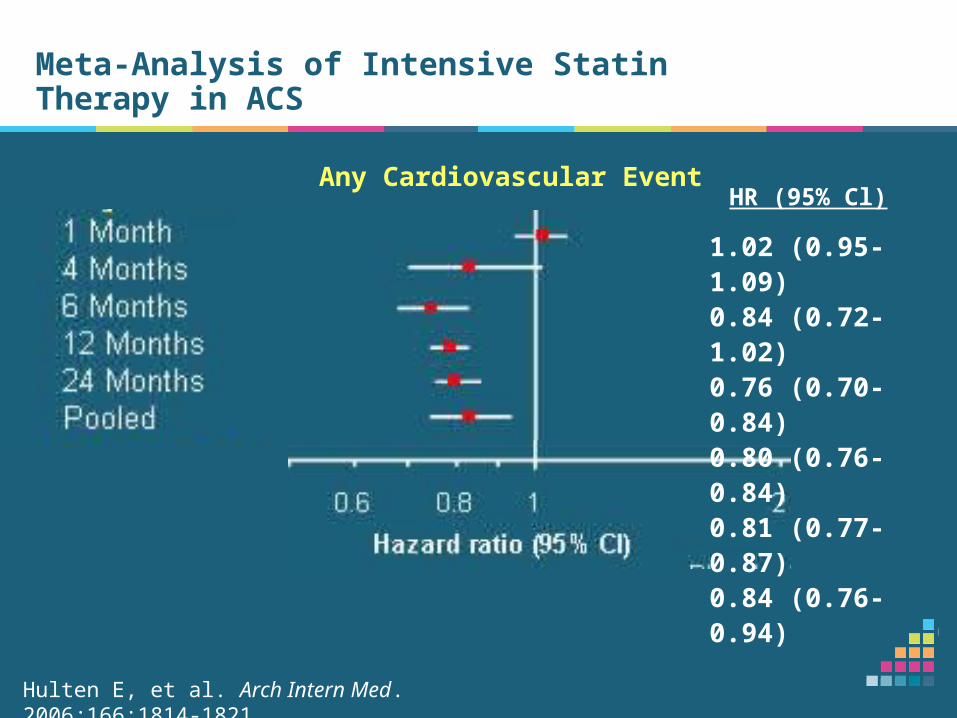
Meta-Analysis of Intensive Statin Therapy in ACS
Any Cardiovascular EventHR (95% Cl)
Hulten E, et al. Arch Intern Med. 2006;166:1814-1821
1.02 (0.95-1.09)0.84 (0.72-1.02)0.76 (0.70-0.84)0.80 (0.76-0.84)0.81 (0.77-0.87)0.84 (0.76-0.94)

ACS Patients: Major Coronary ACS Patients: Major Coronary Events Events MI + CHD Death + Resuscitated Cardiac ArrestMI + CHD Death + Resuscitated Cardiac Arrest
Years Since Randomization
Cu
mu
lati
ve H
azar
d (
%)
0 1 2 3 4 50
4
8
12
16
20
HR = .66 (95% CI = 0.46, 0.95), P=.02
34% RRR
Simvastatin
Atorvastatin
Pedersen, Olsson, Cater et al. Presented at World Congress of Cardiology 2006

20
40
30
0
10
0 30 months 5 years
Summary: 5 Years Of Follow-Up In IDEAL Is The Summary: 5 Years Of Follow-Up In IDEAL Is The Longest Period Of Follow-Up Of ACS Patients On Longest Period Of Follow-Up Of ACS Patients On Statin TherapyStatin TherapyC
ard
iac
Eve
nt
(%)
50
60
Atorvastatin 80 mg
Pravastatin 40 mg
Simvastatin 20-40 mg
16% RRRP=0.005
PROVE IT
MI or UA
18% RRRP=0.04
IDEAL
All MI
Pedersen, Olsson, Cater et al. Presented at World Congress of Cardiology 2006
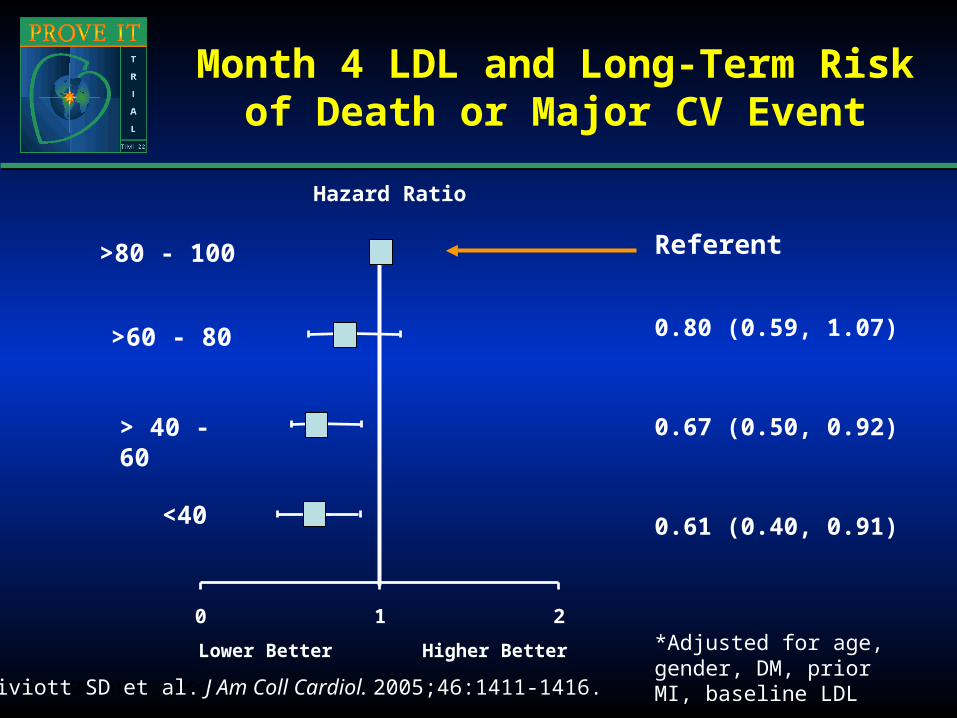
Month 4 LDL and Long-Term Risk of Death or Major CV Event
*Adjusted for age, gender, DM, prior MI, baseline LDL
Wiviott SD, et al. JACC. 2005
0.80 (0.59, 1.07)
0.67 (0.50, 0.92)
0.61 (0.40, 0.91)
Hazard Ratio
Lower Better Higher Better
Referent
0 1 2
<40
> 40 - 60
>60 - 80
>80 - 100
Wiviott SD et al. J Am Coll Cardiol. 2005;46:1411-1416.
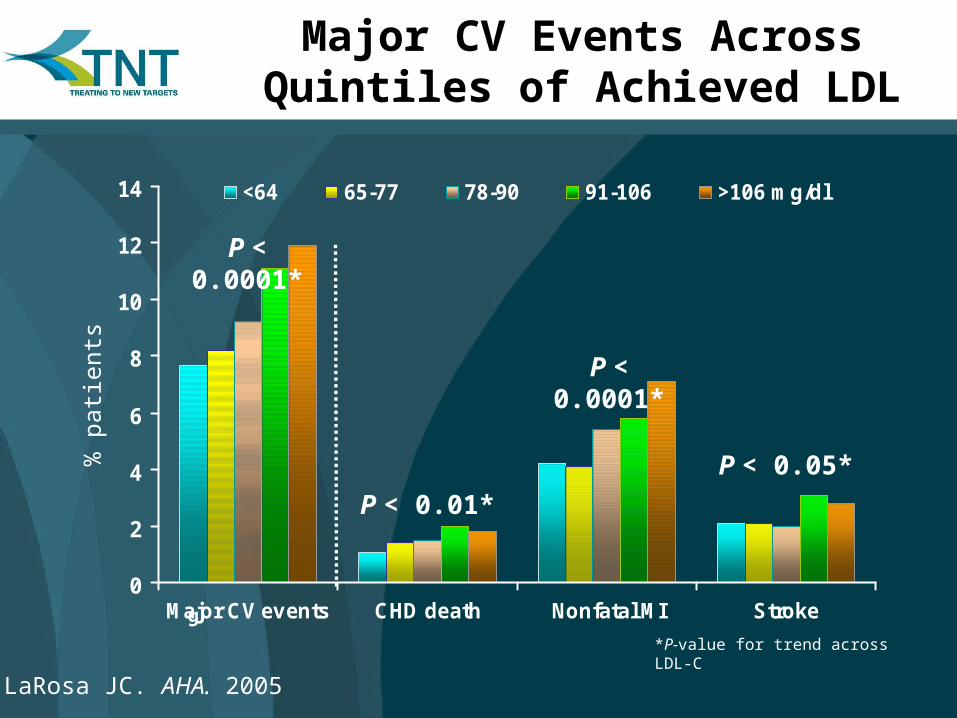
Screening0
2
4
6
8
10
12
14
Major CV events CHD death Nonfatal MI Stroke
<64 65-77 78-90 91-106 >106 mg/dl
P < 0.0001*
P < 0.01*
P < 0.0001*
P < 0.05*
*P-value for trend across LDL-C
Major CV Events Across Quintiles of Achieved LDL
LaRosa JC. AHA. 2005
% p
atie
nts

The Statin Decade:The Statin Decade:For LDL: “Lower is Better”For LDL: “Lower is Better”
0
5
10
15
20
25
30R² = 0.9029R² = 0.9029p < 0.0001p < 0.0001
LDL Cholesterol (mg/dl)
CH
D E
ven
ts (
%)
Adapted and Updated from O’Keefe, J. et al., J Am Coll Cardiol 2004;43:2142-6.
30 50 70 90 110 130 150 170 190 210
4S
CARELIPID
HPS
PROVE IT –TIMI 22
IMPROVE ITIMPROVE IT66665252
TNT
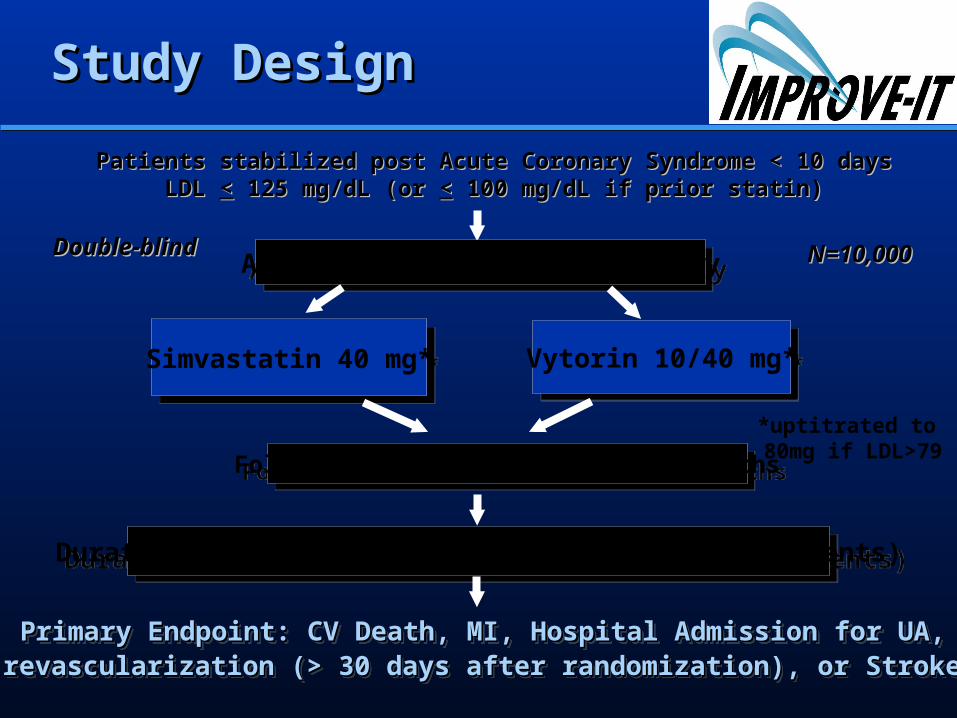
ASA + Standard Medical TherapyASA + Standard Medical Therapy
Simvastatin 40 mg*Simvastatin 40 mg* Vytorin 10/40 mg*Vytorin 10/40 mg*
Duration: Minimum 2 1/2 year follow-up (>2955 events)Duration: Minimum 2 1/2 year follow-up (>2955 events)
Primary Endpoint: CV Death, MI, Hospital Admission for UA, Primary Endpoint: CV Death, MI, Hospital Admission for UA, revascularization (> 30 days after randomization), or Strokerevascularization (> 30 days after randomization), or Stroke Primary Endpoint: CV Death, MI, Hospital Admission for UA, Primary Endpoint: CV Death, MI, Hospital Admission for UA, revascularization (> 30 days after randomization), or Strokerevascularization (> 30 days after randomization), or Stroke
Study DesignStudy Design
Double-blindDouble-blind
Patients stabilized post Acute Coronary Syndrome < 10 daysPatients stabilized post Acute Coronary Syndrome < 10 daysLDL LDL << 125 mg/dL (or 125 mg/dL (or << 100 mg/dL if prior statin) 100 mg/dL if prior statin)
N=10,000N=10,000
Follow-Up Visit Day 30, Every 4 MonthsFollow-Up Visit Day 30, Every 4 Months
*uptitrated to 80mg if LDL>79
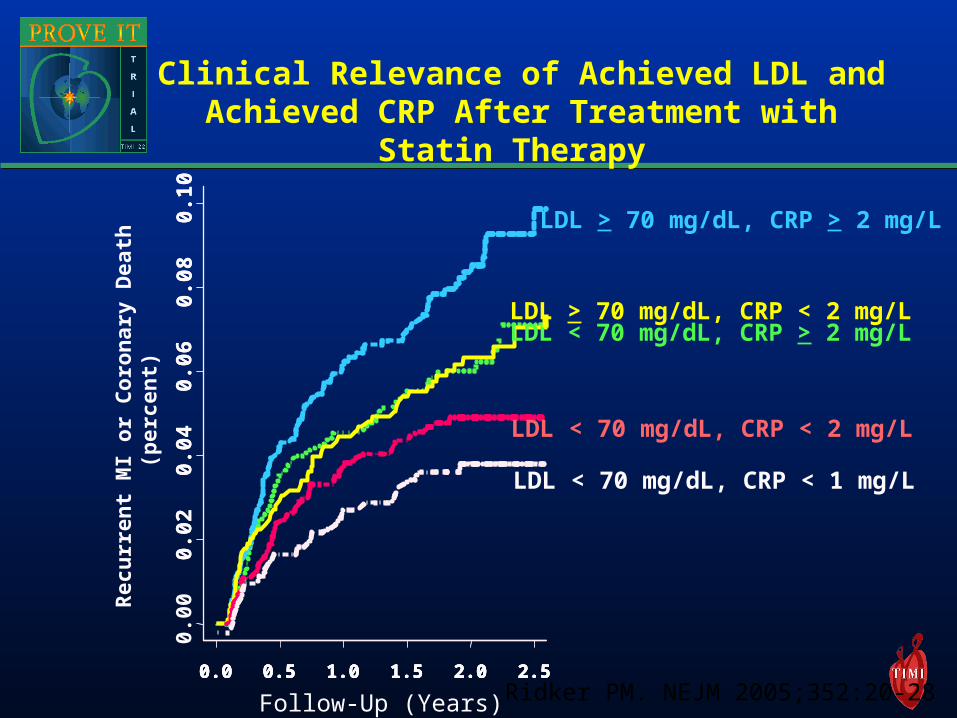
LDL > 70 mg/dL, CRP > 2 mg/L
0.0 0.5 1.0 1.5 2.0 2.50.0 0.5 1.0 1.5 2.0 2.50.0 0.5 1.0 1.5 2.0 2.50.0 0.5 1.0 1.5 2.0 2.5
0.00
0.02
0.04
0.06
0.08
0.10
0.02
0.04
0.06
0.08
0.10
Rec
urr
ent
MI o
r C
oro
nar
y D
eath
(p
erce
nt)
Follow-Up (Years)
LDL < 70 mg/dL, CRP > 2 mg/LLDL > 70 mg/dL, CRP < 2 mg/L
LDL < 70 mg/dL, CRP < 2 mg/L
LDL < 70 mg/dL, CRP < 1 mg/L
Clinical Relevance of Achieved LDL and Achieved CRP After Treatment with
Statin Therapy
Ridker PM. NEJM 2005;352:20-28
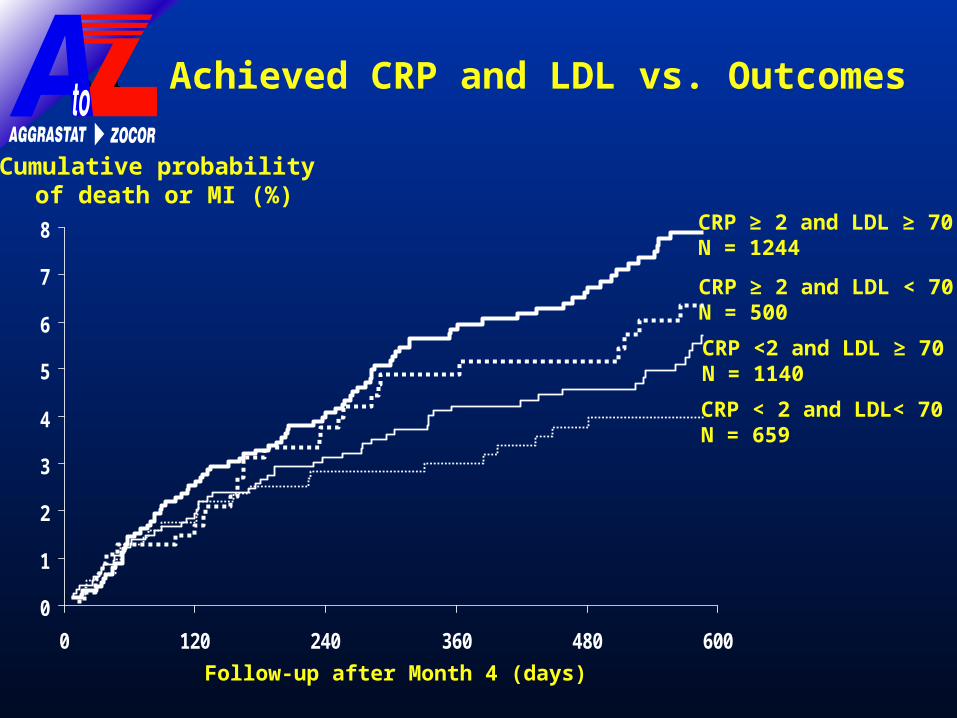
0
1
2
3
4
5
6
7
8
0 120 240 360 480 600
CRP < 2 and LDL< 70N = 659
CRP <2 and LDL ≥ 70N = 1140
CRP ≥ 2 and LDL ≥ 70N = 1244
CRP ≥ 2 and LDL < 70N = 500
Figure 4
Cumulative probability of death or MI (%)
Follow-up after Month 4 (days)
Achieved CRP and LDL vs. Outcomes

Death/MI/UA post-month 4, by Death/MI/UA post-month 4, by Month 4 Apo-B/Apo-A ratioMonth 4 Apo-B/Apo-A ratio
Month 4 Apo-B/Apo-A Ratio
End
poin
t P
roba
bilit
y
0.4 0.6 0.8 1.0
0.0
60
.08
0.1
00
.12
0.1
4
Combined

Month 4 Apo-B/Apo-A Ratio
En
dp
oin
t P
rob
abil
ity
0.4 0.6 0.8 1.0
0.0
60
.08
0.1
00
.12
0.1
4
CRP<2
CRP>=2
Ray AHA 05
The long term clinical risk of Apo The long term clinical risk of Apo B/AI can be further discriminated by B/AI can be further discriminated by
achieved CRP levels achieved CRP levels

Median Achieved hsCRP h
sCR
P m
g/d
l
0
1
2
3
1 mo 4 mo 8 mop = NS p < 0.001 p < 0.001
Placebo Simva 20
Simva 40 Simva 80
A to Z
p < 0.001
hsC
RP
mg
/dl
0
1
2
3
1 mo 4 mo 2 yrsp < 0.001 p < 0.001
Prava 40
Atorva 80PROVE IT

0 5 10 15 20 25 300
1
2
3
4
5Pravastatin 40 mg
Atorvastatin 80 mg
Hazard ratio = 0.72 (CI 0.52,0.99)
P=0.046
Days following randomization
% o
f p
atie
nts
wit
h d
eath
, MI o
r ,r
eho
spit
aliz
atio
n
for
AC
SDeath, MI or ACS Rehospitalization
(Early Phase)
KK Ray et al. JACC Oct. 2005 (in press)

What Factors are What Factors are Associated with Elevated Associated with Elevated CRP levels?CRP levels?Age (years) 1.01 <0.0001
Female on HRT vs Male 2.4 <0.0001
Female not on HRT vs Male 1.5 <0.0001
Current Smoker 1.5 <0.0001
BMI >25 kg/m2 1.4 <0.0001
HDLC <50mg/dl 1.2 0.0001
LDL 70 mg/dl 1.2 0.0003
Glucose >110 mg/dl 1.2 0.0009
Clinical Event Pre-month 4 1.4 0.0027
Trig >150 mg/dl 1.1 0.003
Atorvastatin 80mg 0.7 <0.0001
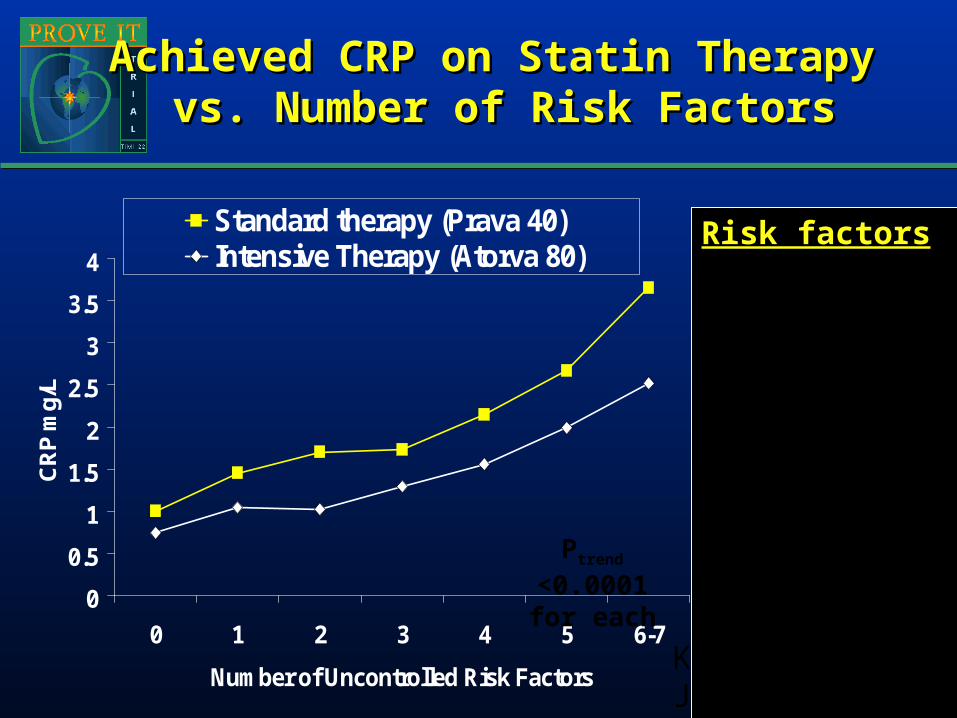
0
0.5
1
1.5
2
2.5
3
3.5
4
0 1 2 3 4 5 6-7
Number of Uncontrolled Risk Factors
CR
P m
g/L
Standard therapy (Prava 40)Intensive Therapy (Atorva 80)
Achieved CRP on Statin Therapy Achieved CRP on Statin Therapy vs. Number of Risk Factorsvs. Number of Risk Factors
Risk factors 1) BMI > 252) Current smoker3) HDL <504) TG > 1505) Glucose >1106) BP > 130/857) LDL >70
Ptrend <0.0001 for each
KK Ray et al.JACC 2005
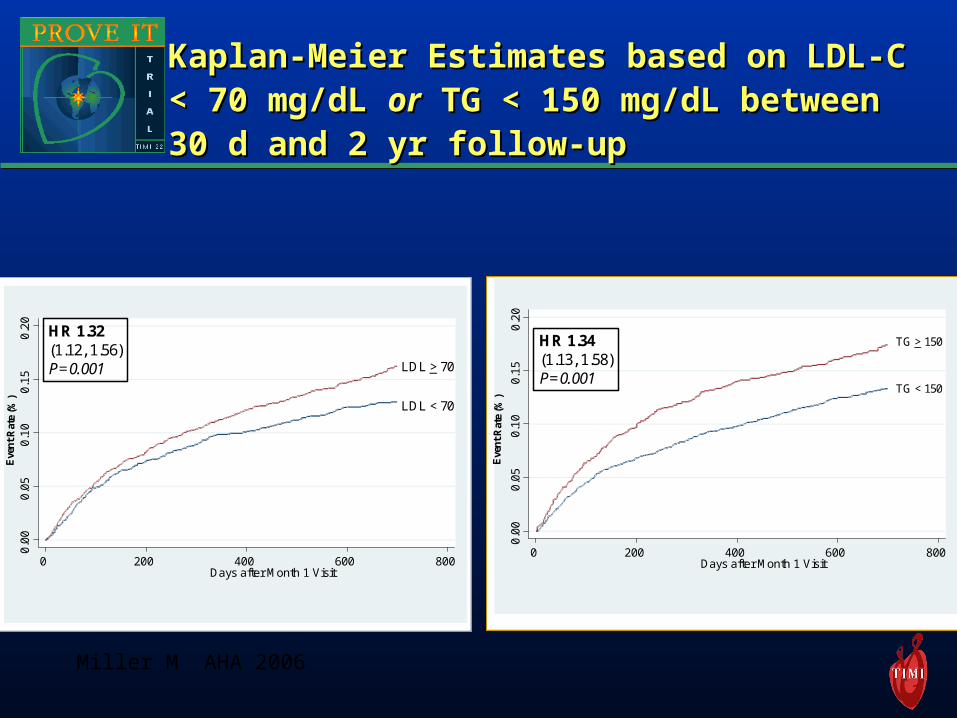
Kaplan-Meier Estimates based on LDL-C Kaplan-Meier Estimates based on LDL-C < 70 mg/dL < 70 mg/dL oror TG < 150 mg/dL between TG < 150 mg/dL between 30 d and 2 yr follow-up30 d and 2 yr follow-up
0.0
00
.05
0.1
00
.15
0.2
0
0 200 400 600 800Days after Month 1 Visit
LDL > 70
LDL < 70
HR 1.32(1.12, 1.56)P=0.001
Eve
nt
Rat
e (%
)
0.0
00.
05
0.1
00.
15
0.2
0
0 200 400 600 800Days after Month 1 Visit
HR 1.34(1.13, 1.58)P=0.001
TG > 150
TG < 150
Eve
nt
Rat
e (%
)
Miller M AHA 2006
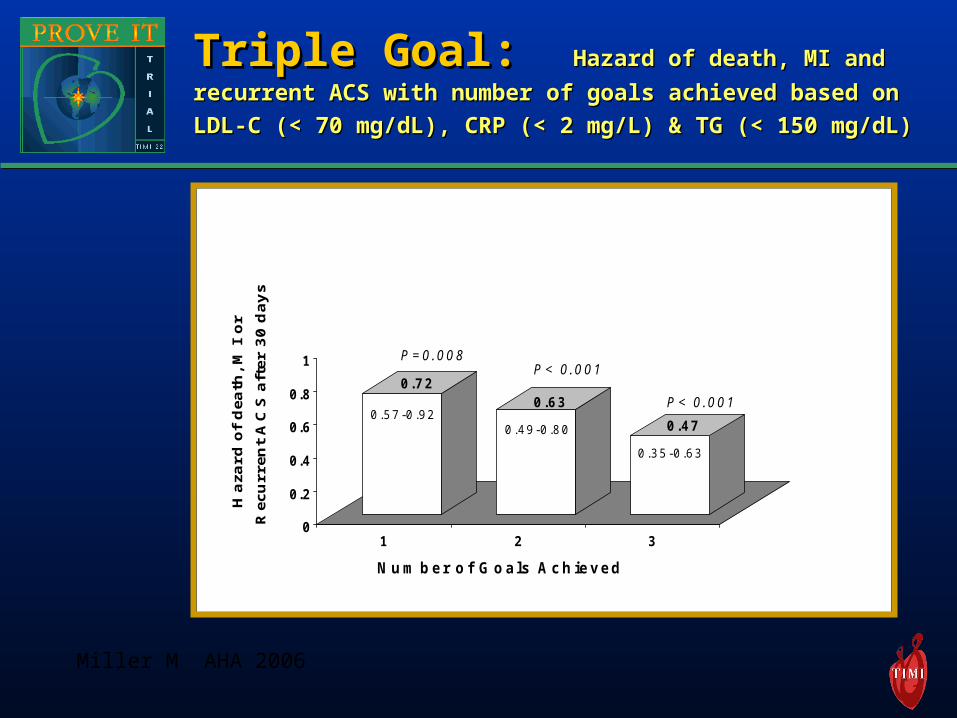
Triple Goal: Triple Goal: HHazard ofazard of death, MI and death, MI and
recurrent ACS with number of goals achieved based on recurrent ACS with number of goals achieved based on
LDL-C (< 70 mg/dL), CRP (< 2 mg/L) & TG (< 150 mg/dL)LDL-C (< 70 mg/dL), CRP (< 2 mg/L) & TG (< 150 mg/dL)
0
0 .2
0 .4
0 .6
0 .8
1
1 2 3
Ha
zar
d o
f d
eath
, M
I o
r
Re
cur
ren
t A
CS
aft
er
30
da
ys
0 .7 20 .6 3
0 .4 70 .5 7 -0 .9 2
0 .4 9 -0 .8 0
0 .3 5 -0 .6 3
P = 0 .0 0 8P < 0 .0 0 1
P < 0 .0 0 1
N u m b e r o f G o a ls A c h ie v e d
Miller M AHA 2006
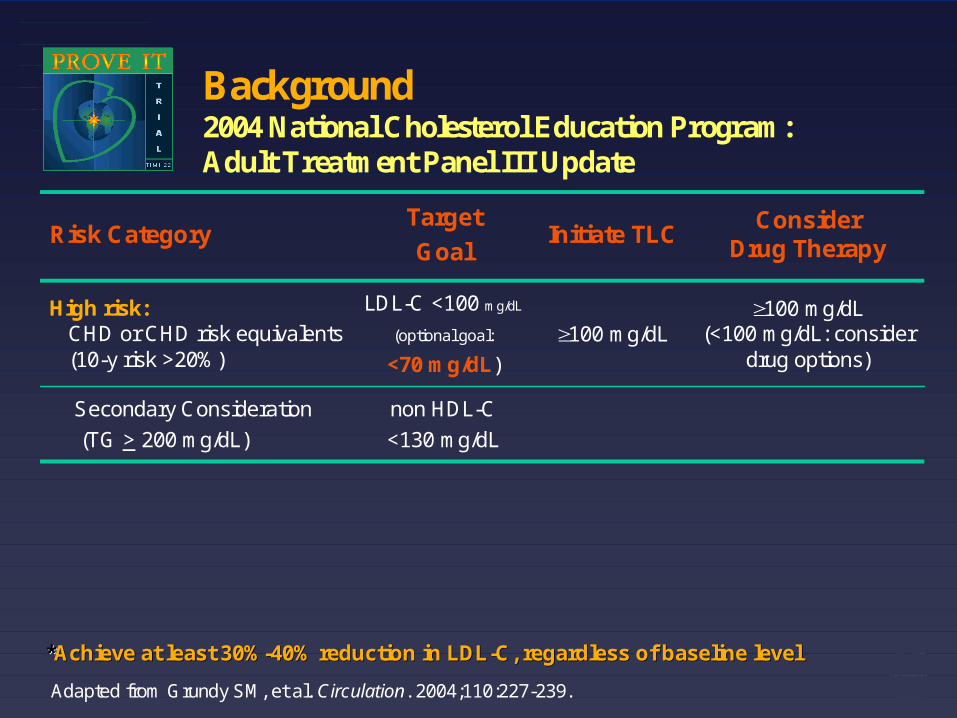
Background 2004 National Cholesterol Education Program: Adult Treatment Panel III Update
100 mg/dL
Initiate TLC
100 mg/dL (<100 mg/dL: consider
drug options)
Consider Drug Therapy
non HDL-C
<130 mg/dL
LDL-C <100 mg/dL
(optional goal:
<70 mg/dL)
Target
GoalRisk Category
Secondary Consideration
(TG > 200 mg/dL)
High risk: CHD or CHD risk equivalents (10-y risk >20%)
Adapted from Grundy SM, et al. Circulation. 2004;110:227-239.
**Achieve at least 30%Achieve at least 30%--40% reduction in LDL40% reduction in LDL--C, regardless of baseline levelC, regardless of baseline level
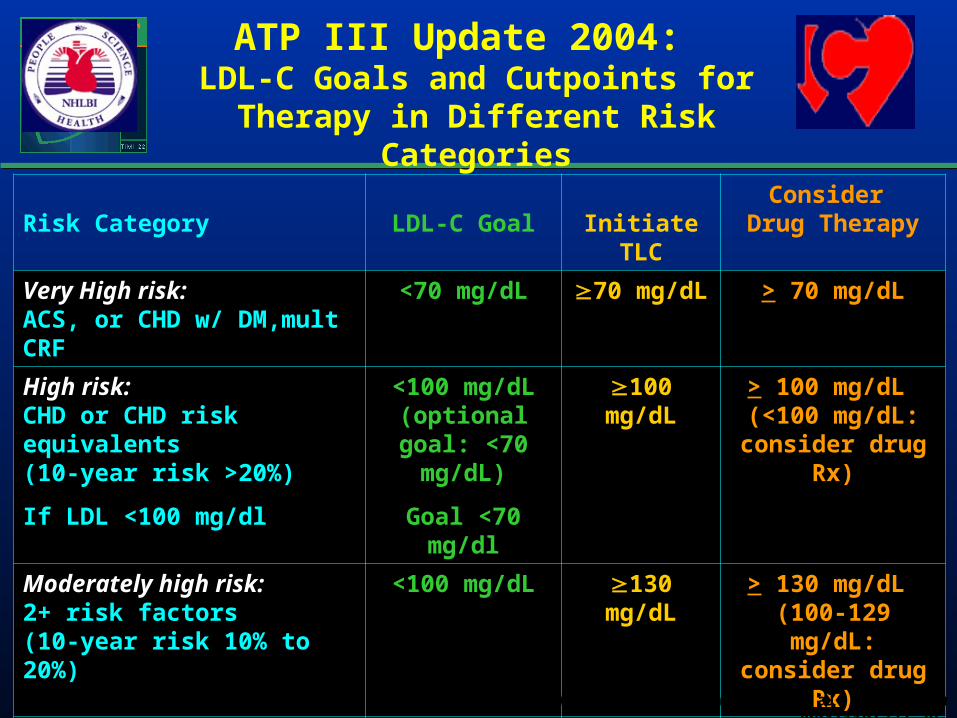
Risk Category LDL-C Goal Initiate TLCConsider
Drug Therapy
Very High risk: ACS, or CHD w/ DM,mult CRF
<70 mg/dL 70 mg/dL > 70 mg/dL
High risk: CHD or CHD risk equivalents
(10-year risk >20%)
If LDL <100 mg/dl
<100 mg/dL (optional goal:
<70 mg/dL)
Goal <70 mg/dl
100 mg/dL > 100 mg/dL (<100 mg/dL:
consider drug Rx)
Moderately high risk: 2+ risk factors (10-year risk 10% to 20%)
<100 mg/dL 130 mg/dL > 130 mg/dL (100-129 mg/dL:
consider drug Rx)
Moderate risk: 2+ risk factors ( risk <10%)
<130 mg/dL 130 mg/dL > 160 mg/dL
Lower risk: 0-1 risk factor
<160 mg/dL 160 mg/dL >190 mg/dL
ATP III Update 2004: LDL-C Goals and Cutpoints for Therapy
in Different Risk Categories
Adapted from Grundy, S. et al., Circulation 2004;110:227-39.
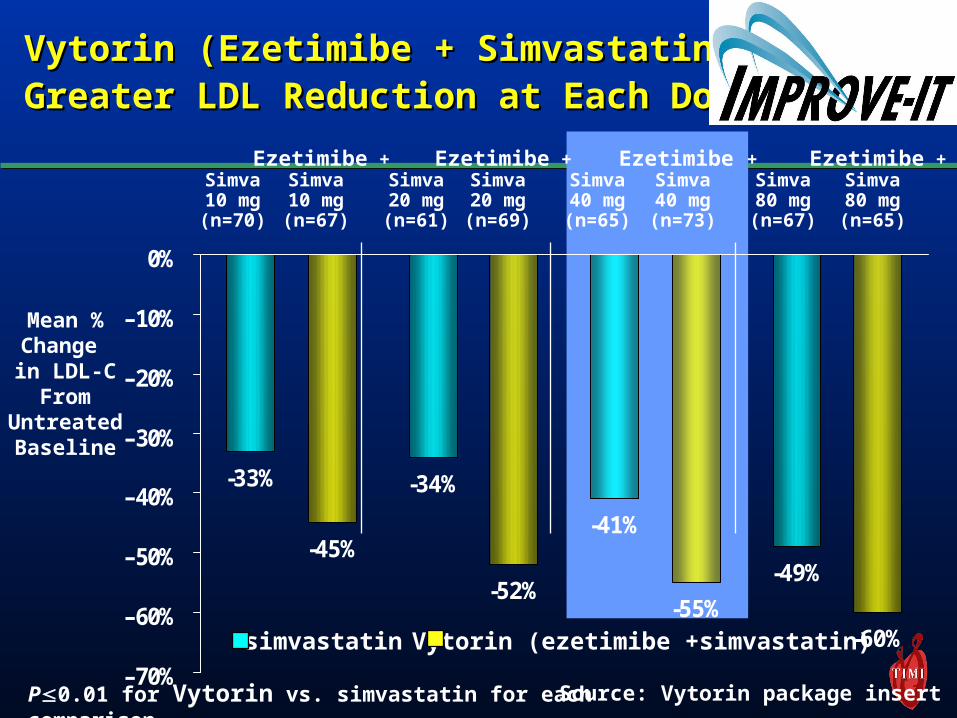
-49%
-41%
-34%-33%
-60%-55%
-52%
-45%
–70%
–60%
–50%
–40%
–30%
–20%
–10%
0%
Vytorin (Ezetimibe + Simvastatin) Vytorin (Ezetimibe + Simvastatin) Greater LDL Reduction at Each DoseGreater LDL Reduction at Each Dose
Simva80 mg(n=67)
Ezetimibe +Simva80 mg(n=65)
Simva40 mg(n=65)
Ezetimibe +Simva40 mg(n=73)
Simva20 mg(n=61)
Ezetimibe +Simva20 mg(n=69)
Simva10 mg(n=70)
Ezetimibe +Simva10 mg(n=67)
Mean %Change in LDL-C
FromUntreatedBaseline
simvastatin Vytorin (ezetimibe +simvastatin)
P0.01 for Vytorin vs. simvastatin for each comparison Source: Vytorin package insert
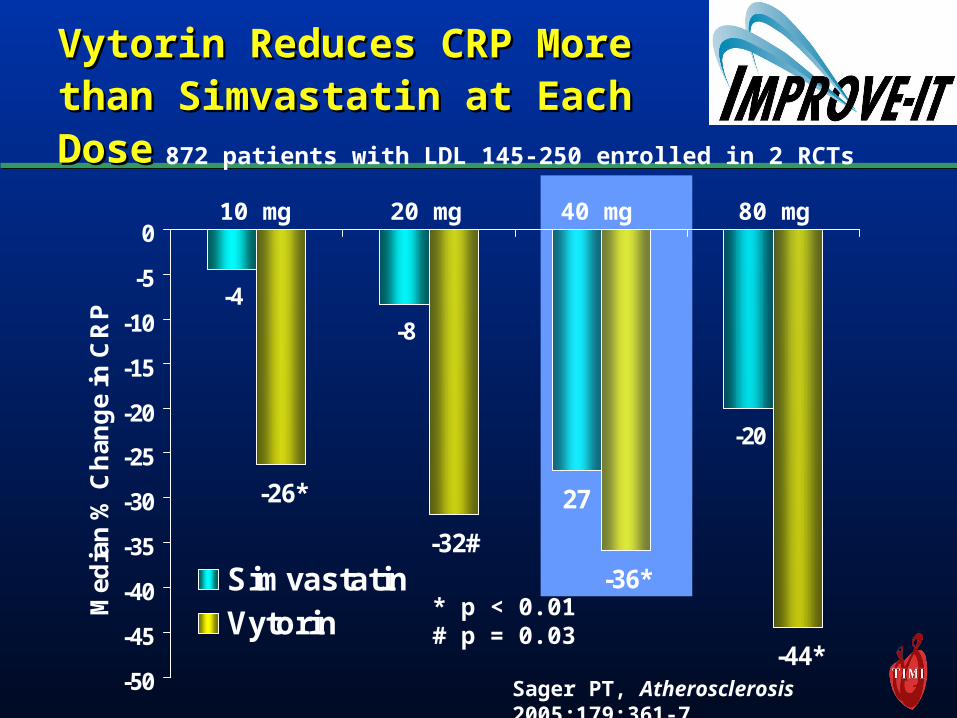
-4
-8
-20
27
-36*
-44*
-32#
-26*
-50
-45
-40
-35
-30
-25
-20
-15
-10
-5
0
Med
ian
% C
han
ge
in C
RP
SimvastatinVytorin
Vytorin Reduces CRP More Vytorin Reduces CRP More than Simvastatin at Each than Simvastatin at Each DoseDose
10 mg 20 mg 40 mg 80 mg
Sager PT, Atherosclerosis 2005;179:361-7
* p < 0.01# p = 0.03
872 patients with LDL 145-250 enrolled in 2 RCTs

Conclusions: Early Benefit of Conclusions: Early Benefit of Intensive Statin Therapy PROVE IT-Intensive Statin Therapy PROVE IT-TIMI 22TIMI 22
Lower is betterLower is better– LDLLDL– CRP CRP – TriglyceridesTriglycerides
““Dual goal” and “triple goal” with statins Dual goal” and “triple goal” with statins Lower LDL Lower LDL andand CRP and Trig, and probably CRP and Trig, and probably HDL HDL
Dual and triple therapy is frequently needed Dual and triple therapy is frequently needed to achieve dual and triple goalsto achieve dual and triple goals
(and probably) higher is better for HDL