houston drainage report aae 09172014 post kmp … · the city of houston is responsible ... (july...
TRANSCRIPT


Drainage Report & Impact Analysis
TABLE OF CONTENTS
1 INTRODUCTION. ................................................................................................................. 1
1.1 PROJECT DESCRIPTION AND LOCATION ........................................................................................................... 1
1.2 REPORT OBJECTIVES ............................................................................................................................................. 2
1.3 DRAINAGE DESIGN CRITERIA ............................................................................................................................. 3
1.4 DRAINAGE DESIGN ASSUMPTIONS .................................................................................................................... 4
2 DATA COLLECTION .......................................................................................................... 5
2.1 DATA COLLECTION AND ELEVATION DATA ................................................................................................... 5
2.2 ELEVATION DATA .................................................................................................................................................. 5
3 METHODOLOGY ................................................................................................................ 6
3.1 HYDROLOGY ........................................................................................................................................................... 6
3.2 HYDRAULICS AND CONCEPTUAL PUMP STATION SIZING .......................................................................... 7
3.3 CONCEPTUAL DETENTION SIZING ..................................................................................................................... 8
4 CONCEPTUAL DRAINAGE DESIGN .............................................................................. 9
4.1 OBJECTIVE................................................................................................................................................................ 9
4.2 ON-SITE DETENTION .............................................................................................................................................. 9
4.3 CONCEPTUAL DRAINAGE PLAN ........................................................................................................................ 10
4.3.1 LYONS GRADE SEPARATION ................................................................................................................ 12
4.3.2 RUNNELS GRADE SEPARATION ............................................................................................................ 13
4.3.3 COMMERCE / NAVIGATION GRADE SEPARATION ........................................................................... 14
4.3.4 YORK GRADE SEPARATION .................................................................................................................. 15
Drainage Report & Impact Analysis
4.3.5 LEELAND AND CULLEN GRADE SEPARATION ................................................................................ 16
5 SUMMARY AND CONCLUSIONS ................................................................................... 18
EXHIBITS EXHIBIT 1 - LOCATION MAP EXHIBIT 2 - CITY OF HOUSTON COMPREHENSVE DRAINAGE PLAN EXHIBIT 3 - CONCEPTUAL DRAINAGE PLAN
APPENDICES
APPENDIX A - FEMA FLOOD INSURANCE RATE MAPS
APPENDIX B - DETENTION AND PUMP SIZING CALCULATIONS
APPENDIX C - SMALL WATERSHED HYDROGRAPHS OF PUMPED AREAS APPENDIX D - LYONS DETENTION CALCULATIONS WITH HARDY
CONNECTOR
APPENDIX E - HARDY CONNECTOR DRAINAGE AREA MAP (DANNEBAUM ENGINEERING)
APPENDIX F - LEELAND AND CULLEN STORM SEWER UPSIZING OPTION

Drainage Report & Impact Analysis 1
1 INTRODUCTION
1.1 Project Description and Location
This report documents the drainage analysis for five proposed grade separation projects along
the Houston Belt and Terminal (HB&T) Railroad’s West Belt Subdivision. The grade separation
projects (referred to as the West Belt Improvements) are located within City of Houston limits
and east of the City of Houston downtown (Exhibit 1).
The West Belt Improvements include five proposed grade separations along the HB&T Railroad
where the railroad crosses:
• Lyons Avenue
• Runnels Street
• Commerce Street and Navigation Boulevard
• York Street
• Leeland Street and Cullen Boulevard.
The proposed project areas are within the Brays Bayou (Harris County Flood Control District
(HCFCD) Unit Number D100-00-00) and Buffalo Bayou (HCFCD Unit Number W100-00-00)
watersheds. The West Belt Improvements are within storm sewer systems W0660, W0703,
W0635, W0704, W0705, W0486, W0706, D0038 and D7005 as outlined in the City of Houston
Comprehensive Drainage Plan (CDP) and illustrated in Exhibit 2. The existing land use in the
project area is mainly urban.
This report discusses potential drainage issues and impacts due to the proposed roadway
profile changes and railroad grade separation. This report also provides a conceptual drainage
design for the West Belt Improvements.
The West Belt Improvements will incorporate input from various agencies including the Gulf
Coast Rail District (GCRD), City of Houston, HB&T Railroad, and the Texas Department of
Transportation (TxDOT). This analysis is primarily based on the requirements of TxDOT and the
City of Houston. TxDOT is responsible for overseeing the West Belt Improvements as the
projects will be partially federal funded. The City of Houston is responsible for maintenance of
the roadways and the storm sewer systems.

Drainage Report & Impact Analysis 2
The West Belt Improvements include lowering the roadway below the existing HB&T Railroad
tracks at the project locations described previously. Although the improvements will result in
minimal changes to impervious area, the project will provide detention ponds to protect the
proposed underpass areas from flooding. The detention ponds will detain storm water that is
pumped from the underpasses. In addition, the detention ponds will also detain overland runoff
from the existing sheet flow patterns that are obstructed by the proposed underpasses.
Storm water within the underpass limits will drain into a curb or drop inlet. From the inlets, the
storm water will flow into a storm sewer system and then will be pumped into a proposed
detention pond. The proposed detention pond outfall rates were based on the capacity of the
receiving storm sewer system. The design of inlets and storm sewer for the West Belt
Improvements will be performed in final design.
1.2 Report Objectives
The objectives of the report are as follows:
� Establish existing and proposed drainage areas for the project locations.
� Determine the peak flow rate at pump station locations for conceptual pump sizing.
� Determine detention pond locations and approximate required storage for the 100-year,
24-hour duration storm event.
� Determine the detention pond outfall locations.
� Identify potential impacts to the existing storm sewers within each project location.
� Provide a conceptual drainage plan that identifies drainage infrastructure (primarily
detention basins and pump station locations) where additional right-of-way will be
required. The right-of-way limits are critical in defining the project limits and preparing for
environmental clearance.
This report is not intended for final design purposes. Hydraulic calculations will be provided in
final design to show that the final design is in conformance with the conceptual drainage plan
presented in this report.

Drainage Report & Impact Analysis 3
1.3 Drainage Design Criteria
The drainage design criteria for this analysis are based on the requirements of both TxDOT and
City of Houston. Criteria for the design of the storm drainage improvements were established by
the TxDOT Hydraulic Design Manual, Revised May 2014; Chapter 9, Stormwater Design
Requirements of the City of Houston Infrastructure Design Manual (July 2012); the City of
Houston Technical Paper No. 101, Guidelines for Consideration of Overland Flow for the
Extreme Event, April 2005 (TP-101); and meeting minutes from project meetings with TxDOT.
The following is a list of the key project drainage criteria used in the study:
� The project will not adversely affect flooding for any adjacent properties.
� The project will provide a drainage design in accordance with the objectives of the City of
Houston (following guidelines presented in TP-101) to provide a combined drainage
system to protect from structural flooding during a 100-year event.
� At the request of TxDOT, the project detention requirements are be based on the 100-
year, 24-hour duration storm event (instead of the 3-hour duration as recommended in
TP-101).
� At the request of TxDOT, the peak flows are calculated using the TxDOT rainfall intensity-
duration-frequency coefficients for Harris County (obtained from TxDOT’s WinStorm
software) instead of the coefficients found in the City of Houston Infrastructure Design
Manual.
Underpass areas of the proposed grade separations require special safety considerations to
protect against vehicular flooding and drowning. The inlets, storm sewer, and pump stations in the
underpass area will be designed for the 100-year frequency storm event at the request of TXDOT,.

Drainage Report & Impact Analysis 4
1.4 Drainage Design Assumptions
The conceptual design of the detention ponds, pump stations, sheet flow corridors, and other
significant drainage infrastructure required for the proposed West Belt Improvements are made
based on the previously mentioned design manuals and technical papers. In addition, some
assumptions have been made to facilitate the creation of the conceptual drainage plan.
Outlined below are the assumptions made to facilitate the creation of the conceptual drainage
plan:
� Peak flows calculated for conceptual pump station sizing are based on the 100-year storm
event for the underpass areas.
� Peak runoff from underpass areas was calculated based on a fully impervious drainage
area with a runoff coefficient of C = 1.0 and a time of concentration of 10 minutes.
� Offsite drainage areas conservatively assumed as business district land use with a runoff
coefficient of C = 0.8.
� Detention ponds will discharge into existing storm sewer systems.
� Detention pond outfall release rates are based on the capacity of the receiving storm
sewers. The existing storm sewer systems were assumed to have 2-year capacity.

Drainage Report & Impact Analysis 5
2 DATA COLLECTION AND ELEVATION DATA
2.1 Data Collection
The data collected and used for the drainage analysis include United States Geological
Survey (USGS) topographic maps and t h e City of Houston GIMS information. As-built record
drawings of the existing storm sewer systems were reviewed to determine the sizes, capacity,
and approximate depth of the existing storm sewers.
The floodplain maps in the vicinity of the project locations were obtained from the latest
available Federal Emergency Management Agency (FEMA) Flood Insurance Rate Maps
(FIRM) and are included in Appendix B. The maps indicate that the West Belt project
locations are located outside the FEMA effective 100-year floodplain.
2.2 Elevation Data
Elevation data used in this analysis includes topographic survey and as-built drawings (to
approximate relative depths of existing storm sewers). In addition, contour data and overland
flow paths from the City of Houston GIMS website was used.

Drainage Report & Impact Analysis 6
3 METHODOLOGY
3.1 Hydrology
Peak flows were calculated using the rational method (Q=CIA). Rainfall intensity was calculated
using the following equation from the City of Houston Design Manual. This equation is known
as the rainfall intensity-duration-frequency (IDF) relationship. TxDOT’s b, d, and e coefficients
for Harris County were used in rational method calculations. The equation for rainfall intensity
is:
� =�
��� + �
where:
I = average rainfall intensity
tc = time of concentration
The time of concentration equation from the City of Houston IDM was used to calculate the time
of concentration of the project drainage areas to simplify drainage calculations. This equation is
shown below:
tc = 10A0.1761 + 15
The underpass drainage areas are small enough to have actual times of concentration shorter
than what is produced using the equation above. In order to provide a higher factor of safety
against underpass flooding, the TxDOT minimum time of concentration of 10 minutes was used
in calculating peak flows for underpass drainage areas.

Drainage Report & Impact Analysis 7
3.2 Hydraulics and Conceptual Pump Station Sizing
Hydraulic calculations for proposed storm sewer infrastructure associated with the West Belt
Improvements will be provided in final design. Hydraulic calculations will be performed based on
the requirements of TxDOT and the City of Houston.
Pumps stations are required to pump the surface runoff within the underpass areas to the
proposed detention ponds. Runoff outside the underpass areas will be captured prior to
reaching the underpass and routed directly to the detention ponds. Table 3-1 lists the peak flow
rate (cfs) for the 100-year event required to be pumped. The flow rates were calculated using
the rational method for the underpass drainage areas. Rational method calculations for the
areas to be pumped are shown in Appendix B. Wet wells will be sized in final design based on
Small Watershed method hydrographs of the pumped drainage areas shown in Appendix C.
Table 3-1 Summary of Conceptual Pump Station
Flow Rates (100 Year Event)
Location Peak Flow Rate (cfs)
Lyons 23.9
Runnels 32.2
Commerce and Navigation 55.8
York 49.9
Leeland and Cullen 81.9

Drainage Report & Impact Analysis 8
3.3 Conceptual Detention Sizing
Volumetric calculations based on a triangular Soil Conservation Service (SCS) hydrograph were
used to calculate the required detention pond volumes. The required detention volume is
calculated by subtracting out the volumes of storm water runoff that is conveyed through conduit
or overland flow from the total runoff volume. The methodology is described in detail in the City
of Houston’s TP-101 as a “Method 3 Analysis”. However, at the request of TxDOT, the 100-year
analysis was performed for the 24-hour duration storm event instead of the 3-hour duration
storm event recommended in TP-101. The 100-year, 24-hour duration rainfall depths were
obtained from Section 3.6.6 of the Harris County Flood Control District Policy, Criteria, and
Procedure Manual, December 2010 (HCFCD PCPM). The depths for Region 2 (Buffalo Bayou
Watershed) were used in the analysis. The TP-101 methodology is graphically illustrated in the
figure below. Detention volume calculations are shown in Appendix B.
Figure 3-1
Graphic Illustration of TP-101 Method 3
Drainage Report & Impact Analysis 9
4 CONCEPTUAL DRAINAGE DESIGN
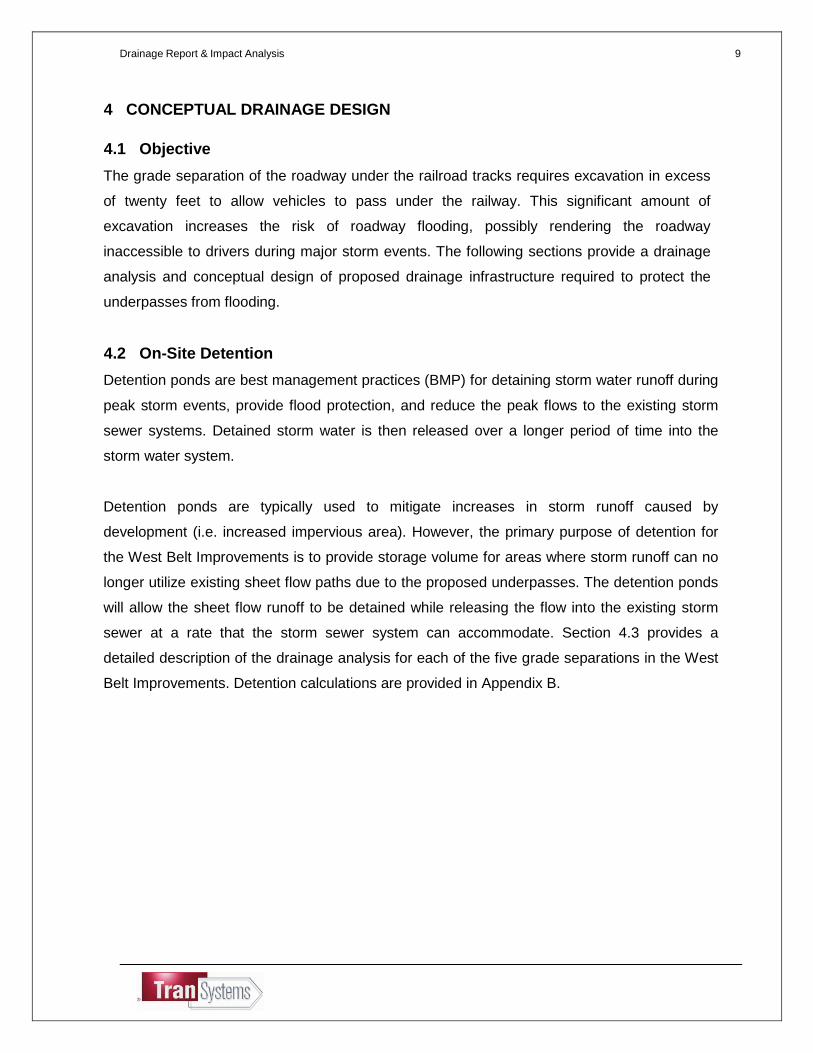
4.1 Objective
The grade separation of the roadway under the railroad tracks requires excavation in excess
of twenty feet to allow vehicles to pass under the railway. This significant amount of
excavation increases the risk of roadway flooding, possibly rendering the roadway
inaccessible to drivers during major storm events. The following sections provide a drainage
analysis and conceptual design of proposed drainage infrastructure required to protect the
underpasses from flooding.
4.2 On-Site Detention
Detention ponds are best management practices (BMP) for detaining storm water runoff during
peak storm events, provide flood protection, and reduce the peak flows to the existing storm
sewer systems. Detained storm water is then released over a longer period of time into the
storm water system.
Detention ponds are typically used to mitigate increases in storm runoff caused by
development (i.e. increased impervious area). However, the primary purpose of detention for
the West Belt Improvements is to provide storage volume for areas where storm runoff can no
longer utilize existing sheet flow paths due to the proposed underpasses. The detention ponds
will allow the sheet flow runoff to be detained while releasing the flow into the existing storm
sewer at a rate that the storm sewer system can accommodate. Section 4.3 provides a
detailed description of the drainage analysis for each of the five grade separations in the West
Belt Improvements. Detention calculations are provided in Appendix B.

Drainage Report & Impact Analysis 10
4.3 Conceptual Drainage Plan
The following approach was used in developing a conceptual drainage design for the
proposed grade separations:
� Determine the drainage area for the proposed underpass limits and calculate the 100-
year rational method peak flow. The peak flow from the underpass drainage area will
be the required pump capacity for the 100-year storm event as discussed in Section
3.2.
� Delineate offsite drainage areas and evaluate overland sheet flow patterns to
determine the following:
1) The proposed sheet flow corridors that will need to be provided.
2) The additional detention volume that needs to be provided for offsite drainage
areas where existing sheet flow paths cannot be preserved.
� Determine the detention volume required for the proposed grade separations to detain
storm runoff that is to be either of the following:
1) Pumped from the underpass drainage areas of the proposed grade separations.
2) Captured and detained prior to reaching the proposed underpasses (offsite
drainage areas) where existing sheet flow paths cannot be preserved.
Overland sheet flow patterns were analyzed for each of the five project locations. The existing
sheet flow patterns will be preserved as much as possible. In cases where the proposed
underpasses will impede the existing sheet flow paths, the detention basins have been sized
to detain runoff from the overland flow drainage areas. The volume of the proposed basins is
based on the 100-year, 24-hour storm event in accordance with directives from TxDOT.

Drainage Report & Impact Analysis 11
The following sections outline the conceptual drainage plans for each of the five grade
separations in the West Belt Improvements. Table 4-2 below summarizes the detention
requirements for each of the proposed grade separations.
Table 4-1 Summary of West Belt Improvements Required Detentio n Volumes
Grade
Separation
Location
Required
Detention
Volume
(acre-ft)
Proposed
Peak Outflow
(cfs)
Proposed Pond
Area and Depth
acre ft.
Lyons 2.0(1) 21.5 2.1 4
Runnels 9.3 30.8(2) 1.6 10
Commerce/Navigation
10.0 4.9 1.3 10
York 7.0 85.2(2) 0.9 10
Leeland/ Cullen
15.5 8.0 2.8 4
(1) Detention for offsite drainage areas of the Lyons grade separation is included in plans for the proposed
Hardy Connector at Interstate 10. The detention required assumes detention for the proposed Hardy
Connector is constructed prior to the proposed grade separation at Lyons. The detention required if the
Hardy Connector has not yet been constructed is 12.5 acre-feet.
(2) Peak Outflow includes consideration of other storm sewers conveying flow from overland drainage area.
Existing storm sewer systems assumed to have 2-year capacity in accordance with City of Houston TP-101
guidelines.
Drainage Report & Impact Analysis 12
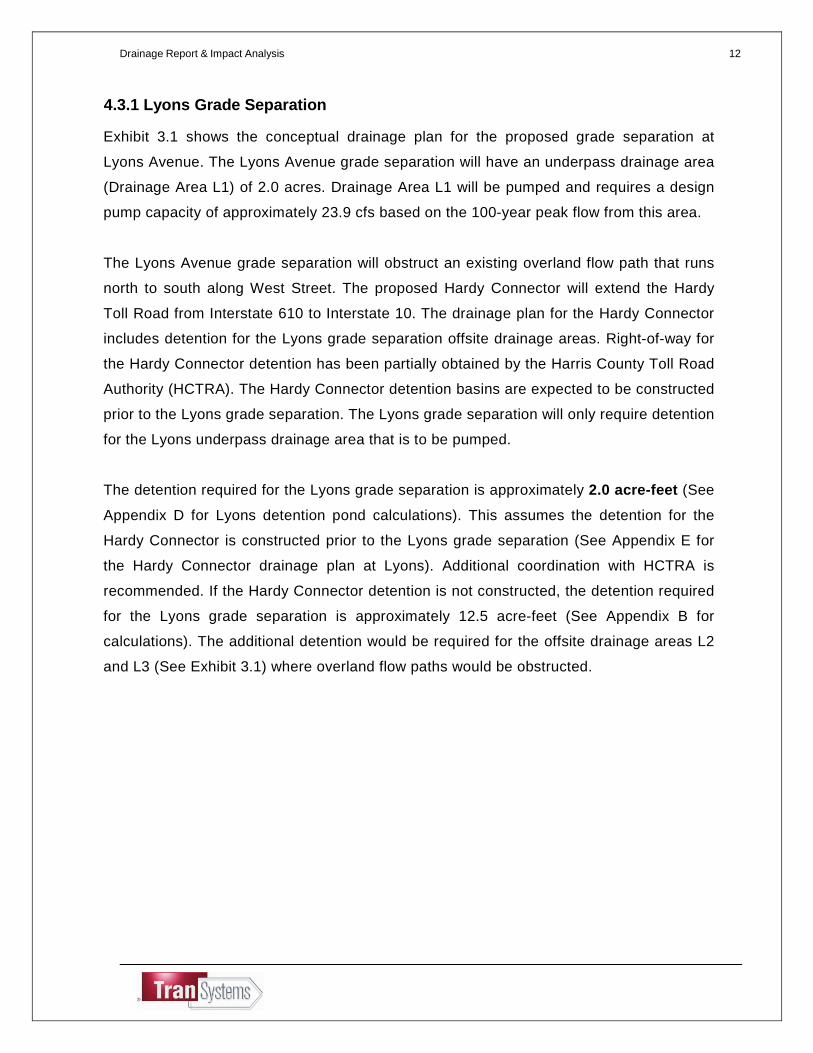
4.3.1 Lyons Grade Separation
Exhibit 3.1 shows the conceptual drainage plan for the proposed grade separation at
Lyons Avenue. The Lyons Avenue grade separation will have an underpass drainage area
(Drainage Area L1) of 2.0 acres. Drainage Area L1 will be pumped and requires a design
pump capacity of approximately 23.9 cfs based on the 100-year peak flow from this area.
The Lyons Avenue grade separation will obstruct an existing overland flow path that runs
north to south along West Street. The proposed Hardy Connector will extend the Hardy
Toll Road from Interstate 610 to Interstate 10. The drainage plan for the Hardy Connector
includes detention for the Lyons grade separation offsite drainage areas. Right-of-way for
the Hardy Connector detention has been partially obtained by the Harris County Toll Road
Authority (HCTRA). The Hardy Connector detention basins are expected to be constructed
prior to the Lyons grade separation. The Lyons grade separation will only require detention
for the Lyons underpass drainage area that is to be pumped.
The detention required for the Lyons grade separation is approximately 2.0 acre-feet (See
Appendix D for Lyons detention pond calculations). This assumes the detention for the
Hardy Connector is constructed prior to the Lyons grade separation (See Appendix E for
the Hardy Connector drainage plan at Lyons). Additional coordination with HCTRA is
recommended. If the Hardy Connector detention is not constructed, the detention required
for the Lyons grade separation is approximately 12.5 acre-feet (See Appendix B for
calculations). The additional detention would be required for the offsite drainage areas L2
and L3 (See Exhibit 3.1) where overland flow paths would be obstructed.

Drainage Report & Impact Analysis 13
4.3.2 Runnels Grade Separation
Exhibit 3.2 shows the conceptual drainage plan for the Runnels Street proposed grade
separation. The Runnels Street grade separation has an underpass drainage area
(drainage area R1) of 2.7 acres. Drainage area R1 will be pumped and requires a design
pump capacity of approximately 32.2 cfs based on the 100-year peak flow from this area.
The Runnels Street grade separation will obstruct an existing sheet flow path that runs
north along the existing Houston Belt & Terminal Railroad tracks to Buffalo Bayou. A
proposed detention pond will be located south of Runnels and east of the Houston Belt &
Terminal Railroad tracks. The detention pond will detain storm water that is pumped from
the underpass area in addition to the runoff volume from contributing offsite drainage area
R2 (See Exhibit 3.2).
The proposed detention pond will outfall into an existing 42-inch storm sewer (City of
Houston Plan #16998) that is the main trunk line for City of Houston CDP drainage area
W0660. The existing 42-inch storm sewer is approximately thirty feet deep (from natural
ground to top-of-pipe) according to as-built drawings. The existing storm sewer will have
approximately four feet of cover at Runnels after the proposed grade separation is
constructed. The depth of the existing storm sewer will need to be verified prior to final
design.
The conduit flow component in the TP-101 detention evaluation was determined based on
the 2-year flow from the portion of the overland flow drainage area that is within City of
Houston CDP drainage area W0660 (allocated W0660 area). The total allocated W0660
area is 10.4 acres with a 2-year flow of 30.8 cfs.
The detention basin volume required at Runnels Street is approximately 9.3 acre-feet .
See detention pond calculations in Appendix B.

Drainage Report & Impact Analysis 14
4.3.3 Commerce / Navigation Grade Separation
Exhibit 3.3 shows the conceptual drainage plan for the Commerce Street and Navigation
Boulevard proposed grade separation. The Commerce Street and Navigation Boulevard
grade separation has an underpass drainage area (drainage area C1) of 4.7 acres.
Drainage area C1 will be pumped and requires a design pump capacity of approximately
55.8 cfs based on the 100-year peak flow from this area.
The proposed detention pond will be located north of Navigation Boulevard and west of the
Houston Belt & Terminal Railroad tracks. The detention pond will detain storm water that is
pumped from the underpass area in addition to the runoff volume from contributing offsite
drainage area C2. The overland flow path for offsite drainage area C2 (See Exhibit 3.3)
will be obstructed by the proposed Runnels underpass (see Section 4.3.2). The proposed
detention basin will outfall into the same existing 42-inch storm sewer as the Runnels
detention pond (City of Houston Plan #16998).
The detention pond outfall rate was determined based on the 2-year flow from the portion
of the detention pond drainage area that is within City of Houston CDP drainage area
W0660 (allocated W0660 area). The total allocated W0660 area is 1.5 acres with a 2-year
flow of 4.9 cfs. Proposed sheet flow corridors will be provided in the final design to
preserve the natural direction of flow from overland drainage areas C3 and C4 draining
away from the grade separation limits.
The detention pond volume required at Commerce / Navigation is approximately 10.0
acre-feet . See detention pond calculations in Appendix B.

Drainage Report & Impact Analysis 15
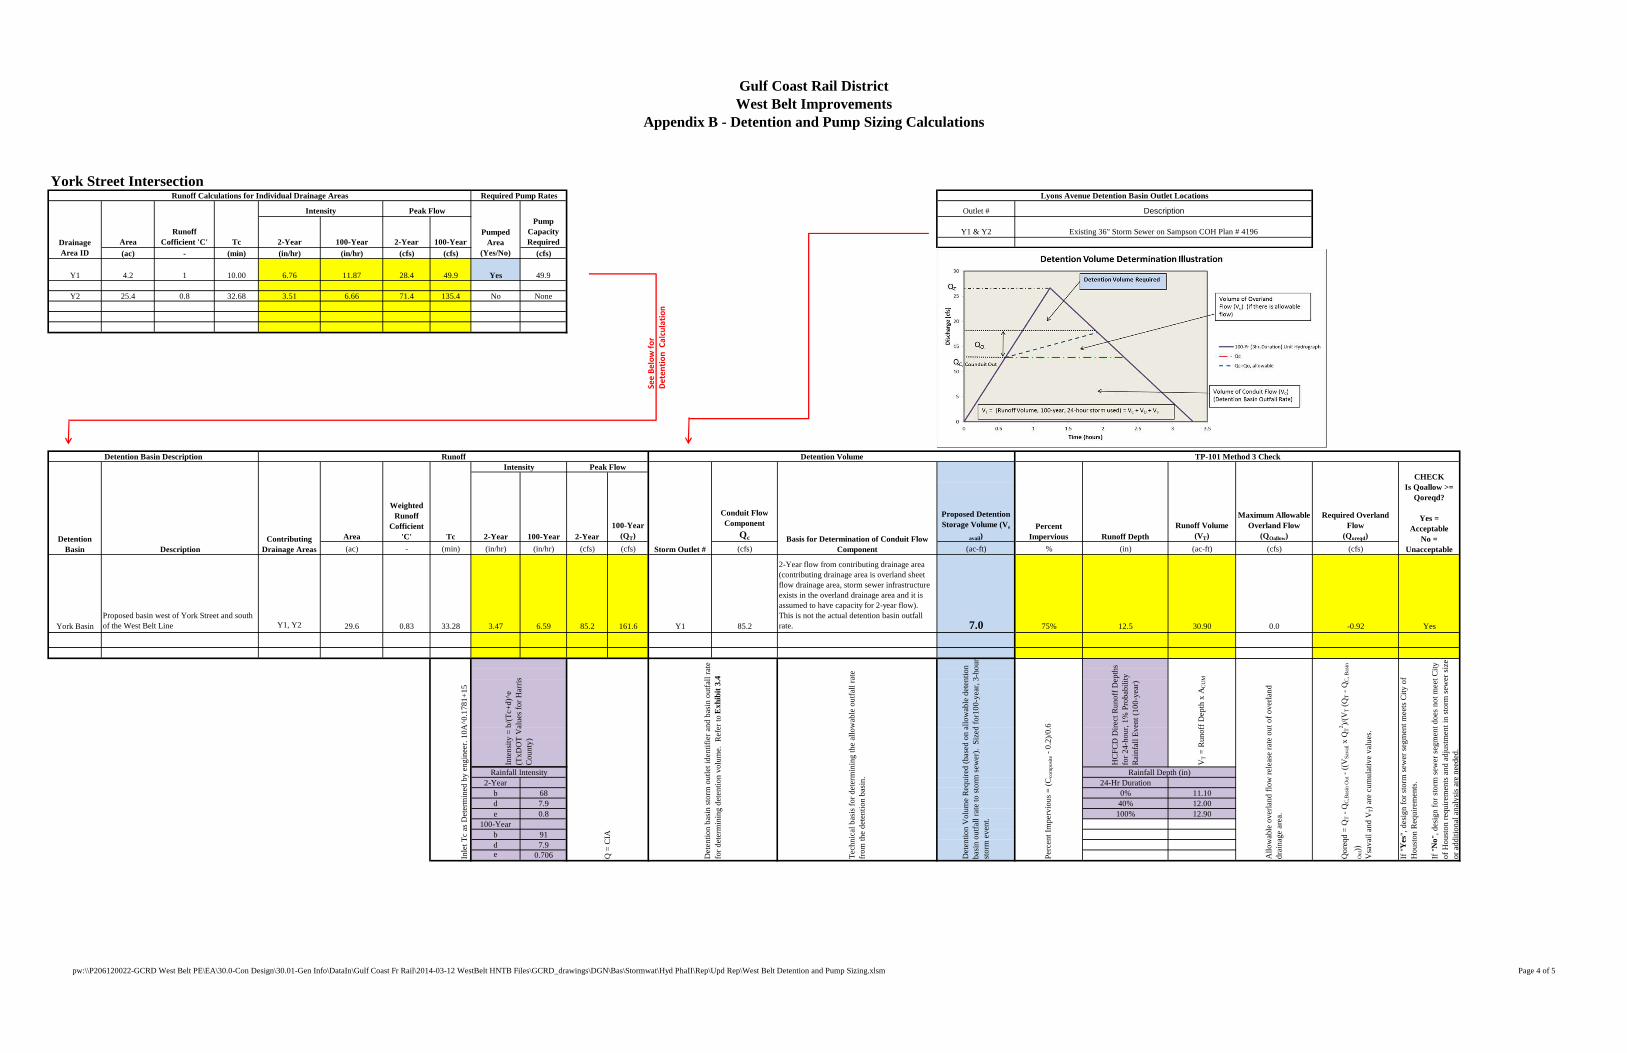
4.3.4 York Grade Separation
Exhibit 3.4 shows the conceptual drainage plan for the York Street proposed grade
separation. The York Street grade separation has an underpass drainage area (drainage
area Y1) of 4.2 acres. Drainage area Y1 will be pumped and requires a design pump
capacity of approximately 49.9 cfs based on the 100-year peak flow from this area.
The York grade separation will obstruct an existing sheet flow path north of Rusk Street
along the existing railroad corridor. A proposed detention pond will be located west of
Sampson Street on property currently owned by the Union Pacific Railroad. The detention
pond will detain storm water that is pumped from the underpass area in addition to the
runoff volume from contributing offsite drainage area Y2 (See Exhibit 3.4). The proposed
detention pond will outfall into existing storm sewer along Sampson Street (City of
Houston Plan #4196).
An existing 84-inch storm sewer trunk line for CDP drainage area D0038 (City of Houston
Plan #9495) crosses York Street at Lamar Street. The 84-inch storm sewer has been
located in survey and appears to have sufficient depth to not require relocation for the
proposed underpass at York Street.
Overland drainage area Y2 is served by several existing storm sewer systems that appear
to be interconnected based on City of Houston GIMS data. For analysis purposes, the 2-
year flow from offsite drainage area Y2 of 85.2 cfs was assumed to be conveyed in the
existing storm sewer systems by conduit flow.
The detention pond volume required at York is approximately 7.0 acre-feet . See detention
pond calculations in Appendix B.

Drainage Report & Impact Analysis 16
4.3.5 Leeland and Cullen Grade Separation
Exhibit 3.5 shows the conceptual drainage plan for the Leeland Street and Cullen
Boulevard proposed grade separation. The Leeland Street and Cullen Boulevard grade
separation has an underpass drainage area (drainage area LC1) of 6.9 acres. Drainage
area LC1 will be pumped and requires a design pump capacity of approximately 81.9 cfs
based on the 100-year peak flow from this area.
The existing 84-inch storm sewer trunk line along Leeland Street (City of Houston Plan
#4227 and 4071) does not have sufficient depth for the proposed depressed roadway
section and will need to be relocated. At the request of TxDOT, an option of upsizing the
storm sewer trunk line (in lieu of providing detention) was evaluated. A conceptual
hydraulic analysis (See Appendix F) was performed to determine the approximate amount
of storm sewer upsizing that would be required. The analysis assumed the existing system
was at capacity in the existing condition. Additional flow was added for the proposed
condition to account for the 100-year flow that would be pumped from the grade separation
limits and offsite drainage areas where overland flow paths were obstructed.
The analysis showed that approximately 2,100 linear feet of storm sewer would need to be
upsized to a 10’ x 7’ box culvert to accommodate the additional flow. The cost of the
proposed storm sewer alone would be approximately 1.3 million dollars (based on current
TxDOT unit price of $625 per linear foot of 10’ x 7’ box culvert). This cost does not include
the additional utility relocations and roadway reconstruction that would be required for the
upsizing the storm sewer downstream of the current project limits. The right-of-way
needed for the detention option will already need to be acquired due to access constraints
caused by the construction of the Leeland Street and Cullen Boulevard underpasses.
Therefore, the detention option was considered more economically feasible than the
upsizing option.
The proposed detention pond will be located south of Leeland Street and west of the
Houston Belt & Terminal Railroad tracks. The detention pond will detain storm water that is
pumped from the underpass area in addition to the runoff volume from contributing
overland drainage area LC2 (See Exhibit 3.5). The proposed detention pond will outfall
into the existing 84-inch storm sewer along Leeland Street (City of Houston Plan # 4227
and 4071).
Drainage Report & Impact Analysis 17
The detention pond release rate of 13.9 cfs was determined based on the 2-year flow from
the portion of the detention pond drainage area that is within City of Houston CDP
drainage area D0038 (allocated D0038 area). Proposed sheet flow corridors will be
provided in the final design to preserve the natural direction of overland flow from overland
drainage area LC3 (See Exhibit 3.5) along Hussion Street and Clay Street.
The detention pond volume required at Leeland Street and Cullen Boulevard is
approximately 15.5 acre-feet . See calculations in Appendix B.

Drainage Report & Impact Analysis 18
5 SUMMARY AND CONCLUSIONS
The purpose of this report is to document the drainage analysis for the five proposed
grade separation projects associated with the proposed West Belt Improvements. In
addition, this report provides a the conceptual drainage analysis and conceptual drainage
design for where the HB&T railroad crosses Lyons Avenue, Runnels Street, Commerce
Street and Navigation Boulevard, York Street, and Leeland Street and Cullen Boulevard.
The West Belt Improvements will result in minimal changes in impervious area from the
existing conditions. The conceptual detention basins are designed to outfall to the existing
City of Houston storm sewers based on the existing system capacity. The conceptual
detentions can provide storage volume for the following:
a. Overland drainage areas where the overland flow path is obstructed by the
proposed grade separations.
b. Storm water that is pumped from underpass areas of the proposed grade
separations.
2. Section 4.3 of this report outlines the conceptual drainage plans for the West Belt
Improvements. The conceptual drainage plans for the West Belt Improvements are shown
in Exhibit 3. Detention volume and pump sizing calculations are shown in Appendix B
(Appendix D for the Lyons Grade Separation). The required pump station capacities for
the grade separations are summarized in Table 4-1 and the required detention volumes
are shown in Table 4-2.

EXHIBIT 1 – Location Map
Lyons Avenue
Runn els Street
Commerce Street & Navigation Boulevard
York Street
Leeland Street & Cullen Boulevard
N

EXHIBIT 2 - City of Houston Comprehensive Drainage Plan Drainage Areas
Lyons Avenue
Runnels Street
Commerce Street & Navigation Boulevard
York Street
Leeland Street & Cullen Boulevard
N
W0486
W0660
W0635 W0705
D0038
W0706
D7005
W0703 W0704

EXHIBIT 3 – Preliminary Drainage Plan
EXHIBIT 3.1 – Lyons Avenue Grade Separation Preliminary Drainage Plan
EXHIBIT 3.2 – Runnels Street Grade Separation Preliminary Drainage Plan
EXHIBIT 3.3 – Commerce / Navigation Grade Separation Preliminary Drainage Plan
EXHIBIT 3.4 – York Street Preliminary Drainage Plan
EXHIBIT 3.5 – Leeland / Cullen Preliminary Drainage Plan

Canal
Commerce
Chart
res
Hamilto
n
CongressPreston
NavigationFranklin
Colby
Chen
evert
Hutch
ins
Saint
Charl
es
Jackso
n
Texas
Runnels
Bastr
op McAlpi
ne
Dowli
ng
Live O
ak
Bastr
op
Ramp
Saint
Eman
uel
24 -inchCOH Plan #
48 -inchCOH Plan #33944
24 -in
chCO
H Plan
#4412
18 -in
chCO
H Plan
#4035
24 -in
chCO
H Plan
#3525
6
21 -in
chCO
H Plan
#4035
42 -in
chCO
H Plan
#1699
8
24 -in
chCO
H Plan
#2926
24 -in
chCO
H Plan
#3394
4
24 -inchCOH Plan #41108
48 -inchCOH Plan #2526
30 -in
chCO
H Plan
#3394
4
18 -in
chCO
H Plan
#4412
24 -inchCOH Plan #16998
W0635
W0704
W0705
W0703W0660
W0661
£¤59
Source: Esri, DigitalGlobe, GeoEye, i-cubed, Earthstar Geographics, CNES/Airbus DS, USDA, USGS,AEX, Getmapping, Aerogrid, IGN, IGP, swisstopo, and the GIS User Community
Commerce / NavigationConceptual Drainage Plan
(Detention Using 100-year, 24-hour Storm Runoff Depths)City of Houston,
Harris County, TexasAugust 2014 Exhibit 3.3
LegendInterstatesUS HighwaysRailroadCDP Drainage AreasProposed PipeEdge of PavementStorm Node
LayerDetention PondsOffsite Drainage AreaPumped Drainage AreaExisting Storm SewerW0660 Allocated AreaSheet Flow Direction
W0660 Allocated Drainage Area(yellow highlight): 1.5 acres2-year peak flow: 4.9 cfs
1 in = 300 ft
56284.7
C3
2.018.8
L1 Drainage Area I.D.Acres
100-Year Flow (cfs)
(blue background= pumped area)
4.755.8
C1
Outfall C14.9 cfs
Detention Outfall
Proposed Pump Station
6.134.9
C2
¯
Proposed Sheet Flow Corridor
3.118.3
C4
Commerce/Navigation Detention BasinDetention Required: 10.0 Acre-ft(Routes Flow from Drainage AreasC1 and C2)
Runnels Detention Basin- See Exhibit 3.2

84 -inchCOH Plan #9495
30 -in
chCO
H Plan
#1619
2
18 -in
chCO
H Plan
#9495
18 -in
chCO
H Plan
#1577
24 -in
chCO
H Plan
#1028
7
72 -inchCOH Plan #9495
30 -in
chCO
H Plan
#1556
5
36 -in
chCO
H Plan
#1028
7
24 -in
chCO
H Plan
#1028
8
18 -inchCOH Plan #10287
30 -in
chCO
H Plan
#9495
21 -in
chCO
H Plan
#706518
-inch
COH P
lan #4
196
36 -in
chCO
H Plan
#4196
24 -in
chCO
H Plan
#4068
18 -inchCOH Plan #1732
30 -in
chCO
H Plan
#4068
24 -inchCOH Plan #2578
18 -inchCOH Plan #2921
60 -in
chCO
H Plan
#4196
24 -inchCOH Plan #18550
18 -in
chCO
H Plan
#1028
6
18 -inchCOH Plan #18550
18 -inchCOH Plan #2578
18 -inch
COH Plan #4068
36 -in
chCO
H Pla
n #40
68
36 -in
chCO
H Plan
#4196
24 -in
chCO
H Plan
#1855
0
York
Milby
McKinney
Texas
Samps
on
Rusk
Walker
Harrisburg
Robe
rts
Dallas
Scot
t
Preston
Saint
Jose
ph
Lamar
Evert
on
Polk
Capitol
Ennis
Saint
Augu
stine
Hutch
eson
Wilmer
Parki
ng Lo
t
Cullen
Lamar
Rusk
Rusk
Robe
rts
Capitol
Hutch
eson
D0038
W0706
W0656
D0953
W0705
Source: Esri, DigitalGlobe, GeoEye, i-cubed, Earthstar Geographics, CNES/Airbus DS, USDA, USGS,AEX, Getmapping, Aerogrid, IGN, IGP, swisstopo, and the GIS User Community
York StreetConceptual Drainage Plan
(Detention Using 100-year, 24-hour Storm Runoff Depths)City of Houston,
Harris County, TexasAugust 2014 Exhibit 3.4
LegendInterstatesUS HighwaysRailroadCDP Drainage AreasProposed PipeExisting Storm SewerStorm NodeEdge of PavementProposed DetentionOffsite Draiange AreaPumped Drainage AreaSheet Flow Direction
York Street Detention BasinDetention Required: 7.0 Acre-ft(Routes Flow from Drainage AreasY1 and Y2)
1 in = 300 ft
2.018.8
L1 Drainage Area I.D.Acres
100-Year Flow (cfs)
(blue background= pumped area)
4.249.9
Y1
Outfall Y1
Detention Outfall
Proposed Pump Station
25.4135.4
Y2¯
Proposed Sheet Flow Corridor
2-year flow from overland drainage area Y2 assumed to be conveyed in existing storm sewer system in accordance with TP-101 guidelines: 85.2 cfs
Outfall Y2

APPENDIX A – FEMA Flood Maps


APPENDIX B – Detention and Pump Sizing Calculations

Gulf Coast Rail DistrictWest Belt Improvements
Appendix B - Detention and Pump Sizing Calculations
Commerce Street and Navigation Boulevard Intersection
Outlet #
C1
(ac) - (min) (in/hr) (in/hr) (cfs) (cfs) (cfs)C1 4.7 1 10.00 6.76 11.87 31.8 55.8 Yes 55.8
C2 6.1 0.8 28.80 3.81 7.15 18.6 34.9 No None
C3 56.0 0.8 35.48 3.33 6.35 149.3 284.7 No None
C4 3.1 0.8 27.23 3.94 7.38 9.8 18.3 No None
Allocated W0660 Area 1.5 0.8 25.75 4.08 7.60 4.9 9.1 No None
(ac) - (min) (in/hr) (in/hr) (cfs) (cfs) (cfs) (ac-ft) % (in) (ac-ft) (cfs) (cfs)
Commerce/Navigation C1, C2 10.8 0.89 30.28 3.69 6.95 35.35 66.63 C1 4.9 10.0 75% 12.5 11.27 0.0 -2.07 Yes
n.a. C3 56 0.80 35.48 3.33 6.35 149.26 284.70 n.a 149.6 75% 12.5 58.45 143.4 158.30 No
n.a. C4 1.5 0.80 25.75 4.08 7.60 4.90 9.12 n.a. 4.9 75% 12.5 1.57 4.3 5.09 No
2-Year 24-Hr Durationb 68 0% 11.10d 7.9 40% 12.00e 0.8 100% 12.90
100-Yearb 91d 7.9e 0.706 If
"Y
es",
des
ign
for
stor
m s
ewer
seg
men
t mee
ts C
ity o
f H
oust
on R
equi
rem
ents
.
If "
No "
, des
ign
for
stor
m s
ewer
seg
men
t doe
s no
t mee
t City
of
Hou
ston
req
uire
men
ts a
nd a
djus
tmen
t in
stor
m s
ewer
siz
e or
add
ition
al a
naly
sis
are
need
ed.
Rainfall Intensity Rainfall Depth (in)
Det
entio
n V
olum
e R
equi
red
(bas
ed o
n al
low
able
det
entio
n ba
sin
outf
all r
ate
to s
torm
sew
er).
Siz
ed f
or10
0-ye
ar, 3
-hou
r st
orm
eve
nt.
Perc
ent I
mpe
rvio
us =
(C
com
posi
te -
0.2
)/0.
6
HC
FCD
Dir
ect R
unof
f D
epth
s fo
r 24
-hou
r, 1
% P
roba
bilit
y R
ainf
all E
vent
(10
0-ye
ar)
VT =
Run
off
Dep
th x
AC
UM
Allo
wab
le o
verl
and
flow
rel
ease
rat
e ou
t of
over
land
dr
aina
ge a
rea.
Qor
eqd
= Q
T -
QC
,Bas
in O
ut -
((V
Sav
ail x
QT
2 )/(V
T (
QT -
QC
, Bas
in
Out
))V
sava
il an
d V
T)
are
cum
ulat
ive
valu
es.
Inle
t Tc
as D
eter
min
ed b
y en
gine
er. 1
0A^0
.178
1+15
Inte
nsity
= b
/(T
c+d)
^e(T
xDO
T V
alue
s fo
r H
arri
s C
ount
y)
Q =
CIA
Det
entio
n ba
sin
stor
m o
utle
t ide
ntif
ier
and
basi
n ou
tfal
l rat
e fo
r de
term
inin
g de
tent
ion
volu
me.
Ref
er to
Exh
ibit
3.3.
Tec
hnic
al b
asis
for
det
erm
inin
g th
e al
low
able
out
fall
rate
fr
om th
e de
tent
ion
basi
n.
Sub-Area C3 (Provide Sheetflow Corridor)
Sub-Area C4 (Provide Sheetflow Corridor)
Proposed basin north of Commerce Street and west of West Belt Line 2-year flow from Allocated W0660 Area
2-Year 100-Year 2-Year100-Year
(QT) Basis for Determination of Conduit Flow Component
Conduit Flow Component
Qc
Proposed Detention Storage Volume (Vs
avail)Percent
Impervious Runoff DepthRunoff Volume
(VT)
Maximum Allowable Overland Flow
(QOallow)
Required Overland Flow
(Qoreqd)
CHECKIs Qoallow >=
Qoreqd?
Yes = Acceptable
No = Unacceptable
Commerce/Navigation Detention Outfall into Exist 42" RCP (COH Plan # 16998)
Detention Basin Description
Contributing Drainage Areas
Area
Weighted Runoff
Cofficient 'C'
Detention Basin Description Runoff Detention Volume TP-101 Method 3 Check
Tc
Intensity Peak Flow
Storm Outlet #
Runoff Calculations for Individual Drainage Areas Required Pump Rates Lyons Avenue Detention Basin Outlet Locations
Drainage Area ID
AreaRunoff
Cofficient 'C' Tc
Intensity Peak Flow
Pumped Area
(Yes/No)
Pump Capacity Required
Description
2-Year 100-Year 2-Year 100-Year
Se
e B
elo
w f
or
De
ten
tio
n
Ca
lcu
lati
on
pw:\\P206120022-GCRD West Belt PE\EA\30.0-Con Design\30.01-Gen Info\DataIn\Gulf Coast Fr Rail\2014-03-12 WestBelt HNTB Files\GCRD_drawings\DGN\Bas\Stormwat\Hyd PhaII\Rep\Upd Rep\West Belt Detention and Pump Sizing.xlsm Page 3 of 5
Gulf Coast Rail DistrictWest Belt Improvements
Appendix B - Detention and Pump Sizing Calculations
York Street Intersection
Outlet #
Y1 & Y2
(ac) - (min) (in/hr) (in/hr) (cfs) (cfs) (cfs)
Y1 4.2 1 10.00 6.76 11.87 28.4 49.9 Yes 49.9
Y2 25.4 0.8 32.68 3.51 6.66 71.4 135.4 No None
(ac) - (min) (in/hr) (in/hr) (cfs) (cfs) (cfs) (ac-ft) % (in) (ac-ft) (cfs) (cfs)
York Basin Y1, Y2 29.6 0.83 33.28 3.47 6.59 85.2 161.6 Y1 85.2 7.0 75% 12.5 30.90 0.0 -0.92 Yes
2-Year 24-Hr Durationb 68 0% 11.10d 7.9 40% 12.00e 0.8 100% 12.90
100-Yearb 91d 7.9e 0.706
Runoff Calculations for Individual Drainage Areas Required Pump Rates Lyons Avenue Detention Basin Outlet Locations
Drainage Area ID
AreaRunoff
Cofficient 'C' Tc
Intensity Peak Flow
Pumped Area
(Yes/No)
Pump Capacity Required
Description
2-Year 100-Year 2-Year 100-YearExisting 36" Storm Sewer on Sampson COH Plan # 4196
Detention Basin Description Runoff Detention Volume TP-101 Method 3 Check
2-Year 100-Year 2-Year100-Year
(QT)Detention Basin Description
Contributing Drainage Areas
Area
Weighted Runoff
Cofficient 'C' Tc
Peak FlowIntensity
Storm Outlet #
Conduit Flow Component
Qc Basis for Determination of Conduit Flow Component
Proposed Detention Storage Volume (Vs
avail)Percent
Impervious Runoff DepthRunoff Volume
(VT)
Maximum Allowable Overland Flow
(QOallow)
Required Overland Flow
(Qoreqd)
CHECKIs Qoallow >=
Qoreqd?
Yes = Acceptable
No = Unacceptable
Proposed basin west of York Street and south of the West Belt Line
2-Year flow from contributing drainage area (contributing drainage area is overland sheet flow drainage area, storm sewer infrastructure exists in the overland drainage area and it is assumed to have capacity for 2-year flow). This is not the actual detention basin outfall rate.
Inle
t Tc
as D
eter
min
ed b
y en
gine
er. 1
0A^0
.178
1+15
Inte
nsity
= b
/(T
c+d)
^e(T
xDO
T V
alue
s fo
r H
arri
s C
ount
y)
Q =
CIA
Det
entio
n ba
sin
stor
m o
utle
t ide
ntif
ier
and
basi
n ou
tfal
l rat
e fo
r de
term
inin
g de
tent
ion
volu
me.
Ref
er to
Exh
ibit
3.4
Tec
hnic
al b
asis
for
det
erm
inin
g th
e al
low
able
out
fall
rate
fr
om th
e de
tent
ion
basi
n.
If "
Yes
", d
esig
n fo
r st
orm
sew
er s
egm
ent m
eets
City
of
Hou
ston
Req
uire
men
ts.
If "
No "
, des
ign
for
stor
m s
ewer
seg
men
t doe
s no
t mee
t City
of
Hou
ston
req
uire
men
ts a
nd a
djus
tmen
t in
stor
m s
ewer
siz
e or
add
ition
al a
naly
sis
are
need
ed.
Rainfall Intensity Rainfall Depth (in)
Det
entio
n V
olum
e R
equi
red
(bas
ed o
n al
low
able
det
entio
n ba
sin
outf
all r
ate
to s
torm
sew
er).
Siz
ed f
or10
0-ye
ar, 3
-hou
r st
orm
eve
nt.
Perc
ent I
mpe
rvio
us =
(C
com
posi
te -
0.2
)/0.
6
HC
FCD
Dir
ect R
unof
f D
epth
s fo
r 24
-hou
r, 1
% P
roba
bilit
y R
ainf
all E
vent
(10
0-ye
ar)
VT =
Run
off
Dep
th x
AC
UM
Allo
wab
le o
verl
and
flow
rel
ease
rat
e ou
t of
over
land
dr
aina
ge a
rea.
Qor
eqd
= Q
T -
QC
,Bas
in O
ut -
((V
Sav
ail x
QT
2 )/(V
T (
QT -
QC
, Bas
in
Out
))V
sava
il an
d V
T)
are
cum
ulat
ive
valu
es.
Se
e B
elo
w f
or
De
ten
tio
n
Ca
lcu
lati
on
pw:\\P206120022-GCRD West Belt PE\EA\30.0-Con Design\30.01-Gen Info\DataIn\Gulf Coast Fr Rail\2014-03-12 WestBelt HNTB Files\GCRD_drawings\DGN\Bas\Stormwat\Hyd PhaII\Rep\Upd Rep\West Belt Detention and Pump Sizing.xlsm Page 4 of 5

APPENDIX C – Small Watershed Hydrographs of Pumped Areas

Gulf Coast Rail DistrictWest Belt Improvements
Appendix C - Small Watershed Hydrographs of Pumped Areas
Watershed Name: Commerce/NavigationArea (acres): 4.7Rainfall Excess (inches): 13.2% Impervious: 100%Peak Discharge (cfs): 55.8
Time to Peak (min): 48Recommended Time Interval (min): 5Calculation Time Interval (min): 5
Time(min) 0 5 10 15 20 25 30 35 40 45 50 55 60 65 70 75 80 85 90 95
Dev. Discharge 0 1.5 5.7 12.2 20.4 29.4 38.2 45.9 51.8 55.1 55.6 53.3 48.2 42.2 36.9 32.3 28.2 24.7 21.6 18.9
Time(min) 100 105 110 115 120 125 130 135 140 145 150 155 160 165 170 175 180 185 190 195
Dev. Discharge 16.5 14.4 12.6 11.0 9.6 8.4 7.4 6.4 5.6 4.9 4.3 3.8 3.3 2.9 2.5 2.2 1.9 1.7 1.5 1.3
0
10
20
30
40
50
60
0 100 200 300 400
Flo
w (
cfs)
Time (Minutes)
Commerce / Navigation, 100-Year 24-hr Storm Hydrograph
Developed Hydrograph
pw:\\P206120022-GCRD West Belt PE\EA\30.0-Con Design\30.01-Gen Info\DataIn\Gulf Coast Fr Rail\2014-03-12 WestBelt HNTB Files\GCRD_drawings\DGN\Bas\Stormwat\Hyd PhaII\Rep\Upd Rep\100-year Hydrographs for pumped areas.xlsm Page 3 of 5

Gulf Coast Rail DistrictWest Belt Improvements
Appendix C - Small Watershed Hydrographs of Pumped Areas
Watershed Name: YorkArea (acres): 4.2Rainfall Excess (inches): 13.2% Impervious: 100%Peak Discharge (cfs): 49.9
Time to Peak (min): 48Recommended Time Interval (min): 5Calculation Time Interval (min): 5
Time(min) 0 5 10 15 20 25 30 35 40 45 50 55 60 65 70 75 80 85 90 95
Dev. Discharge 0 1.3 5.1 10.9 18.3 26.3 34.2 41.1 46.3 49.3 49.8 47.6 43.1 37.7 33.0 28.8 25.2 22.0 19.3 16.8
Time(min) 100 105 110 115 120 125 130 135 140 145 150 155 160 165 170 175 180 185 190 195
Dev. Discharge 14.7 12.9 11.3 9.8 8.6 7.5 6.6 5.7 5.0 4.4 3.8 3.4 2.9 2.6 2.2 2.0 1.7 1.5 1.3 1.1
0
10
20
30
40
50
60
0 100 200 300 400
Flo
w (
cfs)
Time (Minutes)
York, 100-Year 24-hr Storm Hydrograph
Developed Hydrograph
pw:\\P206120022-GCRD West Belt PE\EA\30.0-Con Design\30.01-Gen Info\DataIn\Gulf Coast Fr Rail\2014-03-12 WestBelt HNTB Files\GCRD_drawings\DGN\Bas\Stormwat\Hyd PhaII\Rep\Upd Rep\100-year Hydrographs for pumped areas.xlsm Page 4 of 5