houston-area industrial market overview
TRANSCRIPT
Quarterly Market Overview
2017 Third Quarter FOR IMMEDIATE RELEASE
For more information, please contact: David Mendel, Public Relations Manager Phone: 713.629.1900 ext. 258 E‐mail: [email protected]
HOUSTON’S OFFICE MARKET RECOVERY SLOW,
INDUSTRIAL DEMAND REMAINS HIGH
HOUSTON — (October 18, 2017) — Houston’s commercial real estate market is
optimistic after grappling with Hurricane Harvey amid the continued energy recovery, according
to quarterly market research compiled by Commercial Gateway, the commercial division of the
Houston Association of Realtors (HAR).
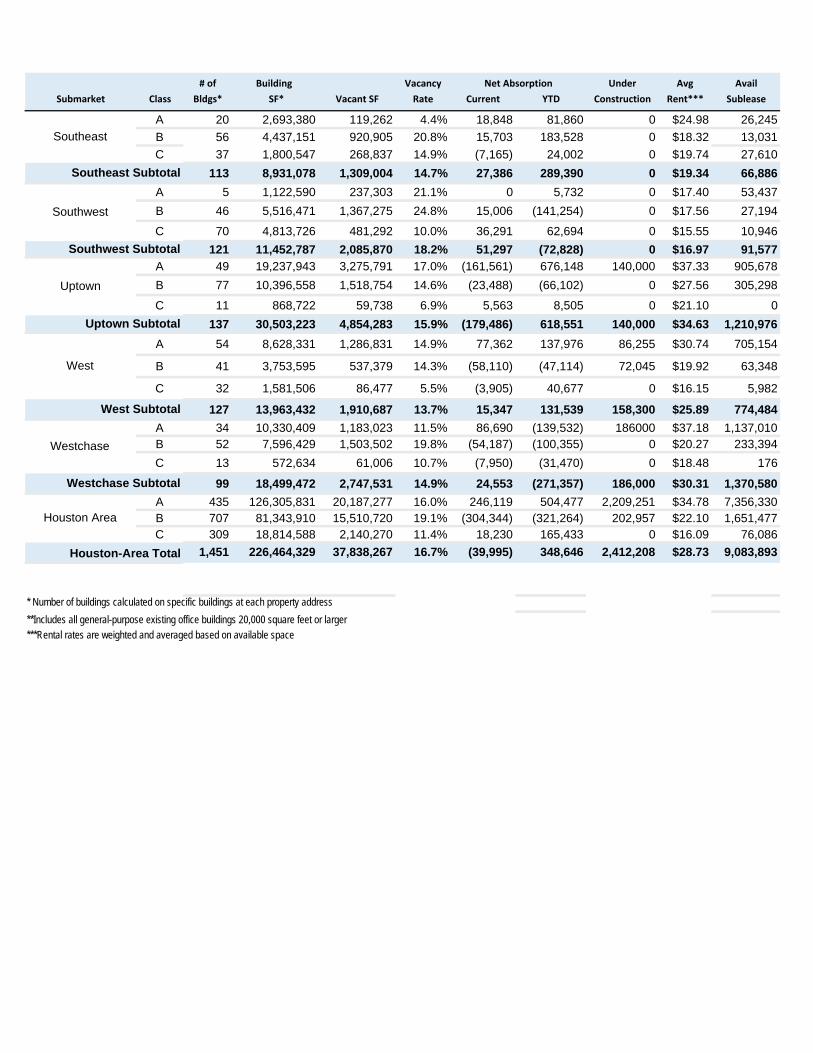
For office space, direct negative net absorption of 39,995 square feet was recorded;
Class A and C showed positive absorption of 246,119 square feet and 18,230 square feet,
respectively, while Class B reported negative absorption of 304,344 square feet. Move-ins at
609 Main including four different firms who preleased space in the new building accounted for
almost 263,000 square feet of the Class A positive absorption. Year-to-date overall totals are
positive for the year primarily due to the first quarter occupancy of 600,000 square feet by BHP
Billiton in its new headquarters building, although the firm is leaving behind more than 320,000
square feet that is currently on the sublease market.
Space left behind by various firms occupying new properties along with sublease spaces
converting to direct space will continue to affect the vacancy rate. The current 16.7% direct
vacancy rate is unchanged from last quarter, but up from the 15.5% recorded during the same
quarter in 2016. Class A space overall is 16.0% vacant, Class B is 19.1% vacant and Class C is
11.4% vacant.
Total sublease space saw a slight decline this quarter with almost 9.1 million square feet
compared to second quarter’s 9.4 million square feet and year-end’s 10.2 million square feet.
Although some spaces have been leased, such as the largest block of 431,307 square feet
taken by NRG in One Shell Plaza, others have turned into direct availability. Others have been
taken off the market but are still available. NRG will be leaving vacant space and possibly
adding to the sublease market in three buildings in the Central Business District (CBD): 1201
Fannin (GreenStreet), 1000 Main and 1300 Main.

The effects of Harvey resulted in sublease space taken as displaced companies and
governmental entities lease short-term space. (Please see brokers’ commentaries for more
detail.) But the amount of sublease space continues to play a large role in the dynamics of the
marketplace. Today’s sublease space represents about 4% of our total tracked office market,
but if counted as vacant, the overall vacancy changes from 16.7% to 21.0%. Currently, 83 of the
sublease listings representing 2.3 million square feet have terms expiring by year-end 2018
while another 69 listings representing 1.4 million square feet are set to expire by the end of
2019.
The under-construction market in Houston currently totals 13 buildings and 2.4 million
square feet and overall is 53% preleased. Properties completed during the third quarter include
Generation Park’s first spec building at 250 Assay Street, which is about 80% preleased, along
with two 25,000-square-foot buildings on Memorial, which are collectively 23% preleased. Four
buildings totaling 354,499 square feet broke ground during third quarter, the largest being
CityPlace 1 in Springwoods Village with 149,500 available square feet.
Concessions are becoming more commonplace in the market, even though quoted
rental rates have remained steady. At $28.73 overall, rental rates showed a slight increase from
the past quarter and from a year ago. Class A rates, now at $34.78 citywide and at $42.35 in the
CBD, experienced slight increases from last quarter’s $34.30 citywide and $41.50 in the CBD.
Quoted rents for sublease space decreased from $25.41 last quarter to $23.00 this quarter.
Commercial Gateway Member/Broker Comments on the Houston Office Market
Mario A. Arriaga, First Group “Houston’s office market continues to grapple with the energy
downturn after experiencing a brief stoppage in late September due to Harvey’s
interruption; many businesses and schools remained closed for days following the initial
impact of the storm due to property damage and street flooding. The Houston area since
has experienced higher retail sales as consumers and businesses must make repairs
and replace flooded furniture and other household goods. This activity in turn is resulting
in stronger demand for warehouse space among retailers; Home Depot and Lowe’s
recently leased new 200,00 to 300,000 square-foot spaces to accommodate the
increased inventory. The housing market also showed its ‘Houston Strong’ resiliency
during the four weeks that followed the storm with a rebound in home sales and the
strongest rental activity of all time.

“Although the office market will be the last sector to recover, market activity continues.
Leasing activity appears to be picking up, and sublease spaces are still offering
competitive options to companies like NRG, who just signed for 431,000 square feet of
former Shell Oil space at 910 Louisiana. But with more than 9 million square feet of
sublease space in the market, and 3.7 million square feet of that with terms expiring
within the next two years, office vacancy rates will remain high.”
David Baker, Executive Vice President, Transwestern "Hurricane Harvey affected less than
1% of Houston’s office inventory, so it didn’t significantly change the overall available
space in our market. Notwithstanding, the negative absorption is mostly comprised of
space we knew was coming available to the direct market as much as two to three years
ago. There is a significant number of deals in the marketplace that correlates with the
strong job growth we are seeing in the city.”
Dan Boyles, Partner, Team Leader – Office Tenant Rep Group, NAI Partners “I have been
asked quite often about the impact Harvey has had or will have on the office market.
Although the statistics are not yet available, our general consensus is there were some
positives coming from companies needing space after being displaced; however, most of
these needs were short-term in nature and, therefore, will have no sustainable impact on
the market. The ability to work remotely, along with the deployment of temporary power
solutions for those buildings that went down, are two major factors that allowed landlords
and tenants to get back to work quickly following the storm.
“The Houston office market continues to be a tenant’s market in almost every submarket
across the city. The vacancy rate now stands at 20.8%, with overall availability more
than 26%. On the demand side, absorption has been negative for the fifth quarter in a
row, and we will likely see negative net absorption for the year more than three million
square feet. As a result, landlords will continue to feel the pressure to drop rents and
increase concessions for those few tenants in the market looking for space.
“The good news is that there has been activity in the market. However, much of that
activity has been for smaller tenants needing space of less than 10,000 square feet. It is
impossible to make up for the millions of square feet dumped on the market resulting
from the energy downtown in 5,000- to 10,000-square-foot chunks. At that rate it would
take 50 years for the market to return to any type of equilibrium. The good news for
landlords is that historically speaking, the office market has cycles of 7 to 8 years in

Houston. As such, we should begin to see some light at the end of the tunnel sometime
in 2018. However, I believe we have a ways to go before we pendulum will swing back in
the landlords’ favor.
“Average asking rents continue to fall, but that statistic does not tell the real story.
Landlords tend to hold advertised asking rents, only to drop them significantly once they
have a strong prospect to lease space. We have seen rental rates decrease by as much
as 30% during the negotiation process, while concession packages will increase by that
same percentage. The amount of negotiation can vary from submarket to submarket and
even building to building, so it is important for tenants to consider all their options to find
the best lease terms.
“The overall office market continues to face new challenges. Merger and acquisition
activity has left companies with more excess space to be placed in the sublease market.
Examples of this include Ensco’s acquisition of Atwood Oceanics and Spectra Energy’s
acquisition of Enbridge. Both transactions resulted in large blocks of space being put on
the sublease market. The former is in the Energy Corridor and the latter in the CBD.
“The rest of 2017 will likely continue with more of the same: not enough positive
influences to outweigh the results of the downturn in the energy business which started
roughly three years ago. However, history tells us that 2018 should be a year in which
the office market will see signs of life that will lead to a gradual recovery.”
Patrick Duffy, President, Colliers International “The office market, pre-Harvey, had begun to
stabilize. While absorption was still negative, the rate of space placed into availability by
the energy companies had definitely declined. We have not started the recovery stage
of this market yet, but the bottom has formed. Harvey will slow the recovery for a few
months, but we expect a bit of a slingshot once everyone deals with their employees and
corporate flood issues.
“Beyond the temporary absorption for recovery space and some short leases for
government agencies who will be here sorting out the damage and federal funding
application, we do not believe that Harvey will have a significant impact on the office
market. However, this event is a good reminder for all tenants along with their real estate
brokers, legal counsel and insurance agents, to take a closer look at lease language
regarding remedies, cures and insurance provisions. These areas are often viewed as

‘just boiler plate,’ either out of ignorance or just deal fatigue. The implications at a time
like this are anything but boiler plate!”
John Spafford, Executive Vice President, Director of Leasing, PM Realty Group “Houston’s
office market fundamentals remain soft with nearly 1.8 million square feet of occupancy
losses year-to-date, causing citywide direct occupancy rates to drop to 82.2%, the
lowest level since 1995. The Class A market has been most impacted during the down
cycle as new construction deliveries and tenant departures have caused direct
occupancy rates to drop by 230 basis points over the last 12 months to 81.1%. However,
there are signs of stabilization as Class A direct occupancy rates remained unchanged
during the third quarter due to modest absorption gains primarily driven by pre-lease
commitments. Sublease availability also improved with its fourth consecutive quarterly
decline since hitting a cyclical high of 12.1 million square feet in Third Quarter 2016. In
addition, the construction pipeline has dropped by 74.2% since hitting its peak of 12.2
million square feet of leasable office product that was underway in Third Quarter 2014.
“Although Houston’s office leasing market continues to experience softness, there is a
sense of renewed optimism that has led to an uptick in leasing activity since the
beginning of the year. Tenants are beginning to realize there is a window of opportunity
to lock-in reduced rental rates on a new lease as rates appear to have bottomed out. As
a result, leasing activity above the 50,000-square-foot mark demonstrated signs of
picking up with 20 deals closed totaling 3 million square feet since the beginning of the
year. Meanwhile, small- and mid-sized leases (10,000 to 50,000 square feet) have
accounted for the remaining 41% of the cumulative space leased year-to-date above the
10,000-square-foot threshold.
“There has been just over 2.2 million square feet of new office construction completed
year-to-date, with an additional 1.1 million square feet slated to deliver by year-end 2017
(excluding corporate-owned projects). Even though construction levels have tapered off
dramatically to their lowest level in five years, 3.1 million square feet of competitive office
space is still under construction, of which 45.3% is already preleased. Looking ahead,
developers and contractors will keep a close eye on construction costs as rebuilding
after this season’s massive hurricanes has caused building costs to increase nationwide
due to increased demand for building materials and skilled labor.

“Although Houston’s economic recovery is underway and the worst of the energy slump
appears to be behind us, the high volume of available direct and sublease space will
delay the office market’s recovery. The office leasing market is expected to continue
facing challenges as many sublease listings will roll over to direct space as their
agreements expire, further impacting the direct occupancy rates. Even though office-
using employment growth is expected to accelerate into 2018, the abundance of
sublease and shadow space will create a drag on future leasing demand as companies
will need to backfill this space before expanding into additional space.”
Houston Industrial Market
Houston’s industrial market dominated the commercial market during the third quarter
with expansions resulting in positive direct net absorption of almost 3.3 million square feet,
according to statistics compiled by Commercial Gateway.
This quarter’s absorption represents the 31st consecutive quarter – more than seven
years – of positive absorption, with four quarters recording more than 3 million square feet each
and 10 recording more than 2 million square feet each. The third-quarter absorption totals were
positive for all types and included almost 2.8 million square feet of warehouse-distribution space
along with 265,857 square feet of net absorption of light industrial space. Manufacturing
properties recorded 204,346 square feet while flex/R&D space absorption was 36,261 square
feet. Overall, 24 properties recorded 50,000 square feet or more of absorption this quarter, with
eight of those recording 100,000 square feet or more.
About 2.6 million square feet in seven buildings came online during the third quarter. The
absorption of 2.4 million square feet of new space this quarter included both FedEx’s 1.1 million
square-foot distribution facility in the Northwest near the Grand Parkway and U.S. Highway 290
and Amazon’s 855,000-square-foot fulfillment center off the Beltway in Pinto Park. Two other
build-to-suits were also completed and occupied this quarter: Floworks International’s affiliated
companies occupied its 225,000-square-foot facility in the South while Pepperl+Fuchs
completed and occupied its 110,000 square-foot distribution center in West Ten Business Park
in the west. For the year, 32 properties totaling almost 4.7 million square feet were completed
and are currently 12.2% vacant.

Vacancy rates have decreased slightly to 5.8% from 6.0% last quarter but are the same
as in Third Quarter 2016. Vacancy for warehouse/distribution space citywide is 6.2% with
manufacturing space at 2.6%.
Construction activity has slowed when compared to previous years, with only 36 projects
totaling more than 3.4 million square feet underway. The largest project currently is a build-to-
suit project, Amazon’s 1.0 million square-foot distribution project in Katy, followed in size by
Cedar Port’s 501,020 square-foot building in the Southeast. Including Amazon, eight
warehouse-distribution projects with more than 100,000 square feet are underway with three
100% preleased.
The bulk of projects under construction is concentrated in the North/Northwest, with 14
buildings totaling 1.7 million square feet or 49.1% followed by the Southeast with six projects
totaling 1.2 million square feet or 33.9% of the total. Overall, the under-construction market is
43% preleased.
New projects and large leases continue to be announced, with the most recent new
project breaking ground in early October, a speculative 673,785-square-foot distribution facility
being developed by Oakmont Industrial Group in Katy’s West Ten Business Park. Houston-
based Pontikes Development has announced a 3-million-square-foot speculative project to be
built in Baytown. Both Lowe’s and Home Depot recently signed leases up to 300,000 square
feet to handle consumer demand, while other large deals are in the market.
Rental rates have increased this quarter to $7.22 from $6.48 last quarter but are similar
to rents recorded in early 2016. Rates for sublease space dipped slightly to $6.45 from $6.52
last quarter.
Sublease space also decreased slightly this quarter to 3.5 million square feet but is a
slight increase when compared to the same quarter last year.
Commercial Gateway Member/Broker Comments on the Houston Industrial Market
Walker Barnett, SIOR, Principal, Colliers International “Houston is a tale of two big-box
markets: consumer goods distributors (including e-commerce) and port-related import
and export businesses. The Houston metropolitan region has led the nation in population
growth for eight years, and we are seeing increased demand from consumer and
durable goods tenants seeking spaces of more than 200,000 square feet. And even with

the slowdown in the ‘upstream’ side of the oil and gas economy, the ‘downstream’ end-
product side continues to be a robust growth market.
“The east side of Houston has been the strongest submarket, as its proximity to the
nation’s largest petrochemical refineries and the Port of Houston makes the area
appealing to plastic resin packagers. This group has been taking substantial warehouse
space in rail-served buildings of up to 500,000 square feet. In addition, we have seen
global retailers commit to import distribution centers in the area - which speaks to
Houston’s strength as a ‘third-coast’ port that allows access to consumers in the central
United States.”
Mark Nicholas, SIOR, Executive Vice President, Regional Director, JLL “Houston’s
industrial market continues to work on all cylinders. During third quarter, the industrial
sector returned to business as usual with declining vacancy and availability, coupled with
strong net absorption of 3.0 million square feet well above the historical average.
“Consistently high occupancy - even through the energy downturn – had led to increased
interest from institutional and foreign investors, and deal volume is up both in the quarter
and the year. Local and regional investors can expect to see increased competition as
foreign capital looks to Houston for opportunities to achieve higher returns on industrial
portfolios, given the long-term favorable market performance.
“The North submarket, which has struggled with oversupply in recent quarters, is
mounting recovery in late 2017. The submarket accounted for over 50 percent of
leasing activity and over 40 percent of net absorption for the third quarter, assisted by
declining asking rents as landlords get aggressive to fill space.
“Consumer goods, retail distribution, and plastics manufacturing will continue to drive
market dynamics while supply plays catch-up across the metro. With over 10 million
square feet of tenants in the market, there’s no shortage of large user-demand in the
pipeline.”
Darren O’Conor, Vice President, NAI Partners/Houston “As the city of Houston continues its
recovery from the aftermath of Hurricane Harvey, those in the industrial sector have
been keen to determine how deeply Harvey affected our product type. The real estate
market - like much of the city - hit the pause button for a couple of weeks even though it
felt like much longer. As the city has since returned to business with some sense of

normalcy post-Harvey, we have seen activity levels pick back up with increases in
virtually all submarkets.
“Two recent transactions were the direct result of Harvey: Home Depot leasing
approximately 300,000 square feet in Northwest Houston, and Lowe’s taking around
250,000 square feet in North Houston. Both retail giants absorbed sizable space to
address demand for construction supplies.
“Following increased demand, the overall vacancy rate has decreased slightly over the
past quarter. Consumers in need of construction supplies along with increasing
requirements for e-commerce facilities are two significant factors driving the vacancy
decline. The recent announcement of the speculative 673,785-square-foot distribution
facility being developed by Oakmont Industrial Group and marketed by NAI Partners in
Katy’s West Ten Business Park is a testament to the growing appetite for buildings that
can serve online retailers as well as many other types of uses. Lastly, the Southeast
Market has also remained strong due to the need for rail-served product.
“The resiliency Houston has shown post-Harvey is a reminder to all how strong the
industrial market is and will continue to be in the future.”
Founded in 2001, Commercial Gateway, the commercial division of the Houston Association of Realtors (HAR), is a commercial information exchange of commercial real estate professionals engaged in every aspect of property sales and leasing, appraisal, property management and counseling.
###

Houston-Area Office Market Overview2017 Third Quarter
# of Building Vacancy Under Avg Avail
Submarket Class Bldgs* SF* Vacant SF Rate Current YTD Construction Rent*** Sublease
A 34 31,924,350 4,090,934 12.8% 279,330 (157,744) 754,000 $42.35 1,906,626
B 34 11,175,523 2,794,394 25.0% 35,437 (38,478) 0 $26.02 166,871
C 6 394,396 100,288 25.4% 12,796 13,905 0 $19.16 0
74 43,494,269 6,985,616 16.1% 327,563 (182,317) 754,000 $37.78 2,073,497
A 49 15,891,381 3,119,184 19.6% 48,002 (45,247) 0 $36.45 1,241,481
B 58 6,733,012 1,625,499 24.1% (62,909) (222,618) 0 $27.07 154,370
C 7 340,198 31,989 9.4% 8,972 7,488 0 $19.98 3,519
114 22,964,591 4,776,672 20.8% (5,935) (260,377) 0 $31.40 1,399,370
A 26 3,068,830 248,815 8.1% (15,557) 30,976 0 $30.74 140,130
B 23 2,528,901 141,736 5.6% 45,313 40,923 74,799 $20.78 6,855
C 1 156,000 35,738 22.9% (1,023) 5,959 0 $19.00 0
50 5,753,731 426,289 7.4% 28,733 77,858 74,799 $27.00 146,985
A 25 5,209,070 2,655,649 51.0% 20,454 35,962 0 $25.73 540,373
B 48 4,919,245 1,806,280 36.7% (97,049) (150,397) 0 $16.55 311,934
C 27 2,020,855 448,892 22.2% (12,345) (12,422) 0 $12.43 11,506
100 12,149,170 4,910,821 40.4% (88,940) (126,857) 0 $20.80 863,813
A 36 11,059,054 1,655,287 15.0% (138,785) (164,445) 188,696 $33.62 169,158
B 107 11,380,385 1,398,482 12.3% (70,677) (25,208) 0 $26.97 110,881
C 62 4,136,040 305,494 7.4% (22,902) 35,930 0 $18.23 9,483
205 26,575,479 3,359,263 12.6% (232,364) (153,723) 188,696 $29.93 289,522
A 58 11,766,038 1,317,435 11.2% (4,235) 45,325 854,300 $26.46 233,278
B 91 5,812,817 752,780 13.0% (7,107) 147,255 56,113 $20.26 157,645
C 19 1,082,230 161,889 15.0% 1,051 (24,719) 0 $14.40 1,664
168 18,661,085 2,232,104 12.0% (10,291) 167,861 910,413 $22.81 392,587
A 4 498,193 80,230 16.1% 17,309 17,309 0 $25.75 0
B 11 482,105 68,934 14.3% (28,706) (9,447) 0 $17.83 0
C 5 197,243 46,624 23.6% (161) 33,548 0 $25.66 0
20 1,177,541 195,788 16.6% (11,558) 41,410 0 $20.04 0
A 41 4,876,262 917,533 18.8% 18,262 (19,843) 0 $27.43 297,760
B 63 6,611,718 1,074,800 16.3% (13,570) 108,003 0 $18.82 100,656
C 19 850,491 52,006 6.1% 9,008 1,336 0 $14.50 5,200
123 12,338,471 2,044,339 16.6% 13,700 89,496 0 $22.25 403,616
Net Absorption
CBD
Northwest Subtotal
Northwest
CBD Subtotal
North/The Woodlands/Conroe
Northeast Subtotal
Inner Loop Subtotal
Greenspoint Subtotal
Energy Corridor
Fort Bend County
Greenspoint
Inner Loop
Northeast
North/The Woodlands/ Conroe Subtotal
Fort Bend County Subtotal
Energy Corridor Subtotal
# of Building Vacancy Under Avg Avail
Submarket Class Bldgs* SF* Vacant SF Rate Current YTD Construction Rent*** Sublease
A 20 2,693,380 119,262 4.4% 18,848 81,860 0 $24.98 26,245
B 56 4,437,151 920,905 20.8% 15,703 183,528 0 $18.32 13,031
C 37 1,800,547 268,837 14.9% (7,165) 24,002 0 $19.74 27,610
113 8,931,078 1,309,004 14.7% 27,386 289,390 0 $19.34 66,886
A 5 1,122,590 237,303 21.1% 0 5,732 0 $17.40 53,437
B 46 5,516,471 1,367,275 24.8% 15,006 (141,254) 0 $17.56 27,194
C 70 4,813,726 481,292 10.0% 36,291 62,694 0 $15.55 10,946
121 11,452,787 2,085,870 18.2% 51,297 (72,828) 0 $16.97 91,577
A 49 19,237,943 3,275,791 17.0% (161,561) 676,148 140,000 $37.33 905,678
B 77 10,396,558 1,518,754 14.6% (23,488) (66,102) 0 $27.56 305,298
C 11 868,722 59,738 6.9% 5,563 8,505 0 $21.10 0
137 30,503,223 4,854,283 15.9% (179,486) 618,551 140,000 $34.63 1,210,976
A 54 8,628,331 1,286,831 14.9% 77,362 137,976 86,255 $30.74 705,154
B 41 3,753,595 537,379 14.3% (58,110) (47,114) 72,045 $19.92 63,348
C 32 1,581,506 86,477 5.5% (3,905) 40,677 0 $16.15 5,982
127 13,963,432 1,910,687 13.7% 15,347 131,539 158,300 $25.89 774,484
A 34 10,330,409 1,183,023 11.5% 86,690 (139,532) 186000 $37.18 1,137,010B 52 7,596,429 1,503,502 19.8% (54,187) (100,355) 0 $20.27 233,394
C 13 572,634 61,006 10.7% (7,950) (31,470) 0 $18.48 176
99 18,499,472 2,747,531 14.9% 24,553 (271,357) 186,000 $30.31 1,370,580
A 435 126,305,831 20,187,277 16.0% 246,119 504,477 2,209,251 $34.78 7,356,330B 707 81,343,910 15,510,720 19.1% (304,344) (321,264) 202,957 $22.10 1,651,477C 309 18,814,588 2,140,270 11.4% 18,230 165,433 0 $16.09 76,086
1,451 226,464,329 37,838,267 16.7% (39,995) 348,646 2,412,208 $28.73 9,083,893
* Number of buildings calculated on specific buildings at each property address
**Includes all general-purpose existing office buildings 20,000 square feet or larger
***Rental rates are weighted and averaged based on available space
Net Absorption
Southeast
Southeast Subtotal
Southwest
Uptown
West
Uptown Subtotal
Southwest Subtotal
Houston-Area Total
Westchase
Houston Area
Westchase Subtotal
West Subtotal

Period Class A Class B Class C All Classes
2017 Q3 246,119 (304,344) 18,230 (39,995)
2017 Q2 (232,068) (432,595) (51,273) (715,936)
2017 Q1 515,735 (118,063) 193,871 591,543
2016 Q4 (336,578) (543,756) 98,733 (781,601)
2016 Q3 851,993 (1,018,591) (96,016) (262,614)
2016 Q2 443,813 183,040 (181,753) 445,100
2016 Q1 1,437,939 (252,844) 110,467 1,295,562
2015 Q4 1,047,903 (39,851) (148,638) 859,414
2015 Q3 388,022 (980,177) 288,849 (303,306)
2015 Q2 1,670,153 (106,443) 47,764 1,609,547
2015 Q1 186,877 (502,956) 168,774 (146,435)
2014 Q4 1,415,039 298,373 14,315 1,727,727
2014 Q3 955,886 (126,773) 94,919 924,032
2014 Q2 1,916,611 228,677 89,631 2,234,599
2014 Q1 1,016,779 161,486 (16,995) 1,161,270
2013 Q4 484,233 274,194 (80,972) 677,880
2013 Q3 1,809,844 75,175 (117,343) 1,767,676
2013 Q2 825,910 (52,453) (169,337) 604,120
2013 Q1 229,455 252,585 (71,189) 410,851
Houston-Area Office Direct Net Absorption by Class

Houston-Area Office Historical Overview2017 Third Quarter
# of Building Vacant SFVacancy
Rate Avail SFNet
Absorption
Period Buildings* SF** Direct Direct Sublease Direct Direct Sublease
2017 Q3 1,451 226,464,329 37,838,267 16.7% 9,083,893 (39,995) $28.73 $23.00
2017 Q2 1,495 227,312,558 37,953,923 16.7% 9,425,943 (715,936) $28.32 $25.41
2017 Q1 1,499 227,853,168 37,445,041 16.4% 9,980,263 591,543 $28.77 $24.73
2016 Q4 1,497 226,219,897 36,445,014 16.1% 10,211,382 (781,601) $28.37 $25.30
2016 Q3 1,494 226,143,148 34,976,040 15.5% 10,727,188 (262,614) $28.23 $23.36
2016 Q2 1,479 224,432,349 33,021,806 14.7% 10,191,713 445,100 $28.24 $25.25
2016 Q1 1,456 221,136,243 30,612,790 13.8% 7,440,283 1,295,562 $27.89 $22.18
2015 Q4 1,411 215,823,335 28,949,388 13.4% 6,747,090 859,414 $28.87 $23.59
2015 Q3 1,352 205,990,648 27,317,659 13.3% 5,749,042 (303,306) $27.33 $25.39
2015 Q2 1,346 204,955,072 25,737,474 12.6% 4,883,961 1,609,547 $26.68 $28.09
2015 Q1 1,339 202,418,133 24,961,553 12.3% 3,460,749 (146,435) $26.38 $29.70
2014 Q4 1,329 199,819,687 22,674,538 11.3% 3,205,260 1,727,727 $25.54 $29.30
2014 Q3 1,322 197,208,059 21,431,395 10.9% 3,052,773 924,032 $25.24 $29.40
2014 Q2 1,313 195,781,170 20,969,381 10.7% 3,137,069 2,234,599 $25.20 $27.93
2014 Q1 1,306 194,126,034 21,478,878 11.1% 2,761,297 1,161,270 $24.97 $26.01
2013 Q4 1,302 193,233,524 21,645,607 11.2% 2,626,169 677,880 $24.37 $27.50
2013 Q3 1,295 191,933,483 21,940,993 11.4% 2,299,752 1,767,676 $24.33 $27.48
2013 Q2 1,283 190,065,097 21,055,857 11.1% 2,034,306 604,120 $23.69 $26.34
2013 Q1 1,278 189,004,629 21,292,981 11.3% 1,703,104 410,851 $23.39 $25.56
* Number of buildings calculated on specific buildings at each property address
**Includes all general-purpose existing office buildings 20,000 square feet or larger
***Rental rates are weighted and averaged based on available space
Avg Rent***

Quarterly Market Overview
2017 Second Quarter FOR IMMEDIATE RELEASE
For more information, please contact: Matt Burrus, Chief Communications Officer Phone: 713.629.1900 ext. 155 E‐mail: [email protected]
HOUSTON’S OFFICE MARKET RECOVERY SLOW,
INDUSTRIAL ACTIVITY REMAINS HEALTHY
HOUSTON — (July 18, 2017) — Houston’s commercial real estate market continues to
adjust as the economy recovers and space options multiply, according to quarterly market
research compiled by Commercial Gateway, the commercial division of the Houston Association
of Realtors (HAR).
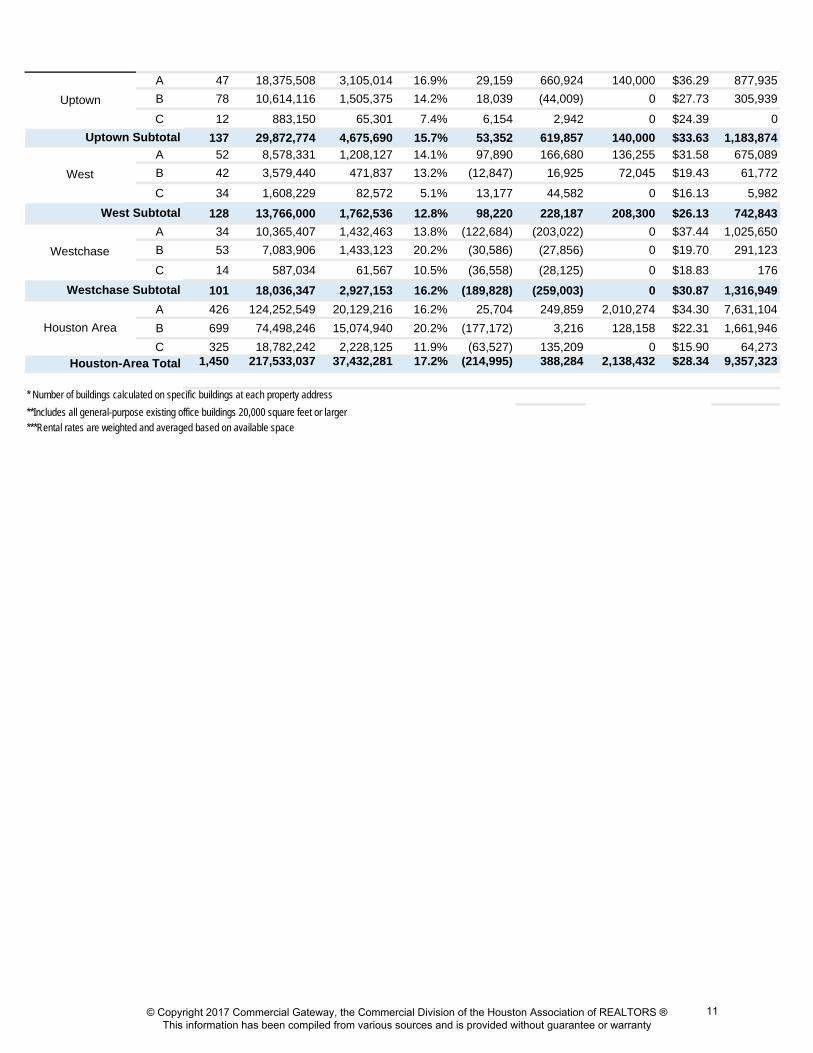
The second quarter reported direct negative net absorption of 214,995 square feet of
office space; Class A showed a slight positive absorption of 25,704 square feet, while Class B
and Class C reported negative absorption. Move-ins at 10100 Katy Freeway and 609 Main, two
new buildings completed this year, along with companies moving into space at Remington
Square III accounted for some of the Class A positive absorption. Year-to-date overall totals are
positive for the year primarily due to the first quarter occupancy of 600,000 square feet by BHP
Billiton in its new headquarters building, leaving behind more than 320,000 square feet currently
on the sublease market.
Space left behind by various firms occupying those new properties along with sublease
spaces showing up as direct space continues affecting the vacancy rate. The current 17.2%
direct vacancy rate is slightly up from 17.0% last quarter, and also up from the 15.3% recorded
during the same quarter in 2016. Class A space overall is 16.2% vacant, while Class B is overall
20.2% vacant and Class C is 11.9% vacant.
Total sublease space saw a slight decline this quarter with more than 9.3 million square
feet compared to first quarter’s 9.9 million square feet and year-end’s 10.2 million square feet.
Although some of those spaces have been leased, others have turned into direct availability and
some spaces have been taken off the market although still available.
The amount of sublease space is playing a large role in the dynamics of the marketplace
as landlords have to compete. With almost 2.2 million square feet of the current sublease space
expiring and moving to direct by yearend, more sublease space continues to enter the market
as companies merge or downsize. When combined with the current direct availability, the
© Copyright 2017 Commercial Gateway, the Commercial Division of the Houston Association of REALTORS ®This information has been compiled from various sources and is provided without guarantee or warranty
1

availability percentage jumps to 23%. Regarding location, more than 85% of all sublease space
is located in six market areas, with each totaling more than 700,000 square feet. The CBD leads
the way with 25.3% of the total, while the Energy Corridor is second with 16.1%. Westchase has
the next highest amount at 14.1%, followed closely by Uptown with 12.7%, Greenspoint has
9.1% and the West market has 7.9% of the total sublease space. Broken down by spaces, 19
sublease listings are currently marketing more than 50,000 square feet; the largest sublease
available is Shell Oil’s space totaling 877,026 square feet in One Shell Plaza.
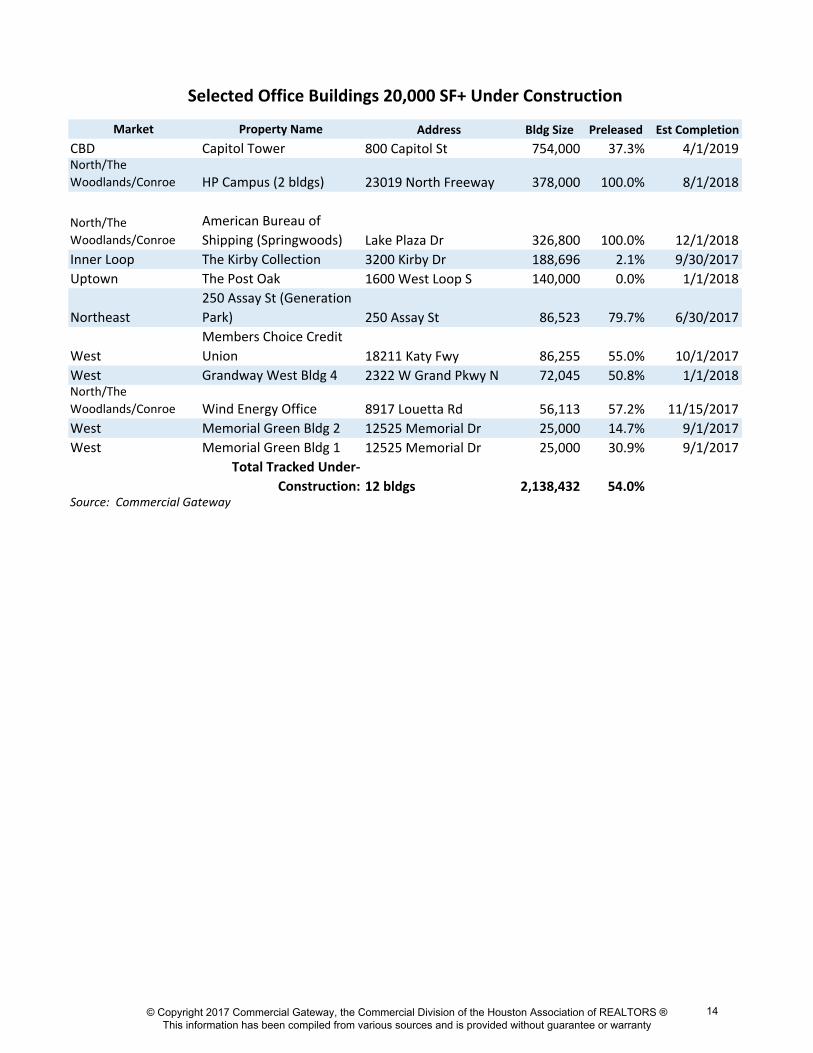
The under-construction market in Houston jumped to 12 buildings and 2.1 million square
feet during second quarter as Skanska re-started construction on its new Capitol Tower, a
754,000-square-foot building in the Central Business District, after securing a 210,000-square-
foot commitment from Bank of America. Three other single-tenant, build-to-suit properties also
broke ground in Springwoods Village, the 60-acre mixed-use development in north Houston.
The new buildings include one with 303,127 square feet for Houston-based American Bureau of
Shipping and two buildings totaling 378,000 square feet for HP; completions are scheduled for
mid- to late-2018 with Skanska’s building taking two years to be completed in 2019.
Other than Capitol Tower, two additional properties underway have more than 100,000
square feet available. The Post Oak in Uptown, scheduled for completion in January 2018, is
0% preleased with 140,000 square feet available; The Kirby Collection at 3200 Kirby, with
188,696 square feet and scheduled for completion by the fourth quarter, is 2.1% preleased.
Overall, the under-construction market is 54% preleased. The totals represent a 57% drop in the
construction pipeline from a year ago and an 81% drop from two years ago.
Concessions are becoming more commonplace in the market, even though quoted
rental rates have remained steady. At $28.34 overall, rental rates showed a slight decrease
from the past quarter but remained constant from a year ago. Class A rates, now at $34.30
citywide and at $41.50 in the CBD, experienced slight decreases from last quarter’s $34.75
citywide and $41.89 in the CBD. Quoted rents for sublease space increased from $24.75 last
quarter to $25.42 this quarter.
Commercial Gateway Member/Broker Comments on the Houston Office Market
Mario A. Arriaga, First Group “Houston’s office market continues to grapple with the energy
downturn and recovery. Recent reports predict both higher employment and population
numbers in 2017 and 2018, which appear to be having a positive effect on housing, retail
© Copyright 2017 Commercial Gateway, the Commercial Division of the Houston Association of REALTORS ®This information has been compiled from various sources and is provided without guarantee or warranty
2

and industrial. Retailers are building larger and more warehouse-distribution facilities to
satisfy the population growth while e-commerce companies like Amazon are building
facilities to deliver products quicker to the consumer.
“The office market will be the last sector to recover. As sublease terms expire, landlords
will then make deals based on market conditions rather than having to compete with less
costly sublease space. But the real positive trend I see in the office market – and in the
industrial sector -- is the level of leasing activity in both the newest buildings along with
the current build-to-suit activity. More tenants continue to be announced as taking space
in 609 Main, which proves that some companies are still willing to pay a price for the
highest quality space when options are available at attractive terms and conditions.”
David Baker, Executive Vice President, Transwestern "As the Investment community sees
Houston at or very near the bottom of the downturn, the investment activity is really
beginning to pick up. Investors in Houston also continue to diversify their investments in
various industries like technology.”
John Spafford, Executive Vice President, Director of Leasing, PM Realty Group “Although
Houston’s economic recovery is underway and the worst of the energy slump appears to
be behind us, the high volume of available direct and sublease space will delay any true
recovery in the Houston office market. Houston’s office market fundamentals remained
soft with negative 1.4 million square feet of direct net absorption during the first half of
2017, causing direct occupancy rates to drop to 82.3%, the lowest level since 1995.
“The Class A sector has been hardest hit as new construction deliveries and tenant
departures have caused Class A direct occupancy rates to drop by 290 basis points to
81.1% during the prior 12 months. On a positive note, Houston’s office market has
exhibited signs of stabilization as sublease availability has experienced its third
consecutive quarterly decline since hitting a cyclical high of 12.1 million square feet in
3Q 2016. In addition, the construction pipeline has dropped by 72.1% since hitting its
peak of 12.2 million square feet of leasable office product that was underway in 3Q
2014.
“While leasing activity has remained light for the past two years, increasing tour activity
has demonstrated signs of renewed tenant interest and optimism leading to an actual
increase in leasing volume during the first half of 2017. Leasing activity above the
© Copyright 2017 Commercial Gateway, the Commercial Division of the Houston Association of REALTORS ®This information has been compiled from various sources and is provided without guarantee or warranty
3

50,000-square-foot mark demonstrated signs of picking up with 16 deals closed totaling
2.3 million square feet. Meanwhile, small and mid-sized leases (10,000 to 50,000 square
feet) accounted for the remaining 40% of the cumulative space leased during the first
half of 2017 above the 10,000-square-foot threshold.
“In terms of new supply, four office buildings totaling nearly 1.4 million square feet were
delivered during the second quarter of 2017 and just more than 2.0 million SF of new
office construction has been completed year-to-date (excluding corporate-owned
projects). Although construction levels have tapered off dramatically, an additional 1.8
million square feet of new product is still scheduled to deliver during the second half of
2017. Looking ahead, citywide direct occupancy levels will continue to slide as new
supply is expected to outpace demand for the remainder of 2017, with only 43.3% of this
new space pre-leased.
“Since the office market typically lags the economy by up to 12 months, Houston’s office
leasing market fundamentals are expected to remain soft as tenant consolidations and
downsizings coupled with several remaining new construction deliveries will further
decrease the citywide direct occupancy rate, likely down to near 81.6% by year-end
2017. The office leasing market will continue to face challenges as many sublease
listings begin to roll over to direct space as their leases expire, further impacting direct
occupancy rates.
“While face rents may not reflect the increase in vacancy, effective rents have seen a
significant decline with the offering of increased tenant improvement allowances, rental
abatement and parking concessions. However, concessions are expected to remain
around for the long haul until the office market reaches a healthy balance between
supply and demand.
“Looking ahead, expectations for a moderate recovery in Houston’s office market reflect
the lag time between job growth and office space absorption. Even though office-using
employment growth is forecasted to accelerate in 2018, future demand from the energy
sector will likely remain suppressed with the abundance of sublease and shadow space
that must be dealt with before tenants will lease additional space.”
Taylor Wright, Vice President – Office Tenant Representation, NAI Partners/Houston
”While both overall rents and leasing activity have risen slightly, the Houston office
© Copyright 2017 Commercial Gateway, the Commercial Division of the Houston Association of REALTORS ®This information has been compiled from various sources and is provided without guarantee or warranty
4

market continued at a slower pace than we have been accustomed to through the
second quarter of 2017. While Houston has made significant strides in diversifying its
economy, the city’s fortunes remain primarily driven by activity in the energy sector. With
that in mind, I predict Houston will stay entrenched as a tenant’s market until
commodities pricing not only stabilizes but increases.
“On the availability front, sublease space still dominates the conversation between
clients and real estate professionals alike. Larger blocks of sublease space are either
sitting vacant or are being pulled off of the market altogether, with one or two exceptions.
Conversely, smaller spaces -- those less than 20,000 square feet -- with remaining
terms on their leases seem to be attracting the lion’s share of activity.
“As far as direct leasing is concerned, most tenants are looking for a Class A building at
Class B pricing, coupled with a healthy concession package. While those
opportunities do exist, options can be limited and tenants need to be comfortable with
looking toward the Energy Corridor. However, there are recent instances where tenants
have chosen to upgrade without the appearance of cost-saving, underscored by two new
Class A buildings in the CBD with strong direct leasing activity: at 609 Main,
multiple professional services firms -- and owner Hines itself -- have chosen to follow
United Airlines’ lead and lease space in the new tower. Additionally, Bank of America
announced it will be relocating from its current namesake tower at 700 Louisiana to
Skanska’s new development located at 800 Capitol Street, where the bank has entered
into a long-term lease for 210,000 square feet. Again, it’s worth noting that these
tenants were already in Class A product and are moving into newer, more sophisticated
Class A product, along with the price tag that this kind of space carries. It will be
interesting to see how the older CBD Class A space fares with the addition of these new
buildings.
“For the market as a whole, unfortunately, early optimism about a full-scale market
recovery in 2017 appears to be wishful thinking.”
Houston Industrial Market
Houston’s industrial market continued to expand during the second quarter with positive
direct net absorption of 2.3 million square feet, according to statistics compiled by Commercial
Gateway.
© Copyright 2017 Commercial Gateway, the Commercial Division of the Houston Association of REALTORS ®This information has been compiled from various sources and is provided without guarantee or warranty
5

This quarter’s absorption represents the 30th consecutive quarter – more than seven
years – of positive absorption, with nine quarters recording more than 2 million square feet each
and more than half recording more than 1 million square feet. The second-quarter absorption
totals were positive for all types and included almost 1.6 million square feet of warehouse-
distribution space along with 349,773 square feet of net absorption of light industrial space.
Manufacturing properties recorded 190,213 square feet while flex/R&D space absorption was
215,577 square feet.
Vacancy rates have decreased slightly to 6.1% from 6.4% last quarter and recorded the
same rate in Second Quarter 2016. Vacancy for warehouse/distribution space citywide is 6.6%
with manufacturing space at 3.0%.
About 2.1 million square feet in 25 buildings came online during the first half of 2017.
The newly completed projects are collectively 82% leased and contributed almost 1.6 million
square feet of absorption.
Construction activity has slowed when compared to previous years, with only 37 projects
totaling more than 5.2 million square feet underway. The mid-year total is about 50% of under-
construction projects both a year ago and two years ago. Similar to office, the largest projects
currently underway are build-to-suit projects, including the largest to break ground during
second quarter, Amazon’s 1.0 million square-foot project in Katy. FedEx’s 1.1 million square-
foot distribution facility in the Northwest near the Grand Parkway and U.S. Highway 290 is
scheduled for completion in August, as is Amazon’s 855,000-square-foot fulfillment center off
the Beltway in Pinto Park.
The largest spec building under construction is Cedar Port’s 501,020 square-foot
building, which broke ground during second quarter after Ikea’s leasing and occupancy of the
first two buildings totaling almost 1 million square feet. The bulk of the remainder under
construction is concentrated in the North/Northwest with 2.4 million square feet or 46.7% of the
total in 11 buildings followed by the Southeast with six projects totaling 1.1 million square feet or
20.3% of the total. Overall, the under-construction market is 69.0% preleased.
New projects recently announced include another Amazon project, this one a bit smaller
for Amazon Fresh, 110,000 square feet in Fallbrook Pines, to join its almost 2 million square
feet currently underway. Another media report announced a prelease of 465,851 square feet by
© Copyright 2017 Commercial Gateway, the Commercial Division of the Houston Association of REALTORS ®This information has been compiled from various sources and is provided without guarantee or warranty
6

Kuraray America, a global supplier of chemical, fiber and resin products, in Avera’s new Bayport
Logistics Park. DHL Supply Chain has also announced a third building off State Highway 225.
Rental rates have increased slightly this quarter to $6.41 from $6.33 last quarter but are
lower than the $7.24 recorded during the same quarter last year.
Sublease space also decreased slightly this quarter by about 120,000 square feet,
representing a slight decrease when compared to the same quarter last year.
Commercial Gateway Member/Broker Comments on the Houston Industrial Market
Michael B. Keegan, SIOR, Partner, NAI Partners “Houston’s industrial market saw stable but
continued growth throughout the second quarter, recording overall positive net
absorption for the 58th consecutive quarter. With the majority of activity being driven
by online retailers, it’s clear that the phrase ‘e-commerce’ is no longer a buzzword, it’s a
movement. Of the nearly dozen big-box distribution deals greater than 500,000 square
feet currently looking for space in the Houston market, most are being driven by e-
commerce needs, with a core requirement being as close in proximity to UPS and
FedEx shipping hubs as possible.
“Continued demand for larger distribution facilities and a lack of developable industrial
sites close to shipping hubs is making counties like Waller County create incentive
packages to attract developers, which is also resulting in population growth. End-
user, consumer-driven distribution and third-party logistics companies are driving
construction projects in other submarkets, notably the North and Northwest.
Additionally, despite diminishing hopes of oil reaching $60/barrel by the end of the
year, the plastics and petrochemical industries are still playing major roles in new
construction projects in the Southeast, which has and will continue to remain one of
Houston’s healthiest submarkets.
“With regards to absorption, although the second quarter saw ±10,318 square feet of
positive absorption according to NAI statistics, it’s important to take note of the fact
that there were nearly 5 million square feet of new leases signed during the second
quarter. It is expected that roughly 3.4 million square feet of those lease agreements
signed won’t start occupying until mid-2018, so the absorption of that space won’t be
reflected by market statistics until sometime next year.”
© Copyright 2017 Commercial Gateway, the Commercial Division of the Houston Association of REALTORS ®This information has been compiled from various sources and is provided without guarantee or warranty
7

Mark Nicholas, SIOR, Executive Vice President, Regional Director, JLL “Houston’s industrial
market is working on all cylinders. Demand spiked in the second quarter with leasing
activity totaling 5.5 million square feet, driven in part by four large signed deals that were
each over 250,000 square feet. However, the lion’s share of deals range from 10,000 to
50,000 square feet (52%) followed by the range of 50,000 to 100,000 square feet (29%).
“Despite an enormous infusion of new construction, vacancy and availability were stable
in the second quarter, closing out at 5.1% and 9.1%, respectively.
”Net absorption was positive at 600,000 square feet during the second quarter after a
banner first quarter with 3.4 million square feet absorbed, driven by both pre-leased
deliveries and move-ins. While the majority of Houston’s submarkets recorded little to no
positive absorption in the second quarter, the Northwest submarket was a standout with
775,376 square feet in occupancy growth. The Northwest boasts a very healthy 4.4
vacancy percentage and continues to build on momentum; of the 1.1 million square feet
currently under construction, 90% will be occupied upon delivery.
“Construction activity declined again to 3.3 million square feet, following 4.5 million
square feet in deliveries year-to-date. The second quarter reported the fewest
construction projects delivered since 2011; however, a strong pipeline remains. A
modest eight total buildings and 1.1 million square feet were delivered in the second
quarter; considering the Southeast claims 93.2 percent of all deliveries, deliveries
outside the area were virtually nonexistent.
“The Houston market should see an uptick in building completions as 3 million square
feet will deliver in the near future. Although the construction pipeline has steadily
decreased since the beginning of 2016, landlords continue to uncover land in the
Southeast.
“Demand by three groups: e-commerce, plastics, and third-party logistics continues to
drive larger warehouse/distribution facilities construction. This year alone is set to
deliver a record seven warehouse and distribution facilities greater than 400,000 square
feet due to the expansion in the consumer goods sector brought on by consistent
population growth. Since 2000, 42 buildings larger than 400,000 square feet have
delivered when just over 50 had been built prior to the new millennium.”
© Copyright 2017 Commercial Gateway, the Commercial Division of the Houston Association of REALTORS ®This information has been compiled from various sources and is provided without guarantee or warranty
8

Founded in 2001, Commercial Gateway, the commercial division of the Houston Association of Realtors (HAR), is a commercial information exchange of commercial real estate professionals engaged in every aspect of property sales and leasing, appraisal, property management and counseling.
###
© Copyright 2017 Commercial Gateway, the Commercial Division of the Houston Association of REALTORS ®This information has been compiled from various sources and is provided without guarantee or warranty
9

Houston-Area Office Market Overview2017 Second Quarter
# of Building Vacancy Under Avg Avail
Submarket Class Bldgs* SF* Vacant SF Rate Current YTD Construction Rent*** Sublease
A 34 31,924,123 4,380,748 13.7% 138,646 (311,379) 754,000 $41.50 2,283,104
B 29 9,981,630 2,912,855 29.2% (252,322) (169,309) 0 $26.42 82,678
C 7 412,596 113,084 27.4% 6,863 1,109 0 $19.16 0
70 42,318,349 7,406,687 17.5% (106,813) (479,579) 754,000 $37.16 2,365,782
A 49 15,891,329 3,175,594 20.0% (132,504) (101,657) 0 $34.54 1,342,611
B 54 5,924,488 1,570,022 26.5% (190,029) (165,638) 0 $27.57 173,782
C 8 355,254 40,961 11.5% (5,629) (1,484) 0 $19.98 9,539
111 22,171,071 4,786,577 21.6% (328,162) (268,779) 0 $30.93 1,525,932
A 26 3,068,830 233,258 7.6% 20,871 46,533 0 $30.34 131,304
B 21 2,458,901 187,049 7.6% (9,783) (24,390) 0 $21.24 6,969
C 1 156,000 34,715 22.3% 6,179 6,982 0 $19.00 0
48 5,683,731 455,022 8.0% 17,267 29,125 0 $26.02 138,273
A 25 5,209,070 2,512,098 48.2% (53,215) (57,208) 0 $25.46 540,373
B 46 4,697,779 1,670,723 35.6% (45,871) (94,971) 0 $16.65 305,604
C 27 1,934,447 414,804 21.4% (8,310) (10,666) 0 $12.21 5,199
98 11,841,296 4,597,625 38.8% (107,396) (162,845) 0 $20.70 851,176
A 36 10,971,456 1,493,244 13.6% (7,593) (2,402) 188,696 $32.27 116,313B 110 10,600,278 1,377,900 13.0% 30,611 42,874 0 $27.16 99,359C 63 4,142,568 285,092 6.9% (11,580) 58,832 0 $17.64 7,423
209 25,714,302 3,156,236 12.3% 11,438 99,304 188,696 $29.21 223,095
A 58 11,693,417 1,295,559 11.1% 67,941 58,254 704,800 $27.90 230,896
B 90 5,236,827 773,024 14.8% 56,938 216,483 56,113 $20.18 183,290
C 22 969,322 162,940 16.8% 2,307 (25,770) 0 $14.92 1,664
170 17,899,566 2,231,523 12.5% 127,186 248,967 760,913 $23.02 415,850
A 3 411,670 11,016 2.7% 0 0 86,523 $25.75 0B 13 533,957 40,228 7.5% 11,334 19,259 0 $19.70 0C 5 197,243 46,463 23.6% (14,463) 33,709 0 $25.70 0
21 1,142,870 97,707 8.6% (3,129) 52,968 86,523 $21.80 0
A 40 4,751,870 923,884 19.4% (16,121) (25,838) 0 $26.19 314,861B 61 5,074,910 1,129,612 22.3% 39,145 55,433 0 $19.46 118,421C 23 925,763 157,014 17.0% 3,168 (9,762) 0 $16.46 5,200
124 10,752,543 2,210,510 20.6% 26,192 19,833 0 $21.58 438,482
A 18 2,100,535 138,110 6.6% (15,257) 13,242 0 $25.29 39,531B 59 3,563,375 820,867 23.0% 210,438 230,098 0 $18.05 13,031C 37 1,707,458 246,029 14.4% 24,818 36,457 0 $18.23 27,610
114 7,371,368 1,205,006 16.4% 219,999 279,797 0 $19.04 80,172
A 4 911,003 220,101 24.2% 18,571 5,732 0 $16.70 53,437
B 43 5,148,639 1,182,325 23.0% (2,239) (51,683) 0 $17.60 19,978
C 72 4,903,178 517,583 10.6% (49,653) 26,403 0 $15.34 1,480
119 10,962,820 1,920,009 17.5% (33,321) (19,548) 0 $16.77 74,895Southwest Subtotal
Fort Bend County Subtotal
Energy Corridor Subtotal
Southeast Subtotal
Southwest
Net Absorption
CBD
Northwest Subtotal
Northwest
Southeast
CBD Subtotal
North/The Woodlands/Conroe
Northeast Subtotal
Inner Loop Subtotal
Greenspoint Subtotal
Energy Corridor
Fort Bend County
Greenspoint
Inner Loop
Northeast
North/The Woodlands/Conroe
Subtotal
© Copyright 2017 Commercial Gateway, the Commercial Division of the Houston Association of REALTORS ®This information has been compiled from various sources and is provided without guarantee or warranty
10
A 47 18,375,508 3,105,014 16.9% 29,159 660,924 140,000 $36.29 877,935
B 78 10,614,116 1,505,375 14.2% 18,039 (44,009) 0 $27.73 305,939
C 12 883,150 65,301 7.4% 6,154 2,942 0 $24.39 0
137 29,872,774 4,675,690 15.7% 53,352 619,857 140,000 $33.63 1,183,874
A 52 8,578,331 1,208,127 14.1% 97,890 166,680 136,255 $31.58 675,089
B 42 3,579,440 471,837 13.2% (12,847) 16,925 72,045 $19.43 61,772
C 34 1,608,229 82,572 5.1% 13,177 44,582 0 $16.13 5,982
128 13,766,000 1,762,536 12.8% 98,220 228,187 208,300 $26.13 742,843
A 34 10,365,407 1,432,463 13.8% (122,684) (203,022) 0 $37.44 1,025,650
B 53 7,083,906 1,433,123 20.2% (30,586) (27,856) 0 $19.70 291,123
C 14 587,034 61,567 10.5% (36,558) (28,125) 0 $18.83 176
101 18,036,347 2,927,153 16.2% (189,828) (259,003) 0 $30.87 1,316,949
A 426 124,252,549 20,129,216 16.2% 25,704 249,859 2,010,274 $34.30 7,631,104
B 699 74,498,246 15,074,940 20.2% (177,172) 3,216 128,158 $22.31 1,661,946
C 325 18,782,242 2,228,125 11.9% (63,527) 135,209 0 $15.90 64,2731,450 217,533,037 37,432,281 17.2% (214,995) 388,284 2,138,432 $28.34 9,357,323
* Number of buildings calculated on specific buildings at each property address
**Includes all general-purpose existing office buildings 20,000 square feet or larger
***Rental rates are weighted and averaged based on available space
West
Uptown Subtotal
Houston-Area Total
Westchase
Houston Area
Westchase Subtotal
West Subtotal
Uptown
© Copyright 2017 Commercial Gateway, the Commercial Division of the Houston Association of REALTORS ®This information has been compiled from various sources and is provided without guarantee or warranty
11

Period Class A Class B Class C All Classes
2017 Q2 25,704 (177,172) (63,527) (214,995)
2017 Q1 410,392 (134,376) 198,736 474,752
2016 Q4 (334,644) (492,255) 101,373 (725,526)
2016 Q3 1,098,329 (1,038,969) (147,036) (87,676)
2016 Q2 458,663 183,040 (140,467) 501,236
2016 Q1 1,447,067 (134,454) 106,514 1,419,127
2015 Q4 1,030,491 (125,313) (148,638) 756,540
2015 Q3 398,294 (987,011) 288,849 (299,868)
2015 Q2 1,673,913 (103,809) 47,764 1,615,941
2015 Q1 186,877 (505,867) 168,774 (149,346)
2014 Q4 1,415,039 299,495 14,315 1,728,849
2014 Q3 955,886 (124,273) 94,919 926,532
2014 Q2 1,916,611 231,353 185,631 2,333,275
2014 Q1 1,016,779 160,494 (16,995) 1,160,278
2013 Q4 484,233 270,886 (80,972) 674,572
2013 Q3 1,809,844 76,743 (117,343) 1,769,244
2013 Q2 825,910 (58,785) (169,337) 597,788
2013 Q1 229,455 249,850 (71,189) 408,116
2012 Q4 566,957 649,491 (54,495) 1,161,953
2012 Q3 405,430 17,666 13,047 436,143
2012 Q2 1,335,653 64,691 50,391 1,450,735
2012 Q1 43,439 645,346 93,214 781,999
Houston-Area Office Direct Net Absorption by Class
© Copyright 2017 Commercial Gateway, the Commercial Division of the Houston Association of REALTORS ®This information has been compiled from various sources and is provided without guarantee or warranty
12

Houston-Area Office Historical Overview2017 Second Quarter
# of Building Vacant SFVacancy
Rate Avail SFNet
Absorption
Period Buildings* SF** Direct Direct Sublease Direct Direct Sublease
2017 Q2 1,450 217,533,037 37,432,281 17.2% 9,357,323 (214,995) $28.34 $25.42
2017 Q1 1,455 218,146,839 37,044,862 17.0% 9,942,503 474,752 $28.74 $24.75
2016 Q4 1,453 216,513,663 35,926,053 16.6% 10,197,305 (725,526) $28.37 $25.31
2016 Q3 1,451 216,567,419 34,513,154 15.9% 10,711,821 (87,676) $28.21 $23.38
2016 Q2 1,436 214,978,579 32,844,360 15.3% 10,161,176 501,236 $28.23 $25.33
2016 Q1 1,415 212,002,743 30,489,348 14.4% 7,400,271 1,419,127 $27.90 $22.26
2015 Q4 1,383 209,564,166 29,078,951 13.9% 6,719,848 756,540 $28.85 $23.65
2015 Q3 1,353 206,103,730 27,535,899 13.4% 5,747,106 (299,868) $27.30 $25.39
2015 Q2 1,349 205,439,384 26,215,150 12.8% 4,882,025 1,615,941 $26.80 $28.09
2015 Q1 1,342 202,791,829 25,185,895 12.4% 3,460,749 (149,346) $26.36 $29.70
2014 Q4 1,330 199,911,745 22,765,518 11.4% 3,205,260 1,728,849 $25.51 $29.30
2014 Q3 1,323 197,300,117 21,523,497 10.9% 3,052,773 926,532 $25.21 $29.40
2014 Q2 1,314 195,873,228 21,063,983 10.8% 3,137,069 2,333,275 $25.16 $27.93
2014 Q1 1,307 194,211,588 21,480,156 11.1% 2,761,297 1,160,278 $24.98 $26.01
2013 Q4 1,303 193,319,078 21,645,893 11.2% 2,626,169 674,572 $24.37 $27.50
2013 Q3 1,296 192,020,957 21,937,971 11.4% 2,299,752 1,769,244 $24.33 $27.48
2013 Q2 1,284 190,150,651 21,054,403 11.1% 2,034,806 597,788 $23.69 $26.34
2013 Q1 1,279 189,090,183 21,285,195 11.3% 1,703,604 408,116 $23.40 $25.56
2012 Q4 1,280 189,048,985 21,708,565 11.5% 1,654,045 1,161,953 $23.29 $23.05
2012 Q3 1,276 188,530,638 22,255,891 11.8% 1,669,477 436,143 $23.03 $23.71
2012 Q2 1,273 188,504,483 22,715,424 12.1% 1,873,841 1,450,735 $22.84 $24.85
2012 Q1 1,273 188,522,901 23,566,663 12.5% 2,220,466 781,999 $22.74 $25.28
* Number of buildings calculated on specific buildings at each property address
**Includes all general-purpose existing office buildings 20,000 square feet or larger
***Rental rates are weighted and averaged based on available space
Avg Rent***
© Copyright 2017 Commercial Gateway, the Commercial Division of the Houston Association of REALTORS ®This information has been compiled from various sources and is provided without guarantee or warranty
13
Market Property Name Address Bldg Size Preleased Est Completion
CBD Capitol Tower 800 Capitol St 754,000 37.3% 4/1/2019North/The
Woodlands/Conroe HP Campus (2 bldgs) 23019 North Freeway 378,000 100.0% 8/1/2018
North/The
Woodlands/Conroe
American Bureau of
Shipping (Springwoods) Lake Plaza Dr 326,800 100.0% 12/1/2018
Inner Loop The Kirby Collection 3200 Kirby Dr 188,696 2.1% 9/30/2017
Uptown The Post Oak 1600 West Loop S 140,000 0.0% 1/1/2018
Northeast
250 Assay St (Generation
Park) 250 Assay St 86,523 79.7% 6/30/2017
West
Members Choice Credit
Union 18211 Katy Fwy 86,255 55.0% 10/1/2017
West Grandway West Bldg 4 2322 W Grand Pkwy N 72,045 50.8% 1/1/2018North/The
Woodlands/Conroe Wind Energy Office 8917 Louetta Rd 56,113 57.2% 11/15/2017
West Memorial Green Bldg 2 12525 Memorial Dr 25,000 14.7% 9/1/2017
West Memorial Green Bldg 1 12525 Memorial Dr 25,000 30.9% 9/1/2017
Total Tracked Under‐
Construction: 12 bldgs 2,138,432 54.0%
Selected Office Buildings 20,000 SF+ Under Construction
Source: Commercial Gateway
© Copyright 2017 Commercial Gateway, the Commercial Division of the Houston Association of REALTORS ®This information has been compiled from various sources and is provided without guarantee or warranty
14

Quarterly Market Overview
2017 First Quarter FOR IMMEDIATE RELEASE
For more information, please contact: David Mendel, Public Relations Manager Phone: 713.629.1900 ext. 258 E‐mail: [email protected]
HOUSTON’S OFFICE MARKET SLOW-MOVING,
INDUSTRIAL ACTIVITY REMAINS HEALTHY
HOUSTON — (April 20, 2017) — Houston’s commercial real estate market carried over
slow-moving activity from the end of last year into 2017, with confidence increasing but leasing
options still plentiful for the near future, according to quarterly market research compiled by
Commercial Gateway, the commercial division of the Houston Association of Realtors (HAR).
The first quarter reported direct net absorption of 120,524 square feet of office space
primarily due to the 600,000 square-foot occupancy of BHP Billiton’s new building. Amegy also
occupied its new 269,258-square-foot space in its namesake building, leaving behind its former
248,985-square-foot space at Five Post Oak Park. Other recent completions include Hines’
1.06 million-square-foot 609 Main at Texas office building in the Central Business District
(CBD); although no move-ins yet, the building is 63.1% preleased with United Airlines the major
tenant along with five other firms. For the quarter, Class A properties recorded positive
absorption of 322,363 square feet, offset by Class B properties’ negative absorption of 400,575
square feet. Class C reported positive absorption of 198,736 square feet.
Space left behind by various firms occupying those new properties along with sublease
spaces showing up as direct space is affecting the vacancy rate, which continues to climb. The
current 17.0% direct vacancy rate is up from 16.4% last quarter, and also up from the 14.3%
recorded during the same quarter in 2016. Fort Bend County is the only submarket with a first-
quarter, single-digit vacancy rate at 8.3%, and only two submarkets, Fort Bend and Southeast,
are reporting Class A vacancy less than 10.0% during the first quarter. Class A space overall is
15.8% vacant, while Class B is overall 20.4% vacant and Class C is 11.3% vacant.
Total sublease space is currently reporting more than 9.9 million square feet, which
represents a decrease from yearend’s 10.2 million square feet. Although some spaces have
been leased, others have turned into direct availability while some spaces have taken off the
market as economic conditions have showed some signs of recovery.

The amount of sublease space is playing a large role in the dynamics of the marketplace
as landlords have to compete. When combined with direct availability, the availability
percentage jumps to 21.6 percent. Regarding location, more than 76% of all sublease space is
located in five market areas. The CBD leads the way with 22.2% of the total, while the Energy
Corridor is second with 15.1%. Westchase has the next highest amount at 14.8%, followed
closely by Uptown with 13.3%, and Greenspoint has 11.4% of the total sublease space. Broken
down by spaces, 40 sublease listings are currently marketing more than 50,000 square feet,
with 13 of those reporting contiguous blocks of more than 100,000 square feet. The largest
sublease available is Shell Oil’s space totaling 877,026 square feet in One Shell Plaza.
The under-construction market in Houston has reached the lowest square footage total
in many years, with only seven buildings totaling 736,951 square feet currently underway. The
largest, at 188,696 square feet, is The Kirby Collection at 3200 Kirby. But construction totals are
about to change with the recent announcement by Skanska that its long-proposed 750,000-
square-foot Capitol Tower will soon break ground in the Central Business District after securing
a 210,000-square-foot commitment from Bank of America. In addition, three build-to-suit
properties will be breaking ground soon in Springwoods Village, the 60-acre mixed-use
development in north Houston. The new buildings include one with 303,127 square feet for
Houston-based American Bureau of Shipping and two buildings totaling 378,000 square feet for
HP; completions are scheduled for mid- to late-2018 with Skanska’s building taking two years
to be completed in 2019. In addition to the Bank of America commitment, Targa Resources
signed for 127,734 square feet in 811 Louisiana, perhaps the largest deal in an existing multi-
tenant building this year.
Three buildings were occupied or completed this quarter: 609 Main at Texas in the CBD,
Amegy Bank Tower in Uptown, and 10100 Katy Freeway in the West market. Collectively, the
almost 1.7 million square feet hit the market with preleasing of 44%.
Concessions are becoming more commonplace in the market, even though quoted
rental rates have remained steady. Rental rates showed a slight increase from the past quarter
and an increase from the past year with the current overall averaged weighted rental rate of
$28.74, up from last quarter’s $28.33 rate and up from $27.83 from last year’s first quarter.
Class A rates, now at $34.75 citywide and at $41.89 in the CBD, experienced slight increases
from last quarter. Quoted rents for sublease space decreased from $25.35 last quarter to
$24.79 this quarter.

Commercial Gateway Member/Broker Comments on the Houston Office Market
Mario A. Arriaga, First Group “Options remain plentiful for office tenants in the market for new
space or relocations. Sublease space is most likely the first option, with almost 9 million
square feet of Class A space currently in the market.
“Although the large amounts of sublease office space will continue to affect the overall
office market well into 2019, almost half of the current sublease available will convert to
direct space next year if not leased as terms expire. Landlords will then be able to make
deals based on market conditions rather than having to compete with the usually more
favorable terms of sublease space. Once the majority of the sublease office space is
either leased or back on the market as direct, office space fundamentals will change
even though office tenants will continue to have numerous available and attractive
options.”
David Baker, Executive Vice President, Transwestern "While office absorption was slightly
positive for the first quarter, activity is picking up as tenants are starting to sense that it is
time to lock rates on a new lease as rates are likely at the bottom. Non-energy and non-
engineering companies are more likely to lock in long terms as we are seeing stability
and growth in the financial and accounting sectors.
“The recovery is underway in the energy and engineering sectors but companies in this
area are generally still cautious and more likely to do shorter term leases. There is also a
significant uptick in office investment sales activity due to the improving office
fundamentals."
Coy Davidson, Senior Vice President, Colliers International “Is the Houston office market
really in a recovery? Well I guess it depends on your perspective. It does appear that the
worst is over and the office market has bottomed out from the weakened energy market
that has plagued the Houston office market over the last couple of years. Houston’s
citywide vacancy rate increased 100 basis points from 17.5% to 18.5% over the quarter
and posted negative net absorption of 745,000 during the same period, which was a
slight increase from Q4 2016. These are statistics that don’t necessarily point to a
recovery.
“However there are some bright spots in the Houston office market’s first quarter 2017
performance. The glut of available sublease space created by the energy downturn after

a record amount of new office construction in the city has declined for two consecutive
quarters as layoffs in the energy sector have dissipated. Houston’s construction pipeline
has shrunk by 50% from a year ago.
“Houston’s average asking rental rates remained relatively flat over the quarter. The
average Class A rental rate in both the CBD and Suburban submarkets decreased
marginally over the quarter, as did the average Class B rental rates. The office market
remains a tenant’s market for now and the foreseeable future as office occupiers enjoy
the leverage of landlord-aggressive rent concessions. Office rents are a function of
supply and demand. However, with new supply diminishing, stabilizing oil prices and
new job growth beginning to accelerate, the Houston market should continue to show
signs of gradual improvement in 2017.”
Matt Gaby, Associate Broker, NAI Partners Houston “In the first quarter of 2017, the
Houston office market showed some encouraging signs as it began to lift itself out of the
soft environment that has lingered in many of its submarkets. During the two years prior
to 2017, we witnessed an onslaught of sublease space being added to the market,
totaling more than 12 million square feet. Today, we are on our way down from that mark
and closing in on 11.1 million square feet citywide. This is due in part to the rising rig
counts (nearly double that of Q1 2016), rising oil prices, other non-energy related
industry growth, and natural lease expirations.
“While I won’t go so far as to forecast what I think will happen going forward, by
recognizing trends in the market one can position oneself to take advantage when
opportunity arises. Market indicators such as sublease availability, vacancy rates, and
absorption rates are all critical data points when evaluating the future strength of the
office market. Looking at the trends seen in 2016 and thus far in Q1 2017, I feel
comfortable saying the market softening has ‘bottomed out.’ Tenants in the market for
space now or over the next few years can take advantage of landlords taking an
increasingly aggressive approach when vying for prospective tenants. These aggressive
incentives often come in the form of rental rate reductions, large concession packages,
additional free rent periods, free parking, and greater building amenities.
“As the trend continues for tenants to take on new or additional space or renegotiate
existing leases, the market will once again shift back to favor landlords. A very realistic
prediction of when this shift might happen is over the next 14 to 18 months (think Q2 to

Q4 2018). This begs the question: why do many companies only seem to renew on high
points? Based on where we are in the current market cycle - the Houston commercial
real estate market historically operates in seven- to eight-year cycles - office tenants
today have tremendous negotiating leverage. To that end, on average we are now
seeing longer lease terms signed, even for smaller companies, who wish to capture the
favorable market terms for as long as possible. Timing, as they say, is everything.”
John Spafford, Executive Vice President, Director of Leasing, PM Realty Group “Houston’s
office market continues to experience the effects of the energy downturn even though
positive indicators suggest that the worst may be in the rearview mirror.
“Since the office market typically lags the overall economy by up to 12 months, it should
come as no surprise that Houston’s office market fundamentals remained soft with just
over 1 million square feet of negative direct net absorption during the first quarter of
2017, surpassing the losses experienced in 2016. While leasing activity in early 2017
remains relatively slow, increasing tour activity has demonstrated signs of renewed
tenant interest and optimism, likely leading to an actual increase in leasing volume
during the remainder of 2017. Small and mid-sized leases above the 10,000-square-foot
threshold continue to account for the bulk of activity, with 64% of the cumulative space
leased in the trailing 12 months occurring in the 10,000-to-50,000-square-foot size
range.
“In terms of new supply, three office buildings totaling 639,422 square feet were
delivered during the first quarter of 2017 and just under 3.6 million square feet of new
office construction has been completed over the prior 12 months (excluding corporate-
owned projects). This new supply, coupled with tenant downsizing and departures, have
pushed total space availability (including sublease) up 4.6 million square feet over this
trailing 12-month period. Class A direct occupancy rates have dropped to 82.5% and
plunged by 850 basis points since their cyclical peak of 91.0% in early 2014. On a
positive note, Houston’s sublease availability declined by 678,989 square feet to 11.1
million square feet during the 1st quarter of 2017 – its second consecutive quarterly
decline since hitting its cyclical high of 12.1 million square feet in 3Q 2016 - but still
remains well above its 10-year historic average of 4.1 million square feet.
“Houston’s office leasing market fundamentals are expected to remain soft as tenant
consolidations and downsizings coupled with several remaining new construction

deliveries could further decrease the citywide direct occupancy rate near 81.6% by year-
end 2017, absent any significant new leasing. The market will face additional downward
pressure as sublease listings begin to roll over to direct space as their agreements
expire, further impacting the direct occupancy rates. Concessions such as free rent and
higher tenant improvement allowances will remain prevalent in the market as long as
leasing volume remains sluggish and landlords fight to maintain rental rate levels.
“On the bright side, landlords that receive direct space are back in the driver seat and no
longer have to compete with tenants willing to sublease their premises at very low
recovery rates. Even though office-using employment growth is expected to return by
2018, future demand from the energy sector will likely remain suppressed with the
abundance of sublease and shadow space that must be dealt with before tenants will
lease additional space.”
Houston Industrial Market
Houston’s industrial market continued to expand during the first quarter, with positive
direct net absorption of almost 3.6 million square feet, according to statistics compiled by
Commercial Gateway.
This quarter’s absorption represents the 29th consecutive quarter – over six years – of
positive absorption, with eight quarters recording more than 2 million square feet each and more
than half recording more than 1 million square feet. The first-quarter absorption totals were
positive for all types and included almost 2.2 million square feet of warehouse-distribution space
along with 1.1 million square feet net absorption of light industrial space. Manufacturing
properties recorded 250,531 square feet while flex/R&D space absorption was 68,506 square
feet.
Vacancy rates have increased slightly to 6.8% from 6.6% last quarter and from 6.0% in
the same quarter last year due to both slower leasing activity in some areas along with several
projects coming online with no preleasing. Vacancy for warehouse/distribution space citywide is
7.4% with manufacturing space at 3.9%.
About 2.1 million square feet in 20 buildings came online during the first quarter. The
newly completed projects are collectively 79% leased and contributed almost 1.6 million square
feet of absorption. The largest projects to be completed and occupied during first quarter include
IKEA’s two buildings in Cedar Port totaling 996,482 square feet; Maintenance Supply

Headquarters of 209,000 square feet and Homelegance’s 175,000 square feet, both in Beltway
Southwest Business Park, along with Aker BioMarine Manufacturing’s 144,800 square feet at
4494 Campbell.
Construction activity has slowed, with only 32 projects totaling more than 3.5 million
square feet underway. The largest build-to-suit is FedEx’s new 800,000-square-foot distribution
facility in the Northwest near the Grand Parkway and west of U.S. Highway 290. The bulk of the
remainder under construction is concentrated in the Southeast with 14 projects totaling 1.1
million square feet followed by the Northwest with 12 projects totaling 1.3 million square feet.
Overall, the under-construction market is 75.0% preleased. Warehouse distribution projects are
the major projects under construction as e-commerce giants come to Houston. Amazon has
also announced another 1 million-square-foot project in Katy in addition to the 855,000-square-
foot project in Pinto Park in north Houston, and DHL Supply Chain is adding another building,
this one 222,000 square feet, to its two buildings on State Highway 225.
Rental rates have decreased this quarter to $6.42 from $6.65 last quarter and are also
lower than the $7.23 recorded during the same quarter last year.
Sublease space had been steadily increasing each quarter during the last couple years,
but decreased slightly to 3.4 million square feet this quarter, representing a 48% increase from
the same quarter last year.
Commercial Gateway Member/Broker Comments on the Houston Industrial Market
Chris Caudill, SIOR, Partner with NAI Partners “Houston’s industrial market as a whole is
relatively healthy but certain markets along with certain types – like manufacturing,
primarily crane served buildings – are continuing the negative absorption trend based on
1st quarter statistics. The dock-high, distribution markets are doing fairly well, except for
two submarkets, the North and Southwest, which have some vacancy issues. Landlords
are getting aggressive in these submarkets with their concessions. This will continue in
these two areas for the foreseeable future with overall lower rents.
“One positive trend I see is owner occupied industrial real estate sale prices remain
healthy, probably due to the continued lower interest rates. We have not seen the
downturn in sale prices like we have seen the 20 to 30 percent drop in some lease
rates.”

Faron Wiley, First Vice President, Industrial and Logistics, CBRE “Positive absorption
totaled over 3 million square feet during the first quarter for industrial properties. The
overall economy, with $50 oil, is rebounding, and oilfield companies are finally starting to
see the light. Some sublease space has been taken off the market, and most sublease
still being marketed represents companies looking to upgrade or those getting out of the
business.
“The industrial market overall is showing a 5% vacancy, although some softness in the
market is the institutional grade product, which may be more at 8% vacant. To compete
successfully, this product type will be built and enter the market vacant but the space will
be on the ground ready to go when needed. Typical building characteristics of this type
of institutional or investor grade product is concrete construction, 24’ to 36’ clearance,
modern sprinkler system, and built for single-tenant but flexible for multi-tenant in a
location of growth and opportunity.
“The rest of the year will see more e-commerce companies leasing large distribution
spaces for consumer products in the North/Northwest, Katy, Southwest and near the
Port. Several companies are active in the market looking to add warehouse space
closer to the ‘last mile’ of the consumer who is buying the products.”
Founded in 2001, Commercial Gateway, the commercial division of the Houston Association of Realtors (HAR), is a commercial information exchange of commercial real estate professionals engaged in every aspect of property sales and leasing, appraisal, property management and counseling.
###

Houston-Area Office Market Overview2017 First Quarter
# of Building Vacant Vacancy Net Abs Net Abs Under Avg SubleaseBldgs* SF** SF Rate (Current) (YTD) Const Rent*** Avail
A 34 31,858,175 4,410,264 13.8% (450,025) (450,025) 0 $41.89 2,117,275
B 29 9,959,544 3,026,861 30.4% (283,315) (283,315) 0 $30.76 95,514
C 8 562,596 119,947 21.3% (5,754) (5,754) 0 $19.34 0
71 42,380,315 7,557,072 17.8% (739,094) (739,094) 0 $38.84 2,212,789
A 48 15,719,319 2,658,920 16.9% 185,947 185,947 0 $37.49 1,307,960
B 55 6,086,725 1,460,388 24.0% 23,050 23,050 0 $28.42 183,407
C 8 355,254 35,332 10.0% 4,145 4,145 0 $19.98 9,539
111 22,161,298 4,154,640 18.8% 213,142 213,142 0 $33.33 1,500,906
A 25 2,982,678 251,096 8.4% 25,662 25,662 0 $30.73 139,204
B 22 2,541,221 180,299 7.1% (14,607) (14,607) 0 $21.74 2,330
C 1 156,000 40,894 26.2% 803 803 0 $19.00 0
48 5,679,899 472,289 8.3% 11,858 11,858 0 $26.81 141,534
A 25 5,207,997 2,456,937 47.2% (1,470) (1,470) 0 $25.54 596,263
B 47 4,824,556 1,605,396 33.3% (29,644) (29,644) 0 $16.60 532,619
C 27 1,934,447 406,494 21.0% (2,356) (2,356) 0 $12.24 6,799
99 11,967,000 4,468,827 37.3% (33,470) (33,470) 0 $21.03 1,135,681
A 37 11,298,467 1,485,651 13.2% 5,191 5,191 188,696 $32.15 169,832
B 111 10,670,788 1,420,122 13.3% 9,132 9,132 0 $26.77 63,146
C 62 4,109,682 240,626 5.9% 70,412 70,412 0 $17.54 7,423
210 26,078,937 3,146,399 12.1% 84,735 84,735 188,696 $28.69 240,401
A 57 11,493,813 1,397,000 12.2% (9,687) (9,687) 0 $31.27 315,327
B 89 5,134,654 934,764 18.2% 59,545 59,545 0 $19.61 160,730
C 23 992,770 173,247 17.5% (28,077) (28,077) 0 $14.59 2,864
169 17,621,237 2,505,011 14.2% 21,781 21,781 0 $24.22 478,921
A 2 51,670 11,016 21.3% 0 0 86,000 $25.75 0
B 13 533,957 51,562 9.7% 7,925 7,925 0 $19.32 0
C 5 197,243 32,000 16.2% 48,172 48,172 0 n/a 0
20 782,870 94,578 12.1% 56,097 56,097 86,000 $20.29 0
A 41 5,119,356 902,596 17.6% (9,717) (9,717) 0 $26.22 308,376
B 62 5,108,301 1,176,157 23.0% (91,712) (91,712) 0 $19.75 123,400
C 24 943,763 160,182 17.0% (12,930) (12,930) 0 $16.31 18,000
127 11,171,420 2,238,935 20.0% (114,359) (114,359) 0 $21.76 449,776Northwest Subtotal
Fort Bend County
Fort Bend County Subtotal
Greenspoint
Greenspoint Subtotal
Inner Loop
Inner Loop Subtotal
North/The Woodlands/
Conroe
North/The Woodlands/ Conroe Subtotal
Northeast
Northeast Subtotal
Northwest
Energy Corridor Subtotal
Submarket Class
CBD
CBD Subtotal
Energy Corridor

A 19 2,105,697 177,355 8.4% 10,755 10,755 0 $27.07 42,281
B 61 3,707,834 1,061,376 28.6% 23,474 23,474 0 $18.05 12,581
C 37 1,702,008 272,127 16.0% 11,639 11,639 0 $17.23 27,610
117 7,515,539 1,510,858 20.1% 45,868 45,868 0 $19.04 82,472
A 5 1,082,476 238,672 22.1% (12,839) (12,839) 0 $16.69 53,437
B 46 5,477,045 1,131,390 20.7% (49,463) (49,463) 0 $17.80 16,478
C 72 4,903,178 467,930 9.5% 76,056 76,056 0 $14.91 0
123 11,462,699 1,837,992 16.0% 13,754 13,754 0 $16.76 69,915
A 46 18,156,666 3,125,188 17.2% 654,282 654,282 140,000 $36.89 960,391
B 80 10,895,052 1,500,399 13.8% (90,900) (90,900) 0 $27.80 356,617
C 12 883,150 71,455 8.1% (3,212) (3,212) 0 $20.78 2,804
138 29,934,868 4,697,042 15.7% 560,170 560,170 140,000 $33.90 1,319,812
A 53 8,752,422 1,370,205 15.7% 4,602 4,602 50,000 $31.31 775,908
B 43 3,641,896 487,447 13.4% 33,210 33,210 86,255 $19.00 65,717
C 34 1,608,229 95,749 6.0% 31,405 31,405 0 $16.28 1,054
130 14,002,547 1,953,401 14.0% 69,217 69,217 136,255 $25.80 842,679
A 33 10,178,115 1,122,487 11.0% (80,338) (80,338) 186,000 $37.60 1,168,466
B 53 7,079,077 1,397,708 19.7% 2,730 2,730 0 $20.37 306,262
C 14 587,034 25,009 4.3% 8,433 8,433 0 $19.26 176
100 17,844,226 2,545,204 14.3% (69,175) (69,175) 186,000 $31.05 1,474,904
A 425 124,006,851 19,607,387 15.8% 322,363 322,363 650,696 $34.75 7,954,720
B 711 75,660,650 15,433,869 20.4% (400,575) (400,575) 86,255 $22.80 1,918,801
C 327 18,935,354 2,140,992 11.3% 198,736 198,736 0 $15.73 76,269
1,463 218,602,855 37,182,248 17.0% 120,524 120,524 736,951 $28.74 9,949,790
* Number of buildings calculated on specific buildings at each property address
**Includes all general-purpose existing office buildings 20,000 square feet or larger
***Rental rates are weighted and averaged based on available space
Houston-Area Total
Southeast
Southeast Subtotal
Southwest
Southwest Subtotal
Uptown
Uptown Subtotal
West
West Subtotal
Westchase
Westchase Subtotal
Houston Area

Period Class A Class B Class C All Classes
2017 Q1 322,363 (400,575) 198,736 120,524
2016 Q4 (362,311) (423,318) 101,373 (684,256)
2016 Q3 1,266,982 (1,047,275) (147,036) 72,671
2016 Q2 458,663 183,462 (140,467) 501,658
2016 Q1 1,447,067 (130,000) 106,514 1,423,581
2015 Q4 1,021,081 (152,550) (155,638) 712,893
2015 Q3 431,000 (987,011) 297,665 (258,346)
2015 Q2 1,673,913 (208,611) 38,093 1,501,468
2015 Q1 342,380 (505,867) 181,513 18,896
2014 Q4 1,419,893 299,495 (7,988) 1,711,400
2014 Q3 955,886 (124,273) 100,109 931,722
2014 Q2 1,959,053 231,353 185,092 2,375,178
2014 Q1 1,566,039 160,494 (28,136) 1,698,397
2013 Q4 484,233 270,886 (80,335) 675,209
2013 Q3 1,809,844 76,743 (86,576) 1,800,011
2013 Q2 825,910 (58,785) (176,355) 590,770
2013 Q1 229,455 249,850 (71,478) 407,827
2012 Q4 566,957 649,491 (84,809) 1,131,639
2012 Q3 405,430 17,666 24,139 447,235
2012 Q2 1,335,653 64,691 31,732 1,432,076
2012 Q1 43,439 645,346 131,604 820,389
Houston-Area Office Direct Net Absorption by Class

Houston-Area Industrial Market Summary2017 First Quarter
# of Building Vacant Vacancy Net Abs Net Abs Under Avg Sublease
Submarket Specific Use Bldgs* SF** SF Rate (Current) (YTD) Const Rent*** Avail
Warehouse - Distribution 241 11,207,097 307,037 2.7% 162,306 162,306 0 $6.50 23,152
Manufacturing 21 911,000 0 0.0% 0 0 0 n/a 0
Light Industrial 163 4,047,927 128,851 3.2% 99,260 99,260 0 $6.47 0
Flex/R&D 90 2,292,052 101,337 4.4% 5,810 5,810 0 n/a 0
515 18,458,076 537,225 2.9% 267,376 267,376 0 $6.49 23,152
Warehouse - Distribution 219 8,994,604 1,197,237 13.3% 32,031 32,031 223,735 $7.18 25,736
Manufacturing 50 2,936,711 191,750 6.5% (43,870) (43,870) 71,750 $5.32 0
Light Industrial 260 5,131,221 251,839 4.9% 228,928 228,928 52,538 $8.96 49,012
Flex/R&D 47 2,119,845 337,864 15.9% 43,781 43,781 0 $12.24 5,100
576 19,182,381 1,978,690 10.3% 260,870 260,870 348,023 $7.51 79,848
Warehouse - Distribution 567 46,810,406 5,017,759 10.7% (15,738) (15,738) 164,060 $6.06 680,843
Manufacturing 88 6,974,744 224,295 3.2% (42,781) (42,781) 34,500 $7.32 122,207
Light Industrial 365 8,824,023 855,363 9.7% (31,634) (31,634) 20,222 $8.10 38,626
Flex/R&D 103 3,549,129 542,031 15.3% (896) (896) 0 $7.53 19,030
1,123 66,158,302 6,639,448 10.0% (91,049) (91,049) 218,782 $6.91 860,706
Warehouse - Distribution 998 76,388,475 4,099,350 5.4% 258,810 258,810 1,053,000 $7.31 865,206
Manufacturing 188 16,421,279 603,268 3.7% 144,800 144,800 58,460 $8.71 58,600
Light Industrial 852 20,190,946 1,290,999 6.4% 367,658 367,658 154,850 $7.97 180,181
Flex/R&D 319 11,073,354 543,410 4.9% 112,070 112,070 0 $9.74 59,462
2,357 124,074,054 6,537,027 5.3% 883,338 883,338 1,266,310 $7.97 1,163,449
Warehouse - Distribution 256 14,601,346 540,221 3.7% 152,906 152,906 260,200 $4.96 119,652
Manufacturing 52 3,661,824 109,176 3.0% 214,682 214,682 0 $6.40 0
Light Industrial 347 6,889,544 307,865 4.5% 95,110 95,110 21,000 $5.88 30,000
Flex/R&D 49 1,647,024 147,492 9.0% (6,384) (6,384) 0 n/a 0
704 26,799,738 1,104,754 4.1% 456,314 456,314 281,200 $5.37 149,652
Warehouse - Distribution 631 56,941,242 4,745,629 8.3% 654,982 654,982 549,538 $4.45 560,007
Manufacturing 122 14,609,025 204,410 1.4% (73,000) (73,000) 300,000 $9.01 0
Light Industrial 358 7,950,491 736,260 9.3% 272,384 272,384 210,757 $4.95 40,086
Flex/R&D 79 2,530,055 263,241 10.4% (72,926) (72,926) 0 $11.31 9,500
1,190 82,030,813 5,949,540 7.3% 781,440 781,440 1,060,295 $4.99 609,593
Warehouse - Distribution 471 30,766,582 2,293,828 7.5% 937,199 937,199 207,700 $6.18 451,600
Manufacturing 59 4,192,239 594,720 14.2% 50,700 50,700 0 $5.12 0
Light Industrial 401 11,054,059 409,414 3.7% 61,002 61,002 40,320 $8.14 29,935
Flex/R&D 191 7,845,289 588,688 7.5% (12,949) (12,949) 100,000 $12.88 61,182
1,122 53,858,169 3,886,650 7.2% 1,035,952 1,035,952 348,020 $7.14 542,717
Inner Loop
Inner Loop Subtotal
North
North Subtotal
Northeast
Northeast Subtotal
Northwest
Northwest Subtotal
Southeast
Southeast Subtotal
Southwest
Southwest Subtotal
South
South Subtotal

Warehouse - Distribution 3,383 245,709,752 18,201,061 7.4% 2,182,496 2,182,496 2,458,233 $5.49 2,726,196
Manufacturing 580 49,706,822 1,927,619 3.9% 250,531 250,531 464,710 $6.18 180,807
Light Industrial 2,746 64,088,211 3,980,591 6.2% 1,092,708 1,092,708 499,687 $7.31 367,840
Flex/R&D 878 31,056,748 2,524,063 8.1% 68,506 68,506 100,000 $9.96 154,274
7,587 390,561,533 26,633,334 6.8% 3,594,241 3,594,241 3,522,630 $6.42 3,429,117
* Number of buildings calculated on specific buildings at each property address
**Includes all general-purpose existing industrial buildings 10,000 square feet or larger or those within a designated business park
***Rental rates are weighted and averaged based on available space
Houston Area
Houston-Area Total

Period Flex/R&D Light Industrial ManufacturingWarehouse-Distribution All Types
2017 Q1 68,506 1,092,708 250,531 2,182,496 3,594,241
2016 Q4 (136,372) (114,527) (493,371) 1,474,130 729,860
2016 Q3 51,018 (377,683) 4,029,346 2,339,554 6,042,235
2016 Q2 31,257 (118,041) (75,921) 861,232 698,527
2016 Q1 (151,167) (319,040) 876,263 113,031 519,087
2015 Q4 (167,392) (153,542) 76,496 638,076 393,638
2015 Q3 22,000 112,692 78,674 1,552,351 1,765,717
2015 Q2 117,699 208,720 247,275 2,870,150 3,443,844
2015 Q1 353,148 (38,783) 188,910 280,869 784,144
2014 Q4 20,908 371,015 (143,098) 2,839,063 3,087,888
2014 Q3 31,000 20,982 408,958 1,284,129 1,745,069
2014 Q2 (8,135) 183,821 207,922 1,185,883 1,569,491
2014 Q1 52,636 155,506 454,750 1,399,492 2,062,384
2013 Q4 (4,830) (192,608) 51,980 3,266,527 3,121,069
2013 Q3 52,871 187,095 37,808 1,116,305 1,394,079
2013 Q2 (147,032) (8,137) (63,405) 1,641,833 1,423,259
2013 Q1 23,493 79,562 294,045 939,899 1,336,999
2012 Q4 33,839 143,171 229,044 1,907,476 2,313,530
2012 Q3 (192,880) 327,075 105,257 1,092,598 1,332,050
2012 Q2 (138,262) 136,630 44,180 1,504,291 1,546,839
2012 Q1 25,173 (95,604) 115,825 1,302,453 1,347,847
Houston-Area Industrial Direct Net Absorption by Type

Quarterly Market Overview
2016 Fourth Quarter FOR IMMEDIATE RELEASE
For more information, please contact: David Mendel, Public Relations Manager Phone: 713.629.1900 ext. 258 E‐mail: [email protected]
HOUSTON’S COMMERCIAL ACTIVITY SLOWS IN FOURTH QUARTER,
BUT OPTIMISM ABOUNDS FOR 2017 AND BEYOND
HOUSTON — (January 18, 2017) — Houston’s commercial real estate market finished
out 2016 with decreased leasing activity in both office and industrial sectors, but more
confidence and hope for the next few years, according to quarterly market research compiled by
Commercial Gateway, the commercial division of the Houston Association of Realtors (HAR).
The fourth quarter reported direct negative net absorption of 445,245 square feet of
office space primarily due to vacancies created by firms like Exxon Mobil whose vacant
sublease space in Greenspoint converted to vacant direct space. Absorption for the year
totaled 681,862 square feet, once again primarily due to multiple owner-occupied projects
including Phillips 66 and National Oilwell Varco in Westchase, accounting for more than 1.6
million square feet in their new buildings, and Hillcorp with another 515,025 square feet in the
Central Business District (CBD). Other recent completions including the Greater Houston
Partnership’s building in the Central Business District and Regions’ Financial Center in
Greenway Plaza helped to offset increasing vacancies in Class A properties. For the year, Class
A properties recorded absorption of almost 2.1 million square feet, offset by Class B and Class
C properties’ year-end negative absorption, a negative 1.3 million square square feet and a
negative 109,534 square feet, respectively.
Space left behind by various firms occupying those new properties are showing up as
direct space and affecting the vacancy rate, which continues to climb. The current 16.4% direct
vacancy rate is up from the 15.9% vacancy recorded last quarter, and also up from the 13.9%
recorded during the same quarter in 2015. Fort Bend County is the only submarket with a year-
end single-digit vacancy rate at 9.4%, and only three submarkets, the CBD, Fort Bend and
Southeast, are reporting Class A vacancy less than 10.0% at year-end. Class A space overall is
15.0% vacant, while Class B is overall 19.6% vacant and Class C is 12.3% vacant.
The huge subleases added to the market during 2016 are examples of the changing
economy related to the energy downturn, which is clearly reflected in the record-level direct
© Copyright 2017 Commercial Gateway, the Commercial Division of the Houston Association of REALTORS ® This information has been compiled from various sources and is provided without guarantee or warranty.
1

vacancy when combined with the additional 10.2 million square feet of available sublease
space. Although total sublease space actually saw a decrease from third quarter, that drop
resulted from Conoco Phillips taking back its new 600,000-square-foot building from the
sublease market combined with both limited leasing activity and other sublease space coming
back on as direct, like Exxon’s Greenspoint properties.
Currently at 10.2 million square feet, Houston’s office sublease market has almost
doubled in the past year, when Fourth Quarter 2015 statistics reported by Commercial Gateway
totaled 6.7 million square feet. Regarding location, more than 79% of all sublease space is
located in five market areas. The CBD led the way with 25.5% of the total as Shell Oil added
more sublease space at One Shell Plaza. The Energy Corridor is second with 17.6%, Uptown
is third with 13.8%, Westchase follows closely at 12.8%, and Greenspoint now offers 9.0% of
the total sublease space. Broken down by spaces, currently 44 sublease listings are marketing
more than 50,000 square feet, with nine of those reporting contiguous blocks of more than
100,000 square feet.
Only one smaller building, the Dave Ward Crime Stoppers building, was completed
during the fourth quarter. Absorption will be counted for that building during the first quarter of
2017 along with space from the new BHP Billiton’s Tower in Uptown. BHP Billiton will reportedly
occupy that space during first quarter and has already added about 320,000 square feet of its
current space to the sublease market. Year-to-date, 19 properties totaling more than 6.1 million
square feet were completed in 2016; as of year-end, the buildings are collectively 72.1% leased.
Construction starts have halted for the most part since the first quarter, with only office
buildings in mixed-use or boutique office projects breaking ground. Overall, the Houston under-
construction office market has 10 properties totaling 2.4 million square feet, of which 609 Main
at Texas represents almost half of the total and is the largest spec building. Collectively, the
under-construction buildings are about 48.1% preleased. Scheduled for completion during first
quarter, 609 Main has reported several new deals: one law firm, Kirkland and Ellis, has doubled
its previously pre-leased space for a total of 105,000 square feet on the top four floors, while
Russell Reynolds Associates, an international search firm, has preleased 15,000 square feet in
the new tower. These firms join a couple other law firms who previously announced signing up
for two floors each, and United Airlines, who committed to 225,000 square feet of the new
building.
© Copyright 2017 Commercial Gateway, the Commercial Division of the Houston Association of REALTORS ® This information has been compiled from various sources and is provided without guarantee or warranty.
2

The most positive leasing activity for the year includes the largest office lease recorded
for 2016: Houston-based American Bureau of Shipping, which will reportedly lease 303,127
square feet in a new building in Springwoods Village, a 60-acre mixed-use development in north
Houston. Another major deal for that project was announced in early January: HP reportedly is
committing to 378,000 square feet in two new buildings to house about 2,400 employees.
Construction will be starting early this year on both projects, with completions scheduled for
mid- to late-2018. No mention was made of either firm eventually adding any of their current
space to the sublease market.
Concessions are becoming more commonplace in the market, even though quoted
rental rates have remained steady. Rental rates showed a slight increase from the past quarter
and an increase from the past year with the current overall averaged weighted rental rate of
$28.27, up from last quarter’s $28.11 rate and up from $27.81 from last year’s fourth quarter.
Class A rates, now at $34.26 citywide and at $42.78 in the CBD, experienced slight increases
from last quarter. Quoted rents for sublease space increased 10.4% from $22.44 last quarter to
$24.78 this quarter.
Commercial Gateway Member/Broker Comments on the Houston Office Market
Mario A. Arriaga, First Group “Office tenants will remain in the driver’s seat as landlords
compete with the massive amounts of sublease space currently available in the market.
Much of this sublease space is Class A with high-quality finishout, which provides many
opportunities for firms looking to upgrade. With few deals in the marketplace, landlords
are also keeping apprised of the sublease space, and in some cases, are assisting the
sublessor by offering a few incentives to increase the term of the sublease.
“The housing market continues to experience healthy sales as the multi-family market
adjusts to an oversupply of Class A apartments. Both office tenants and apartment
tenants will benefit from the oversupply, with new construction at a standstill in both
those segments.
“Although the large amounts of sublease office space will continue to affect the overall
office market for the next 18 months, office tenants will emerge the winners as they
determine their best deal from numerous available and attractive options.”
John Spafford, Executive Vice President, Director of Leasing, PM Realty Group “Houston
continues to feel the effects of the energy sector’s downturn, but the market has begun
© Copyright 2017 Commercial Gateway, the Commercial Division of the Houston Association of REALTORS ® This information has been compiled from various sources and is provided without guarantee or warranty.
3

to show promising signs that the worst may be in the rear-view mirror as oil prices have
slowly increased and office sublease space availability has declined for the first time in
two years. Unfortunately, the dramatic job losses in the energy industry came on the tail
of a peak growth period and one of the city’s most active development cycles.
“Overall leasing activity remained sluggish this past year as energy-related firms have
placed office space decisions on hold, causing overall transaction volume to drop to its
lowest level since 2009. Small- and mid-sized leases continued to account for the bulk of
the activity, causing leasing volume to drop 28.2% over the prior 12 months. Only five
lease transactions above the 100,000-square-foot mark were signed in 2016, with three
of these deals taking place in new construction projects.
“During the fourth quarter of 2016, Houston’s office leasing market fundamentals
continued to soften as the citywide Class A direct occupancy level declined by 60 basis
points to 82.8% overall. Class A direct occupancy levels have dropped by 290 basis
points year-over-year and plunged by 820 basis points since their cyclical peak of 91.0%
in early 2014. Within the competitive leasing market, developers delivered just under 3.8
million square feet of new office space in 2016 (excluding corporate-owned projects).
Meanwhile, Houston’s sublease availability declined by 339,423 square feet to 11.8
million square feet during the quarter – marking its first quarterly decline since mid-year
2014 – but remains well above its 10-year average of 4.1 million square feet.
“Total space availability jumped by 5.7 million square feet in 2016 due to added
sublease space and newly delivered space. As a result, the total space availability level
has jumped 250 basis points to 24.1% with sublease space included, which is 500 basis
points above its 10-year average. Even though face rates have remained relatively
steady with the addition of new inventory commanding higher rents and increased taxes
inflating operating expenses, actual effective rates at which deals are being signed have
subsided, and the value of concession packages (free rent and tenant improvement
allowances) has increased.
“Houston’s office leasing market fundamentals are expected to remain soft as new
supply will likely outpace demand through 2017, which could push the citywide direct
occupancy rate down to approximately 82.5% by year-end 2017 - its lowest level since
1995. The key areas for office property owners to focus on during these challenging
times will be the careful evaluation of near-term rollover and the retention of value by
© Copyright 2017 Commercial Gateway, the Commercial Division of the Houston Association of REALTORS ® This information has been compiled from various sources and is provided without guarantee or warranty.
4

securing early lease renewals and/or extensions to combat potential increased
vacancies. Even though office-using job growth is projected to return by sometime in
2018, future leasing demand from the energy sector will likely remain suppressed as
there will be an abundance of sublease and shadow space that must be dealt with
before tenants will absorb additional space.”
Alex Taghi, Vice President, NAI Partners “After a tumultuous two years, we are starting to see
signs of recovery in the office market, albeit slight ones. Perhaps recovery is too strong a
term; the numbers show that we are actually more confident in saying we have found the
bottom rather than we are recovering. The deluge of sublease space which washed
over Houston, particularly West Houston and CBD, has finally let up; in fact, 4Q16 was
the first quarter in two years where we did not see an increase in sublease space – often
cited as a barometer on the overall health of the office market. By tracking the increase
in rig counts and the price oil, it is not a broad jump to conclude that the large, market-
impacting space dispositions are in all likelihood over.
“With all that said, the tune we’ve been humming hasn’t changed all that much - we are
still very much in an office market ‘recession,’ which should be music to the ears of
tenants. Landlords are having to claw their way into deals as they are still very much
competing with more sublease space than the market can realistically absorb in the
short- to mid-term. Even though quoted rental rates haven’t seen drastic declines as
one would be led to believe given the conditions, significant economic incentives still
need to be made in order for landlords to be competitive. The delta between quoted and
negotiated rates remains substantial and other concessions like construction
allowances, free rent and free parking can and definitely should move the needle to
companies evaluating their current lease.
“To make a long story short – tenants are still in a favorable position to take advantage
of market conditions but we are a little more confident in saying that the clock is ticking.”
Houston Industrial Market
Houston’s industrial market continued to expand during the fourth quarter with positive
direct net absorption of 1.0 million square feet, according to statistics compiled by Commercial
Gateway. Absorption for 2016 totals a positive 8.5 million square feet, with almost half of that
© Copyright 2017 Commercial Gateway, the Commercial Division of the Houston Association of REALTORS ® This information has been compiled from various sources and is provided without guarantee or warranty.
5

attributed to the third quarter occupancy of Daikin Industries’ 4 million-square-foot
manufacturing and distribution facility, reported as the largest concrete tilt-wall building in the
world.
This quarter’s absorption represents the 28th consecutive quarter – over six years – of
positive absorption, with seven quarters recording more than 2 million square feet each and
more than half recording more than 1 million square feet. The year-end absorption totals include
almost 5.7 million square feet of warehouse-distribution space along with 4.2 million square feet
of manufacturing space. Light industrial space offset the positive levels with a negative 1.3
million square feet along with a negative 78,957 square feet for flex/R&D space.
Vacancy rates have increased slightly to 6.5% from 6.1% last quarter and the same
quarter last year due to both slower leasing activity in some areas along with several projects
coming online with no preleasing. Vacancy for warehouse/distribution space citywide is 6.7%
with manufacturing space at 3.7%.
Almost 2.5 million square feet in 13 buildings came online during the fourth quarter,
increasing the total square footage completed in 2016 to 11.5 million square feet in 52 buildings.
The newly completed projects are collectively 68.5% leased with an average $9.13 rental rate.
The new buildings contributed almost 7.7 million square feet of absorption.
Construction activity is still high, with many projects underway and many other projects
proposed. Currently, 51 buildings representing 5.1 million square feet are underway. The largest
build-to-suit is FedEx’s new 800,000-square-foot distribution facility in the Northwest near the
Grand Parkway and west of U.S. Highway 290. The bulk of the remainder under construction is
concentrated in the Southeast with 15 projects totaling 2.3 million square feet followed by the
Northwest with 13 projects totaling 1.2 million square feet. Overall, the under-construction
market is 75.0% preleased.
Rental rates have decreased this quarter to $6.84 from $7.10 last quarter and are also
lower than the $7.25 recorded during the same quarter last year.
Sublease space had been steadily increasing each quarter during the last couple years,
and jumped to almost 3.7 million square feet this quarter, representing 36.6% more space when
compared to last quarter. The current quarter’s total is more than double the sublease square
footage from the same quarter two years ago.
© Copyright 2017 Commercial Gateway, the Commercial Division of the Houston Association of REALTORS ® This information has been compiled from various sources and is provided without guarantee or warranty.
6

Commercial Gateway Member/Broker Comments on the Houston Industrial Market
Gary A. Mabray, SIOR, Principal, Colliers International “2016 proved to be a year of
paradoxes for the Houston-area industrial market. The high price of crude oil in 2014
and 2015 encouraged a significant increase in the development of institutional product,
particularly in the north and southeast segments of the market. The northwest
experienced continued growth as well; however, the scarcity of available land kept that
market somewhat in check. Smaller ‘crane-ready’ buildings aimed at the energy service
business seemingly sprung up overnight wherever smaller land parcels were available.
Then came the late 2015 downturn in the oil and gas business, both real and perceived,
particularly from a national perspective.
“Thus, as the market quickly cooled, the residual of the ‘boom-market’ development
flurry on the north side of Houston left the area with a marked increase of available
space by the end of 2016. Those market areas are driven more by consumer product
warehouse and distribution, and as confidence waned, vacancy increased.
“While other markets slowed, interest, development activity and leasing on the far east
side of Houston accelerated during that same time frame. In this case, low energy prices
proved to be a catalyst for growth. With low feedstock costs, the petrochemical industry
undertook massive new infrastructure projects all along the Gulf Coast. Additionally,
Houston’s Port activity continued to grow as container traffic increased, the opening of
the expanded Panama Canal promised more water-borne deliveries and Houston’s
significance as the new ‘third coast’ was reinforced.
“We leave 2016 with a total market size of approximately 535,000,000 square feet and
an overall market vacancy of 5.6 percent, still a generally healthy market having survived
the tough energy climate.
“As we enter 2017, energy prices seem to be slowly rising, and with that, market
confidence is increasing as well. In discussions within our firm, other major brokerage
firms, developers and lenders, 2017 should prove to be a year of recovery for the slower
markets and continued good activity for those already thriving.”
Mark G. Nicholas, SIOR, Executive Vice President & Regional Director-Brokerage, JLL
“While overall leasing activity was consistently strong over the course of Houston’s
economic downturn, the industrial market experienced a drop in transactions at the close
© Copyright 2017 Commercial Gateway, the Commercial Division of the Houston Association of REALTORS ® This information has been compiled from various sources and is provided without guarantee or warranty.
7

of 2016. The total volume of deals signed fell to 1.8 million square feet from 4.2 million
square feet in the third quarter, representing a decline of 69.1% from the previous eight-
quarter average. This is not a concerning statistic, but a natural effect of sustained low
vacancy and availability across the Houston industrial market.
“At 5.5% total vacancy, the number of large blocks available for lease is limited, making
it no surprise that 62.4% of leases this quarter were sourced from deals smaller than
50,000 square feet. The market’s landlord-favorable position will likely weaken in 2017
as industrial moves to a more neutral playing field, though to what degree will vary
widely by submarket and property type.
“Construction activity began trending downward in 2016, dropping by 34.1% to 4.7
million square feet, following 2.1 million square feet in deliveries and no new major
projects breaking ground. The pipeline for proposed projects remains high, however, as
developers remain confident but disciplined in the Houston market.
“The remaining space under-construction space has close to 75% controlled by the
Southeast and Southwest, two submarkets that outperformed the pack in 2016. Spec
construction dominates the pipeline, accounting for 68.1% of the total space, while the
largest single-tenant project underway is FedEx’s 800,000-square-foot owner/user
building in the Northwest.
“Barring a second dip in energy prices, there will likely be an uptick in demand in the
next 12-18 months as prices stabilize and end-users regain confidence in the market.”
Jake Wilkinson, Senior Vice President, NAI Partners “As things currently stand, all industrial
products in Houston remain in a holding pattern, due largely to the waiting game that is
being played to see when and how oil is going to rebound. Additionally, the presidential
election created even more uncertainty, causing many companies to postpone their real
estate decisions. However, even though actual vacancy rates as a whole haven’t really
fluctuated and remain at about 5% across all industrial products in Houston, overall
sentiment towards the market has picked up significantly. OPEC’s recent announcement
that it will be cutting oil production by 1.2 million barrels by January has many
companies in the oil industry optimistic about the future. Whether they actually make
their proposed cuts remains to be seen, but it has many in the real estate industry
excited about 2017.
© Copyright 2017 Commercial Gateway, the Commercial Division of the Houston Association of REALTORS ® This information has been compiled from various sources and is provided without guarantee or warranty.
8

“The East and Southeast submarkets continue to lead the Houston industrial market,
ending 2016 with just over 3 million square feet in net absorption. These submarkets
saw the delivery of 4.5 million square feet of new product, and another 2.5 million square
feet is under construction, fueled by the expansion of the Bayport Container Terminal of
the Port of Houston and growth in the plastics industry.
“Although the Northwest submarket has taken the biggest hit over the past couple of
years since the decline in oil prices, vacancy in the Northwest has dropped from 5.5% in
the third quarter to 5% at the close of the fourth quarter. Additionally, the average rental
rate per square foot per month has slightly increased. The combination of a decrease in
new product -- from 4 million square feet to 120,000 square feet -- and continued
positive absorption -- 900,000 square feet in Q4 -- have also helped lessen the blow.
“Despite some positive signs, many of the free-standing buildings delivered during 2015
have sat vacant with minimal interest. Whether or not the Northwest submarket will
begin to take a turn for the better remains to be seen. However, the recent uptick in
interest of oil and gas companies for the submarket has real estate specialists somewhat
optimistic about 2017, since many industrial brokers are reporting a significant increase
in interest in their Northwest products. Of course, that optimism doesn’t mean anything
unless it turns into actual transactions.
“Ultimately, oil is in the driver’s seat, and the Houston industrial market will continue to
hinge on the price of oil. OPEC’s announcement to cut production could be the start of
what many in the industry have been hoping for, but even with that, we cannot expect
major changes overnight. We do expect vacancy rates to decline gradually in the first
quarter of 2017 and believe we will continue to climb out of this downturn. Cautious
optimism underpins Houston’s industrial outlook.”
Founded in 2001, Commercial Gateway, the commercial division of the Houston Association of Realtors (HAR), is a commercial information exchange of commercial real estate professionals engaged in every aspect of property sales and leasing, appraisal, property management and counseling.
###
© Copyright 2017 Commercial Gateway, the Commercial Division of the Houston Association of REALTORS ® This information has been compiled from various sources and is provided without guarantee or warranty.
9
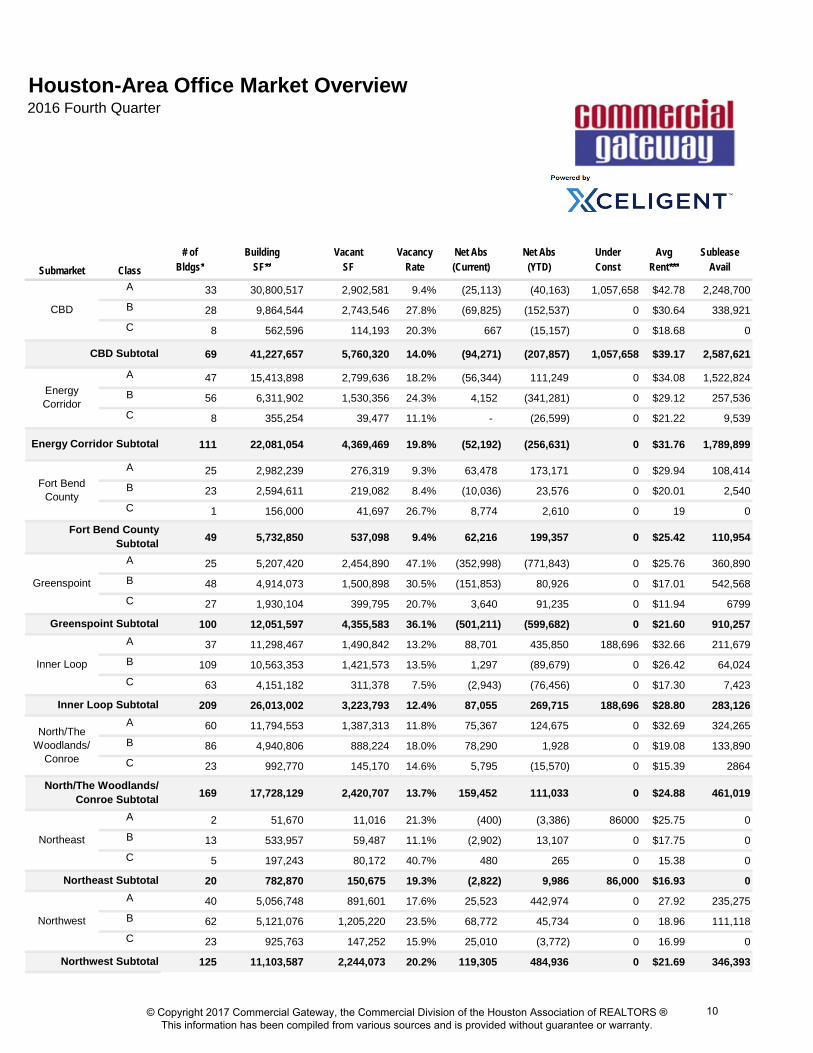
Houston-Area Office Market Overview2016 Fourth Quarter
# of Building Vacant Vacancy Net Abs Net Abs Under Avg SubleaseBldgs* SF** SF Rate (Current) (YTD) Const Rent*** Avail
A 33 30,800,517 2,902,581 9.4% (25,113) (40,163) 1,057,658 $42.78 2,248,700
B 28 9,864,544 2,743,546 27.8% (69,825) (152,537) 0 $30.64 338,921
C 8 562,596 114,193 20.3% 667 (15,157) 0 $18.68 0
69 41,227,657 5,760,320 14.0% (94,271) (207,857) 1,057,658 $39.17 2,587,621
A 47 15,413,898 2,799,636 18.2% (56,344) 111,249 0 $34.08 1,522,824
B 56 6,311,902 1,530,356 24.3% 4,152 (341,281) 0 $29.12 257,536
C 8 355,254 39,477 11.1% - (26,599) 0 $21.22 9,539
111 22,081,054 4,369,469 19.8% (52,192) (256,631) 0 $31.76 1,789,899
A 25 2,982,239 276,319 9.3% 63,478 173,171 0 $29.94 108,414
B 23 2,594,611 219,082 8.4% (10,036) 23,576 0 $20.01 2,540
C 1 156,000 41,697 26.7% 8,774 2,610 0 19 0
49 5,732,850 537,098 9.4% 62,216 199,357 0 $25.42 110,954
A 25 5,207,420 2,454,890 47.1% (352,998) (771,843) 0 $25.76 360,890
B 48 4,914,073 1,500,898 30.5% (151,853) 80,926 0 $17.01 542,568
C 27 1,930,104 399,795 20.7% 3,640 91,235 0 $11.94 6799
100 12,051,597 4,355,583 36.1% (501,211) (599,682) 0 $21.60 910,257
A 37 11,298,467 1,490,842 13.2% 88,701 435,850 188,696 $32.66 211,679
B 109 10,563,353 1,421,573 13.5% 1,297 (89,679) 0 $26.42 64,024
C 63 4,151,182 311,378 7.5% (2,943) (76,456) 0 $17.30 7,423
209 26,013,002 3,223,793 12.4% 87,055 269,715 188,696 $28.80 283,126
A 60 11,794,553 1,387,313 11.8% 75,367 124,675 0 $32.69 324,265
B 86 4,940,806 888,224 18.0% 78,290 1,928 0 $19.08 133,890
C 23 992,770 145,170 14.6% 5,795 (15,570) 0 $15.39 2864
169 17,728,129 2,420,707 13.7% 159,452 111,033 0 $24.88 461,019
A 2 51,670 11,016 21.3% (400) (3,386) 86000 $25.75 0
B 13 533,957 59,487 11.1% (2,902) 13,107 0 $17.75 0
C 5 197,243 80,172 40.7% 480 265 0 15.38 0
20 782,870 150,675 19.3% (2,822) 9,986 86,000 $16.93 0
A 40 5,056,748 891,601 17.6% 25,523 442,974 0 27.92 235,275
B 62 5,121,076 1,205,220 23.5% 68,772 45,734 0 18.96 111,118
C 23 925,763 147,252 15.9% 25,010 (3,772) 0 16.99 0
125 11,103,587 2,244,073 20.2% 119,305 484,936 0 $21.69 346,393Northwest Subtotal
Fort Bend County
Fort Bend County Subtotal
Greenspoint
Greenspoint Subtotal
Inner Loop
Inner Loop Subtotal
North/The Woodlands/
Conroe
North/The Woodlands/ Conroe Subtotal
Northeast
Northeast Subtotal
Northwest
Energy Corridor Subtotal
Submarket Class
CBD
CBD Subtotal
Energy Corridor
© Copyright 2017 Commercial Gateway, the Commercial Division of the Houston Association of REALTORS ® This information has been compiled from various sources and is provided without guarantee or warranty.
10
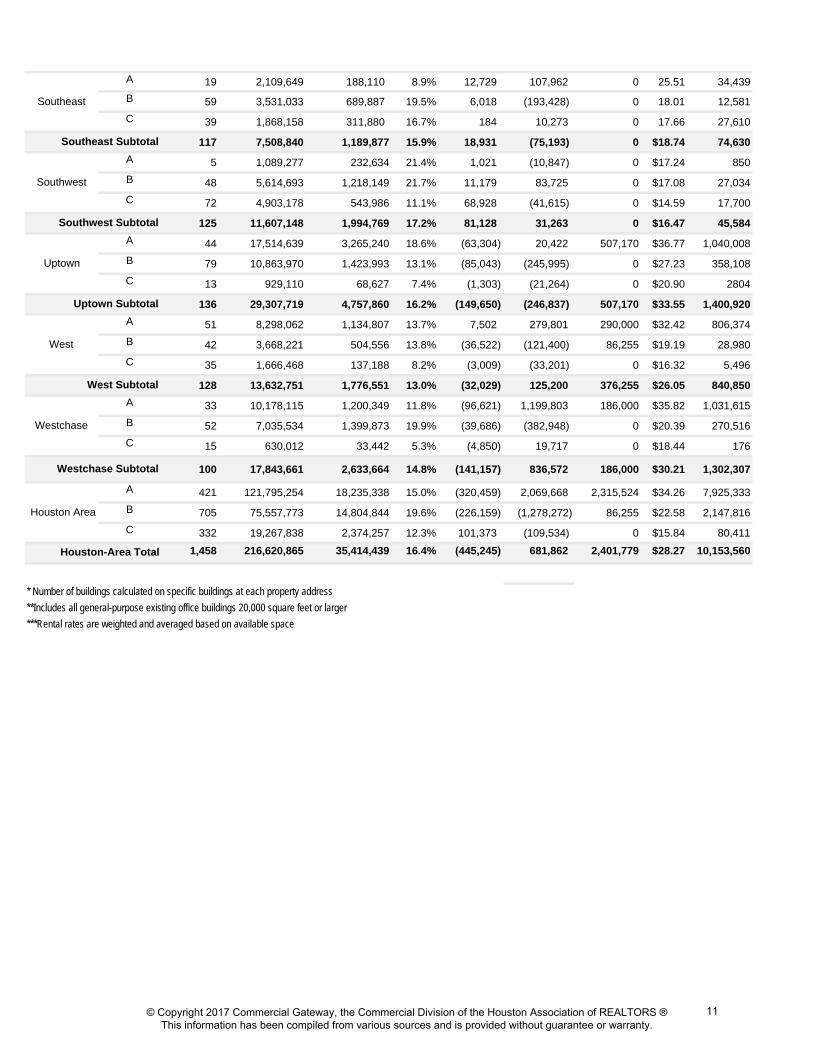
A 19 2,109,649 188,110 8.9% 12,729 107,962 0 25.51 34,439
B 59 3,531,033 689,887 19.5% 6,018 (193,428) 0 18.01 12,581
C 39 1,868,158 311,880 16.7% 184 10,273 0 17.66 27,610
117 7,508,840 1,189,877 15.9% 18,931 (75,193) 0 $18.74 74,630
A 5 1,089,277 232,634 21.4% 1,021 (10,847) 0 $17.24 850
B 48 5,614,693 1,218,149 21.7% 11,179 83,725 0 $17.08 27,034
C 72 4,903,178 543,986 11.1% 68,928 (41,615) 0 $14.59 17,700
125 11,607,148 1,994,769 17.2% 81,128 31,263 0 $16.47 45,584
A 44 17,514,639 3,265,240 18.6% (63,304) 20,422 507,170 $36.77 1,040,008
B 79 10,863,970 1,423,993 13.1% (85,043) (245,995) 0 $27.23 358,108
C 13 929,110 68,627 7.4% (1,303) (21,264) 0 $20.90 2804
136 29,307,719 4,757,860 16.2% (149,650) (246,837) 507,170 $33.55 1,400,920
A 51 8,298,062 1,134,807 13.7% 7,502 279,801 290,000 $32.42 806,374
B 42 3,668,221 504,556 13.8% (36,522) (121,400) 86,255 $19.19 28,980
C 35 1,666,468 137,188 8.2% (3,009) (33,201) 0 $16.32 5,496
128 13,632,751 1,776,551 13.0% (32,029) 125,200 376,255 $26.05 840,850
A 33 10,178,115 1,200,349 11.8% (96,621) 1,199,803 186,000 $35.82 1,031,615
B 52 7,035,534 1,399,873 19.9% (39,686) (382,948) 0 $20.39 270,516
C 15 630,012 33,442 5.3% (4,850) 19,717 0 $18.44 176
100 17,843,661 2,633,664 14.8% (141,157) 836,572 186,000 $30.21 1,302,307
A 421 121,795,254 18,235,338 15.0% (320,459) 2,069,668 2,315,524 $34.26 7,925,333
B 705 75,557,773 14,804,844 19.6% (226,159) (1,278,272) 86,255 $22.58 2,147,816
C 332 19,267,838 2,374,257 12.3% 101,373 (109,534) 0 $15.84 80,411
1,458 216,620,865 35,414,439 16.4% (445,245) 681,862 2,401,779 $28.27 10,153,560
* Number of buildings calculated on specific buildings at each property address
**Includes all general-purpose existing office buildings 20,000 square feet or larger
***Rental rates are weighted and averaged based on available space
Houston-Area Total
Southeast
Southeast Subtotal
Southwest
Southwest Subtotal
Uptown
Uptown Subtotal
West
West Subtotal
Westchase
Westchase Subtotal
Houston Area
© Copyright 2017 Commercial Gateway, the Commercial Division of the Houston Association of REALTORS ® This information has been compiled from various sources and is provided without guarantee or warranty.
11

Houston-Area Office Historical Overview2016 Fourth Quarter
# of Building Vacant SFVacancy
Rate Avail SFNet
Absorption
Period Buildings* SF** Direct Direct Sublease Direct Direct Sublease
2016 Q4 1,458 216,620,865 35,414,439 16.4% 10,153,560 (445,245) $28.27 $24.78
2016 Q3 1,456 216,020,656 34,315,581 15.9% 10,678,789 90,678 $28.11 $22.44
2016 Q2 1,441 215,145,989 33,239,224 15.4% 10,128,144 (115,263) $28.14 $24.31
2016 Q1 1,424 212,742,242 30,278,848 14.2% 7,373,529 1,459,409 $27.81 $21.82
2015 Q4 1,393 210,536,009 29,204,633 13.9% 6,709,792 713,513 $28.74 $23.20
2015 Q3 1,364 207,574,960 27,680,258 13.3% 5,737,050 (256,501) $27.20 $25.40
2015 Q2 1,359 206,374,164 26,402,876 12.8% 4,871,969 1,501,762 $26.71 $28.10
2015 Q1 1,353 203,996,609 25,529,039 12.5% 3,450,693 34,038 $26.44 $29.72
2014 Q4 1,340 200,888,934 22,820,753 11.4% 3,195,204 1,711,152 $25.48 $29.33
2014 Q3 1,333 198,286,699 21,762,328 11.0% 3,042,717 930,055 $25.20 $29.42
2014 Q2 1,324 196,859,810 21,368,432 10.9% 3,127,013 2,314,851 $25.13 $27.94
2014 Q1 1,316 195,118,168 21,686,179 11.1% 2,751,241 1,148,452 $24.96 $26.01
2013 Q4 1,312 194,225,658 21,840,090 11.2% 2,616,113 674,935 $24.36 $27.50
2013 Q3 1,306 193,126,682 22,132,531 11.5% 2,299,752 1,799,437 $24.33 $27.48
2013 Q2 1,293 191,057,231 21,279,156 11.1% 2,034,806 564,785 $23.68 $26.34
2013 Q1 1,288 189,996,763 21,476,945 11.3% 1,703,604 406,880 $23.38 $25.56
2012 Q4 1,289 189,955,565 21,899,079 11.5% 1,654,045 1,131,404 $23.28 $23.05
2012 Q3 1,285 189,437,218 22,415,856 11.8% 1,669,477 448,015 $23.04 $23.71
2012 Q2 1,283 189,610,208 22,887,261 12.1% 1,873,841 1,430,466 $22.86 $24.85
2012 Q1 1,283 189,628,626 23,718,231 12.5% 2,220,466 820,841 $22.75 $25.28
2011 Q4 1,281 189,453,217 25,438,493 13.4% 2,508,155 957,606 $22.91 $25.34
2011 Q3 1,275 188,969,492 26,191,514 13.9% 3,001,909 1,313,123 $22.74 $25.32
2011 Q2 1,274 188,069,047 26,610,814 14.1% 2,748,436 76,499 $22.98 $24.95
2011 Q1 1,272 187,384,895 26,179,277 14.0% 2,793,033 (207,504) $23.24 $24.02
* Number of buildings calculated on specific buildings at each property address
**Includes all general-purpose existing office buildings 20,000 square feet or larger
***Rental rates are weighted and averaged based on available space
Avg Rent***
© Copyright 2017 Commercial Gateway, the Commercial Division of the Houston Association of REALTORS ® This information has been compiled from various sources and is provided without guarantee or warranty.
12

Period Class A Class B Class C All Classes
2016 Q4 (320,459) (226,159) 101,373 (445,245)
2016 Q3 1,313,932 (1,076,218) (147,036) 90,678
2016 Q2 (138,965) 164,169 (140,467) (115,263)
2016 Q1 1,443,644 (90,749) 106,514 1,459,409
2015 Q4 1,021,081 (151,930) (155,638) 713,513
2015 Q3 431,000 (985,166) 297,665 (256,501)
2015 Q2 1,673,913 (208,317) 38,093 1,501,762
2015 Q1 345,803 (494,148) 181,513 34,038
2014 Q4 1,419,893 299,247 (7,988) 1,711,152
2014 Q3 955,886 (125,940) 100,109 930,055
2014 Q2 1,959,053 171,026 185,092 2,314,851
2014 Q1 1,016,779 159,809 (28,136) 1,148,452
2013 Q4 484,233 270,612 (80,335) 674,935
2013 Q3 1,809,844 76,169 (86,576) 1,799,437
2013 Q2 825,910 (84,770) (176,355) 564,785
2013 Q1 229,455 248,903 (71,478) 406,880
2012 Q4 566,957 649,256 (84,809) 1,131,404
2012 Q3 405,430 18,446 24,139 448,015
2012 Q2 1,335,653 63,081 31,732 1,430,466
2012 Q1 43,439 645,798 131,604 820,841
2011 Q4 804,219 65,449 87,938 957,606
2011 Q3 1,509,485 (232,783) 36,421 1,313,123
2011 Q2 218,266 (130,246) (11,521) 76,499
2011 Q1 195,659 (428,686) 25,523 (207,504)
Houston-Area Office Direct Net Absorption by Class
© Copyright 2017 Commercial Gateway, the Commercial Division of the Houston Association of REALTORS ® This information has been compiled from various sources and is provided without guarantee or warranty.
13

Houston-Area Industrial Market Summary2016 Fourth Quarter
# of Building Vacant Vacancy Net Abs Net Abs Under Avg Sublease
Submarket Specific Use Bldgs* SF** SF Rate (Current) (YTD) Const Rent*** Avail
Warehouse - Distribution 275 13,663,885 422,964 3.1% (10,118) 20,584 0 $6.89 18,342
Manufacturing 26 1,147,964 0 0.0% 18,600 (1,265) 0 $6.00 0
Light Industrial 166 4,177,227 228,111 5.5% 15,716 6,840 0 $5.79 0
Flex/R&D 95 2,456,877 139,933 5.7% 49,570 18,615 0 $13.18 0
562 21,445,953 791,008 3.7% 73,768 44,774 0 $6.71 18,342
Warehouse - Distribution 228 9,614,159 941,331 9.8% (62,343) 214,108 223,735 $7.34 0
Manufacturing 51 2,976,061 147,880 5.0% 0 123,450 0 $5.66 0
Light Industrial 255 4,984,858 337,429 6.8% (3,320) 16,313 166,238 $8.84 65,582
Flex/R&D 44 2,066,976 328,235 15.9% 1,230 (9,915) 50,000 $13.14 5100
578 19,642,054 1,754,875 8.9% (64,433) 343,956 439,973 $7.50 70,682
Warehouse - Distribution 572 48,198,347 5,010,429 10.4% 68,598 666,229 164,060 $6.15 736,536
Manufacturing 95 7,694,342 151,758 2.0% (52,660) 743,166 34,500 $7.04 103,714
Light Industrial 365 8,861,470 812,833 9.2% 2,935 (222,779) 20,222 $8.24 86,037
Flex/R&D 112 3,880,698 526,115 13.6% (39,374) (61,050) 0 $7.61 19,030
1,144 68,634,857 6,501,135 9.5% (20,501) 1,125,566 218,782 $7.00 945,317
Warehouse - Distribution 1,036 81,517,688 4,216,740 5.2% 712,231 1,354,705 979,490 $7.41 1,096,939
Manufacturing 194 17,327,922 744,273 4.3% (285,728) 3,521,851 58,460 $8.14 58,600
Light Industrial 847 20,309,384 1,480,819 7.3% (272,235) (480,167) 194,850 $7.80 235,317
Flex/R&D 324 11,167,576 566,414 5.1% (3,702) 41,108 0 $10.17 115,462
2,401 130,322,570 7,008,246 5.4% 150,566 4,437,497 1,232,800 $8.00 1,506,318
Warehouse - Distribution 278 16,954,594 769,732 4.5% 41,147 41,539 260,200 $5.02 119,652
Manufacturing 55 3,400,823 196,958 5.8% (135,308) (135,308) 0 7.25 0
Light Industrial 342 6,919,927 417,593 6.0% 26,668 (208,975) 21,000 $5.39 30000
Flex/R&D 53 1,716,065 137,983 8.0% 0 7,664 0 n/a 0
728 28,991,409 1,522,266 5.3% (67,493) (295,080) 281,200 $5.61 149,652
Warehouse - Distribution 684 62,354,990 3,869,571 6.2% 1,192,804 2,490,535 1,783,373 $5.12 415,602
Manufacturing 132 15,496,001 117,660 0.8% 20,000 219,906 300,000 $9.60 0
Light Industrial 354 7,851,385 904,045 11.5% (50,147) (401,224) 210,757 $6.93 40086
Flex/R&D 81 2,622,160 164,220 6.3% (28,766) 34,589 0 $11.99 9500
1,251 88,324,536 5,055,496 5.7% 1,133,891 2,343,806 2,294,130 $5.88 465,188
Warehouse - Distribution 507 34,230,904 2,745,849 8.0% (127,724) 861,161 496,500 $6.95 431,831
Manufacturing 66 4,663,819 597,920 12.8% (50,700) (254,941) 0 $4.60 0
Light Industrial 405 11,616,746 464,616 4.0% 104,927 23,213 40,320 $7.96 20,505
Flex/R&D 193 7,857,818 514,393 6.6% (111,820) (109,968) 100,000 $12.62 69,937
1,171 58,369,287 4,322,778 7.4% (185,317) 519,465 636,820 $7.04 522,273
Inner Loop
Inner Loop Subtotal
North
North Subtotal
Northeast
Northeast Subtotal
Northwest
Northwest Subtotal
Southeast
Southeast Subtotal
Southwest
Southwest Subtotal
South
South Subtotal
© Copyright 2017 Commercial Gateway, the Commercial Division of the Houston Association of REALTORS ® This information has been compiled from various sources and is provided without guarantee or warranty.
14

Warehouse - Distribution 3,580 266,534,567 17,976,616 6.7% 1,814,595 5,648,861 3,907,358 $6.05 2,818,902
Manufacturing 619 52,706,932 1,956,449 3.7% (485,796) 4,216,859 392,960 $6.09 162,314
Light Industrial 2,734 64,720,997 4,645,446 7.2% (175,456) (1,266,779) 653,387 $7.54 477,527
Flex/R&D 902 31,768,170 2,377,293 7.5% (132,862) (78,957) 150,000 $10.14 219,029
7,835 415,730,666 26,955,804 6.5% 1,020,481 8,519,984 5,103,705 $6.84 3,677,772
* Number of buildings calculated on specific buildings at each property address
**Includes all general-purpose existing industrial buildings 10,000 square feet or larger or those within a designated business park
***Rental rates are weighted and averaged based on available space
Houston Area
Houston Area Total
© Copyright 2017 Commercial Gateway, the Commercial Division of the Houston Association of REALTORS ® This information has been compiled from various sources and is provided without guarantee or warranty.
15

Houston-Area Industrial Historical Overview2016 Fourth Quarter
# of Building Vacant SFVacancy
Rate Avail SFNet
Absorption
Period Buildings* SF** Direct Direct Sublease Direct Direct Sublease
2016 Q4 7,835 415,730,666 26,955,804 6.5% 3,677,772 1,020,481 $6.84 $5.88
2016 Q3 7,820 414,158,092 25,115,783 6.1% 2,634,253 6,390,576 $7.10 $6.81
2016 Q2 7,796 408,264,337 25,739,206 6.3% 2,295,374 738,879 $7.23 $6.73
2016 Q1 7,724 406,883,437 24,099,674 5.9% 2,293,819 599,942 $7.25 $6.81
2015 Q4 7,635 405,839,390 24,830,223 6.1% 2,411,783 362,633 $7.58 $6.94
2015 Q3 7,307 403,803,012 21,688,321 5.4% 1,807,084 1,720,688 $7.77 $7.24
2015 Q2 7,291 402,238,245 22,342,997 5.6% 1,761,238 3,443,844 $7.68 $7.39
2015 Q1 7,246 399,825,992 23,504,775 5.9% 1,628,464 847,724 $7.64 $7.31
2014 Q4 7,188 397,466,923 23,253,781 5.9% 1,517,554 3,289,085 $7.53 $6.92
2014 Q3 7,147 394,181,816 24,711,908 6.3% 1,378,661 1,745,069 $7.29 $6.84
2014 Q2 7,106 391,717,237 24,663,726 6.3% 1,484,062 1,569,491 $7.13 $6.81
2014 Q1 7,078 388,804,185 24,835,186 6.4% 1,363,465 2,074,884 $6.78 $6.26
2013 Q4 7,052 387,466,023 26,906,864 6.9% 2,003,230 3,141,319 $6.64 $6.06
2013 Q3 7,023 384,829,828 28,196,014 7.3% 2,310,894 1,421,975 $6.44 $5.78
2013 Q2 6,985 381,356,251 26,979,748 7.1% 2,205,071 1,407,059 $6.42 $5.32
2013 Q1 6,959 379,011,746 27,029,124 7.1% 1,717,698 1,320,799 $6.04 $5.53
2012 Q4 6,924 377,070,027 25,595,065 6.8% 1,745,173 2,352,880 $5.96 $5.14
2012 Q3 6,906 375,671,975 27,425,302 7.3% 1,705,302 1,332,050 $5.74 $5.73
2012 Q2 6,888 374,972,858 28,391,336 7.6% 1,713,664 1,546,839 $5.67 $5.65
2012 Q1 6,876 374,365,958 28,545,007 7.6% 1,977,300 1,347,847 $5.59 $5.17
2011 Q4 6,853 372,376,970 28,752,029 7.7% 1,970,315 2,345,403 $5.50 $5.61
2011 Q3 6,837 371,204,501 30,269,542 8.2% 2,130,635 1,603,326 $5.43 $6.41
2011 Q2 6,826 370,961,484 32,228,951 8.7% 2,125,422 108,946 $5.48 $5.51
2011 Q1 6,767 368,309,580 31,520,183 8.6% 2,044,721 349,140 $5.48 $5.37
* Number of buildings calculated on specific buildings at each property address
***Rental rates are weighted and averaged based on available space
Avg Rent***
**Includes all general-purpose existing industrial buildings 10,000 square feet or larger or those within a designated business park
© Copyright 2017 Commercial Gateway, the Commercial Division of the Houston Association of REALTORS ® This information has been compiled from various sources and is provided without guarantee or warranty.
16

Period Flex/R&D Light Industrial ManufacturingWarehouse-Distribution All Types
2016 Q4 (132,862) (175,456) (485,796) 1,814,595 1,020,481
2016 Q3 51,018 (313,512) 4,029,346 2,623,724 6,390,576
2016 Q2 84,647 (99,291) (42,421) 795,944 738,879
2016 Q1 (151,087) (319,040) 909,263 160,806 599,942
2015 Q4 (167,392) (166,347) 76,496 619,876 362,633
2015 Q3 (10,786) 112,692 78,674 1,540,108 1,720,688
2015 Q2 117,699 208,720 247,275 2,870,150 3,443,844
2015 Q1 385,258 (7,313) 188,910 280,869 847,724
2014 Q4 20,908 457,975 (143,098) 2,953,300 3,289,085
2014 Q3 31,000 20,982 408,958 1,284,129 1,745,069
2014 Q2 (8,135) 183,821 207,922 1,185,883 1,569,491
2014 Q1 52,636 155,506 454,750 1,411,992 2,074,884
2013 Q4 (4,830) (192,608) 51,980 3,286,777 3,141,319
2013 Q3 52,871 187,095 65,704 1,116,305 1,421,975
2013 Q2 (163,232) (8,137) (63,405) 1,641,833 1,407,059
2013 Q1 7,293 79,562 294,045 939,899 1,320,799
2012 Q4 33,839 143,171 268,394 1,907,476 2,352,880
2012 Q3 (192,880) 327,075 105,257 1,092,598 1,332,050
2012 Q2 (138,262) 136,630 44,180 1,504,291 1,546,839
2012 Q1 25,173 (95,604) 115,825 1,302,453 1,347,847
2011 Q4 (12,355) (43,148) 537,804 1,863,102 2,345,403
2011 Q3 1,150 (159,986) 90,211 1,671,951 1,603,326
2011 Q2 (66,071) (247,923) 29,313 393,627 108,946
2011 Q1 150,600 134,957 (46,076) 109,659 349,140
Houston-Area Industrial Direct Net Absorption by Type
© Copyright 2017 Commercial Gateway, the Commercial Division of the Houston Association of REALTORS ® This information has been compiled from various sources and is provided without guarantee or warranty.
17

Quarterly Market Overview 2016 Third Quarter FOR IMMEDIATE RELEASE
For more information, please contact: David Mendel, Public Relations Manager Phone: 713.629.1900 ext. 258 E‐mail: [email protected]
HOUSTON’S THIRD-QUARTER COMMERCIAL ACTIVITY
SHOWS MIXED RESULTS
HOUSTON — (October 20, 2016) — Houston’s commercial real estate market offers
mixed readings, as office continues to struggle and industrial continues to build. That’s
according to quarterly market research compiled by Commercial Gateway, the commercial
division of the Houston Association of Realtors (HAR).
The third quarter reported direct positive absorption of 575,726 square feet of office
space primarily due to Phillips 66 occupying its new 1.1 million square-foot campus in
Westchase. If not included, the absorption number would be negative. That move-in, along with
several other recent completions including the Greater Houston Partnership’s building in the
Central Business District and Region’s Financial Center in Greenway Plaza, helped to offset
increasing vacancies in Class A properties. Class B and Class C properties both reported
negative absorption for the quarter, a negative 592,992 square feet and a negative 156,008
square feet, respectively.
Absorption year-to-date is running at almost 1.5 million square feet, once again primarily
due to multiple owner-occupied projects including Phillips 66 and National Oilwell Varco in
Westchase, accounting for more than 1.6 million square feet in their new buildings, and Hillcorp
with another 515,025 square feet in the Central Business District.
Space left behind by various firms occupying those new properties are showing up as
direct space and affecting the vacancy rate, which continues to climb. The current 15.5% direct
vacancy rate is up from the 15.2% vacancy recorded last quarter, and also up from the 13.3%
recorded during the same quarter in 2015. No submarket is reporting a single-digit vacancy
rate, and among the larger submarkets, only the Central Business District is reporting single-
digit vacancy in Class A space. Class A space overall is 14.2% vacant. One of the larger spaces
to hit the market was Halliburton’s 560,000-square-foot building at 10200 Bellaire, part of the
company’s Oak Park Campus. Halliburton completed its employee relocation to its corporate
© Copyright 2016 Commercial Gateway, the Commercial Division of the Houston Association of REALTORS ® This information has been compiled from various sources and is provided without guarantee or warranty.
1

headquarters in North Houston during the third quarter and placed the entire 48.9566-acre
campus on the market.
Halliburton’s decision is just one example of the changing economy related to the energy
downturn, which is clearly reflected in the record-level direct vacancy when combined with the
additional 10.7 million square feet of sublease space. During the third quarter, 84 new sublease
spaces totaling almost 1.9 million square feet were added to the list, according to Commercial
Gateway statistics. The positive side of that is the net gain in sublease space was only 700,000
square feet for the quarter, which means the other listings were either leased, taken off the
market for some reason – some may have been retained by the current tenant, or the sublease
term expired.
Currently at 10.7 million square feet, Houston’s office sublease market has doubled in
the past year, when Third Quarter 2015 statistics reported by Commercial Gateway totaled 5.7
million square feet. Regarding location, almost three-fourths of all sublease space is located in
four market areas with the top two representing almost half of the overall total. The Energy
Corridor leads the way with 27.0%, the Central Business District with 22.1%, followed by
Westchase and Uptown markets at 12.8% and 12.0%, respectively. Broken down by space,
currently 26 sublease listings are marketing more than 100,000 square feet, with 10 of those
reporting contiguous blocks of more than 100,000 square feet. However, recent reports have
increased the sublease total to around 12 million square feet and growing.
For the quarter, six new buildings were completed, adding almost 1.6 million square feet
to the market and 66.0% preleased. All but one of the six had preleasing; the largest to be
completed was BHP Billiton’s 600,000-square-foot Tower in Uptown. BHP Billiton will be
occupying that space either later in the year or early next year and has already put some of its
current space on the sublease market. Year-to-date, 18 properties totaling 6.1 million square
feet were completed in 2016.
Construction starts have halted for the most part since the first quarter, with only office
buildings in mixed-use or boutique office projects breaking ground. Overall, the Houston under-
construction office market has 10 properties totaling 2.3 million square feet, of which 609 Main
at Texas represents almost half of the total and is the largest spec building. Collectively, the
under-construction buildings are about 45.3% preleased, with 13 properties classified as multi-
tenant. Of those under construction, two are scheduled for completion by yearend.
© Copyright 2016 Commercial Gateway, the Commercial Division of the Houston Association of REALTORS ® This information has been compiled from various sources and is provided without guarantee or warranty.
2

Concessions are becoming more commonplace in the market, even though quoted
rental rates have remained steady. Rental rates showed a slight decrease from the past quarter
and an increase the past year with the current overall averaged weighted rental rate of $28.15,
down from last quarter’s $28.22 rate but up from $27.20 from last year’s third quarter. Class A
rates, now at $33.49 citywide and at $42.67 in the CBD, experienced slight increases from last
quarter. Quoted rents for sublease space decreased almost a full $2, or 7.4%, from $24.31 last
quarter to $22.41 this quarter.
Commercial Gateway Member/Broker Comments on the Houston Office Market
Mario A. Arriaga, First Group “Office tenants looking to move or expand their space will have
more options than they can imagine as leasing activity slows and sublease space
multiplies. Although both the office and industrial markets recorded positive absorption
during third quarter, the majority of positive absorption can be attributed to large owner-
occupied properties including Phillips 66 completing its move into its new 1.1 million
square-foot facility in Westchase and Daikin Industries’ completion and occupation of its
4 million square-foot facility in Northwest Houston.
“The housing market continues to experience healthy sales as the multi-family market
adjusts to an oversupply of Class A apartments. Both office tenants and apartment
tenants will benefit from the oversupply, with new construction at a standstill in both
those segments.
“Although the large amounts of sublease office space hitting the market will continue to
affect the overall office market for the next 18 months, office tenants will emerge the
winners as they determine their best deal from numerous available and attractive
options.”
David Baker, Executive Vice President, Transwestern “The market has continued to add
space on a direct and sublease basis. At the same time, it appears that the energy
business has hit bottom and is starting to rebound, and Houston is expected to have
positive overall job growth for 2016. So we anticipate that this will minimize or eliminate
further increases in new space availabilities and help moderate the level of concessions
and stabilize rental rates in 2017.”
Kevin Kushner, First Vice President, CBRE Group Inc. “This is a great time to be a tenant in
Houston. There so many more options available in this market. With sublease space
© Copyright 2016 Commercial Gateway, the Commercial Division of the Houston Association of REALTORS ® This information has been compiled from various sources and is provided without guarantee or warranty.
3

totaling more than 12 million square feet, including 500,000 that was added during the
last 15 days, tenants have more options (as a percentage of the overall market) than at
any time since the 1990s.This large amount of sublease space – specifically high quality
space with strong sub-landlords – in turn forces building owners to become more
competitive. While landlords are not decreasing quoted rates to sublease rate levels,
landlords are offering significant concessions and often agreeing to rates far below their
quoted terms. Regarding concessions, whereas landlords were offering $50 to $60 per
square foot in tenant improvement dollars on long-term deals a few years ago, some are
now offering up to $90 per square foot. Landlords are seeing very little activity. There
just are not many tenants in the market at this time. As a result, landlords can easily
justify offering free rent for a period of time to entice tenants to sign a lease.
“Advising clients through the leasing process is far different now than a couple years
ago. New options come online almost daily – as more firms add space to the sublease
market. My team and I are constantly evaluating and updating our data to ensure we are
presenting clients with all possible options – often re-evaluating previously identified
options against what has recently come available. The process becomes more of a
struggle for the tenant, but tenants who are patient and diligent can reap big rewards by
ensuring they are thoroughly evaluating all the options.”
John Spafford, Executive Vice President, Director of Leasing, PM Realty Group “Houston
continues to feel the effects of the energy sector’s downturn, which has cast a shadow of
uncertainty over the office leasing market creating sluggish demand and rising sublease
availabilities on top of numerous new office buildings entering the market. Overall
leasing activity declined for the seventh consecutive quarter as many companies are
delaying their long-term leasing decisions due to uncertainty in the local economy,
resulting in overall transaction volume dropping to its lowest level since 2009. The
dramatic decline in leasing volume is also attributed to small- and mid-sized leases
accounting for the bulk of activity. Only four lease transactions above the 100,000-
square-foot mark have been signed year-to-date, with three of these deals taking place
in new construction projects.
“During the third quarter of 2016, Houston’s office leasing market fundamentals softened
further as the citywide Class A direct occupancy level declined by 60 basis points to
83.4%, reaching its lowest level since 2005. Although pre-lease commitments in newly-
© Copyright 2016 Commercial Gateway, the Commercial Division of the Houston Association of REALTORS ® This information has been compiled from various sources and is provided without guarantee or warranty.
4

built projects managed to keep Class A direct absorption levels slightly in positive
territory, new supply has outpaced demand in nine of the previous 10 quarters causing
Class A direct occupancy levels to fall by 7.6 percentage points since their cyclical peak
of 91.0% in early 2014.
“Within the competitive leasing market, developers completed seven new office buildings
citywide during the third quarter totaling 1,575,831 square feet and have delivered a total
of nearly 7.1 million square feet of new office construction over the past 12 months
(excluding corporate-owned projects). Meanwhile, sublease availability has soared by
4.5 million square feet to over 12.1 million square feet since the third quarter of 2015 as
many energy-related companies are placing underutilized space on the market that was
created by workforce reductions, a merger or acquisition, or space that was originally
tied up for future expansion. Consequently, total space availability has significantly
increased by 7.2 million square feet within the past 12 months, primarily due to this
sublease space and newly delivered office space.
“As office leasing volume remains slow and the number of available space options
continue to grow, asking rents have begun to adjust and more concessions are being
offered to stimulate leasing activity and combat increased vacancies. Even though face
rates remain relatively steady with the addition of new inventory commanding higher
rents and increased taxes inflating operating expenses, actual effective rates at which
deals are being done have decreased, and the value of concession packages increased.
In addition, the spread between quoted rates and actual deal rates is widening
significantly.
“Houston’s office leasing market fundamentals are expected to remain soft as new
supply is expected to outpace demand through 2017, which could push the citywide
direct occupancy rate down to approximately 82.5% by year-end 2017 -- its lowest level
since 1995. Current oil market conditions suggest downsizing will continue and
additional sublease blocks will hit the market due to job cuts, bankruptcies and merger
and acquisition activity, adding to the oversupply problem.
“The key areas for office property owners to focus on during these challenging times will
be the careful evaluation of near-term rollover and the retention of value by securing
early lease renewals and/or or extensions to combat potential increased vacancies.
Even though office-using job growth is expected to return sometime in 2018, future
© Copyright 2016 Commercial Gateway, the Commercial Division of the Houston Association of REALTORS ® This information has been compiled from various sources and is provided without guarantee or warranty.
5

leasing demand from the energy sector will likely remain suppressed as there will be an
abundance of sublease and shadow space that must be dealt with before tenants will
absorb additional space. Another factor that could impact future absorption trends in the
competitive leasing market is the continuing trend of consolidation into owned facilities
by large companies such as ExxonMobil, Phillips 66, Shell Oil, Southwestern Energy,
Halliburton, FMC Technologies, Hillcorp and others.”
Alex Taghi, Vice President, NAI Partners “Houston is an incredibly resilient city; it’s much
ballyhooed economic diversity is certainly not without merit. That said, the ‘lower for
longer’ reality for oil prices has been felt nowhere more acutely than the office sector, the
one sector tied directly to oil and gas job creation. As such, we continue to see an
incredibly favorable tenant market with a couple of major caveats, however. Smaller
tenants, say under 10,000 rentable square feet, are seeing a slightly tighter market than
their larger counterparts, particularly in regards to sublease space. Additionally,
although the market as a whole is as favorable to tenants as we’ve seen in recent
memory, it can still differ greatly on a building-by-building basis. The constant barrage of
reports and news clippings about the demise of the Houston office market is not entirely
overblown (12 million square feet of sublease space alone), but many of the ultra-
aggressive deals are tied to large block availabilities where a smaller tenant may have a
hard time taking advantage.
“NAI research indicates there is about a 35% delta between direct rates and sublease
rates - in specific instances that delta is even greater. It’s easy to see why subleases are
gaining so much traction – they offer premium built-out space, often fully furnished, at
very attractive economics. Terms vary greatly, though, and it requires a thorough
understanding of market dynamics to educate your clients accordingly as expectations
and reality don’t always align. With the unprecedented amount of sublease space in
addition to new office deliveries (as dwindling as those are becoming), many landlords
are being forced to make difficult decisions – attempt to protect rates or be proactive and
maximize tenancy today but take a haircut on economics. Even though we’ve seen a
modest rebound in oil prices, it will take time to backfill all the space on the market,
pushing back any true office market recovery until late 2017 at the earliest and likely into
2018 or beyond.
© Copyright 2016 Commercial Gateway, the Commercial Division of the Houston Association of REALTORS ® This information has been compiled from various sources and is provided without guarantee or warranty.
6

“Heady tenants will take full advantage of current market conditions, whether locking in
lower rates and increased concessions, taking advantage of a plethora of sublease
options, or simply leveraging the negative news into a more favorable restructure. As
Warren Buffett famously said, ‘Be fearful when others are greedy, and be greedy when
others are fearful…’ For the able tenant, now may be the time to get greedy.”
Houston Industrial Market
Houston’s industrial market continued to expand dramatically during the third quarter
with positive direct net absorption of 6.1 million square feet, according to statistics compiled by
Commercial Gateway. Daikin Industries’ manufacturing and distribution facility, reported as the
largest concrete tilt-wall building in the world at 4 million square feet, accounts for about two-
thirds of the quarter’s absorption. Located off U.S. Highway 290 about three miles west of State
Highway 99, the $417 million campus represents the consolidation of four existing facilities in
the U.S. Built by the Japan-based HVAC manufacturer, the facility will eventually employ up to
5,000 people.
This quarter’s absorption represents the 27th consecutive quarter – over six years – of
positive absorption, with seven quarters recording more than 2 million square feet each and
more than half recording more than 1 million square feet. Even without Daikin’s property, the
current quarter’s absorption compares favorably to the 1.7 million square feet recorded in third
quarter last year. The current absorption total includes 2.3 million square feet of warehouse-
distribution space along with 4.1 million square feet of manufacturing space. Only light industrial
space offset the positive levels with a negative 364,831 square feet.
Activity is slowing for some product in some areas but due to the large property coming
online totally leased, the vacancy rate decreased slightly to 6.1%, compared to 6.3% the
previous quarter. Vacancy for warehouse/distribution space citywide is 6.3% with manufacturing
space at a low of 3.0%.
Almost 6 million square feet in 11 buildings came online during the third quarter,
contributing about 5.1 million square feet to the absorption total coming on line at 85.4% leased.
Year-to-date, 39 industrial buildings totaling almost 9 million square feet were completed in
2016 and are collectively 79.1% leased.
Construction activity is still high with many projects underway and other build-to-suit
(BTS) projects getting ready to start construction before the end of the year. Currently, 42
© Copyright 2016 Commercial Gateway, the Commercial Division of the Houston Association of REALTORS ® This information has been compiled from various sources and is provided without guarantee or warranty.
7

buildings representing 6.4 million square feet are underway. The largest BTS is FedEx’s new
800,000-square-foot distribution facility in the Northwest near the Grand Parkway and west of
U.S. Highway 290. The bulk of the remainder under construction is concentrated in the
Southeast with 14 projects totaling more than 3.1 million square feet followed by the Southwest
with eight projects totaling more than 1.1 million square feet. Overall, the under-construction
market is 54.5% preleased.
Rental rates have decreased slightly this quarter to $7.10 from $7.21 last quarter but are
lower than the $7.77 recorded during the same quarter last year.
Sublease space had been steadily increasing each quarter during the last couple years,
and increased slightly to 2.6 million square feet this quarter. The current quarter’s total is still
almost double the square footage from the same quarter a year ago.
Commercial Gateway Member/Broker Comments on the Houston Industrial Market
Peyton Easley, Associate, ICO Commercial “The Houston industrial market continues to
trend in a positive direction with vacancy rates remaining low and strong levels of
activity. Despite the headlines throughout 2016, properties are continuing to perform
well and there is a healthy amount of new construction. However, each submarket has
its own story.
“The Northwest and Southeast continue to get the spotlight because of the softening of
the oil industry and the rise of the petrochemical sector. However, one submarket that
has been relatively unchanged from the oil-and-gas struggles is the Southwest
submarket. In fact, rental rates have increased every quarter since the end of 2014; this
is possible because the tenant mix has few oil- and gas-related tenants.
“Despite the success in the Southwest, the vacancy rate rose in the second quarter of
2016 to 5.6% but has since dropped back down to 4.7% in the third quarter. This short-
term increase in vacancy rates was due to the increased construction in late 2015 and
early 2016; developers were making up for the construction slowdown in the market
since mid-2014.
“Current market conditions surprise tenants when they realize rental rates are increasing
in spite of the Houston storyline. However, the increases are fairly small as the market
has seen a meager 7.5% increase since 2013.Tenants looking to move away from
leasing will be amazed by the lack of product for sale. Only 2.3% of the market’s
© Copyright 2016 Commercial Gateway, the Commercial Division of the Houston Association of REALTORS ® This information has been compiled from various sources and is provided without guarantee or warranty.
8

properties are currently available for purchase. That being said, the Southwest
submarket clearly favors landlords and owners.”
Michael Keegan, SIOR, Senior Vice President, NAI Partners “The Houston industrial market
remains steady over the third quarter with absorption and deliveries gaining
momentum. Supply is up compared to the second quarter, and demand sees a slow
uptick.
“Leasing activity was a bit slower compared to the second quarter with a 3.6%
decrease. Vacancy also saw a slight decrease of 5.2% while 6.5 million square feet of
industrial product type was delivered in the third quarter. Although that seems like a
large number, 4 million of that was the Daikin Industries facility in Waller, Texas.
“Low oil prices continue to impact Houston’s local economy and development. We are
still seeing landlord concessions being offered along with reduced sale prices and
substantial amounts of free rent for both dock-high distribution and free-standing
manufacturing facilities. The free-standing manufacturing market is still bearing the brunt
of low oil prices and continues to perform at the lowest of all product classes.
“The Northwest Houston submarket continues to be impacted the most by low oil
prices. North Houston showed signs of growth in the first and second quarter but slowed
down towards the end of summer. South and Southwest Houston submarkets are
getting more and more attention from big-bulk distribution developers while Southeast
Houston remains strong thanks to the healthy petrochemical industry.
“We expect positive growth in the fourth quarter specifically in the big-bulk distribution
markets, and if oil continues to climb, we’ll hopefully see growth in the manufacturing
arena.”
Founded in 2001, Commercial Gateway, the commercial division of the Houston Association of Realtors (HAR), is a commercial information exchange of commercial real estate professionals engaged in every aspect of property sales and leasing, appraisal, property management and counseling.
###
© Copyright 2016 Commercial Gateway, the Commercial Division of the Houston Association of REALTORS ® This information has been compiled from various sources and is provided without guarantee or warranty.
9

Houston-Area Office Market Overview2016 Third Quarter
# of Building Vacant Vacancy Net Abs Net Abs Under Avg Sublease
Bldgs* SF** SF Rate (Current) (YTD) Const Rent*** Avail
A 33 30,800,517 2,877,468 9.3% (360,826) (15,050) 1,057,658 $42.67 2,067,882
B 28 9,858,006 2,774,282 28.1% (63,938) (176,877) 0 $31.30 324,254
C 8 552,183 104,447 18.9% 0 (15,824) 0 $18.64 0
69 41,210,706 5,756,197 14.0% (424,764) (207,751) 1,057,658 $39.19 2,392,136
A 47 15,413,898 2,145,664 13.9% 14,917 (194,168) 0 $31.35 2,227,136
B 54 6,208,400 1,535,454 24.7% (348,219) (335,785) 0 $27.57 574,745
C 8 355,254 39,477 11.1% 408 (26,599) 0 $21.22 6,195
109 21,977,552 3,720,595 16.9% (332,894) (556,552) 0 $29.65 2,808,076
A 25 2,982,239 339,797 11.4% 36,324 109,693 27,906 $26.49 98,908
B 23 2,594,611 209,046 8.1% 6,001 (19,778) 0 $20.27 0
C 1 156,000 50,471 32.4% (25,441) (6,164) 0 19 0
49 5,732,850 599,314 10.5% 16,884 83,751 27,906 $23.62 98,908
A 26 5,411,356 2,099,275 38.8% (49,521) (436,835) 0 $25.76 506,127
B 46 4,593,052 1,349,045 29.4% 138,492 232,779 0 $16.41 188,445
C 27 1,999,611 403,435 20.2% (36,553) 87,991 0 $11.90 6799
99 12,004,019 3,851,755 32.1% 52,418 (116,065) 0 $21.51 701,371
A 38 11,414,570 1,690,919 14.8% 206,308 366,072 188,696 $33.04 201,843
B 109 10,833,247 1,264,685 11.7% (88,761) (133,174) 28,000 $26.45 64,408
C 62 4,151,529 310,307 7.5% 4,909 18,734 0 $17.46 2,250
209 26,399,346 3,265,911 12.4% 122,456 251,632 216,696 $29.18 268,501
A 61 11,950,553 1,462,680 12.2% 170,116 205,308 0 $31.50 368,667
B 86 4,956,363 968,988 19.6% (140,006) (69,720) 0 $19.00 133,022
C 22 914,144 145,935 16.0% (4,307) (19,607) 0 $13.97 0
169 17,821,060 2,577,603 14.5% 25,803 115,981 0 $24.25 501,689
A 3 411,670 10,616 2.6% (2,986) 357,014 0 $25.75 0
B 16 640,930 56,585 8.8% 7,407 16,009 0 $17.28 0
C 6 206,683 80652 39.0% (480) (215) 0 15.39 0
25 1,259,283 147,853 11.7% 3,941 372,808 0 $16.78 0
A 40 4,770,344 917,124 19.2% 14,093 59,571 0 $26.11 236,824
B 63 5,187,947 1,273,992 24.6% (58,038) (23,038) 0 $18.99 113,458
C 22 1,007,437 169,719 16.9% 7,033 (29,467) 0 $17.14 0
125 10,965,728 2,360,835 21.5% (36,912) 7,066 0 $21.08 350,282Northwest Subtotal
Fort Bend County
Fort Bend County Subtotal
Greenspoint
Greenspoint Subtotal
Inner Loop
Inner Loop Subtotal
North/The Woodlands/
Conroe
North/The Woodlands/ Conroe Subtotal
Northeast
Northeast Subtotal
Northwest
Energy Corridor Subtotal
Submarket Class
CBD
CBD Subtotal
Energy Corridor
© Copyright 2016 Commercial Gateway, the Commercial Division of the Houston Association of REALTORS ® This information has been compiled from various sources and is provided without guarantee or warranty.
10

A 17 1,989,649 148,641 7.5% 75,309 77,431 0 $24.30 29,537
B 57 3,682,885 676,646 18.4% (60,697) (196,530) 0 $17.87 22,175
C 39 1,868,158 312,064 16.7% (31,910) 10,089 0 $17.38 27610
113 7,540,692 1,137,351 15.1% (17,298) (109,010) 0 $18.28 79,322
A 5 1,089,277 233,655 21.5% 2,966 (11,868) 0 $17.25 850
B 49 5,709,512 1,264,766 22.2% 36,632 57,855 0 $21.12 32,741
C 72 4,903,178 612,914 12.5% (27,718) (110,543) 0 $13.46 17,700
126 11,701,967 2,111,335 18.0% 11,880 (64,556) 0 $17.94 51,291
A 45 17,722,017 3,236,648 18.3% (96,628) 63,627 507,170 $37.07 931,335
B 76 10,469,387 1,235,295 11.8% 10,859 (67,509) 0 $28.89 304,911
C 14 983,308 114,254 11.6% (52,120) (62,054) 0 $21.06 2804
135 29,174,712 4,586,197 15.7% (137,889) (65,936) 507,170 $34.70 1,239,050
A 52 8,429,288 1,142,309 13.6% 287,239 317,142 290,000 $27.21 771,667
B 40 3,572,381 449,456 12.6% (72,285) (66,300) 0 $19.06 59,806
C 37 1,776,592 153,355 8.6% (7,008) (49,368) 0 $16.54 13,037
129 13,778,261 1,745,120 12.7% 207,946 201,474 290,000 $23.66 844,510
A 35 10,435,493 1,160,427 11.1% 1,027,415 1,274,950 186,000 $35.65 1,067,821
B 49 6,637,887 682,800 10.3% 39,561 273,595 0 $19.74 280,656
C 16 768,196 58,785 7.7% 17,179 20,531 0 $16.16 176
100 17,841,576 1,902,012 10.7% 1,084,155 1,569,076 186,000 $30.64 1,348,653
A 427 122,820,871 17,465,223 14.2% 1,324,726 2,172,887 2,257,430 $33.49 8,508,597
B 696 74,944,608 13,741,040 18.3% (592,992) (508,473) 28,000 $22.70 2,098,621
C 334 19,642,273 2,555,815 13.0% (156,008) (182,496) 0 $15.54 76,571
1,457 217,407,752 33,762,078 15.5% 575,726 1,481,918 2,285,430 $28.15 10,683,789
* Number of buildings calculated on specific buildings at each property address
**Includes all general-purpose existing office buildings 20,000 square feet or larger
***Rental rates are weighted and averaged based on available space
Houston-Area Total
Southeast
Southeast Subtotal
Southwest
Southwest Subtotal
Uptown
Uptown Subtotal
West
West Subtotal
Westchase
Westchase Subtotal
Houston Area
© Copyright 2016 Commercial Gateway, the Commercial Division of the Houston Association of REALTORS ® This information has been compiled from various sources and is provided without guarantee or warranty.
11

Houston-Area Office Historical Overview2016 Third Quarter
# of Building Vacant SFVacancy
Rate Avail SFNet
Absorption
Period Buildings* SF** Direct Direct Sublease Direct Direct Sublease
2016 Q3 1,457 217,407,752 33,762,078 15.5% 10,683,789 575,726 $28.15 $22.41
2016 Q2 1,437 215,060,856 32,689,397 15.2% 10,128,144 (188,289) $28.22 $24.31
2016 Q1 1,418 212,534,106 30,295,257 14.3% 7,184,337 1,094,481 $27.89 $22.45
2015 Q4 1,390 210,381,234 29,339,456 13.9% 6,718,856 469,895 $28.74 $23.16
2015 Q3 1,363 207,476,275 27,672,276 13.3% 5,737,050 (259,089) $27.20 $25.40
2015 Q2 1,358 206,278,067 26,394,894 12.8% 4,871,969 1,503,287 $26.71 $28.10
2015 Q1 1,352 203,900,512 25,522,582 12.5% 3,450,693 32,894 $26.43 $29.72
2014 Q4 1,339 200,792,837 22,813,152 11.4% 3,195,204 1,717,228 $25.48 $29.33
2014 Q3 1,332 198,190,602 21,760,803 11.0% 3,042,717 930,055 $25.20 $29.42
2014 Q2 1,323 196,763,713 21,366,907 10.9% 3,127,013 2,312,302 $25.13 $27.94
2014 Q1 1,315 195,022,071 21,682,105 11.1% 2,751,241 1,149,977 $24.96 $26.01
2013 Q4 1,311 194,129,561 21,837,541 11.2% 2,616,113 674,935 $24.36 $27.50
2013 Q3 1,305 193,030,585 22,129,982 11.5% 2,299,752 1,799,437 $24.33 $27.48
2013 Q2 1,292 190,961,134 21,276,607 11.1% 2,034,806 563,625 $23.68 $26.34
2013 Q1 1,287 189,916,763 21,473,236 11.3% 1,703,604 408,040 $23.38 $25.56
2012 Q4 1,288 189,875,565 21,896,530 11.5% 1,654,045 1,133,953 $23.28 $23.05
2012 Q3 1,284 189,357,218 22,415,856 11.8% 1,669,477 437,218 $23.04 $23.71
2012 Q2 1,282 189,530,208 22,876,464 12.1% 1,873,841 1,428,941 $22.85 $24.85
2012 Q1 1,282 189,548,626 23,705,909 12.5% 2,220,466 825,651 $22.75 $25.28
2011 Q4 1,280 189,373,217 25,430,981 13.4% 2,508,155 956,156 $22.91 $25.34
2011 Q3 1,274 188,889,492 26,182,552 13.9% 3,001,909 1,300,872 $22.74 $25.32
2011 Q2 1,273 187,989,047 26,589,601 14.1% 2,748,436 74,580 $22.97 $24.95
2011 Q1 1,271 187,304,895 26,156,145 14.0% 2,793,033 (208,340) $23.23 $24.02
* Number of buildings calculated on specific buildings at each property address
**Includes all general-purpose existing office buildings 20,000 square feet or larger
***Rental rates are weighted and averaged based on available space
Avg Rent***
© Copyright 2016 Commercial Gateway, the Commercial Division of the Houston Association of REALTORS ® This information has been compiled from various sources and is provided without guarantee or warranty.
12

Period Class A Class B Class C All Classes
2016 Q3 1,324,726 (592,992) (156,008) 575,726
2016 Q2 (218,628) 170,806 (140,467) (188,289)
2016 Q1 1,066,789 (86,287) 113,979 1,094,481
2015 Q4 831,660 (206,127) (155,638) 469,895
2015 Q3 431,000 (987,754) 297,665 (259,089)
2015 Q2 1,675,438 (208,317) 38,093 1,503,287
2015 Q1 344,659 (494,148) 181,513 32,894
2014 Q4 1,425,969 299,247 (7,988) 1,717,228
2014 Q3 955,886 (125,940) 100,109 930,055
2014 Q2 1,956,504 171,026 185,092 2,312,302
2014 Q1 1,018,304 159,809 (28,136) 1,149,977
2013 Q4 484,233 270,612 (80,335) 674,935
2013 Q3 1,809,844 76,169 (86,576) 1,799,437
2013 Q2 824,750 (84,770) (176,355) 563,625
2013 Q1 230,615 248,903 (71,478) 408,040
2012 Q4 569,506 649,256 (84,809) 1,133,953
2012 Q3 394,633 18,446 24,139 437,218
2012 Q2 1,334,128 63,081 31,732 1,428,941
2012 Q1 48,249 645,798 131,604 825,651
2011 Q4 802,769 65,449 87,938 956,156
2011 Q3 1,497,234 (232,783) 36,421 1,300,872
2011 Q2 216,347 (130,246) (11,521) 74,580
2011 Q1 194,823 (428,686) 25,523 (208,340)
Houston-Area Office Direct Net Absorption by Class
© Copyright 2016 Commercial Gateway, the Commercial Division of the Houston Association of REALTORS ® This information has been compiled from various sources and is provided without guarantee or warranty.
13

Houston-Area Industrial Market Summary2016 Third Quarter
# of Building Vacant Vacancy Net Abs Net Abs Under Avg Sublease
Submarket Specific Use Bldgs* SF** SF Rate (Current) (YTD) Const Rent*** Avail
Warehouse - Distribution 277 13,704,844 412,846 3.0% (36,233) 41,640 0 $6.88 18,342
Manufacturing 27 1,164,186 18,600 1.6% (18,600) (19,865) 0 $5.94 0
Light Industrial 166 4,172,434 258,827 6.2% 25,207 (13,986) 0 $5.83 0
Flex/R&D 95 2,456,777 189,403 7.7% 1,151 (30,955) 0 $13.96 0
565 21,498,241 879,676 4.1% (28,475) (23,166) 0 $7.11 18,342
Warehouse - Distribution 228 9,599,300 878,988 9.2% 265,210 247,149 223,735 $7.22 0
Manufacturing 52 3,037,344 193,533 6.4% 52,150 177,950 0 $5.92 0
Light Industrial 253 4,997,204 325,709 6.5% 56,008 46,479 166,238 $8.84 57,482
Flex/R&D 44 1,938,820 328,515 16.9% (1,595) (10,195) 50,000 $14.19 5100
577 19,572,668 1,726,745 8.8% 371,773 461,383 439,973 $7.97 62,582
Warehouse - Distribution 569 48,187,596 5,344,789 11.1% (61,790) (58,431) 164,060 $6.41 435,002
Manufacturing 95 7,714,006 119,222 1.6% 0 890,455 34,500 $6.72 122,207
Light Industrial 351 8,476,944 820,429 9.7% (53,997) (166,341) 0 $7.84 86,037
Flex/R&D 113 3,921,523 518,351 13.2% (37,572) (33,347) 0 $7.28 70,403
1,128 68,300,069 6,802,791 10.0% (153,359) 632,336 198,560 $6.87 713,649
Warehouse - Distribution 1,029 80,656,138 4,707,555 5.8% 1,069,722 950,615 1,024,890 $7.66 803,148
Manufacturing 194 17,112,564 482,785 2.8% 3,988,851 3,942,859 0 $8.46 48,500
Light Industrial 839 20,455,797 1,431,497 7.0% (42,386) (202,960) 61,250 $7.85 236,372
Flex/R&D 329 12,886,003 562,712 4.4% 72,403 20,684 0 $9.68 133,774
2,391 131,110,502 7,184,549 5.5% 5,088,590 4,711,198 1,086,140 $8.02 1,221,794
Warehouse - Distribution 274 16,564,643 677,779 4.1% 89,640 (116,548) 433,000 $5.28 59,501
Manufacturing 53 3,562,271 55,650 1.6% 0 0 80,000 6.31 90,000
Light Industrial 340 6,857,921 452,241 6.6% (16,481) (127,249) 0 $6.25 0
Flex/R&D 55 1,817,877 137,983 7.6% 5,080 (16,153) 0 $10.20 0
722 28,802,712 1,323,653 4.6% 78,239 (259,950) 513,000 $5.96 149,501
Warehouse - Distribution 682 60,149,788 2,524,219 4.2% 1,147,194 996,804 2,638,060 $5.48 10,400
Manufacturing 130 15,137,407 137,660 0.9% 101,936 185,906 260,000 $8.50 0
Light Industrial 348 7,610,327 769,548 10.1% (357,263) (349,327) 120,617 $7.34 0
Flex/R&D 83 2,769,854 135,454 4.9% (14,617) (14,617) 0 $13.29 0
1,243 85,667,376 3,566,881 4.2% 877,250 898,498 3,018,677 $6.31 10,400
Warehouse - Distribution 500 33,813,351 2,015,174 6.0% (172,231) 239,621 1,123,167 $6.88 305,720
Manufacturing 66 4,663,819 547,220 11.7% 2,009 (204,241) 0 $4.42 65,942
Light Industrial 407 11,727,094 566,218 4.8% 24,081 4,843 0 $8.84 20,505
Flex/R&D 194 6,710,206 402,573 6.0% 514 (36,225) 0 $13.99 57,718
1,167 56,914,470 3,531,185 6.2% (145,627) 783,186 1,123,167 $7.23 449,885
Inner Loop
Inner Loop Subtotal
North
North Subtotal
Northeast
Northeast Subtotal
Northwest
Northwest Subtotal
Southeast
Southeast Subtotal
Southwest
Southwest Subtotal
South
South Subtotal
© Copyright 2016 Commercial Gateway, the Commercial Division of the Houston Association of REALTORS ® This information has been compiled from various sources and is provided without guarantee or warranty.
14

Warehouse - Distribution 3,559 262,675,660 16,561,350 6.3% 2,301,512 3,080,038 5,606,912 $6.43 1,632,113
Manufacturing 617 52,391,597 1,554,670 3.0% 4,126,346 4,973,064 374,500 $5.88 326,649
Light Industrial 2,704 64,297,721 4,624,469 7.2% (364,831) (808,541) 348,105 $7.72 400,396
Flex/R&D 913 32,501,060 2,274,991 7.0% 25,364 (41,076) 50,000 $10.30 266,995
7,793 411,866,038 25,015,480 6.1% 6,088,391 7,203,485 6,379,517 $7.10 2,626,153
* Number of buildings calculated on specific buildings at each property address
**Includes all general-purpose existing industrial buildings 10,000 square feet or larger or those within a designated business park
***Rental rates are weighted and averaged based on available space
Houston Area
Houston Area Total
© Copyright 2016 Commercial Gateway, the Commercial Division of the Houston Association of REALTORS ® This information has been compiled from various sources and is provided without guarantee or warranty.
15
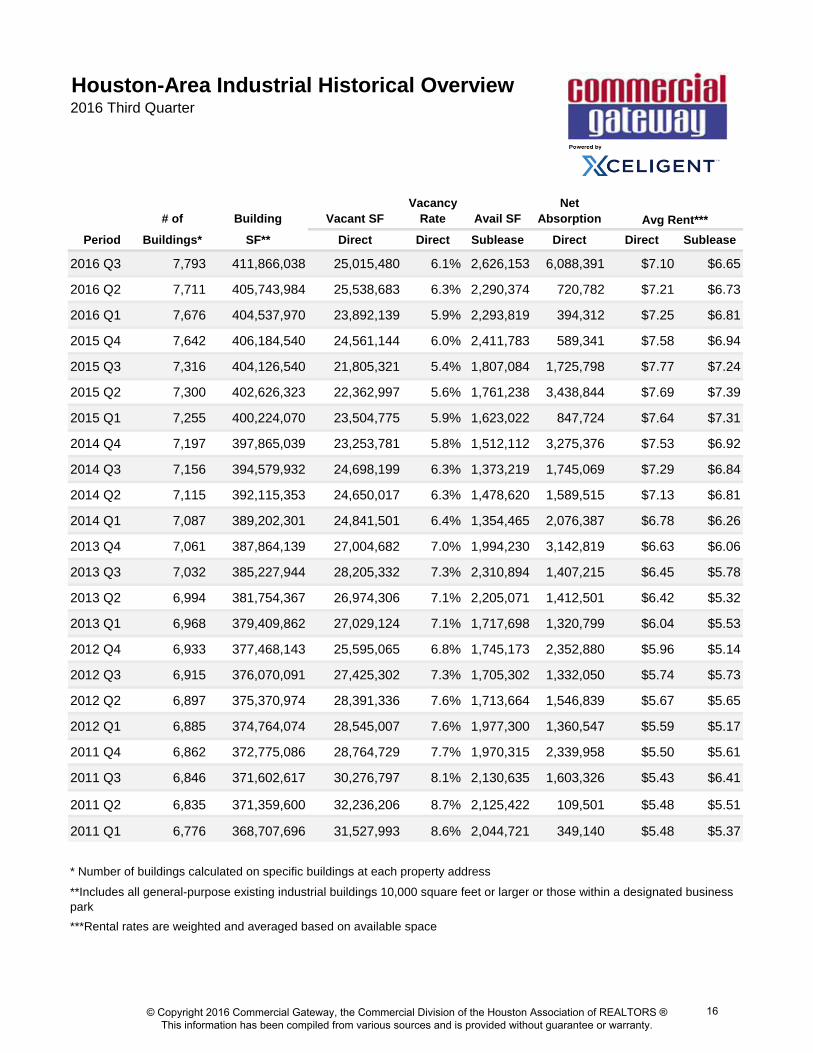
Houston-Area Industrial Historical Overview2016 Third Quarter
# of Building Vacant SFVacancy
Rate Avail SFNet
Absorption
Period Buildings* SF** Direct Direct Sublease Direct Direct Sublease
2016 Q3 7,793 411,866,038 25,015,480 6.1% 2,626,153 6,088,391 $7.10 $6.65
2016 Q2 7,711 405,743,984 25,538,683 6.3% 2,290,374 720,782 $7.21 $6.73
2016 Q1 7,676 404,537,970 23,892,139 5.9% 2,293,819 394,312 $7.25 $6.81
2015 Q4 7,642 406,184,540 24,561,144 6.0% 2,411,783 589,341 $7.58 $6.94
2015 Q3 7,316 404,126,540 21,805,321 5.4% 1,807,084 1,725,798 $7.77 $7.24
2015 Q2 7,300 402,626,323 22,362,997 5.6% 1,761,238 3,438,844 $7.69 $7.39
2015 Q1 7,255 400,224,070 23,504,775 5.9% 1,623,022 847,724 $7.64 $7.31
2014 Q4 7,197 397,865,039 23,253,781 5.8% 1,512,112 3,275,376 $7.53 $6.92
2014 Q3 7,156 394,579,932 24,698,199 6.3% 1,373,219 1,745,069 $7.29 $6.84
2014 Q2 7,115 392,115,353 24,650,017 6.3% 1,478,620 1,589,515 $7.13 $6.81
2014 Q1 7,087 389,202,301 24,841,501 6.4% 1,354,465 2,076,387 $6.78 $6.26
2013 Q4 7,061 387,864,139 27,004,682 7.0% 1,994,230 3,142,819 $6.63 $6.06
2013 Q3 7,032 385,227,944 28,205,332 7.3% 2,310,894 1,407,215 $6.45 $5.78
2013 Q2 6,994 381,754,367 26,974,306 7.1% 2,205,071 1,412,501 $6.42 $5.32
2013 Q1 6,968 379,409,862 27,029,124 7.1% 1,717,698 1,320,799 $6.04 $5.53
2012 Q4 6,933 377,468,143 25,595,065 6.8% 1,745,173 2,352,880 $5.96 $5.14
2012 Q3 6,915 376,070,091 27,425,302 7.3% 1,705,302 1,332,050 $5.74 $5.73
2012 Q2 6,897 375,370,974 28,391,336 7.6% 1,713,664 1,546,839 $5.67 $5.65
2012 Q1 6,885 374,764,074 28,545,007 7.6% 1,977,300 1,360,547 $5.59 $5.17
2011 Q4 6,862 372,775,086 28,764,729 7.7% 1,970,315 2,339,958 $5.50 $5.61
2011 Q3 6,846 371,602,617 30,276,797 8.1% 2,130,635 1,603,326 $5.43 $6.41
2011 Q2 6,835 371,359,600 32,236,206 8.7% 2,125,422 109,501 $5.48 $5.51
2011 Q1 6,776 368,707,696 31,527,993 8.6% 2,044,721 349,140 $5.48 $5.37
* Number of buildings calculated on specific buildings at each property address
***Rental rates are weighted and averaged based on available space
Avg Rent***
**Includes all general-purpose existing industrial buildings 10,000 square feet or larger or those within a designated business park
© Copyright 2016 Commercial Gateway, the Commercial Division of the Houston Association of REALTORS ® This information has been compiled from various sources and is provided without guarantee or warranty.
16

Period Flex/R&D Light Industrial ManufacturingWarehouse-Distribution All Types
2016 Q3 25,364 (364,831) 4,126,346 2,301,512 6,088,391
2016 Q2 84,647 (92,389) (62,545) 791,069 720,782
2016 Q1 (151,087) (351,321) 909,263 (12,543) 394,312
2015 Q4 (161,947) (144,312) 76,496 819,104 589,341
2015 Q3 (10,786) 117,802 78,674 1,540,108 1,725,798
2015 Q2 117,699 203,720 247,275 2,870,150 3,438,844
2015 Q1 385,258 (7,313) 188,910 280,869 847,724
2014 Q4 6,239 458,935 (143,098) 2,953,300 3,275,376
2014 Q3 31,000 20,982 408,958 1,284,129 1,745,069
2014 Q2 6,534 189,176 207,922 1,185,883 1,589,515
2014 Q1 47,194 162,451 454,750 1,411,992 2,076,387
2013 Q4 (4,830) (192,608) 51,980 3,288,277 3,142,819
2013 Q3 52,871 173,835 65,704 1,114,805 1,407,215
2013 Q2 (157,790) (8,137) (63,405) 1,641,833 1,412,501
2013 Q1 7,293 79,562 294,045 939,899 1,320,799
2012 Q4 33,839 143,171 268,394 1,907,476 2,352,880
2012 Q3 (192,880) 327,075 105,257 1,092,598 1,332,050
2012 Q2 (138,262) 136,630 44,180 1,504,291 1,546,839
2012 Q1 25,173 (82,904) 115,825 1,302,453 1,360,547
2011 Q4 (17,800) (43,148) 537,804 1,863,102 2,339,958
2011 Q3 1,150 (159,986) 90,211 1,671,951 1,603,326
2011 Q2 (67,016) (247,923) 29,313 395,127 109,501
2011 Q1 150,600 134,957 (46,076) 109,659 349,140
Houston-Area Industrial Direct Net Absorption by Type
© Copyright 2016 Commercial Gateway, the Commercial Division of the Houston Association of REALTORS ® This information has been compiled from various sources and is provided without guarantee or warranty.
17

Quarterly Market Overview 2016 Second Quarter FOR IMMEDIATE RELEASE
For more information, please contact: David Mendel, Public Relations Manager Phone: 713.629.1900 ext. 258 E‐mail: [email protected]
HOUSTON’S SECOND-QUARTER COMMERCIAL ACTIVITY
SHOWS OFFICE STRUGGLE, INDUSTRIAL FLOURISH
HOUSTON — (July 21, 2016) — Houston’s commercial real estate market offers a
mixed report: office continues to struggle while certain types of industrial continue to flourish,
depending on location. That’s according to quarterly market research compiled by Commercial
Gateway, the commercial division of the Houston Association of Realtors (HAR).
The second quarter reported direct negative net absorption of 88,768 square feet of
office space, a major decrease when compared to the same quarter last year of positive 1.5
million square feet and this year’s first-quarter absorption of 905,855 square feet. Class B
properties represent the bulk of the this quarter’s growth, 122,152 square feet, offset by Class A
and C’s negative absorption of 110,920 square feet. However, to put this in perspective, both
last year’s and last quarter’s positive absorption resulted from single-tenant and owner-occupied
projects being completed and occupied.
Space left behind by various firms occupying those new properties are showing up as
direct space and affecting the vacancy rate, which continues to climb. The current 15.4% direct
vacancy rate is up from the 14.4% vacancy recorded last quarter, and also up from the 12.8%
recorded during the same quarter in 2015. No submarket is reporting a single-digit vacancy
rate, and only the Central Business District is reporting single-digit vacancy in Class A space.
Class A space overall is 14.6% vacant.
The changing economy related to the energy downturn is clearly reflected in the record-
level vacancy when it is combined with the additional 2.8 million square feet of sublease space
added this quarter. One newly completed building representing almost 600,000 square feet of
preleased space came on the market with its total square footage now being marketed as
sublease space. More than 5.2 million net square feet has been added during the last 12
months, although we more than 700,000 square feet of sublease space has been reported as
having been leased during the first half of the year. At the end of the second quarter, the
© Copyright 2016 Commercial Gateway, the Commercial Division of the Houston Association of REALTORS ® This information has been compiled from various sources and is provided without guarantee or warranty.
1

Houston market recorded more than 10.1 million square feet of sublease space available and
being marketed. Of that total, almost 8.1 million, or 80%, is Class A space.
For the quarter, seven new buildings were completed, adding almost 2.8 million square
feet to the market. Five of the buildings have no pre-leasing while the other one entered the
market preleased but is now available as sublease. The bright spot was the Phillip 66
headquarters complex being completed with 1.1 million square feet to be occupied during the
next two months, which will improve the absorption total for the year.
Construction starts have idled for the most part since the first quarter, with only office
buildings in mixed-use projects breaking ground. Overall, the Houston under-construction office
market has 15 properties totaling 3.9 million square feet. Collectively, the under-construction
buildings are about 47.4% preleased, with 13 properties classified as multi-tenant. Of those
under construction, eight are scheduled for completion by yearend. Three of those are not
bringing any availability to the market: BHP Billiton will be occupying its entire 600,000 square
feet in Uptown, the Greater Houston Partnership and other local governmental type firms will be
occupying the Partnership building, and the Dave Ward Building will be occupied by Crime
Stoppers. The largest spec building under construction with the largest availability remains
Hines’ 609 Main at Texas building, which is 28% preleased.
With construction on the decline, one major prelease announced during second-quarter
was American Bureau of Shipping’s 300,000+-square-foot lease at CityPlace2 in Springwoods
Village near The Woodlands. CityPlace2 is scheduled to break ground next year. ABS will
leaving almost 259,000 square feet in Greenspoint Place. Other leases recorded during the
second quarter included Patterson-UTI Energy’s 34,748-square-foot lease in Remington Square
II along with two additional preleases for Amegy Bank Tower, which leaves that building with
only 12,469 square feet to lease.
Concessions are becoming more commonplace in the market, even though quoted
rental rates have seen averages increase. Rental rates showed an increase from the past
quarter and the past year with the current overall averaged weighted rental rate of $28.04, up
from last quarter’s $27.72 and $26.57 from last year. Class A rates, now at $33.54 citywide and
at $41.04 in the CBD, experienced slight increases from last quarter from the same quarter in
2015. Rents for sublease space also increased slightly at $24.31 from last quarter’s $22.45
after showing consistent decreases for almost two years.
© Copyright 2016 Commercial Gateway, the Commercial Division of the Houston Association of REALTORS ® This information has been compiled from various sources and is provided without guarantee or warranty.
2

Commercial Gateway Member/Broker Comments on the Houston Office Market
Mario A. Arriaga, First Group “The commercial market continues to hold its own in the first half
of 2016, with positive absorption recorded in both the office and industrial sectors. The
office sector is clearly struggling as construction is at a standstill, and new buildings are
coming online with little or no preleasing. Vacancy is up along with sublease, which is at
record levels.
“The industrial and retail sectors are performing great, playing catch-up to the last few
years of large population increases in the area. Retailers are setting up distribution
centers as they expand into different areas of the city. The petrochemical industry has
also excelled, positively affecting the area’s industrial segment in the Southeast.
“The multi-family market is experiencing softness like the office market and oversupply
has occurred. However, like office, new construction has stopped with most new units to
be completed through early next year.
“Although the office and multi-family markets are struggling now, Houston remains a
strong, robust city. The medical industry is booming with hospital expansions and
medical office buildings in every sector of the greater Houston area. The area’s
population growth will continue to positively affect the commercial real estate sectors.”
Elliott A. Hirshfeld, Senior Vice President, Brokerage Services, CBRE “From 2010 through
2014, the Houston office market experienced an extraordinary level of activity. In 2016,
however, we are in the doldrums, not the trade winds of this previous period. From an
overall market perspective, not much is happening. But not all properties in all areas are
affected; different buildings in different areas must be looked at on a case-by-case basis.
“One of the bigger challenges in today’s market is the gap between owners’ expectations
and tenants’ expectations. Bridging that gap is an educational process. Some owners,
those more focused on occupancy, are becoming more aggressive, but others are not.
Tenants seem to expect everything should be heavily discounted. Rental rates as a
whole are flat, with Class A rates dropping only 1%. Owners are more interested in
stability and do not want to damage the value of their buildings by reducing rents.
“Leasing activity is still happening, with a significant amount of absorption occurring in
the sublease marketplace over the first half of the year. One major challenge with
© Copyright 2016 Commercial Gateway, the Commercial Division of the Houston Association of REALTORS ® This information has been compiled from various sources and is provided without guarantee or warranty.
3

several sublease listings is that several are in large blocks of space. Sub-
landlords don’t want to break it up and spend money on improvements when they are
already losing money on the space. Current tenants are also reluctant to make too many
changes if they believe they may need the space back at a later date.
“In addition to law firms being active in the market, we are also seeing several non-
energy firms leasing more space. Firms are still interested in occupying quality offices to
attract and retain quality employees. Some older office properties may be considered
functionally obsolete and are being considered for re-purposing and major renovations.”
Trey Martin, Vice President, NAI Partners “The majority of building owners and landlords still
have well stabilized properties due to the fact that most tenants sign 5- to 10-year lease
terms, which the landlords hope will outlast the current oil boom/bust cycle. However,
landlords also recognize that the market has shifted into a ‘tenant-friendly market,’ and
they are certainly more willing to make leasing concessions now, such as abated rent
and increasing construction allowances for tenant improvements.
“Right now is an opportunity for certain tenants to ‘lock in’ at favorable lease terms, and
take advantage of unique situations in the marketplace where certain landlords have
large blocks of space that are vacant or expiring in the near future. Some of these
landlords are highly motivated to backfill the vacant space in their buildings. Tenants
utilizing their broker’s knowledge of the current market conditions can find these specific
buildings and negotiate favorable deal terms.”
L. Ace Schlameus, Senior Vice President, and Jenny Seckinger, Senior Associate,
Colliers International
“It was the best of times, it was the worst of times, it was the age of wisdom, it was the age of foolishness, it was the epoch of incredulity, it was a season of light, it was the season of darkness, it was the spring of hope, it was the winter of despair.”
“We all know the famous quote, ‘It was the best of times, it was the worst of times,’ but
most of us forget ‘it was a season of light’. Sounds a lot like the situation we find
ourselves here in Houston, Texas. Houston is one of the more interesting cities in the
world. Since the Allen brothers founded our fine community, we have embraced change.
It seems that we and our forefathers have understood that to be the smartest person in
the room simply meant that you were in the wrong room. Houstonians aren’t afraid to
change rooms.
© Copyright 2016 Commercial Gateway, the Commercial Division of the Houston Association of REALTORS ® This information has been compiled from various sources and is provided without guarantee or warranty.
4

“Our citizens have always been committed to making a mark on our state and this great
country. We have recruited talent from all over the world to live, work and be a part of
this community. Houston has sent men to the moon, improved lives by advancing
medicine, and, if it isn’t clear by now, we’ve made a significant impact towards making
our country more energy independent. Let us look at Houston’s role in the quest for
energy independence for a minute. It can be argued we actually made us a little too
independent as far as OPEC was concerned - which brings me to another part of the
same Dicken’s quote: ‘It was the age of wisdom, it was an age of foolishness.’ We’ve
taken some wrong turns recently. For example, we didn’t anticipate the moves of our
OPEC competitors, we over-estimated the world’s economies, and we’ve over-built our
office inventory.
“’It was the season of light’ The U.S. is now awash in potential energy reserves that we
were told could never be exploited. Such reserves are being produced for less money
and by a smaller work force. The market is changing, and companies are adapting.
Shell has recently shifted from abandoning shale altogether to making a long-term
corporate commitment in that direction; the decision was based on risk vs cost vs reward
factors. Transocean made the decision to refinance their debt, which, most believe, will
carry them through the tough times; and Schlumberger Technology Corp., who has
contracted with Energy Recovery Inc., a Silicon Valley firm, to implement an improved
hydraulic fracturing process. We are finding solutions, from changing drilling priorities,
restructuring debt and buying strategic properties both mineral & intellectual.
“Houstonians are innovators, if we don’t know how to do it, we’ll engage financial experts
from New York or high-tech professionals from California. We are in a period of light, not
darkness; we have generated hope, not despair. Change is coming. Our economy will
rise again, and we will be wiser this time. This is not your father’s Texas economy.”
John Spafford, Executive Vice President, Director of Leasing, PM Realty Group “The
prolonged energy sector downturn has cast a shadow of uncertainty over Houston’s
office leasing market over the past 18 months creating sluggish demand and rising
sublease availabilities on top of multiple new office buildings entering the market. Class
A leasing velocity over the past 12 months has declined by 47.1% from the prior year,
largely due to companies delaying leasing decisions in an uncertain economy, as well as
a lower volume of expiring leases and fewer expansions taking place. During the second
© Copyright 2016 Commercial Gateway, the Commercial Division of the Houston Association of REALTORS ® This information has been compiled from various sources and is provided without guarantee or warranty.
5

quarter of 2016, Houston’s office leasing market fundamentals continued to soften as the
citywide Class A direct occupancy level declined by 100 basis points to 84.0%, reaching
its lowest level since 2005. Although pre-lease commitments in newly-built projects
managed to keep Class A direct absorption levels in positive territory through 2015, new
supply has consistently outpaced demand in seven of the previous eight quarters
causing Class A direct occupancy levels to drop by 700 basis points since the cyclical
peak of 91.0% in early 2014.
“Within the competitive leasing market, developers completed 10 new office buildings
citywide during the second quarter totaling 1,324,153 square feet and delivered a total of
more than 6.4 million square feet of new office construction over the past 12 months
(excluding corporate-owned projects). Meanwhile, sublease availability has risen by 3.7
million square feet to 11.2 million square feet since mid-year 2015, as many energy-
related companies are placing underutilized space on the market that was created by
workforce reductions or space that was originally tied up for future expansion.
Consequently, total space availability has significantly increased by 6.1 million square
feet within the past 12 months. As office leasing volume remains sluggish and the
number of available space options continue to grow, asking rents have begun to adjust
and more concessions are being offered to stimulate leasing activity and combat the
increased vacancies.
“Houston’s office leasing market fundamentals are expected to remain soft for the
remainder of the year as the continuing trend of consolidation and space optimization by
office users and the completion of remaining office projects under construction will add
downward pressure on occupancy levels. The supply of sublease space - currently at its
highest level in decades - will remain a growing concern as energy firms continue to
dump excess space onto the market.
“The key areas for office property owners to focus on during these challenging times will
be the careful evaluation of near-term rollover and the retention of value by securing
early lease renewals and/or or extensions to combat potential increased vacancies.
Even though office-using job growth is expected to return by 2018, future leasing
demand from the energy sector will likely remain suppressed as there will be an
abundance of sublease and shadow space that must be dealt with before tenants will
absorb additional space.”
© Copyright 2016 Commercial Gateway, the Commercial Division of the Houston Association of REALTORS ® This information has been compiled from various sources and is provided without guarantee or warranty.
6

Houston Industrial Market
Houston’s industrial market continued to expand with positive direct net absorption of
719,078 square feet during the second quarter despite manufacturing slowdowns and overall
economic uncertainty, according to statistics released by Commercial Gateway.
This quarter’s absorption represents the 26th consecutive quarter – over six years – of
positive absorption, with six quarters recording more than 2 million square feet each and more
than half recording more than 1 million square feet. The second quarter’s net absorption clearly
represents a slowdown from those quarters, but is in line with the first quarter’s absorption of
628,981 square feet. The warehouse-distribution segment recorded 865,302 square feet
absorption in the second quarter, with manufacturing and light industrial offsetting that positive
with a negative 184,304 square feet.
In addition to the most recent announcement that IKEA is planning up to a million
square-foot distribution facility, Amazon has announced a large facility in the North along with
the leasing of another 100,000 square feet of distribution space in the Northwest. Serta has also
taken 268,407 square feet of space in Fallbrook Pines in the Northwest and FedEx moved into
its new 303,335 square-foot build-to-suit in the Southwest. Applied Optoelectronics also moved
into its expansion property totaling 111,600 square feet also in the Southwest.
Activity is slowing for some product in some areas, and due to several large properties
coming online with little preleasing, the vacancy rate increased slightly to 6.3%, compared to
6.0% the previous quarter. Vacancy for warehouse/distribution space citywide is 6.4% with
manufacturing space at a low of 3.8%.
More than 1.5 million square feet in 14 buildings came online during the second quarter,
contributing about 600,000 square feet to the absorption total. Collectively, all industrial
buildings completed this year entered the market 46.9% leased.
Construction activity is still high with many projects underway and many other proposed
properties announced. Currently, 62 buildings representing more than 10.7 million square feet
are underway. The two largest BTS projects are Daiken’s 4 million square foot facility off
Highway 290 and FedEx’s new 800,000-square-foot project near the Grand Parkway in the
Northwest. The bulk of the remainder under construction is concentrated in the Southeast with
17 projects totaling more than 2.8 million square feet followed by the Southwest with eight
© Copyright 2016 Commercial Gateway, the Commercial Division of the Houston Association of REALTORS ® This information has been compiled from various sources and is provided without guarantee or warranty.
7

projects totaling more than 1.1 million square feet. Overall, the under-construction market is
73.8% preleased.
Rental rates have increased 2.8% this quarter to $7.47 from $7.24 last quarter but are
less than the $7.70 recorded during the same quarter last year.
Sublease space had been steadily increasing each quarter during the last couple years,
but remained constant at 2.4 million square feet this quarter. The current quarter’s total is still
almost double the square footage from the same quarter a year ago.
Commercial Gateway Member/Broker Comments on the Houston Industrial Market
Tom Lynch, Senior Vice President, Industrial Services and Logistics, CBRE “The Houston
industrial market remains steady with activity, and our vacancy rate has remained low for
almost 10 years, which has allowed a healthy market for development and absorption.
“The oil downturn has softened the industrial product sector that uses manufacturing
buildings but Houston’s population growth has created expansion for consumer service
providers locally. Houston has also emerged as a hub for those products to be
distributed in Austin, San Antonio, the valley and Louisiana.
“The downturn in oil creates a cautious environment for both users and investors for
2015; however, this year we have seen very good activity in both sectors of the industrial
market. As we continue in the year, we will see more large consumer products
transactions on the east side and in the northwest sector.
“We expect more e-commerce distribution in the market. And some will be smaller
satellite facilities to service the large area of Houston; since new product does not exist,
we will see more construction just not at the levels we have experienced for the last four
years.”
Mark G. Nicholas, SIOR, Executive Vice President & Regional Director-Brokerage, JLL
“The Houston Industrial market maintained solid fundamentals in the second quarter
despite headwinds in the overall Houston economy. While some companies are
postponing expansion, the consumer sector -- driven primarily by booming population
growth and consistently high retail demand -- is flourishing. Specifically, the
warehouse/distribution sector is drawing strength from moving and storage, building
supply and third-party logistics (3PL) companies, all with targeted Houston growth
© Copyright 2016 Commercial Gateway, the Commercial Division of the Houston Association of REALTORS ® This information has been compiled from various sources and is provided without guarantee or warranty.
8

plans. Though a few big-box leases dominated headlines, activity in the market is
primarily smaller transactions as 84.0% of deals this quarter were less than 100,000
square feet in size.
“Even with another 1.6 million square feet delivered in the second quarter, bringing the
year-to-date total to nearly 4 million square feet, total vacancy remained unchanged at
5.5 percent, and total availability edged up just 20 basis points quarter-over-quarter to
9.2 percent. This speaks to the high demand for the metro’s industrial sector as local,
national and multinational occupiers make long-term commitments in the Houston
market. The Southeast submarket saw the most completions by far in the second
quarter, recording just under a million square feet of new inventory added which was
67.0 percent preleased. Given the area’s strong distribution channels, the Houston
warehouse market should continue to prosper in the period ahead, especially if
development activity remains disciplined in weaker submarkets.
“Industrial development activity remained at high levels through the second quarter,
concentrated in two of the strongest-performing submarkets. The Northwest and
Southeast together account for 77.8 percent of space currently under construction
across Houston. In the Northwest, owner-users control the pipeline with companies
such as Daikin and FedEx underway on 4.7 million square feet of warehouse/distribution
facilities. In the Southeast market, most projects broke ground speculatively, but are
leasing up fairly quickly due to proximity to and demand from the Port of Houston and
the petrochemical industry along Texas’ Gulf Coast. The only significant non-spec
development Southeast is Katoen Natie’s three-building, 1.4 million-square-foot owner-
occupied project, which will be used for plastics packaging.
“Though the supply-demand spread was less severe at mid-year with the quarter’s
absorption at 912,259 square feet and completions at 1.6 million square feet, a
significant disparity is still seen when reviewing year-to-date totals. Thanks to the volume
of new projects being completed, new supply is likely to continue outpacing net
absorption in 2016, though 2017 and beyond is less certain. Most submarkets remain
landlord favorable for warehouse/distribution, though momentum may begin to swing
towards the tenant if recent weakness in leasing continues.”
Nick Peterson, Vice President, NAI Partners “In the second quarter of 2016, we continue to
see a mixed market depending on which side of the city you are looking. The North and
© Copyright 2016 Commercial Gateway, the Commercial Division of the Houston Association of REALTORS ® This information has been compiled from various sources and is provided without guarantee or warranty.
9

Northwest submarkets remain slow due to the downturn of the oilfield industry, while the
Southeast submarket continues to thrive by the expansion of the petrochemical
industry.
“The North and Northwest submarkets continue to bear the brunt of the downturn and
low oil prices. We are still seeing increased concessions and healthy amounts of free
rent from landlords in both dock-high distribution space and free-standing manufacturing
buildings in these submarkets. Free-standing manufacturing buildings continue to
perform worse than the other product types due to low oil prices, with deals being done
well below quoted asking rates and leased to tenants outside of the oilfield
industry. Dock-high distribution space in these submarkets has performed a little better
through the downturn. However, tenants of buildings 50,000 square feet and up have
been able to secure great deals in some of the new construction that has been sitting
unoccupied for a while.
“The Southeast submarket continues to be the bright spot in Houston with 4.2 million
square feet currently under construction, much of which will soon hit the ground. A
number of these new developments will deliver rail-served buildings, which continues to
be the hottest product type in Houston due largely to the expansion of the petrochemical
industry on the east side. In the second quarter, one tenant alone leased 1 million
square feet of rail-served space from Clay Development. This market will continue to
remain active through the end of the year and into the near future.”
Founded in 2001, Commercial Gateway, the commercial division of the Houston Association of Realtors (HAR), is a commercial information exchange of commercial real estate professionals engaged in every aspect of property sales and leasing, appraisal, property management and counseling.
###
© Copyright 2016 Commercial Gateway, the Commercial Division of the Houston Association of REALTORS ® This information has been compiled from various sources and is provided without guarantee or warranty.
10

Houston-Area Office Market Overview2016 Second Quarter
# of Building Vacant Vacancy Net Abs Net Abs Under Avg Sublease
Bldgs* SF** SF Rate (Current) (YTD) Const Rent*** Avail
A 32 30,812,169 2,676,569 8.7% (163,807) 349,450 1,166,658 $41.04 1,748,934
B 26 9,544,105 2,710,344 28.4% 1,278 (309,066) 0 $30.69 238,848
C 8 552,183 104,447 18.9% (14,557) (15,824) 0 $18.64 0
66 40,908,457 5,491,360 13.4% (177,086) 24,560 1,166,658 $37.74 1,987,782
A 45 14,973,224 1,776,047 11.9% 44,697 70,835 385,274 $31.27 2,126,082
B 52 5,526,983 1,187,235 21.5% (27,457) (27,897) 0 $24.39 676,041
C 6 285,459 39,885 14.0% (20,517) (27,299) 0 $21.14 6,195
103 20,785,666 3,003,167 14.5% (3,277) 15,639 385,274 $27.99 2,808,318
A 26 3,010,145 404,027 13.4% (57,611) 73,369 0 $30.31 91,079
B 23 2,601,481 215,047 8.3% (28,268) 27,611 0 $19.84 1,765
C 1 156,000 25,030 16.0% 6,682 19,277 0 n/a 0
50 5,767,626 644,104 11.2% (79,197) 120,257 0 $26.62 92,844
A 25 5,246,262 2,128,745 40.6% (124,648) (574,103) 0 $25.51 561,908
B 45 4,707,496 1,613,325 34.3% 80,679 94,380 0 $17.17 209,060
C 28 2,121,861 366,882 17.3% 49,773 120,339 0 $11.95 0
98 12,075,619 4,108,952 34.0% 5,804 (359,384) 0 $21.30 770,968A 40 12,219,811 2,021,418 16.5% 2,556 144,371 582,002 $32.14 225,495
B 107 10,472,153 1,238,539 11.8% (1,676) (81,155) 0 $26.22 39,470
C 59 3,859,180 266,079 6.9% (34,359) 64,270 0 $16.48 6,453
206 26,551,144 3,526,036 13.3% (33,479) 127,486 582,002 $28.84 271,418A 60 11,634,312 1,275,145 11.0% 85,046 40,013 201,651 $37.01 372,659
B 89 5,073,362 835,455 16.5% 61,609 30,026 0 $18.29 126,114
C 23 999,077 141,628 14.2% (17,093) (13,624) 0 $12.90 0
172 17,706,751 2,252,228 12.7% 129,562 56,415 201,651 $26.77 498,773
A 3 411,670 7,630 1.9% 0 360,000 0 $25.50 0
B 12 551,716 139,651 25.3% (2,003) (2,212) 0 $15.35 0
C 4 116,022 0 n/a 0 265 0 n/a 0
19 1,079,408 147,281 13.6% (2,003) 358,053 0 $15.94 0A 39 4,726,974 877,660 18.6% 191,606 134,046 0 $29.03 231,824
B 62 5,371,291 1,216,179 22.6% 43,549 43,031 0 $19.74 123,478
C 18 781,787 164,937 21.1% (16,387) (24,423) 0 $17.77 0
119 10,880,052 2,258,776 20.8% 218,768 152,654 0 $22.58 355,302
Energy Corridor Subtotal
Submarket Class
CBD
CBD Subtotal
Energy Corridor
Northwest Subtotal
Fort Bend County
Fort Bend County Subtotal
Greenspoint
Greenspoint Subtotal
Inner Loop
Inner Loop Subtotal
North/The Woodlands/
Conroe
North/The Woodlands/ Conroe Subtotal
Northeast
Northeast Subtotal
Northwest
© Copyright 2016 Commercial Gateway, the Commercial Division of the Houston Association of REALTORS ® This information has been compiled from various sources and is provided without guarantee or warranty.
11

A 17 1,989,497 161,345 8.1% (17,256) 2,122 0 $27.41 37,320B 53 3,554,775 616,784 17.4% 30,466 (127,560) 0 $17.60 20,889
C 42 1,909,863 272,742 14.3% 25,055 25,768 0 $17.89 27610
112 7,454,135 1,050,871 14.1% 38,265 (99,670) 0 $18.59 85,819
A 6 1,879,127 490,277 26.1% (38,194) 4,580 0 $20.48 2,100
B 49 5,053,514 1,043,134 20.6% 28,306 1,572 0 $18.31 45,031
C 71 4,815,908 588,555 12.2% (34,528) (42,863) 0 $13.56 17,700
126 11,748,549 2,121,966 18.1% (44,416) (36,711) 0 $17.89 64,831
A 44 16,991,362 2,500,118 14.7% (46,749) 171,483 1,107,170 $37.01 986,807
B 80 11,063,442 1,286,274 11.6% (111,627) (99,350) 0 $27.64 245,111
C 13 929,110 57,297 6.2% (6,491) (9,934) 0 $19.35 0
137 28,983,914 3,843,689 13.3% (164,867) 62,199 1,107,170 $34.25 1,231,918
A 53 8,799,049 1,438,196 16.3% 50,265 100,440 290,000 $27.63 540,409
B 46 3,820,395 405,205 10.6% (19,439) (19,872) 0 $19.82 20,274
C 33 2,271,435 121,185 5.3% (32,864) (24,533) 0 $16.77 7,541
132 14,890,879 1,964,586 13.2% (2,038) 56,035 290,000 $24.63 568,224
A 34 10,354,083 2,183,991 21.1% (49,005) 251,916 186,000 $35.85 1,132,626
B 50 6,723,066 726,212 10.8% 66,735 233,658 0 $19.62 259,321
C 16 767,856 75,964 9.9% 7,466 562 0 $15.99 0
100 17,845,005 2,986,167 16.7% 25,196 486,136 186,000 $29.93 1,391,947
A 424 123,047,685 17,941,168 14.6% (123,100) 1,128,522 3,918,755 $33.54 8,057,243
B 694 74,063,779 13,233,384 17.9% 122,152 (236,834) 0 $22.00 2,005,402
C 322 19,565,741 2,224,631 11.4% (87,820) 71,981 0 $15.52 65,499
1,440 216,677,205 33,399,183 15.4% (88,768) 963,669 3,918,755 $28.04 10,128,144
* Number of buildings calculated on specific buildings at each property address
**Includes all general-purpose existing office buildings 20,000 square feet or larger
***Rental rates are weighted and averaged based on available space
Houston-Area Total
Southeast
Southeast Subtotal
Southwest
Southwest Subtotal
Uptown
Uptown Subtotal
West
West Subtotal
Westchase
Westchase Subtotal
Houston Area
© Copyright 2016 Commercial Gateway, the Commercial Division of the Houston Association of REALTORS ® This information has been compiled from various sources and is provided without guarantee or warranty.
12

Houston-Area Office Historical Summary2016 Second Quarter
# of Building Vacant SFVacancy
Rate Avail SFNet
Absorption
Period Buildings* SF** Direct Direct Sublease Direct Direct Sublease
2016 Q2 1,440 216,677,205 33,399,183 15.4% 10,128,144 (88,768) $28.04 $24.31
2016 Q1 1,417 214,130,054 30,808,257 14.4% 7,322,911 905,855 $27.72 $22.45
2015 Q4 1,402 212,602,436 29,962,782 14.1% 6,699,931 434,158 $28.64 $23.16
2015 Q3 1,374 209,676,369 28,000,668 13.4% 5,738,477 (264,659) $27.10 $25.40
2015 Q2 1,369 208,482,780 26,722,335 12.8% 4,871,969 1,503,287 $26.57 $28.10
2015 Q1 1,363 206,107,104 25,839,751 12.5% 3,450,693 32,894 $26.30 $29.72
2014 Q4 1,350 202,997,550 23,140,593 11.4% 3,195,204 1,637,837 $25.35 $29.33
2014 Q3 1,343 200,395,315 22,092,765 11.0% 3,042,717 930,055 $25.07 $29.42
2014 Q2 1,334 198,968,426 21,698,869 10.9% 3,127,013 2,301,836 $25.00 $27.94
2014 Q1 1,326 197,226,784 22,003,601 11.2% 2,751,241 1,097,457 $24.83 $26.01
2013 Q4 1,322 196,048,750 22,106,517 11.3% 2,616,113 805,851 $24.26 $27.50
2013 Q3 1,315 194,818,858 22,398,958 11.5% 2,299,752 1,799,437 $24.22 $27.48
2013 Q2 1,302 192,749,407 21,545,583 11.2% 2,034,806 574,091 $23.58 $26.34
2013 Q1 1,297 191,705,036 21,752,678 11.3% 1,703,604 408,040 $23.29 $25.56
2012 Q4 1,298 191,663,838 22,175,972 11.6% 1,654,045 1,133,953 $23.19 $23.05
2012 Q3 1,294 191,145,491 22,695,298 11.9% 1,669,477 437,218 $22.95 $23.71
2012 Q2 1,292 191,318,481 23,155,906 12.1% 1,873,841 1,159,965 $22.77 $24.85
2012 Q1 1,292 191,336,899 23,716,375 12.4% 2,220,466 825,651 $22.75 $25.28
2011 Q4 1,290 191,161,490 25,441,447 13.3% 2,508,155 945,690 $22.90 $25.34
2011 Q3 1,284 190,677,765 26,182,552 13.7% 3,001,909 1,300,872 $22.74 $25.32
2011 Q2 1,283 189,777,320 26,589,601 14.0% 2,748,436 74,580 $22.97 $24.95
2011 Q1 1,281 189,093,168 26,156,145 13.8% 2,793,033 (208,340) $23.23 $24.02
* Number of buildings calculated on specific buildings at each property address
**Includes all general-purpose existing office buildings 20,000 square feet or larger
***Rental rates are weighted and averaged based on available space
Avg Rent***
© Copyright 2016 Commercial Gateway, the Commercial Division of the Houston Association of REALTORS ® This information has been compiled from various sources and is provided without guarantee or warranty.
13

Period Class A Class B Class C All Classes2016 Q2 (123,100) 122,152 (87,820) (88,768)
2016 Q1 1,162,819 (404,313) 147,349 905,855
2015 Q4 773,460 (178,523) (160,779) 434,158
2015 Q3 425,430 (987,754) 297,665 (264,659)
2015 Q2 1,675,438 (208,317) 38,093 1,503,287
2015 Q1 339,553 (489,042) 181,513 32,894
2014 Q4 1,346,578 299,247 (7,988) 1,637,837
2014 Q3 955,886 (125,940) 100,109 930,055
2014 Q2 1,946,038 171,026 185,092 2,301,836
2014 Q1 988,624 159,809 (50,976) 1,097,457
2013 Q4 615,149 270,612 (80,335) 805,851
2013 Q3 1,809,844 76,169 (86,576) 1,799,437
2013 Q2 835,216 (84,770) (176,355) 574,091
2013 Q1 230,615 248,903 (71,478) 408,040
2012 Q4 569,506 649,256 (84,809) 1,133,953
2012 Q3 394,633 18,446 24,139 437,218
2012 Q2 1,065,152 63,081 31,732 1,159,965
2012 Q1 48,249 645,798 131,604 825,651
2011 Q4 792,303 65,449 87,938 945,690
2011 Q3 1,497,234 (232,783) 36,421 1,300,872
2011 Q2 216,347 (130,246) (11,521) 74,580
2011 Q1 194,823 (428,686) 25,523 (208,340)
Houston-Area Office Direct Net Absorption by Class
© Copyright 2016 Commercial Gateway, the Commercial Division of the Houston Association of REALTORS ® This information has been compiled from various sources and is provided without guarantee or warranty.
14

Houston-Area Industrial Market Overview2016 Second Quarter
# of Building Vacant Vacancy Net Abs Net Abs Under Avg Sublease
Submarket Specific Use Bldgs* SF** SF Rate (Current) (YTD) Const Rent*** Avail
Warehouse - Distribution 293 13,884,793 376,613 2.7% 131,672 66,935 0 $7.30 26,500
Manufacturing 28 1,375,273 0 0.0% 0 (1,265) 0 n/a 0
Light Industrial 167 4,277,115 284,034 6.6% 14,308 (34,083) 0 $6.20 0
Flex/R&D 99 2,605,543 190,554 7.3% (6,516) (32,106) 0 $13.96 0
587 22,142,724 851,201 3.8% 139,464 (519) 0 $8.04 26,500
Warehouse - Distribution 337 13,049,854 1,224,284 9.4% 64,456 35,117 223,735 $7.63 0
Manufacturing 66 3,263,944 205,845 6.3% 105,705 162,485 45,653 $5.72 0
Light Industrial 152 3,565,030 326,076 9.2% (33,614) (22,029) 178,113 $8.67 30,203
Flex/R&D 47 1,868,686 319,150 17.1% (1,700) (8,600) 50,000 $15.36 0
602 21,747,514 2,075,355 9.5% 134,847 166,973 497,501 $7.97 30,203
Warehouse - Distribution 715 51,121,033 4,780,253 9.4% 66,517 99,485 857,460 $8.70 439,222
Manufacturing 121 8,640,446 166,920 1.9% 110,553 796,813 34,500 $7.33 122,207
Light Industrial 212 6,850,700 930,408 13.6% (98,935) (187,910) 0 $8.37 114,446
Flex/R&D 95 2,816,607 231,176 8.2% 13,500 (4,017) 0 $6.92 47,663
1,143 69,428,786 6,108,757 8.8% 91,635 704,371 891,960 $8.49 723,538
Warehouse - Distribution 1,357 90,783,166 5,912,167 6.5% 425,567 226,825 869,490 $7.38 636,116
Manufacturing 271 15,723,501 543,003 3.5% (51,265) (35,014) 4,000,000 $8.37 115,835
Light Industrial 528 15,574,718 1,114,235 7.2% (112,953) (235,616) 45,250 $7.69 178,559
Flex/R&D 229 6,817,724 423,876 6.2% (81,240) (141,698) 0 $8.13 43,865
2,385 128,899,109 7,993,281 6.2% 180,109 (185,503) 4,914,740 $7.50 974,375
Warehouse - Distribution 333 18,990,736 917,979 4.8% (150,591) (178,628) 433,000 $5.56 67,001
Manufacturing 61 3,774,168 55,650 1.5% (55,650) 0 80,000 n/a 90,000
Light Industrial 289 5,715,793 353,626 6.2% (74,668) (111,630) 0 $6.30 0
Flex/R&D 54 1,715,237 72,729 4.2% 10,364 7,664 0 $7.32 0
737 30,195,934 1,399,984 4.6% (270,545) (282,594) 513,000 $5.84 157,001
Warehouse - Distribution 838 61,575,830 2,913,068 4.7% (119,508) (228,046) 2,271,497 $5.87 10,400
Manufacturing 143 13,975,211 412,353 3.0% (14,000) 83,970 260,000 $8.15 125,104
Light Industrial 197 4,310,512 525,683 12.2% (10,782) (26,990) 123,853 $7.94 0
Flex/R&D 87 2,264,665 59,542 2.6% 49,090 39,125 154,360 $15.88 0
1,265 82,126,218 3,910,646 4.8% (95,200) (131,941) 2,809,710 $6.45 135,504
Warehouse - Distribution 502 32,870,528 2,039,446 6.2% 447,189 1,069,509 1,123,167 $6.71 169,759
Manufacturing 65 4,322,369 549,229 12.7% (159,013) (206,250) 0 $5.22 65,942
Light Industrial 397 12,088,903 576,572 4.8% 196,010 (22,130) 0 $8.99 114,732
Flex/R&D 187 6,516,023 403,087 6.2% 54,582 4,003 0 $14.03 34,545
1,151 55,797,823 3,568,334 6.4% 538,768 845,132 1,123,167 $7.92 384,978
Inner Loop
Inner Loop Subtotal
North
North Subtotal
Northeast
Northeast Subtotal
Northwest
Northwest Subtotal
Southeast
Southeast Subtotal
Southwest
Southwest Subtotal
South
South Subtotal
© Copyright 2016 Commercial Gateway, the Commercial Division of the Houston Association of REALTORS ® This information has been compiled from various sources and is provided without guarantee or warranty.
15

Warehouse - Distribution 4,375 282,275,940 18,163,810 6.4% 865,302 1,091,197 5,778,349 $7.15 1,348,998
Manufacturing 755 51,074,912 1,933,000 3.8% (63,670) 800,739 4,420,153 $6.93 519,088
Light Industrial 1,942 52,382,771 4,110,634 7.9% (120,634) (640,388) 347,216 $7.87 437,940
Flex/R&D 798 24,604,485 1,700,114 6.9% 38,080 (135,629) 204,360 $11.41 126,073
7,870 410,338,108 25,907,558 6.3% 719,078 1,115,919 10,750,078 $7.47 2,432,099
* Number of buildings calculated on specific buildings at each property address
**Includes all general-purpose existing industrial buildings 10,000 square feet or larger or those within a designated business park
***Rental rates are weighted and averaged based on available space
Houston Area
Houston Area Total
© Copyright 2016 Commercial Gateway, the Commercial Division of the Houston Association of REALTORS ® This information has been compiled from various sources and is provided without guarantee or warranty.
16

Houston-Area Industrial Historical Summary2016 Second Quarter
# of Building Vacant SFVacancy
Rate Avail SFNet
Absorption
Period Buildings* SF** Direct Direct Sublease Direct Direct Sublease
2016 Q2 7,870 410,338,108 25,907,558 6.3% 2,432,099 719,078 $7.47 $6.65
2016 Q1 7,735 409,395,762 24,390,202 6.0% 2,419,894 613,203 $7.24 $6.35
2015 Q4 7,699 409,193,387 25,122,878 6.1% 2,451,206 910,996 $7.53 $5.45
2015 Q3 7,390 408,330,314 22,055,100 5.4% 1,851,334 1,727,837 $7.77 $6.81
2015 Q2 7,373 406,733,847 22,556,765 5.5% 1,765,988 3,442,915 $7.70 $7.40
2015 Q1 7,328 404,331,594 23,739,391 5.9% 1,628,464 1,032,430 $7.69 $7.31
2014 Q4 7,270 402,340,623 24,046,963 6.0% 1,517,554 3,213,995 $7.57 $6.92
2014 Q3 7,228 398,681,656 25,056,140 6.3% 1,378,661 1,813,560 $7.35 $6.84
2014 Q2 7,187 396,122,547 24,981,919 6.3% 1,484,062 1,576,570 $7.13 $6.81
2014 Q1 7,159 393,062,413 25,116,791 6.4% 1,363,465 2,073,135 $6.67 $6.26
2013 Q4 7,133 391,610,966 27,276,720 7.0% 2,003,230 3,137,471 $6.52 $6.06
2013 Q3 7,104 389,103,121 28,472,022 7.3% 2,310,894 1,404,630 $6.35 $5.78
2013 Q2 7,066 385,631,494 27,238,411 7.1% 2,205,071 1,412,501 $6.34 $5.32
2013 Q1 7,040 383,286,989 27,471,495 7.2% 1,717,698 1,320,799 $5.97 $5.53
2012 Q4 7,005 381,345,270 26,037,436 6.8% 1,745,173 2,250,701 $5.90 $5.14
2012 Q3 6,987 379,947,218 27,805,629 7.3% 1,705,302 1,300,505 $5.75 $5.73
2012 Q2 6,969 379,248,101 28,740,118 7.6% 1,713,664 1,566,279 $5.67 $5.65
2012 Q1 6,956 378,618,201 28,913,229 7.6% 1,977,300 1,596,121 $5.60 $5.08
2011 Q4 6,933 376,636,869 29,183,000 7.7% 1,970,315 2,231,354 $5.51 $5.58
2011 Q3 6,917 375,464,400 30,418,034 8.1% 2,130,635 1,614,384 $5.48 $6.41
2011 Q2 6,906 375,221,383 32,388,501 8.6% 2,125,422 76,885 $5.54 $5.51
2011 Q1 6,843 372,328,597 31,619,559 8.5% 2,044,721 342,142 $5.51 $5.37
* Number of buildings calculated on specific buildings at each property address
***Rental rates are weighted and averaged based on available space
Avg Rent***
**Includes all general-purpose existing industrial buildings 10,000 square feet or larger or those within a designated business park
© Copyright 2016 Commercial Gateway, the Commercial Division of the Houston Association of REALTORS ® This information has been compiled from various sources and is provided without guarantee or warranty.
17

Period Flex/R&D Light Industrial ManufacturingWarehouse-Distribution All Types
2016 Q2 38,080 (120,634) (63,670) 865,302 719,078
2016 Q1 (231,785) (505,482) 901,614 464,634 628,981
2015 Q4 (130,139) (93,964) 72,183 1,000,415 848,495
2015 Q3 (10,736) 109,791 78,674 1,550,108 1,727,837
2015 Q2 117,699 217,791 247,275 2,860,150 3,442,915
2015 Q1 385,258 (15,037) 188,910 473,299 1,032,430
2014 Q4 6,239 452,754 (143,098) 2,898,100 3,213,995
2014 Q3 30,950 89,523 408,958 1,284,129 1,813,560
2014 Q2 (6,166) 188,931 207,922 1,185,883 1,576,570
2014 Q1 47,194 167,799 454,750 1,403,392 2,073,135
2013 Q4 (4,830) (197,956) 51,980 3,288,277 3,137,471
2013 Q3 52,871 176,250 65,704 1,109,805 1,404,630
2013 Q2 (157,790) (8,137) (63,405) 1,641,833 1,412,501
2013 Q1 7,293 79,562 294,045 939,899 1,320,799
2012 Q4 33,839 144,932 268,394 1,803,536 2,250,701
2012 Q3 (192,880) 336,660 105,257 1,051,468 1,300,505
2012 Q2 (138,262) 156,070 44,180 1,504,291 1,566,279
2012 Q1 59,798 (67,480) 301,350 1,302,453 1,596,121
2011 Q4 (161,071) (55,481) 537,804 1,910,102 2,231,354
2011 Q3 1,150 (148,928) 90,211 1,671,951 1,614,384
2011 Q2 (97,335) (250,220) 29,313 395,127 76,885
2011 Q1 150,600 127,959 (46,076) 109,659 342,142
Houston-Area Industrial Direct Net Absorption by Type
© Copyright 2016 Commercial Gateway, the Commercial Division of the Houston Association of REALTORS ® This information has been compiled from various sources and is provided without guarantee or warranty.
18

Quarterly Market Overview 2016 First Quarter FOR IMMEDIATE RELEASE
For more information, please contact: David Mendel, Public Relations Manager Phone: 713.629.1900 ext. 258 E‐mail: [email protected]
HOUSTON’S FIRST-QUARTER COMMERCIAL ACTIVITY
CONTINUES TO SLOW AMID ECONOMIC DOWNTURN
HOUSTON — (May 18, 2016) — Houston’s commercial real estate market appears to
be weathering the storms -- both the rains and sublease ones -- despite slower leasing activity
as the economic downturn continues. That’s according to quarterly market research compiled by
Commercial Gateway, the commercial division of the Houston Association of Realtors.
The first quarter reported direct positive net absorption of more than 1.0 million square
feet of office space, comparing favorably to the same quarter last year of 676,602 square feet
and double the average quarterly direct absorption recorded during all of 2015. However, the
statistics would paint a different picture without the move-ins by local firms into their build-to-
suit, single-tenant office buildings, which represented almost 1.5 million square feet. As in
previous years, Class A properties represent the bulk of the growth, offset by Class B’s negative
absorption and Class properties reporting 146,952 square feet of positive absorption to start the
year.
Specifically, keeping the direct absorption positive during the first quarter primarily
results from FMC moving into its new building at Generation Park, National Oilwell Varco
occupying the company’s new 441,000-square-foot Millennium Tower II in Westchase, Nalco
Champion occupying its new 133,000-square-foot expansion building in Sugar Land, and
Hilcorp completing a move into its namesake Energy Tower in the Central Business District.
Rounding out the larger absorption recorded this quarter is Stage Store’s occupation of the
company’s new 168,000-square-foot offices at 2425 W Loop S. On the negative side, Hilcorp
left behind about 145,000 square feet in the Central Business District and BMC Software
consolidated offices in CityWest, leaving behind in excess of 200,000 square feet.
For the quarter, nine of the 13 submarkets recorded positive absorption, with four of the
submarkets recording more than 200,000 square feet each. At the top of the list is the
Westchase market, which recorded 460,249 square feet of net absorption, primarily due to the
National Oilwell Varco move in. Coming in second is the smallest market area, the Northeast,

which contributed 360,056 square feet, also primarily due to one company, FMC Technologies,
occupying their new building. The Greenspoint submarket recorded the largest negative
absorption, a negative 280,151 square feet for the quarter, due to space left behind by
ExxonMobil and Noble Energy and now available.
The changing economy related to the energy downturn is also shown by the increasing
amounts of sublease space on the market. About a million square feet has been added each
quarter during the last 12 months, and the numbers keep climbing, with estimates ranging in the
9 to 10 million square-foot range. At the end of the first quarter, the Houston market recorded
7.2 million square feet of sublease space available and being marketed. Of that total, 5.4 million,
or 75%, is Class A space. This total represents almost double the sublease space available
during the same time last year.
For the quarter, four new buildings were completed, adding almost 1.5 million square
feet to the market. All four were either single-tenant or owner-occupied so no new available
space entered the market.
Construction starts halted for the most part during the first quarter, with only office
buildings in mixed-use projects breaking ground. Overall, the Houston under-construction office
market has 23 properties totaling 6.5 million square feet. Collectively, the under-construction
buildings are about 40% preleased, with 20 properties classified as multi-tenant. The multi-
tenant properties represent almost 4.8 million square feet or 72.9% of the under-construction
total and are currently reporting 56.5% preleased space. Of the multi-tenant spec properties,
three of the 20 are reported 90% or more available.
The largest project under construction is Phillips 66’s 1.2 million-square-foot campus in
the Westchase area. The largest spec building under construction with the largest availability
remains Hines’ 609 Main at Texas building, which did recently announce a 225,000-square-foot
prelease to United Airlines to add to the 62,000-square-foot one reported earlier.
The current 14.2% direct vacancy rate is slightly up from the 13.3% vacancy recorded
last quarter, and also up from the 12.5% recorded during the same quarter in 2015. Only one
submarket, Fort Bend County, at 9.4%, reports a vacancy lower than double digit. Class A
space overall is 12.3% vacant, and only four submarkets report vacancy rates under 10%.
Rental rates represented a 5.3% increase during the past year with the current overall
averaged weighted rental rate of $27.70, down from last quarter’s $28.64. Class A rates, now at

$33.40 citywide and at $41.01 in the CBD, experienced slight decreases from last quarter but
still higher than the same quarter in 2015. Sublease space overall is continuing to increase
along with the rental rates; the current average of $24.75 shows a 7.9% increase from last
quarter. During the past year, the average sublease rate dropped 16.7%.
Commercial Gateway Member/Broker Comments on the Houston Office Market
Mario A. Arriaga, First Group “The commercial market continues to hold its own in the early
months of 2016, with positive absorption recorded in both the office and industrial
sectors. Much of the office growth resulted from preleasing in buildings completed and
occupied during the first quarter, including FMC Technologies, both office and industrial,
National Oilwell Varco in Westchase, and Nalco Champion’s expansion in Sugar
Land. Those three office buildings alone accounted for over 1.0 million square feet of
positive absorption, and those deals all happened prior to 2015.
“Although job cuts within the oil industry continue to be announced, the Greater
Houston Partnership is predicting slightly positive job growth this year. Reports are that
layoffs that happened in the early months of the year will most likely take until the fall to
return to the previous employment peak. The GHP report noted that last year, Houston
didn’t recoup its early-year losses until November.
“Growth is slowing, and sublease space in both office and industrial is increasing. Retail
is still strong with a few fallouts while the multi-family market is experiencing some
oversupply. Land brokers are still busy, and the residential single-family market is doing
well. The continued population growth has supported several sectors of the market,
including new retail and medical facilities.
“I am cautiously optimistic. Houston remains a strong, robust city with a diversified
economy that will rebound to show slow but continual growth in the real estate sectors.”
Elizabeth G. LeDoux, Associate, Colliers International “Due to the decline in oil, the Houston
office market has become a rather dynamic environment as it has shifted to a tenant’s
market. A few variables are playing into this shift. First, there is a large amount of
sublease space available, and some of the space has five or more years left on the term,
which makes it a direct competitor to the direct space available throughout the city. It is
important to note that much of the sublease space available is in full floor plates.
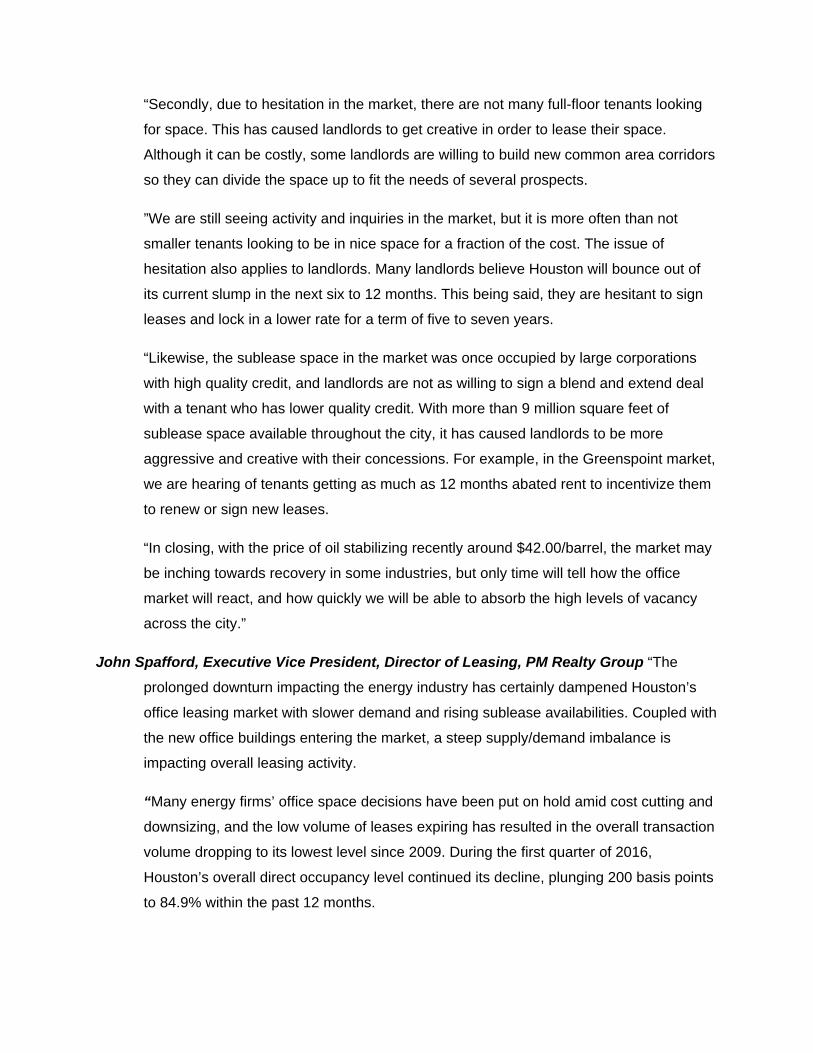
“Secondly, due to hesitation in the market, there are not many full-floor tenants looking
for space. This has caused landlords to get creative in order to lease their space.
Although it can be costly, some landlords are willing to build new common area corridors
so they can divide the space up to fit the needs of several prospects.
”We are still seeing activity and inquiries in the market, but it is more often than not
smaller tenants looking to be in nice space for a fraction of the cost. The issue of
hesitation also applies to landlords. Many landlords believe Houston will bounce out of
its current slump in the next six to 12 months. This being said, they are hesitant to sign
leases and lock in a lower rate for a term of five to seven years.
“Likewise, the sublease space in the market was once occupied by large corporations
with high quality credit, and landlords are not as willing to sign a blend and extend deal
with a tenant who has lower quality credit. With more than 9 million square feet of
sublease space available throughout the city, it has caused landlords to be more
aggressive and creative with their concessions. For example, in the Greenspoint market,
we are hearing of tenants getting as much as 12 months abated rent to incentivize them
to renew or sign new leases.
“In closing, with the price of oil stabilizing recently around $42.00/barrel, the market may
be inching towards recovery in some industries, but only time will tell how the office
market will react, and how quickly we will be able to absorb the high levels of vacancy
across the city.”
John Spafford, Executive Vice President, Director of Leasing, PM Realty Group “The
prolonged downturn impacting the energy industry has certainly dampened Houston’s
office leasing market with slower demand and rising sublease availabilities. Coupled with
the new office buildings entering the market, a steep supply/demand imbalance is
impacting overall leasing activity.
“Many energy firms’ office space decisions have been put on hold amid cost cutting and
downsizing, and the low volume of leases expiring has resulted in the overall transaction
volume dropping to its lowest level since 2009. During the first quarter of 2016,
Houston’s overall direct occupancy level continued its decline, plunging 200 basis points
to 84.9% within the past 12 months.
“Within the competitive leasing market, developers completed 5 new office buildings
during the quarter totaling 835,779 square feet and delivered just over 7.3 million square
feet of new office construction within the past 12 months (excluding corporate-owned
projects). Within the energy sector, sublease availability has risen by 3.1 million square
feet to nearly 9.3 million square feet since early 2015 as many companies are placing
underutilized space on the market that was created by workforce reductions or space
that was originally tied up for future expansion. Consequently, total space availability has
significantly increased by 5.7 million square feet within the past 12 months due to added
sublease inventory and newly delivered office space.
“Houston office leasing market fundamentals are expected to remain soft in the year
ahead as the continuing trend of consolidation and space optimization by office users
and the completion of remaining office projects under construction will add downward
pressure on occupancy levels in 2016. The supply of sublease space will remain a
concern with potential additional sublease space hitting the market during the first-half of
2016 due to looming bankruptcies and merger and acquisition activity; many of which
have been announced recently.
“The key areas for office property owners to focus on during these challenging times will
be the careful evaluation of near-term rollover and the retention of value by securing
early lease renewals and/or extensions to combat potential increased vacancies. Even
though office-using job growth is expected to return in 2017, future leasing demand from
the energy sector will likely remain suppressed as there will be an abundance of
sublease and shadow space that can be absorbed before tenants will absorb additional
space.”
Houston Industrial Market
Houston’s industrial market continued to expand with positive direct net absorption of
723,030 square feet during the first quarter despite manufacturing slowdowns and overall
economic uncertainty, according to statistics released by Commercial Gateway.
This quarter’s absorption represents the 25th consecutive quarter – over six years – of
positive absorption, with seven quarters recording more than 2 million square feet each. The
first quarter’s net absorption clearly represents a slowdown, although slightly lower than last
quarter’s 792,552 square feet, but considerable lower than the previous years.

In addition to the most recent announcement that IKEA is looking to build up to a million
square foot distribution facility, several other major announcements for large build-to-suits and
speculative projects have resulted in several large deals recorded during 2016, which included
Advance Auto Parts’ 441,000-square-foot lease in Beltway Crossing Northwest, Plastic Express’
394,489-square-foot lease in Port 225 among two build-to-suits in Beltway Southwest:
Maintenance Supply’s 209,000-square-foot building and Homelegance’s 175,000-square-foot
building.
Activity is slowing for some product in some areas, but due to several build-to-suits
coming online, the vacancy rate decreased to 5.9%, compared to 6.2% the previous quarter.
Vacancy for warehouse/distribution space citywide is 6.1% with manufacturing space at a low of
3.1%.
More than 1.9 million square feet in 17 buildings came online during the first quarter,
with the largest being Aldi’s 650,000-square foot project in the Southwest and FMC’s project in
the Northeast. The five largest multi-tenant buildings completed this quarter are divided
between Gateway Southwest Business Park and Beltway Southwest Industrial Park, both in the
Southwest, and Interstate Commerce Center in the north. Collectively, all industrial buildings
completed this year entered the market 46.9% leased.
Construction activity is still high with many projects underway and many other proposed
properties announced. Currently, 64 buildings representing almost 10.1 million square feet are
underway. The two largest BTS projects are Daiken’s 4 million square foot facility off Highway
290 and FedEx’s new 800,000-square-foot project near the Grand Parkway in the Northwest.
Rental rates have taken a slight drop this quarter to $7.25 from $7.54 last quarter and
are less than the $7.69 recorded during the same quarter last year.
Sublease space had been steadily increasing throughout last year, but remained
constant at 2.4 million square feet. The current quarter’s total is an increase of 48.6% from the
same quarter a year ago, and is starting to rival the larger square footage totals in 2013 and
back through 2010.
Commercial Gateway Member/Broker Comments on the Houston Industrial Market
Travis Land, SIOR, Partner, NAI Partners “The industrial market trends for first quarter are
continuing into the second quarter, with vacancies and availabilities increasing in all

submarkets except the Southeast. This has been happening since third quarter of last
year.
“The Southeast area boasts the majority of deals and increased activity, but we will
continue to see non energy-related large distribution firms sporadically take advantage
of the softer submarkets and sign leases there. Overall rental rents are also softening in
most submarkets, and they will continue to decrease with greater incentives provided
throughout the year.”
Mark G. Nicholas, SIOR, Executive Vice President Regional Director-Brokerage, JLL
Houston “I am seeing a lot of industrial properties coming on the market during the first
part of the year, especially manufacturing facilities. These properties range in various
sizes, with a majority on the market because of company mergers, consolidations and
even bankruptcies. Because of the volume, properties must be priced right in order to
move; manufacturing has slowed down, and the demand is just not there.
“My team is still very busy with land deals in many areas of the city. Land is still moving
to both users and developers alike, and pricing is steady. Many users are looking for
shovel-ready sites so they can just come in and build what they need quickly and not
have to wait for infrastructure like streets, utilities, and detention ponds to be created.
“Houston’s industrial market remains very active, with major deals completed due to the
diversity of the economy. Specific areas and product -- such as North Houston’s
distribution, institutional properties -- are overbuilt, but the overall market is not yet
overbuilt. New projects, many build-to-suit, are on the drawing boards or under
construction now. But there are quite a few free-standing buildings available where
landlords did not acquire or leave enough excess land for employee parking or to
accommodate outside storage requirements, etc.; so those may take a while.”
Founded in 2001, Commercial Gateway, the commercial division of the Houston Association of Realtors (HAR), is a commercial information exchange of commercial real estate professionals engaged in every aspect of property sales and leasing, appraisal, property management and counseling.
###

Houston-Area Office Market Summary2016 First Quarter
# of Building Vacant Vacancy Net Abs Net Abs Under Avg Sublease
Buildings SF SF Rate (Current) (YTD)Constructio
n Rent Avail
A 32 30,812,169 2,512,762 8.2% 513,257 513,257 1,166,658 $41.01 1,442,246
B 26 9,544,105 2,711,622 28.4% (310,344) (310,344) 0 $28.22 245,360
C 9 648,066 102,393 15.8% (1,664) (1,664) 0 $18.86 1,427
67 41,004,340 5,326,777 13.0% 201,249 201,249 1,166,658 $36.88 1,689,033
A 43 14,136,723 1,258,544 8.9% 63,941 63,941 1,514,801 $33.93 933,797
B 51 5,456,424 1,159,778 21.3% (440) (440) 0 $21.26 725,658
C 6 285,459 19,368 6.8% (6,782) (6,782) 0 $24.60 6,195
100 19,878,606 2,437,690 12.3% 56,719 56,719 1,514,801 $27.49 1,665,650
A 27 3,127,893 351,549 11.2% 129,713 129,713 0 $28.09 147,091
B 22 2,573,287 164,379 6.4% 2,489 2,489 22,400 $21.50 1,765
C 1 156,000 31,712 20.3% 12,595 12,595 0 n/a 0
50 5,857,180 547,640 9.4% 144,797 144,797 22,400 $26.50 148,856
A 26 5,392,889 1,890,805 35.1% (364,418) (364,418) 0 $25.62 137,873
B 43 4,502,946 1,694,004 37.6% 13,701 13,701 0 $17.84 73,432
C 27 2,112,615 416,549 19.7% 70,566 70,566 0 $11.92 0
96 12,008,450 4,001,358 33.3% (280,151) (280,151) 0 $21.60 211,305A 39 11,449,433 1,744,042 15.2% 150,782 150,782 575,316 $32.63 210,764
B 104 10,993,034 1,270,942 11.6% (88,446) (88,446) 28,000 $26.41 35,745
C 60 3,870,274 235,080 6.1% 95,269 95,269 0 $16.44 6,753
203 26,312,741 3,250,064 12.4% 157,605 157,605 603,316 $28.92 253,262
Fort Bend County
Fort Bend County Subtotal
Greenspoint
Greenspoint Subtotal
Inner Loop
Inner Loop Subtotal
Energy Corridor Subtotal
Submarket Class
CBD
CBD Subtotal
Energy Corridor
© Copyright 2016 Commercial Gateway, the Commercial Division of the Houston Association of REALTORS ® This information has been compiled from various sources and is provided without guarantee or warranty.

A 59 11,930,130 1,040,138 8.7% (45,033) (45,033) 201,651 $35.28 387,295
B 79 4,868,567 884,470 18.2% (18,986) (18,986) 0 $18.32 115,079
C 24 1,040,105 126,260 12.1% 1,793 1,793 0 $13.06 0
162 17,838,802 2,050,868 11.5% (62,226) (62,226) 201,651 $27.17 502,374
A 3 411,670 7,630 1.9% 360,000 360,000 0 $25.50 0
B 10 539,796 137,648 25.5% (209) (209) 0 $15.32 0
C 4 116,022 0 n/a 265 265 0 n/a 0
17 1,067,488 145,278 13.6% 360,056 360,056 0 $15.92 0A 39 4,680,429 1,019,668 21.8% (61,071) (61,071) 0 $28.11 165,340
B 56 5,279,692 1,250,740 23.7% 2,952 2,952 0 $19.28 121,605
C 19 862,012 157,365 18.3% (14,761) (14,761) 0 $18.38 0
114 10,822,133 2,427,773 22.4% (72,880) (72,880) 0 $22.16 286,945
A 17 1,997,376 144,089 7.2% 19,378 19,378 0 $28.47 37,320
B 54 3,693,569 632,250 17.1% (158,026) (158,026) 28,500 $17.87 18,000
C 43 1,952,285 312,797 16.0% 713 713 0 $18.00 27,610
114 7,643,230 1,089,136 14.3% (137,935) (137,935) 28,500 $19.03 82,930A 6 1,889,547 452,083 23.9% 42,774 42,774 0 $21.04 2,100
B 45 5,157,288 1,075,932 20.9% (26,734) (26,734) 0 $18.24 43,274
C 72 4,888,175 554,027 11.3% (8,335) (8,335) 0 $13.48 17,700
123 11,935,010 2,082,042 17.4% 7,705 7,705 0 $18.14 63,074A 42 16,832,547 2,290,670 13.6% 215,572 215,572 1,272,316 $36.22 738,933
B 79 10,856,136 1,166,684 10.8% 14,937 14,937 75,000 $27.83 251,122
C 13 929,110 50,806 5.5% (3,443) (3,443) 0 $21.88 0
134 28,617,793 3,508,160 12.3% 227,066 227,066 1,347,316 $34.20 990,055A 52 9,222,428 1,326,967 14.4% (47,742) (47,742) 364,295 $27.24 353,772
B 45 3,741,845 411,124 11.0% (433) (433) 0 $19.24 56,989
C 34 2,349,985 88,321 3.8% 8,331 8,331 0 $14.15 10,059
131 15,314,258 1,826,412 11.9% (39,844) (39,844) 364,295 $23.89 420,820A 35 9,499,660 1,054,562 11.1% 302,618 302,618 1,286,000 $35.56 797,344
Southeast
Southeast Subtotal
Southwest
Southwest Subtotal
Uptown
Uptown Subtotal
West
West Subtotal
Westchase
Northwest Subtotal
North/The Woodlands/Conroe
North/The Woodlands/ Conroe Subtotal
Northeast
Northeast Subtotal
Northwest
© Copyright 2016 Commercial Gateway, the Commercial Division of the Houston Association of REALTORS ® This information has been compiled from various sources and is provided without guarantee or warranty.

B 46 6,465,475 761,557 11.8% 165,226 165,226 0 $19.59 49,519
C 16 807,728 87,812 10.9% (7,595) (7,595) 0 $17.44 0
97 16,772,863 1,903,931 11.4% 460,249 460,249 1,286,000 $29.83 846,863A 420 121,382,894 15,093,509 12.4% 1,279,771 1,279,771 6,381,037 $33.40 5,353,875
B 660 73,672,164 13,321,130 18.1% (404,313) (404,313) 125,400 $21.45 1,737,548
C 328 20,017,836 2,182,490 10.9% 146,952 146,952 0 $15.63 69,744
1,408 215,072,894 30,597,129 14.2% 1,022,410 1,022,410 6,506,437 $27.70 7,161,167Houston Area Total
Westchase Subtotal
Houston Area
© Copyright 2016 Commercial Gateway, the Commercial Division of the Houston Association of REALTORS ®This information has been compiled from various sources and is provided without guarantee or warranty.
* Number of buildings calculated on specific buildings at each property address.** Includes all general-purpose existing office buildings 20,000 square feet or larger. *** Rental rates are weighted and averaged based on available space.

Houston-Area Office Historical Summary2016 First Quarter
# of Building Vacant SFVacancy
Rate Avail SFNet
Absorption
Period Buildings SF Direct Direct Sublease Direct Direct Sublease
2016 Q1 1,408 215,072,894 30,597,129 14.2% 7,322,911 1,022,410 $27.70 $24.75
2015 Q4 1,393 213,345,701 29,948,651 14.0% 6,699,931 109,803 $28.64 $22.94
2015 Q3 1,377 210,519,092 27,998,664 13.3% 5,738,477 (264,934) $27.10 $25.40
2015 Q2 1,372 209,325,503 26,720,056 12.8% 4,871,969 1,523,614 $26.57 $28.10
2015 Q1 1,366 206,949,827 25,857,799 12.5% 3,450,693 676,602 $26.30 $29.72
2014 Q4 1,352 203,201,000 23,162,349 11.4% 3,195,204 1,724,240 $25.35 $29.33
2014 Q3 1,345 200,595,877 22,114,124 11.0% 3,042,717 927,210 $25.07 $29.42
2014 Q2 1,336 199,168,988 21,717,383 10.9% 3,127,013 2,305,477 $25.00 $27.94
2014 Q1 1,328 197,427,346 22,025,756 11.2% 2,751,241 1,096,846 $24.83 $26.01
2013 Q4 1,324 196,237,340 22,128,061 11.3% 2,616,113 803,945 $24.25 $27.50
2013 Q3 1,317 195,007,448 22,418,596 11.5% 2,299,752 1,795,906 $24.21 $27.48
2013 Q2 1,304 192,937,997 21,561,690 11.2% 2,034,806 569,668 $23.58 $26.34
2013 Q1 1,299 191,877,529 21,764,362 11.3% 1,703,604 407,220 $23.29 $25.56
2012 Q4 1,300 191,836,331 22,186,836 11.6% 1,654,045 1,130,314 $23.19 $23.05
2012 Q3 1,296 191,317,984 22,702,523 11.9% 1,669,477 454,212 $22.95 $23.71
2012 Q2 1,294 191,490,974 23,180,125 12.1% 1,873,841 1,160,667 $22.76 $24.85
2012 Q1 1,294 191,509,392 23,741,296 12.4% 2,220,466 823,036 $22.75 $25.28
2011 Q4 1,292 191,333,983 25,463,753 13.3% 2,508,155 942,031 $22.90 $25.34
2011 Q3 1,286 190,850,258 26,201,199 13.7% 3,001,909 1,311,958 $22.74 $25.32
2011 Q2 1,285 189,949,813 26,619,334 14.0% 2,748,436 78,544 $22.97 $24.95
2011 Q1 1,283 189,265,661 26,189,842 13.8% 2,793,033 (208,556) $23.23 $24.02
Avg Rent
© Copyright 2016 Commercial Gateway, the Commercial Division of the Houston Association of REALTORS ® This information has been compiled from various sources and is provided without guarantee or warranty.

Period Class A Class B Class C All Classes
2016 Q1 1,279,771 (404,313) 146,952 1,022,410
2015 Q4 442,771 (178,437) (154,531) 109,803
2015 Q3 425,430 (987,754) 297,390 (264,934)
2015 Q2 1,693,588 (208,317) 40,270 1,523,614
2015 Q1 980,697 (489,042) 184,077 676,602
2014 Q4 1,427,302 299,247 (2,309) 1,724,240
2014 Q3 955,886 (125,940) 97,264 927,210
2014 Q2 1,948,587 171,026 186,184 2,305,477
2014 Q1 987,099 159,809 (50,062) 1,096,846
2013 Q4 615,149 270,612 (82,241) 803,945
2013 Q3 1,809,844 76,169 (90,107) 1,795,906
2013 Q2 836,376 (84,770) (181,938) 569,668
2013 Q1 229,455 248,903 (71,138) 407,220
2012 Q4 566,957 649,256 (85,899) 1,130,314
2012 Q3 405,430 18,446 30,336 454,212
2012 Q2 1,066,677 63,081 30,909 1,160,667
2012 Q1 43,439 645,798 133,799 823,036
2011 Q4 793,753 65,449 82,829 942,031
2011 Q3 1,509,485 (232,783) 35,256 1,311,958
2011 Q2 218,266 (130,246) (9,476) 78,544
2011 Q1 195,659 (428,686) 24,471 (208,556)
TX - Houston Area Office Direct Net Absorption By Class
© Copyright 2016 Commercial Gateway, the Commercial Division of the Houston Association of REALTORS ® This information has been compiled from various sources and is provided without guarantee or warranty.

Houston-Area Industrial Market Summary2016 First Quarter
# of Building Vacant Vacancy Net Abs Net Abs Under Avg Sublease
Submarket Specific Use Buildings SF SF Rate (Current) (YTD) Construction Rent Avail
Warehouse - Distribution 304 14,056,120 502,839 3.58% (53,799) (53,799) 0 $5.60 26,500Manufacturing 28 1,617,380 46,946 2.90% (1,265) (1,265) 0 $10.08 0Light Industrial 148 3,923,839 207,559 5.29% (48,391) (48,391) 0 $7.71 0
Flex/R&D 104 2,817,785 245,646 8.72% (17,190) (17,190) 0 $9.47 0
584 22,415,124 1,002,990 4.47% (120,645) (120,645) 0 $7.99 26,500
Warehouse - Distribution 356 14,178,553 1,020,134 7.19% (54,295) (54,295) 223,735 $8.08 0
Manufacturing 64 3,194,044 249,750 7.82% 14,280 14,280 45,653 $8.16 0
Light Industrial 114 2,910,861 252,269 8.67% 11,585 11,585 11,875 $9.36 30,203
Flex/R&D 51 1,956,335 317,450 16.23% (6,900) (6,900) 111,800 $16.59 4,245
585 22,239,793 1,839,603 8.27% (35,330) (35,330) 393,063 $8.73 34,448
Warehouse - Distribution 742 51,458,854 4,881,114 9.49% (126,186) (126,186) 977,580 $6.67 495,814
Manufacturing 122 8,102,665 247,043 3.05% 686,260 686,260 34,500 $6.95 122,207
Light Industrial 146 5,839,898 818,410 14.01% (91,668) (91,668) 12,000 $8.55 123,440
Flex/R&D 90 2,921,877 238,866 8.18% (47,675) (47,675) 0 $6.87 47,663
1,100 68,323,294 6,185,433 9.05% 420,731 420,731 1,024,080 $7.00 789,124
Warehouse - Distribution 1,407 93,011,166 6,114,663 6.57% 167,509 167,509 979,730 $7.68 682,937
Manufacturing 280 17,159,606 419,088 2.44% 97,446 97,446 4,000,000 $8.63 115,835
Light Industrial 347 13,443,776 825,413 6.14% (59,796) (59,796) 210,629 $8.75 132,516
Flex/R&D 188 6,154,593 239,542 3.89% (50,256) (50,256) 40,375 $8.35 14,664
2,222 129,769,141 7,598,706 5.86% 154,903 154,903 5,230,734 $7.93 945,952
Warehouse - Distribution 349 19,969,850 748,568 3.75% (83,575) (83,575) 208,000 $5.73 67,001
Manufacturing 62 4,931,485 0 0.00% 55,650 55,650 0 n/a 90,000
Light Industrial 245 5,305,328 257,651 4.86% (34,961) (34,961) 0 $6.37 0
Flex/R&D 50 1,819,583 47,067 2.59% (31,597) (31,597) 0 n/a 0
Inner Loop
Inner Loop Subtotal
North
North Subtotal
Northeast
Northeast Subtotal
Northwest
Northwest Subtotal
South

706 32,026,246 1,053,286 3.29% (94,483) (94,483) 208,000 $5.94 157,001
Warehouse - Distribution 856 62,412,612 2,242,536 3.59% (130,888) (130,888) 1,824,880 $6.01 10,400
Manufacturing 144 14,124,016 433,103 3.07% 49,324 49,324 0 $8.15 125,104
Light Industrial 159 3,777,697 535,367 14.17% (2,753) (2,753) 197,703 $8.20 0
Flex/R&D 87 2,010,542 75,176 3.74% (8,205) (8,205) 25,000 $12.55 0
1,246 82,324,867 3,286,182 3.99% (92,522) (92,522) 2,047,583 $6.78 135,504
Warehouse - Distribution 505 33,249,731 2,065,141 6.21% 808,910 808,910 1,137,595 $6.39 49,958
Manufacturing 63 4,229,295 278,616 6.59% (27,709) (27,709) 0 $5.10 65,942
Light Industrial 350 12,937,676 751,918 5.81% (215,669) (215,669) 15,000 $7.75 193,420
Flex/R&D 187 6,520,379 388,775 5.96% (75,156) (75,156) 0 $13.28 22,045
1,105 56,937,081 3,484,450 6.12% 490,376 490,376 1,152,595 $7.03 331,365
Warehouse - Distribution 4,519 288,336,886 17,574,995 6.10% 527,676 527,676 5,351,520 $6.74 1,332,610
Manufacturing 763 53,358,491 1,674,546 3.14% 873,986 873,986 4,080,153 $7.24 519,088
Light Industrial 1,509 48,139,075 3,648,587 7.58% (441,653) (441,653) 447,207 $8.21 479,579
Flex/R&D 757 24,201,094 1,552,522 6.42% (236,979) (236,979) 177,175 $10.62 88,617
7,548 414,035,546 24,450,650 5.91% 723,030 723,030 10,056,055 $7.26 2,419,894
Houston Area
Houston Area Total
Southeast
Southeast Subtotal
Southwest
Southwest Subtotal
South Subtotal
* Number of buildings calculated on specific buildings at each property address.** Includes all general-purpose existing industrial buildings 10,000 square feet or larger.*** Rental rates are weighted and averaged based on available space.

Houston-Area Industrial Historical Summary2016 First Quarter
# of Building Vacant SFVacancy
Rate Avail SFNet
Absorption
Period Buildings SF Direct Direct Sublease Direct Direct Sublease
2016 Q1 7,548 414,035,546 24,450,650 5.90% 2,419,894 723,030 $7.25 $6.15
2015 Q4 7,558 409,236,392 25,184,304 6.20% 2,451,206 792,552 $7.54 $5.45
2015 Q3 7,408 410,844,492 22,083,342 5.40% 1,851,334 1,727,156 $7.77 $6.81
2015 Q2 7,391 409,246,393 22,582,726 5.50% 1,765,988 3,446,915 $7.70 $7.40
2015 Q1 7,345 406,604,989 23,751,852 5.80% 1,628,464 1,124,814 $7.69 $7.31
2014 Q4 7,285 404,134,409 24,266,864 6.00% 1,517,554 3,233,664 $7.58 $6.92
2014 Q3 7,243 400,258,002 25,078,270 6.30% 1,378,661 1,808,363 $7.35 $6.84
2014 Q2 7,202 397,698,893 24,998,852 6.30% 1,484,062 1,778,183 $7.14 $6.81
2014 Q1 7,174 394,638,759 25,124,252 6.40% 1,363,465 2,087,789 $6.68 $6.26
2013 Q4 7,148 392,797,439 27,298,835 6.90% 2,003,230 3,137,471 $6.53 $6.06
2013 Q3 7,119 390,289,594 28,494,137 7.30% 2,310,894 1,404,630 $6.36 $5.78
2013 Q2 7,081 386,801,467 27,244,026 7.00% 2,205,071 1,407,059 $6.35 $5.32
2013 Q1 7,055 384,456,962 27,471,668 7.10% 1,717,698 1,316,799 $5.98 $5.53
2012 Q4 7,020 382,398,541 26,033,609 6.80% 1,745,173 2,253,851 $5.91 $5.14
2012 Q3 7,002 381,000,489 27,804,952 7.30% 1,705,302 1,298,922 $5.76 $5.73
2012 Q2 6,984 380,301,372 28,737,858 7.60% 1,713,664 1,579,719 $5.68 $5.65
2012 Q1 6,971 379,671,472 28,924,409 7.60% 1,977,300 1,576,393 $5.61 $5.08
2011 Q4 6,948 377,688,760 29,174,452 7.70% 1,970,315 2,236,388 $5.52 $5.58
2011 Q3 6,932 376,516,291 30,414,520 8.10% 2,130,635 1,614,984 $5.49 $6.41
2011 Q2 6,921 376,272,374 32,385,587 8.60% 2,125,422 74,608 $5.55 $5.51
2011 Q1 6,858 373,377,488 31,614,368 8.50% 2,044,721 342,142 $5.52 $5.37
Avg Rent

Period Flex/R&D Light Industrial Manufacturing Warehouse - Distribution All Types
2016 Q1 (236,979) (441,653) 873,986 527,676 723,030
2015 Q4 (135,584) (76,903) 72,257 955,072 814,842
2015 Q3 (10,736) 109,791 78,674 1,549,427 1,727,156
2015 Q2 117,699 217,791 247,275 2,864,150 3,446,915
2015 Q1 385,258 25,945 188,910 524,701 1,124,814
2014 Q4 20,908 457,754 (143,098) 2,898,100 3,233,664
2014 Q3 30,950 89,523 408,958 1,278,932 1,808,363
2014 Q2 (20,835) 188,931 419,007 1,191,080 1,778,183
2014 Q1 52,636 167,799 454,750 1,412,604 2,087,789
2013 Q4 (4,830) (197,956) 51,980 3,288,277 3,137,471
2013 Q3 52,871 176,250 65,704 1,109,805 1,404,630
2013 Q2 (163,232) (8,137) (63,405) 1,641,833 1,407,059
2013 Q1 7,293 79,562 294,045 935,899 1,316,799
2012 Q4 33,839 144,932 268,394 1,806,686 2,253,851
2012 Q3 (192,880) 336,660 105,257 1,049,885 1,298,922
2012 Q2 (138,262) 156,070 44,180 1,517,731 1,579,719
2012 Q1 59,798 (67,480) 301,350 1,282,725 1,576,393
2011 Q4 (155,626) (55,481) 537,804 1,909,691 2,236,388
2011 Q3 1,150 (147,428) 90,211 1,671,051 1,614,984
2011 Q2 (96,390) (250,220) 29,313 391,905 74,608
2011 Q1 150,600 127,959 (46,076) 109,659 342,142
TX - Houston Area Industrial Direct Net Absorption By Type
© Copyright 2016 Commercial Gateway, the Commercial Division of the Houston Association of REALTORS ® This information has been compiled from various sources and is provided without guarantee or warranty.

Quarterly Market Overview 2015 Year End FOR IMMEDIATE RELEASE
For more information, please contact: David Mendel, Public Relations Manager Phone: 713.629.1900 ext. 258 E‐mail: [email protected]
HOUSTON’S FOURTH-QUARTER COMMERCIAL ACTIVITY
SLOWS, BUT SHOWS RESILIENCE AMID DOWNTURN
HOUSTON — (January 28, 2016) — Houston’s commercial real estate market
appears resilient despite slower leasing activity as the downturn continues, fueled by
plummeting oil prices. That’s according to quarterly market research compiled by Commercial
Gateway, the commercial division of the Houston Association of Realtors.
The fourth quarter reported positive net absorption of 380,758 square feet of office
space, continuing the year’s positive trend to total more than 2.5 million square feet for the year.
This annual absorption represents less than half of the previous year’s 6.0 million square feet.
As in previous years, Class A properties represent the bulk of the growth, offset by both Class B
and C properties reporting negative absorption for the quarter.
Keeping the direct absorption positive primarily results from large companies occupying
their new space in recently completed build-to-suit and/or owner-occupied properties, which has
been the norm all year. ExxonMobil moved into its two new properties in The Woodlands, Air
Liquide occupied its new building in the west, Statoil occupied the rest of CityWest Place 2, and
Lennar and its affiliated companies including Friendswood Development occupied their new
building in Greenspoint. These companies added to the new building occupation from earlier in
the year by Conoco Phillips Lower 48 Business of 547,628 square feet in Energy Center Three
and Sasol North America in its new headquarters’ building, both in the Energy Corridor, along
with ExxonMobil finalizing its move into the remainder of the 3 million-square-foot campus in the
north.
For the quarter, only five of the 13 submarkets recorded positive absorption for the fourth
quarter, but seven recorded positive net absorption for the year, with two submarkets recording
more than 2.0 million square feet and two recording more than a negative 1.0 million square
feet. Topping the list for the positive side was the North/The Woodlands/Conroe submarket with
2.2 million square feet of net absorption followed by the West submarket with more than 1.5
million square feet. On the negative side for the year was the Central Business District (CBD)

with 1.6 million square feet of negative net absorption followed closely by the Greenspoint area
with almost 1.1 million square feet of negative absorption. ExxonMobil accounts for much of
both sides of the absorption totals as the company moved into its new space and left a couple
million square feet in various markets across the city, including 800 Bell’s 1.1 million square feet
in the CBD.
The changing economy related to the energy downturn is also shown by the increasing
amounts of sublease space on the market. At year-end 2015, the Houston market had almost
6.7 million square feet of sublease space available and being marketed. Of that total, 4.6 million,
or more than half, is Class A space. This total represents more than double the sublease space
available at year-end 2014.
For the quarter, eight new buildings were completed, adding 2.1 million square feet to
the market. For the year, 25 projects totaling almost 8.0 million square feet have been
completed. Collectively, the new buildings are currently 67.4% leased and contributed more
than 5.2 million square feet of net absorption.
Construction starts halted for the most part during the fourth quarter, with only one
property, the new 240,000-square-foot CEMEX building in West Houston, breaking ground.
Overall, the Houston under-construction office market has 21 properties totaling 7.4 million
square feet. Collectively, the under-construction buildings are 76.5% preleased, with 13
properties classified as multi-tenant. The multi-tenant properties represent 3.7 million square
feet or 59.2% of the under-construction total and are currently reporting 50.1% preleased space.
Of the multi-tenant spec properties, four of the 13 are 100% available.
The largest project under construction is Phillips 66’s 1.2 million-square-foot campus in
the Westchase area. The largest spec building under construction with the largest availability
remains Hines’ 609 Main at Texas building with 1.05 million square feet and one recently
reported 62,000-square-foot pre-lease.
Although construction overall slowed, one major commercial project got a jump-start in
2015. Generation Park, McCord Development’s 4,000-acre project on the Northeast side,
currently has the headquarters for FMC Technology under construction along with multi-family
projects. In addition, both Lone Star College and San Jacinto College have announced plans to
build new facilities there.

The current 14.0% direct vacancy rate is up from the 13..3% vacancy recorded last
quarter, and quite a jump from the 11.2% recorded during the same quarter at year-end 2014.
Class A space overall is 12.2% vacant, with the North/The Woodlands/Conroe submarket
increasing to 8.3% from the third-quarter vacancy of 4.7% due to new construction entering the
market with little preleasing. Only the smaller Southeast submarket is posting a lower Class A
rate of 8.2% with the CBD following at 8.4% and the Westchase submarket at 9.7%, rounding
out all submarkets with less than 10% Class A vacancy. Only one of the 13 submarkets, the
Fort Bend County submarket, registered an overall single-digit vacancy.
Rental rates represented a 12.6% increase during the past year with the current overall
averaged weighted rental rate of $28.54. Class A rates, now at $34.54 citywide and at $40.88 in
the CBD, experienced a 6.4% and 3.1% increase, respectively, from the same quarter in 2014.
Sublease space overall is continuing to increase but the rental rate for sublease decreased
10.7% from third quarter, reporting a current average of $22.94. During the past year, the
average sublease rate dropped 21.7%.
Commercial Gateway Member/Broker Comments on the Houston Office Market
Mario A. Arriaga, First Group “The commercial market held its own in 2015, with positive
absorption recorded in both the office and industrial sectors. Much of the office growth
resulted from preleasing in buildings that completed during 4th quarter, including Air
Liquide and the two buildings in The Woodlands housing ExxonMobil. Those three
alone accounted for over 660,000 square feet of positive absorption, and those deals all
happened prior to 2015.
“Although job cuts within the oil industry continue to be announced, the Greater Houston
Partnership is predicting positive job growth this year and more new jobs in
2017. Houston’s diversity is responding to the oil price’s decline, and the area should
remain one of the best commercial markets in the country.
“Growth is slowing, but other than some excess Class A office space and multi-family
product, other sectors of the commercial market are going great. Houston’s industrial
segment is strong, retail is respectable, the land market is good, and homebuilders
haven’t overbuilt.
“The upstream oil and gas market is hurting, but the petrochemical sector is booming.
We’re seeing billions of dollars in new petrochemical construction on the east side,

which has helped offset the downturn in the oil and gas sector. Houston’s port is
expanding; the widening of the Panama Canal is going to be a great driving force for
new business there. Houston’s medical industry is also expanding, with extensive growth
in the suburbs with many new hospitals and emergency centers built or under
construction. So today, other industries are offsetting the decline of the energy sector.
“I am cautiously optimistic. Houston is a strong, robust city that is taking a breather. We
may be pausing temporarily but we will come back even stronger.”
David Baker, Executive Vice President, Houston Operations, Transwestern “The market is
continuing to add space on a direct and sublease basis. At the same time, we are seeing
a significant increase in overall market activity as I believe tenants are taking advantage
of new concessions in the marketplace.
Additionally, our Transwestern Outlook Report is forecasting continued positive job
growth in 2016 and significant job growth in 2017. We expect this job growth will spur
new demand that should moderate the level of concessions and stabilize rental rates in
2016.”
Robert S. Parsley, SIOR, Co-Chairman, Colliers International “As 2015 came to a close, the
Houston Office Market was in the midst of a significant slowdown in reaction to the
dramatic drop in energy prices that occurred throughout the year and the subsequent
reevaluation and adjustments in growth plans implemented by many of the ‘upstream’
energy companies. As the slowdown has continued throughout most of 2015, many
other sectors are feeling the impact of this slowdown, including the ‘mid-’ and
‘downstream’ energy companies, as well as the oilfield service industry and companies
that provide other services to the energy industry, including engineering, finance,
manufacturing and law firms.
“In 2015, Houston’s citywide vacancy rates rose over 430 basis points from 11.1% to
15.4%. In many of the submarkets, we saw the ‘perfect storm’ created by over 12.7
million rentable square feet of new construction delivered to the market in 2015 while
many energy companies were putting large amounts of sublease space on the market
due to the slowdown in the economy. Available sublease space more than doubled in
2015, increasing from 3.8 million rentable square feet to 8.0 million rentable square feet.
The majority of this space was previously leased by growing energy companies for

future expansion. There was a decline in the velocity of office lease transactions and a
decline in leasing activity by 53.5% for 2015. Many tenants are renewing their leases for
a shorter term and renewing in their existing space while they determine the direction of
the office market.
“As we look at 2016, we see a continued slowing in office leasing as companies
determine what direction the energy industry will go, and companies are trying to stay
nimble and await opportunities. Tenants occupy a strong position in this market, and
there are many options for tenants willing to relocate to other buildings. We are seeing
the return of free rent and lease concessions as landlords fight to keep their existing
tenants and attract new tenants from other buildings. As the market slows down, the
local job growth assumptions -- which is a key driver for office space growth -- is
uncertain. Local economists are wary of 2016, and it appears that job growth will be
between flat and approximately 20,000 new jobs, based on when energy prices
strengthen as well as the impact of the uncertainties regarding the national election in
October.”
John Spafford, Executive Vice President, Director of Leasing, PM Realty Group “The
effects of the oil and gas slump have dampened Houston’s office leasing market with
slower demand and rising sublease availabilities, and the flood of office buildings being
completed and entering the market are creating additional downward pressure. Despite
the volatility in the energy sector, the office leasing market recorded just over 2.7 million
square feet of positive direct net absorption in 2015, but direct occupancy levels have
plunged by 220 basis points to 85.4% within the past year largely due to nearly 8.2
million square feet of new supply that delivered in 2015.
“It is important to note that the direct net absorption gains witnessed this past year were
significantly influenced by leases signed by energy companies in new buildings 18 to 24
months prior to the current downturn as these firms are now occupying their new space.
As a result of the job losses within the energy sector, sublease availability has risen by 3
million square feet to nearly 7.8 million square feet. Since year-end 2014, many
companies are placing under-utilized space on the market that was created by workforce
reductions or space that was originally tied up for future expansion. With nearly 2 million
square feet of this sublease space becoming vacant in 2015, the addition of the vacant

sublet space to the direct net absorption figures result in only 675,328 square feet of true
net absorption for 2015.
“As a result of the economic uncertainty, leasing activity has slowed significantly and
dropped to its lowest level since 2009 as many companies are delaying their long-term
leasing decisions while some are opting for short-term leases. As a result of the drop in
leasing activity, many landlords are being more aggressive in negotiations by offering
increased concessions in order to drive tenant interest amid worsening economic
conditions. With the recent onslaught of new construction deliveries, property owners will
have to contend with large blocks of vacant space as many tenants are in a holding
pattern until the market begins to recover.
“The Houston office market is expected to experience some softening in the year ahead
with additional corporate layoffs as well as merger and acquisition activity within the
energy sector, which could also create additional sublease availability. The continuing
trend of consolidation and space optimization by office users and the completion of
numerous developments will add downward pressure on occupancy levels in 2016.
Asking rental rates are expected to remain flat, but concessions such as rent abatement
and TI allowances will gradually increase as a result of slowed leasing activity, the
added sublease inventory and rising vacancy.”
Houston Industrial Market
Houston’s industrial market continued to expand with positive direct net absorption of
almost 662,889 square feet during the fourth quarter of 2015 despite economic uncertainty,
according to statistics released by Commercial Gateway.
This quarter’s absorption represents the 24th consecutive quarter – six years – of
positive absorption, with seven quarters recording more than 2 million square feet each. The
fourth quarter’s net absorption clearly represents a slowdown when compared to last year’s
fourth quarter, which recorded 3.2 million square feet. However, comparing year to year, the 6.8
million square feet of net absorption for 2015 is still a healthy amount when compared to the 8.9
million square feet from 2014.
Major recent announcements for large build-to-suits and speculative projects have
added to several large deals recorded during 2015, which included CVS Health Corp.’s new
328,020-square-foot lease in Imperial Distribution Center, Foxconn Corp’s 400,250-square-foot
deal at Fallbrook Distribution Center, McKesson’s 357,887-square-foot lease at Gateway North
Business Park, and a 207,000-square-foot deal by Niagara Water in Bayou Bend Business
Park.
Net absorption was shared by all industrial types throughout the year with
warehouse/distribution properties accounting for the bulk of absorption this quarter (571,788
square feet) and for the year, ending with 5.5 million square feet or 81.1% of the overall annual
total.
Activity is slowing, but not enough to cause a large bump in the vacancy rate, which
increased to 6.0% from 5.4% the previous quarter. This rate is a slight increase from the
vacancy rate of 5.8% recorded during the same quarter a year ago. Vacancy for
warehouse/distribution space citywide is 6.3% with manufacturing space at 4.2%.
More than 6.7 million square feet in 73 buildings came online during the year, with just
three breaking ground during the fourth quarter. Collectively, all industrial buildings completed in
2015 are currently 34.0% leased and represent more than 2.1 million square feet of absorption
for the year. The majority of construction occurred in the Northwest and Northeast, which
accounted for 23 buildings in 2.2 million square feet and 18 buildings in 1.0 million square feet,
respectively.
Construction activity is still high with many proposed properties announced. Currently,
27 projects representing almost 8.0 million square feet are underway. The two largest BTS
projects remain Daiken’s 4 million square foot facility off Highway 290 and FMC’s new project at
Generation Park in the Northeast.
Despite the downturn, there is still major activity in the industrial sector, especially in the
South, Southeast and even in the Northwest for both build-to-suit and speculative projects.
FedEx recently announced an 800,000 square-foot distribution building off Highway 290 in
Cypress, which will become the company's largest distribution warehouse in Texas. Keystone
Automotive Industries is reportedly working with Nelson Commercial to build a 200,000+
square-foot facility near Bush Intercontinental Airport, and Clay Development is starting a 1.5
million square-foot, three-building speculative project called Cedar Park Distribution Park. The
first 500,000 square-foot building is scheduled to break ground early this year. The Pearland
area is also seeing activity with a couple projects: Tool Flo’s 80,000-square-foot facility in

Spectrum Business Park and the Lonza Group’s 100,000 square-foot biotechnology facility in
the lower Kirby district.
Rental rates have taken a slight drop this quarter to $7.16 from $7.74 last quarter and
slightly less than the $7.57 recorded during the same quarter last year.
Sublease space has been steadily increasing throughout the year, and took a higher
jump in fourth quarter to almost 2.5 million square feet, a 32.4% jump from third quarter. This
quarter’s total is an increase of 61.5% from the same quarter a year ago, and is starting to rival
the larger square footage totals in 2013 and back through 2010.
Commercial Gateway Member/Broker Comments on the Houston Industrial Market
Clarence Trey Erwin III, MBA, Vice President, Colliers International “The Houston industrial
market hit the brakes in 2015. In late 2014 energy and oil service companies were
hitting all cylinders and the local economy was consistently adding jobs. The price of oil
then buckled, hence drilling collapsed and local job growth went flat.
“During the fourth quarter this year, 745,000 square feet of Houston’s industrial inventory
was absorbed, pushing year-end net absorption to 3.4 million square feet.
“Current vacancy for the Houston industrial market as a whole sits at 5.0%. Historically
‘upstream’ submarkets such as the Northwest Corridor and the North Corridor pose
vacancies at 5.6% and 7.6%, respectfully, while the resilient downstream and Port of
Houston’s strong Southeast submarket tallies a mere 3.4% vacancy. Lower oil prices
give way to some opportunities – especially in Southeast/East Houston. Over $33 billion
in new infrastructure has been invested in the petrochemical/plastics plants which thrive
on low-cost oil, which has sounded a colossal development from South Texas to North
Louisiana. The plastics industry accounted for +/-90% of Southeast Houston’s 2015
Industrial absorption – this tenant use absorption in the submarket will proceed forward
in 2016.
“Greater Houston still has 9.2 million square feet still under construction, with about half
of that located in the Northwest Corridor and is inclusive of Daikin Industries’ new 4.1
million-square-foot manufacturing campus.
“Moving forward in 2016, Houston’s industrial market will see vast amounts of sublease
space come to the market, tenant renewals will be prevalent and non-energy tenants

and users will take full advantage of ‘upstream’ submarkets such as the North and the
Northwest. The overbuilt, smaller single-tenant new construction market of 10,000 to
20,000 square feet will slow down considerably, while the big box distribution multi-
tenant product of 100,000 square foot plus will remain flat.”
“In conclusion, 2016 will go down in the books as a year the Houston industrial market
hit pause – the rattlesnake bite of low oil prices will sting the Houston industrial market,
but the market will survive and thrive in 2017.”
Mark G. Nicholas, SIOR, Executive Vice President Regional Director-Brokerage, JLL
Houston “Houston’s commercial market has seen and experienced a downturn in the
upstream side in the energy, oil and gas industry with most companies primarily located
in the West Houston submarket. On the contrary, the downstream and midstream side
in the petrochemical sectors in East Houston is still extremely active.
“My team is very busy because we work the entire Greater Houston Metropolitan Area.
Land sales are still active, whether it be to users or developers for either manufacturing
or distribution facilities.
“In East Houston, there is over 2.5 million square feet under construction of institutional
product with another 1.5 million square feet planned or proposed in various
developments. Large companies are still moving forward on projects as these are long-
term decisions and not solely based on today’s economic climate.
“Many users are looking for shovel-ready sites so they can just come in and build what
they need quickly and not have to wait for infrastructure like streets, utilities, and
detention ponds to be created.
“What amazes me is that every downturn we have experienced in recent years has
resulted in another area rising to the occasion. Like the shale plays virtually coming to a
screeching halt when oil and gas slows down – the Houston market seems to maintain
the diversity and resilience to overcome many different economic issues.”
Founded in 2001, Commercial Gateway, the commercial division of the Houston Association of Realtors (HAR), is a commercial information exchange of commercial real estate professionals engaged in every aspect of property sales and leasing, appraisal, property management and counseling.
###

Houston-Area Office Market Summary2015 Year End
# of Building Vacant Vacancy Net Abs Net Abs Under Avg Sublease
Bldgs* SF** SF Rate (Current) (YTD) Construction Rent*** Avail
A 31 29,969,965 2,513,586 8.4% 96,752 (406,661) 1,675,025 $40.88 1,098,342
B 29 9,549,998 2,401,278 25.1% (42,895) (1,316,076) 0 $31.58 286,501
C 8 640,313 100,729 15.7% 37,529 86,595 0 $19.28 1,427
68 40,160,276 5,015,593 12.5% 91,386 (1,636,142) 1,675,025 $37.82 1,386,270
A 45 14,136,934 1,471,158 10.4% 9,530 1,029,068 1,514,801 $34.46 968,340
B 57 4,974,209 841,312 16.9% (77,462) (398,879) 0 $25.18 662,571
C 6 293,490 12,586 4.3% 1,204 (12,068) 0 $24.96 36,223
108 19,404,633 2,325,056 12.0% (66,728) 618,121 1,514,801 $30.27 1,667,134
A 35 2,994,393 347,762 11.6% 30,880 49,609 133,500 $28.77 155,281
B 25 2,481,920 126,165 5.1% (9,709) 40,956 0 $22.08 1,765
C 2 247,000 85,010 34.4% (36,095) (51,039) 0 n/a 0
62 5,723,313 558,937 9.8% (14,924) 39,526 133,500 $27.42 157,046
A 33 5,159,180 1,523,325 29.5% (171,296) (585,160) 0 $26.48 405,085
B 45 4,704,053 1,700,566 36.2% (16,224) (511,817) 0 $18.87 293,407
C 29 2,190,970 514,157 23.5% (47,907) 23,953 0 $12.31 0
107 12,054,203 3,738,048 31.0% (235,427) (1,073,024) 0 $21.94 698,492
A 41 11,271,464 1,620,250 14.4% 191,230 (598,211) 162,500 $33.51 209,709
B 102 10,736,642 1,302,601 12.1% (9,718) (210,429) 0 $27.28 37,172
C 72 4,291,776 415,209 9.7% (7,958) (10,690) 0 $17.39 10,148
215 26,299,882 3,338,060 12.7% 173,554 (819,330) 162,500 $29.69 257,029
A 88 11,928,643 995,205 8.3% 173,518 2,259,576 619,599 $32.82 398,419
B 82 4,859,633 899,031 18.5% (34,834) (80,126) 77,900 $17.88 132,685
C 32 1,161,368 142,022 12.2% (5,360) 43,432 0 $13.70 0
202 17,949,644 2,036,258 11.3% 133,324 2,222,882 697,499 $25.27 531,104
A 6 51,670 7,630 14.8% 0 0 0 $25.50 0
B 9 458,575 57,267 12.5% (2,059) (8,995) 0 $15.54 0
C 5 197,243 80,437 40.8% (265) (11,412) 0 $15.38 0
20 707,488 145,334 20.5% (2,324) (20,407) 0 $15.98 0
A 40 4,485,979 903,030 20.1% 875 508,664 410,171 $23.80 91,454
B 62 5,753,037 1,178,116 20.5% (37,630) 6,228 23,000 $19.68 106,990
C 23 894,194 143,212 16.0% 11,605 101,007 0 $18.30 0
125 11,133,210 2,224,358 20.0% (25,150) 615,899 430,171 $20.30 198,444
Energy Corridor Subtotal
Submarket Class
CBD
CBD Subtotal
Energy Corridor
Northwest Subtotal
Fort Bend County
Fort Bend County SubtotalGreenspoint
Greenspoint Subtotal
Inner Loop
Inner Loop Subtotal
North/The Woodlands/Conroe
North/The Woodlands/ Conroe SubtotalNortheast
Northeast Subtotal
Northwest
© Copyright 2016 Commercial Gateway, the Commercial Division of the Houston Association of REALTORS ®This information has been compiled from various sources and is provided without guarantee or warranty.

A 17 1,997,376 163,467 8.2% 96,098 46,682 0 $29.35 37,320
B 54 3,473,086 454,204 13.1% 139,085 100,628 52,500 $17.94 1,311
C 43 1,910,170 320,306 16.8% (18,488) (4,082) 0 $17.39 26,330
114 7,380,632 937,977 12.7% 216,695 143,228 52,500 $19.17 64,961
A 4 1,069,386 221,787 20.7% 22,708 50,983 0 $17.50 0
B 46 5,826,954 1,321,134 22.7% (6,859) 314,340 0 $18.35 22,620
C 85 5,219,812 593,249 11.4% (76,170) 184,485 0 $12.66 0
135 12,116,152 2,136,170 17.6% (60,321) 549,808 0 $16.87 22,620
A 43 16,935,800 2,241,497 13.2% (112,178) (266,981) 1,132,316 $39.47 359,484
B 82 10,760,603 1,259,598 11.7% 48,460 1,673 0 $27.08 351,174
C 15 1,008,356 52,200 5.2% (7,559) 19,855 0 $19.45 0
140 28,704,759 3,553,295 12.4% (71,277) (245,453) 1,132,316 $35.64 710,658
A 53 8,810,552 1,446,314 16.4% 223,590 1,346,345 459,492 $29.59 390,476
B 48 4,019,101 417,528 10.4% 32,514 189,251 0 $19.53 33,072
C 41 2,687,135 100,234 3.7% (16,291) (10,345) 0 $14.94 7,541
142 15,516,788 1,964,076 12.7% 239,813 1,525,251 459,492 $25.83 431,089
A 34 9,112,517 885,282 9.7% 64,585 (112,841) 1,517,000 $34.84 511,087
B 48 6,634,282 958,384 14.5% (55,327) 26,547 0 $21.73 63,997
C 19 808,152 80,461 10.0% (7,121) 74,248 0 $18.04 0
101 16,554,951 1,924,127 11.6% 2,137 (12,046) 1,517,000 $28.72 575,084
A 470 117,923,859 14,340,293 12.2% 626,292 3,321,073 7,624,404 $34.54 4,624,997
B 689 74,232,093 12,917,184 17.4% (72,658) (1,846,699) 153,400 $22.81 1,993,265
C 380 21,549,979 2,639,812 12.3% (172,876) 433,939 0 $15.58 81,669
1,539 213,705,931 29,897,289 14.0% 380,758 1,908,313 7,777,804 $28.54 6,699,931TX - Houston Area Total
Southeast
Southeast Subtotal
Southwest
Southwest Subtotal
Uptown
Uptown Subtotal
West
West Subtotal
Westchase
Westchase Subtotal
TX - Houston Area
© Copyright 2016 Commercial Gateway, the Commercial Division of the Houston Association of REALTORS ®This information has been compiled from various sources and is provided without guarantee or warranty.
* Number of buildings calculated on specific buildings at each property address.** Includes all general-purpose existing industrial buildings 10,000 square feet or larger.*** Rental rates are weighted and averaged based on available space.

Period# of
BuildingsBuilding
SF
Vacant SF Vacancy Rate Net Absorption Avg Rent
Direct Sublease Total Direct Sublease Total Direct Sublease Total Direct Sublease
2015 Q4 1,539 213,705,931 29,897,289 6,699,931 30,062,573 14.0% 3.1% 14.1% 380,758 307,772 688,530 $28.54 $22.94
2015 Q3 1,526 211,186,249 28,066,026 5,742,722 28,066,026 13.3% 2.7% 13.3% 54,290 (643,999) (589,709) $27.11 $25.39
2015 Q2 1,519 209,621,820 26,561,986 4,876,214 26,496,867 12.7% 2.3% 12.6% 1,525,541 (1,426,369) 99,172 $26.57 $28.09
2015 Q1 1,501 207,061,155 26,002,563 3,450,693 25,947,115 12.6% 1.7% 12.5% 555,397 (254,744) 300,653 $26.30 $29.72
2014 Q4 1,477 203,212,546 22,820,001 3,195,204 22,751,814 11.2% 1.6% 11.2% 1,721,540 (162,674) 1,558,866 $25.34 $29.33
2014 Q3 1,461 201,191,267 22,153,776 3,042,717 22,107,892 11.0% 1.5% 11.0% 919,950 84,296 1,004,246 $25.06 $29.42
2014 Q2 1,451 199,743,451 21,748,248 3,127,013 21,697,174 10.9% 1.6% 10.9% 2,305,797 (375,772) 1,930,025 $25.00 $27.94
2014 Q1 1,442 198,025,809 22,056,941 2,751,241 22,006,406 11.1% 1.4% 11.1% 1,102,240 (241,993) 860,247 $24.82 $26.01
2013 Q4 1,438 196,835,805 22,165,177 2,616,113 22,125,783 11.3% 1.3% 11.2% 799,788 (316,361) 483,427 $24.25 $27.50
2013 Q3 1,432 195,907,142 22,456,947 2,299,752 22,416,916 11.5% 1.2% 11.4% 1,796,238 (264,946) 1,531,292 $24.21 $27.48
2013 Q2 1,418 193,363,835 21,600,041 2,034,806 21,529,243 11.2% 1.1% 11.1% 569,668 (273,404) 296,264 $23.57 $26.34
2013 Q1 1,414 192,686,956 21,754,713 1,703,604 21,690,933 11.3% 0.9% 11.3% 393,869 (49,559) 344,310 $23.29 $25.56
2012 Q4 1,414 192,629,758 22,211,836 1,654,045 22,148,345 11.5% 0.9% 11.5% 1,120,277 15,432 1,135,709 $23.19 $23.05
2012 Q3 1,412 192,175,411 22,717,486 1,669,477 22,684,309 11.8% 0.9% 11.8% 454,212 204,364 658,576 $22.95 $23.71
2012 Q2 1,410 192,348,401 23,195,088 1,873,841 23,150,819 12.1% 1.0% 12.0% 1,160,667 346,625 1,507,292 $22.76 $24.85
2012 Q1 1,410 192,366,819 23,756,259 2,220,466 23,730,649 12.3% 1.2% 12.3% 823,036 287,689 1,110,725 $22.74 $25.28
2011 Q4 1,407 192,167,372 25,478,716 2,508,155 25,414,716 13.3% 1.3% 13.2% 942,031 496,847 1,438,878 $22.89 $25.34
2011 Q3 1,400 191,549,685 26,010,162 3,005,002 25,946,162 13.6% 1.6% 13.5% 1,259,958 (222,073) 1,037,885 $22.72 $25.30
2011 Q2 1,397 190,782,640 26,634,297 2,782,929 26,570,297 14.0% 1.5% 13.9% 78,544 71,935 150,479 $22.97 $24.78
2011 Q1 1,396 190,098,488 26,204,805 2,827,526 26,140,805 13.8% 1.5% 13.8% (208,556) 350,061 141,505 $23.23 $23.87
2010 Q4 1,396 189,347,495 25,625,230 3,189,862 25,561,230 13.5% 1.7% 13.5% 2,764 422,532 425,296 $22.73 $23.52
2010 Q3 1,396 188,896,542 25,953,035 3,406,980 25,889,035 13.7% 1.8% 13.7% (171,019) (175,513) (346,532) $22.94 $24.55
2010 Q2 1,396 188,896,542 25,697,891 3,232,943 25,633,891 13.6% 1.7% 13.6% 697,170 557,095 1,254,265 $23.27 $24.67
2010 Q1 1,395 188,872,302 26,234,346 3,790,038 26,170,345 13.9% 2.0% 13.9% (1,335,476) (94,915) (1,430,391) $23.92 $25.56
TX - Houston Area Office Historical Summary
© Copyright 2016 Commercial Gateway, the Commercial Division of the Houston Association of REALTORS ®This information has been compiled from various sources and is provided without guarantee or warranty.

Period Class A Class B Class C All Classes
2015 Q4 626,292 (72,658) (172,876) 380,758
2015 Q3 752,938 (996,038) 297,390 54,290
2015 Q2 1,693,588 (208,317) 40,270 1,525,541
2015 Q1 873,530 (502,210) 184,077 555,397
2014 Q4 1,427,302 296,547 (2,309) 1,721,540
2014 Q3 955,886 (133,200) 97,264 919,950
2014 Q2 1,948,587 171,026 186,184 2,305,797
2014 Q1 987,099 165,203 (50,062) 1,102,240
2013 Q4 608,883 272,608 (81,703) 799,788
2013 Q3 1,809,844 76,501 (90,107) 1,796,238
2013 Q2 836,376 (84,770) (181,938) 569,668
2013 Q1 229,455 235,552 (71,138) 393,869
2012 Q4 566,957 639,219 (85,899) 1,120,277
2012 Q3 405,430 18,446 30,336 454,212
2012 Q2 1,066,677 63,081 30,909 1,160,667
2012 Q1 43,439 645,798 133,799 823,036
2011 Q4 793,753 65,449 82,829 942,031
2011 Q3 1,457,485 (232,783) 35,256 1,259,958
2011 Q2 218,266 (130,246) (9,476) 78,544
2011 Q1 195,659 (428,686) 24,471 (208,556)
2010 Q4 416,133 (337,040) (123,902) 2,764
2010 Q3 526,692 (724,927) 49,309 (171,019)
2010 Q2 524,438 135,506 48,972 697,170
2010 Q1 (224,705) (960,759) (160,884) (1,335,476)
TX - Houston Area Office Direct Net Absorption By Class
© Copyright 2016 Commercial Gateway, the Commercial Division of the Houston Association of REALTORS ®This information has been compiled from various sources and is provided without guarantee or warranty.
© Copyright 2016 Commercial Gateway, the Commercial Division of the Houston Association of REALTORS ®This information has been compiled from various sources and is provided without guarantee or warranty.

Houston-Area Industrial Market Summary2015 Year End
# of Building Vacant Vacancy Net Abs Net Abs Under
Bldgs* SF** SF Rate (Current) (YTD) Const.
Avg Sublease
Rent*** Avail
Inner Loop Warehouse/Distribution 565 19,469,365 879,679 4.5% 43,081 (26,564) 0 $6.30 26,500Manufacturing 58 1,763,271 46,946 2.7% (4,313) (4,313) 0 $10.08 0Light Industrial 109 3,076,767 236,819 7.7% (22,943) (99,757) 0 $8.10 39,617Flex/R&D 81 1,600,667 32,786 2.1% 36,296 35,620 0 $12.00 0
Inner Loop Subtotal 813 25,910,070 1,196,230 4.6% 52,121 (95,014) 0 $7.30 66,117
North Warehouse/Distribution 694 14,440,487 1,263,454 8.8% (213,730) (245,534) 44,875 $7.33 34,220Manufacturing 117 3,206,046 264,030 8.2% 38,400 79,208 0 $2.67 25,050Light Industrial 146 2,745,355 178,815 6.5% 89,572 94,772 22,500 $9.17 18,383Flex/R&D 78 2,047,736 298,865 14.6% (7,515) 34,722 0 $16.80 0
1,035 22,439,624 2,005,164 8.9% (93,273) (36,832) 67,375 $7.38 77,653North Subtotal
Northeast Warehouse/Distribution 1,138 53,008,130 5,212,795 9.8% 50,253 1,019,226 744,118 $6.75 500,501Manufacturing 215 7,596,112 193,303 2.5% 103,456 342,475 674,500 $0.88 103,714Light Industrial 206 5,794,588 696,189 12.0% (22,187) 126,803 0 $8.83 70,602Flex/R&D 117 2,548,227 102,567 4.0% (4,485) (3,192) 0 n/a 9,500
1,676 68,947,057 6,204,854 9.0% 127,037 1,485,312 1,418,618 $6.89 684,317Northeast Subtotal
Northwest Warehouse/Distribution 2,164 96,423,107 6,161,600 6.4% 306,323 2,291,336 14,490 $7.12 798,126Manufacturing 459 17,036,620 559,554 3.3% (43,326) (30,623) 4,021,250 $8.64 87,320Light Industrial 467 13,809,379 952,200 6.9% 41,762 148,994 0 $10.31 274,132Flex/R&D 275 5,458,096 17,545 0.3% (19,132) 7,018 0 $5.03 14,664
Northwest Subtotal 3,365 132,727,202 7,690,899 5.8% 285,627 2,416,725 4,035,740 $7.66 1,174,242
South Warehouse/Distribution 763 24,533,100 777,386 3.2% (163,329) (27,236) 35,000 $5.26 25,500Manufacturing 161 5,872,661 309,986 5.3% (78,450) (28,381) 0 $8.22 0Light Industrial 90 1,825,314 213,848 11.7% (25,746) (47,081) 0 $9.93 0Flex/R&D 75 1,451,429 0 0.0% 0 0 0 n/a 0
1,089 33,682,504 1,301,220 3.9% (267,525) (102,698) 35,000 $6.05 115,500South Subtotal
Southeast Warehouse/Distribution 1,301 59,716,502 2,531,733 4.2% 237,526 1,669,793 1,725,565 $6.29 67,808Manufacturing 221 10,292,610 313,893 3.1% 54,490 (63,018) 0 $5.52 0Light Industrial 103 2,195,512 427,065 19.5% (64,918) (392) 20,700 $10.22 0Flex/R&D 134 2,053,128 66,967 3.3% 0 0 25,000 $11.94 25,000
Southeast Subtotal 1,759 74,257,752 3,339,658 4.5% 227,098 1,606,383 1,771,265 $6.76 67,808
Submarket Specific Use
© Copyright 2016 Commercial Gateway, the Commercial Division of the Houston Association of REALTORS ®This information has been compiled from various sources and is provided without guarantee or warranty.
© Copyright 2016 Commercial Gateway, the Commercial Division of the Houston Association of REALTORS ®This information has been compiled from various sources and is provided without guarantee or warranty.

Southwest Warehouse/Distribution 950 37,913,470 2,273,280 6.0% 311,664 843,580 570,550 $6.08 87,642Manufacturing 128 4,425,892 400,190 9.0% 64,560 155,955 111,600 $5.11 128,934Light Industrial 366 12,117,222 696,305 5.8% 4,134 135,237 0 $13.12
48,995
Flex/R&D 168 4,131,708 64,329 1.6% (48,554) 398,429 0 n/a 01,612 58,588,292 3,434,104 5.9% 331,804 1,533,201 682,150 $7.31 265,571Southwest Subtotal
TX - Houston Warehouse/Distribution 7,575 305,504,161 19,099,927 6.3% 571,788 5,524,601 3,435,598 $6.64 1,540,297Manufacturing 1,359 50,193,212 2,087,902 4.2% 134,817 451,303 4,851,550 $5.75 435,018Light Industrial 1,487 41,564,137 3,401,241 8.2% (326) 358,576 118,871 $10.28 451,729Flex/R&D 928 19,290,991 583,059 3.0% (43,390) 472,597 25,000 $10.68 24,164
TX - Houston Area Total 11,349 416,552,501 25,172,129 6.0% 662,889 6,807,077 7,989,448 $7.16 2,451,208
© Copyright 2016 Commercial Gateway, the Commercial Division of the Houston Association of REALTORS ®This information has been compiled from various sources and is provided without guarantee or warranty.
* Number of buildings calculated on specific buildings at each property address.** Includes all general-purpose existing industrial buildings 10,000 square feet or larger.*** Rental rates are weighted and averaged based on available space.

Period# of
BuildingsBuilding
SF
Vacant SF Vacancy Rate Net Absorption Avg Rent
Direct Sublease Total Direct Sublease Total Direct Sublease Total Direct Sublease
2015 Q4 11,349 416,552,501 25,172,129 2,451,208 25,394,279 6.0% 0.6% 6.1% 662,889 547,522 1,210,411 $7.16 $5.40
2015 Q3 11,308 414,032,426 22,400,701 1,851,334 22,500,701 5.4% 0.4% 5.4% 1,733,288 68,079 1,801,367 $7.74 $6.81
2015 Q2 11,310 412,202,740 22,851,985 1,862,124 22,851,985 5.5% 0.5% 5.5% 3,330,758 (76,524) 3,254,234 $7.66 $7.40
2015 Q1 11,227 409,337,967 23,898,426 1,628,464 23,941,286 5.8% 0.4% 5.8% 1,127,700 103,824 1,231,524 $7.68 $7.31
2014 Q4 11,142 406,134,298 23,512,679 1,517,554 23,555,539 5.8% 0.4% 5.8% 3,233,364 (248,279) 2,985,085 $7.57 $6.92
2014 Q3 11,075 403,008,716 25,045,104 1,378,661 25,053,749 6.2% 0.3% 6.2% 1,819,744 120,501 1,940,245 $7.35 $6.84
2014 Q2 11,031 400,383,356 25,191,308 1,484,062 25,199,953 6.3% 0.4% 6.3% 1,787,103 (88,457) 1,698,646 $7.14 $6.81
2014 Q1 10,987 397,382,947 25,245,378 1,363,465 25,254,023 6.4% 0.3% 6.4% 2,076,199 148,511 2,224,710 $6.67 $6.26
2013 Q4 10,949 394,607,216 27,431,371 2,003,230 27,441,016 7.0% 0.5% 7.0% 3,137,896 (220,940) 2,916,956 $6.53 $6.06
2013 Q3 10,896 392,367,809 28,684,348 2,310,894 28,657,851 7.3% 0.6% 7.3% 1,409,040 85,252 1,494,292 $6.36 $5.78
2013 Q2 10,833 389,249,902 27,288,647 2,205,071 27,274,675 7.0% 0.6% 7.0% 1,409,939 (448,240) 961,699 $6.24 $5.32
2013 Q1 10,796 387,188,877 27,669,169 1,717,698 27,689,582 7.1% 0.4% 7.2% 1,332,284 27,475 1,359,759 $5.95 $5.53
2012 Q4 10,746 384,972,730 26,167,105 1,745,173 26,187,518 6.8% 0.5% 6.8% 2,253,851 259,860 2,513,711 $5.86 $5.14
2012 Q3 10,721 383,574,634 27,844,288 1,705,302 27,859,508 7.3% 0.4% 7.3% 1,309,122 8,362 1,317,484 $5.72 $5.73
2012 Q2 10,687 383,011,567 28,951,444 1,713,664 28,967,872 7.6% 0.4% 7.6% 1,577,285 33,946 1,611,231 $5.65 $5.65
2012 Q1 10,666 381,587,394 28,791,968 1,977,300 28,810,429 7.5% 0.5% 7.6% 1,389,666 335,275 1,724,941 $5.59 $5.08
2011 Q4 10,625 380,040,455 29,112,708 1,970,315 29,131,976 7.7% 0.5% 7.7% 2,243,257 160,320 2,403,577 $5.52 $5.58
2011 Q3 10,591 378,909,379 30,576,718 2,130,635 30,609,216 8.1% 0.6% 8.1% 1,639,397 68,870 1,708,267 $5.46 $6.41
2011 Q2 10,506 378,753,412 32,517,398 2,125,422 32,544,627 8.6% 0.6% 8.6% 82,931 (59,701) 23,230 $5.52 $5.51
2011 Q1 10,387 376,052,417 31,759,262 2,044,721 31,786,491 8.4% 0.5% 8.5% 337,590 (134,971) 202,619 $5.51 $5.37
2010 Q4 10,367 375,777,528 31,944,912 1,878,890 31,931,362 8.5% 0.5% 8.5% 497,855 (14,162) 483,693 $5.57 $5.81
2010 Q3 10,297 374,382,782 32,424,170 1,853,478 32,414,781 8.7% 0.5% 8.7% 314,689 585,710 900,399 $5.68 $5.65
2010 Q2 10,286 373,937,120 32,601,291 2,406,522 32,600,629 8.7% 0.6% 8.7% 2,915,224 147,783 3,063,007 $5.73 $5.38
2010 Q1 10,144 365,911,129 33,480,337 2,512,162 33,479,675 9.1% 0.7% 9.1% 1,874,054 (205,779) 1,668,275 $5.46 n / a
TX - Houston Area Industrial Historical Summary
© Copyright 2016 Commercial Gateway, the Commercial Division of the Houston Association of REALTORS ®This information has been compiled from various sources and is provided without guarantee or warranty.

Period Flex/R&D Light Industrial Manufacturing Warehouse - Distribution All Types
2015 Q4 (43,390) (326) 134,817 571,788 662,889
2015 Q3 (10,736) 104,488 78,674 1,560,862 1,733,288
2015 Q2 117,699 253,660 160,275 2,799,124 3,330,758
2015 Q1 423,391 40,222 188,910 475,177 1,127,700
2014 Q4 11,269 457,754 (143,098) 2,907,439 3,233,364
2014 Q3 30,950 100,904 408,958 1,278,932 1,819,744
2014 Q2 (31,313) 184,611 419,007 1,214,798 1,787,103
2014 Q1 22,006 169,999 454,750 1,429,444 2,076,199
2013 Q4 (4,830) (197,531) 51,980 3,288,277 3,137,896
2013 Q3 57,421 173,110 65,704 1,112,805 1,409,040
2013 Q2 (163,232) (5,257) (63,405) 1,641,833 1,409,939
2013 Q1 7,293 85,507 294,045 945,439 1,332,284
2012 Q4 33,839 144,932 268,394 1,806,686 2,253,851
2012 Q3 (192,880) 346,860 105,257 1,049,885 1,309,122
2012 Q2 (138,262) 153,636 44,180 1,517,731 1,577,285
2012 Q1 59,798 (63,527) 301,350 1,092,045 1,389,666
2011 Q4 (155,626) (48,612) 537,804 1,909,691 2,243,257
2011 Q3 1,150 (146,515) 90,211 1,694,551 1,639,397
2011 Q2 (104,439) (258,458) 29,313 416,515 82,931
2011 Q1 150,600 123,407 (46,076) 109,659 337,590
2010 Q4 264,159 188,845 (66,290) 111,141 497,855
2010 Q3 (209) 228,652 (113,250) 199,496 314,689
2010 Q2 (33,547) 389,676 351,499 2,207,596 2,915,224
2010 Q1 17,825 (21,899) 42,018 1,836,110 1,874,054
TX - Houston Area Industrial Direct Net Absorption By Type
© Copyright 2016 Commercial Gateway, the Commercial Division of the Houston Association of REALTORS ® This information has been compiled from various sources and is provided without guarantee or warranty.

Quarterly Market Overview Third Quarter 2015 FOR IMMEDIATE RELEASE
For more information, please contact: David Mendel, Public Relations Manager Phone: 713.629.1900 ext. 258 E‐mail: [email protected]
HOUSTON’S THIRD-QUARTER COMMERCIAL ACTIVITY
SLOWS, REFLECTS CHANGING ECONOMY
HOUSTON — (October 20, 2015) — Houston’s commercial real estate activity has
begun to show more visible signs of adjusting to changing economic factors, according to
quarterly market research compiled by Commercial Gateway, the commercial division of the
Houston Association of Realtors.
For the first time in more than four years, the third quarter reported slightly negative
office absorption of 55,300 square feet, although absorption through the first three quarters
remained positive with direct net absorption totaling more than 2.0 million square feet. As in
previous years, Class A properties represent the bulk of the growth, offset by Class B properties
reporting a negative 1.0 million square feet for third quarter. Class C properties came out on the
positive side, with 297,390 square feet of positive absorption for the quarter. Contributing
heavily to the negative absorption in Class B is the new availability of 1.3 million square feet in
800 Bell after ExxonMobil vacated and moved to the company’s new headquarters in the north.
Keeping the direct absorption positive primarily results from large companies occupying
their new space in recently completed build-to-suit and/or owner-occupied properties. The
largest is the recent move-in by Conoco Phillips Lower 48 Business into the newly-completed
Energy Center Three, a 547,628 square-foot building. Ten submarkets recorded positive
absorption for third quarter but only seven submarkets recorded positive direct net absorption
year-to-date.
The changing economy related to the oil and gas downturn is also shown by the
increasing amounts of sublease space on the market; and when that sublease space enters the
picture, the absorption totals change dramatically. However, sublease space appears on the
market for many reasons, including downsizing and consolidations, but rent is usually being
paid for the space whether it is occupied or vacant. And that situation could easily change if a
company’s business volume changes. At the end of the third quarter, the Houston market
currently has almost 6 million square feet of sublease space available, and another 2 million
1

square feet being marketed but not yet available – with almost half Class A space. This total
represents almost double the same period last year. Firms looking to move or expand will be
able to take advantage of reduced rates with limited terms, which could affect both the overall
leasing activity for the new buildings being completed in the next two years and certainly could
play a factor in delaying the starts of new buildings.
For the quarter, six new multi-tenant buildings were completed, adding almost 1.4 million
square feet to the market. The two largest multi-tenant buildings to be completed this quarter
were 3737 Buffalo Speedway, a 400,000-square-foot building in the Central Northwest which is
27.6% leased, and Enclave Place, a 300,900-square-foot building in the Energy Corridor with all
space available. To date through third quarter, 41 buildings in 26 projects have been completed
this year. Collectively, the new buildings are currently 69.1% leased and contributed almost 5.2
million square feet of net absorption. To date, the new properties collectively completed in 2015
added more than 8 million square feet to the market with rental rates averaging $30.02, less
than the overall Class A rate of $32.46.
Construction starts halted during the third quarter, with only one property, Grandway
West Building 2, breaking ground. Overall, the Houston under-construction office market boasts
30 properties with 35 buildings totaling almost 9.8 million square feet. Collectively, the under-
construction buildings are 45% preleased, with 20 properties classified as multi-tenant. The
multi-tenant properties represent almost 5.7 million square feet or 59.2% of the under-
construction total and are currently reporting 23.2% preleased space. Of the multi-tenant spec
properties, 11 of the 20 are less than 10% preleased.
The largest project under construction is Phillips 66’s 1.2 million-square-foot campus in
the Westchase area, while the largest spec building under construction with the largest
availability remains Hines’ 609 Main at Texas building with 1.05 million square feet.
The current 13.4% direct vacancy rate is an almost 1.0% increase from the 12.5%
vacancy recorded last quarter, and even more than the 11.0% recorded during the same quarter
a year ago. Class A space overall is 11.4% vacant, with the North/The Woodlands/Conroe
submarket showing the lowest Class A vacancy of 4.7% followed by the Westchase submarket
at 8.3% and the Fort Bend County submarket at 9.1%. Five of the 13 submarkets are recording
single-digit vacancies in Class A space, but only three of the 13 boast single-digit vacancies
overall.
2

Rental rates represent a 7.5% increase during the past year with the current overall
averaged weighted rental rate of $26.93. Class A rates, now at $32.46 citywide and at $39.66 in
the CBD, experienced a slight decrease from the same quarter last year. Sublease space
overall is continuing to increase but the rental rate for sublease decreased 9.5% from second
quarter, reporting a current average of $24.56. Concessions are reportedly being offered to
entice some tenants, but none are being offered across the board.
Commercial Gateway Member/Broker Comments on the Houston Office Market
Mario A. Arriaga, First Group “With decreased job growth and higher vacancy rates, the
Houston area’s office market is starting to visibly reflect the slowdown. While large
blocks of direct space and sublease space have been added to the marketplace earlier
this year, we are seeing more newly completed buildings coming on line with little
preleasing. Since many buildings entered the market fully leased when construction
levels peaked last year, this lack of preleasing is the most visible sign of the slowdown in
leasing activity.
“But the industrial sector is still going very strong, especially in areas connected to the
growing petrochemical industry along with future growth related to the Port of Houston
and the Panama Canal. Certain select submarkets to the north and northwest are
struggling to keep pace as new construction enters the market, but Houston’s industrial
market is still considered one of the healthiest in the country.”
David Baker, Executive Vice President, Houston Operations, Transwestern “While the
Houston market continues to soften due to a downturn in the energy economy, office
face rents are continuing to trend upward, but landlords are offering more concessions to
get those rents. Sublease inventories remain on the rise, although at a much slower rate
than the first half of the year.”
Darren Gowell, Senior Associate, Colliers International “The Houston office market
continues to decline while the price of oil still has not rebounded to the level this city
needs. The predictions that oil prices will rise has still not occurred, and the ‘upstream’
sector has been heavily affected. While this is healthy for the midstream and
downstream companies, it certainly hurts the upstream companies that occupy more
office space.
3

“Houston’s leasing activity has declined nearly 40% between second and third quarter
this year, and the days of the landlord market are now coming to an end. This is a great
time for tenants to take advantage of the soft market and to consider longer term leases.
Landlords are starting to give the concessions that have not been seen in several years.
It appears Houston’s diversity has helped our economy, but it’s clear we are still very
heavily dependent on the price of oil.”
John Spafford, Executive Vice President, Director of Leasing, PM Realty Group “Houston’s
office leasing market has begun to experience some softness due to slower demand,
rising sublease availabilities, and a flood of new office buildings entering the market.
Despite the uncertainties surrounding the local economy, the office leasing market has
held up relatively well thus far with nearly 1.6 million square feet of positive direct net
absorption year-to-date, with the bulk of these gains within the Class A market.
“Meanwhile, sublease availability has risen by 2.9 million square feet to over 7.6 million
square feet since year-end 2014, which is more than double its 10-year historic average.
However, the addition of the vacant sublet space to the office space absorption figures
result in an overall citywide negative absorption of 47,700 square feet year-to-date.
“In terms of new supply, developers have delivered just over 5 million square feet of
competitive space year-to-date, which have caused direct occupancy levels to drop by
130 basis points to 86.3% since year-end 2014 as new supply has outpaced demand.
As a result of the economic uncertainty in the energy sector, leasing activity has slowed
significantly compared to its swift pace experienced within the past few years as many
companies are delaying their long-term leasing decisions while some are opting for
short-term leases or early lease restructures. Class A direct leasing activity in the trailing
12 months has declined by 45% from its prior year to drop to its lowest level since 2009.
“As a result of the significant drop in leasing activity, some landlords are being more
aggressive in negotiations by offering more concessions to drive tenant interest amid
worsening economic conditions. With the recent onslaught of new construction
deliveries, property owners will have to contend with large chunks of vacant space as
many tenants are in a holding pattern until the market begins to recover.
“Also, energy tenants in existing buildings have begun to either relocate early to new
product or to consolidate operations causing sublease space availability to rise to a
4

record high. The steady increase in sublease availability has resulted from energy-
related companies temporarily downsizing and offering portions of their leased space
while some have consolidated and relocated to new construction projects delivered in
recent quarters.
“Looking ahead, the Houston office market is expected to round-out the year with an
additional 3.1 million square feet of construction deliveries during the fourth quarter. As a
result of a steep supply/demand imbalance, direct occupancy rates are projected to
decline by 120 basis points to 85.1% by year-end 2015, reaching their lowest level since
2011, after enjoying three years above its 20-year historical average of 86.8%. Asking
rental rates are expected to remain flat for the remainder of 2015, but concessions such
as rent abatement and TI allowances will be increasing as a result of slowed leasing
activity, the added sublease inventory and rising vacancy.“
Jason Whittington, Partner, NAI Partners “The Houston office market is not in a state of
doom and gloom despite the influential drop in oil prices from over $100 a barrel to less
than $50. Houston is a resilient and more diversified city than the crash of the 1980s.
However, Houston is still heavily dependent on the energy industry for job growth and
the oil patch is having significant layoffs and cut backs in spending which impacts the
office space market.
“The office space ‘boom’ we have experienced up until mid-2014 has slowed
dramatically and is headed south. Certain office markets in the city are being hit harder
than others. The Energy Corridor, which had experienced the most growth and
construction in the city, is being hit the hardest. A couple of years ago occupancy in the
Energy Corridor was nearly 99%, but that figure is rapidly declining with the new
construction coming on line and the large amounts of sublease space on the market.
“The energy slowdown could last at least two years and then take another year before
the energy companies staff back up and start spending. In the meantime, tenants in the
market for office space can lock in an attractive lease package that includes reduced
rental and concessions such as abated rent, increased tenant improvement allowance,
and abated parking.”
Houston Industrial Market
5

Houston’s industrial market continues to expand with positive direct net absorption of
almost 1.8 million square feet during the third quarter of 2015 despite economic uncertainty,
according to statistics released by Commercial Gateway.
This quarter’s absorption represents the 23nd consecutive quarter – over five years – of
positive absorption, with seven quarters recording more than 2 million square feet each.
Although almost half of the previous quarter, the third quarter absorption is about the same
when compared to the same quarter last year and is clearly a positive sign in today’s
marketplace of energy layoffs and cutbacks.
Major deals recorded during the quarter include preleasing in Port 225 by Abrasive
Products, 102,508 square feet, and a 207,000-square-foot deal by Niagra Water in Bayou Bend
Business Park, along with two leases in Apex Business Park, Dawn Food Product’s 89,710-
square-foot lease along with Eleganza Tile’s 44,130-square-foot deal. Slay Industries also
signed a 100,000-square-foot deal at 2902 E. 13th.
Net absorption was shared by all industrial types except high tech/R&D during the third
quarter with warehouse/distribution properties accounting for the bulk of absorption, 1.6 million
square feet or 91.4% of the total. High tech/R&D space experienced a slightly negative quarter
with a negative 10,736 square feet recorded after four quarters of positive absorption.
Activity is slowing but not enough to cause a large bump in the vacancy rate, which
increased to 5.6% from 5.5% the previous quarter. This rate is a drop from the vacancy rate of
6.2% recorded during the same quarter a year ago. Vacancy for warehouse/distribution space
citywide is 5.6% with manufacturing space at 4.4%.
More than 1.4 million square feet in 20 buildings came online during the third quarter.
Collectively, all industrial buildings completed to date are currently 37.7% leased and represent
more than 1.6 million square feet of absorption for the year. The largest spec buildings
completed during the third quarter with little preleasing include Interstate Commerce Center’s
two buildings at 416,916 square feet and Mason Ranch Industrial Park Building 1 at 373,860
square feet. All other completed spec buildings were smaller than 100,000 square feet.
Construction activity is still high and may get higher with over 31 proposed properties,
half of which are planned for more than 100,000 square feet. Currently, 66 buildings are
underway in 50 projects representing almost 10.4 million square feet. Major spec projects
without major preleasing include the newest project, Bay Area Business Park Phase II’s
6

829,805 square feet, Fallbrook Pines’ 560,312 square feet, Fallbrook 1 Pinto Business Park’s
500,400 square feet, Bayou Bend Business Park’s Phase II with 378,380 square feet, and
several recent projects that broke ground in the Southwest. The two largest BTS projects
remain Daiken’s 4 million square foot facility off Highway 290 and FMC’s new project at
Generation Park in the Northeast.
Rental rates have taken a minimal drop this quarter to $7.60 from $7.66 last quarter but
are still 2.7% higher than the $7.40 recorded during the same quarter last year. Rental rates
quoted are grossed up and weighted and averaged based on available space. Most new
buildings are now quoting net rents and passing on the increased taxes and operating costs.
Sublease space has been steadily increasing throughout the year, but only slightly from
last quarter for a current total of 1.9 million square feet. This quarter’s total is an increase of
37.7% from the same quarter a year ago, but is still below square footage totals in 2013 and
back through 2010.
Commercial Gateway Member/Broker Comments on the Houston Industrial Market
John Ferruzzo, SIOR, Partner and Industrial Division Leader, NAI Partners “With the third
quarter complete, we have a large amount of uncertainty about the state of the industrial
market for the final months of 2015. Many people experienced the ‘summer lull’ for the
first time in a number of years and optimism has quickly faded. The vibrant market we
have seen over the past 3 to 5 years is starting to feel a little like 2009, but the
fundamentals are much stronger and there is no need to hit the panic button.
“Most brokers in all property types are seeing plenty of demand, yet the velocity of deal
closings has slowed down. Buyers and tenants are being prudent and not rushing to
make quick decisions. The disconnect between both sides of the negotiating table is
getting larger as users see ‘blood in the water’, while owners are not yet in that mindset.
This could change as over 5 million square feet of spec space is finishing the
construction stage and landlords will compete for fewer tenants to lease these
buildings. There are plenty of negatives in the current state of the industrial market, yet
deals are still getting done. We may see some bumps in the road over the next 12
months, but Houston will continue to be one of the strongest industrial markets in the
country.”
7

Jon Lindenberger, CCIM, SIOR, Senior Vice President, Colliers International “The price of
oil is the main topic of conversation in Houston and how it will affect the industrial
market. Vacancy rates for all markets are still below 5% except for North and Northwest
Houston. We saw a healthy absorption of 1.58 million square feet absorbed citywide.
“We do need to keep a close eye on the Northwest market, as 4.3 million square feet is
slated for construction with only 526,656 square feet of absorption this past quarter. In
the past, Northwest Houston has been the choice market for development; now the
Northeast Corridor and Southeast Corridor are dominating with vacancy less than 3%.
We expect developers to continue to find land plays in these tight markets.”
“Look for landlords to get creative in the North and Northwest markets by offering rent
concessions and additional tenant improvement packages for credit tenants. Rental
rates should continue to stay consistent as most developers and institutional owners
have capital to weather the storm over the course of the next few months.”
Mark G. Nicholas, SIOR, Executive Vice President Regional Director-Brokerage, JLL
Houston “Actually we are finally seeing a slow down for the first time on both the
industrial side and land side.
“With more “spec” product completed and available, options are not as limited. Rents
have stabilized with some rent concessions from select properties helping tenants to
make decisions and move forward.
“We are still seeing some mergers, acquisitions and consolidations, with the latter
moving toward corporate, campus-style facilities. The east side is especially busy with
lots of activity due to the increased petrochemical facilities there. East Houston is by far
seeing the most activity with close to 4 million square feet of new buildings under
construction and proposed or planned.
“Buyers and tenants alike want a “shovel-ready” site that has utilities and detention in
place, preferring to take down the property sooner rather than later. Despite the plunge
in oil prices, the industrial/land market is still very active in select markets.”
Founded in 2001, Commercial Gateway, the commercial division of the Houston Association of Realtors (HAR), is a commercial information exchange of commercial real estate professionals engaged in every aspect of property sales and leasing, appraisal, property management and counseling.
###
8

No. Vacant Vacancy Net Absorption Under Wted Avg SubleaseClass Bldgs * Bldg SF ** SF Rate Current YTD Construction Rent *** Avail
Central Business District
A 33 30,931,033 3,063,559 9.9 % (149,637) (519,328) 1,635,000 $39.66 968,818
B 29 8,914,113 2,191,785 24.6 % (1,293,144) (1,254,724) 0 $29.64 305,378
C 8 748,896 92,511 12.4 % (275) 47,799 0 $19.22 1,427
Central Business District Subtotal
70 40,594,042 5,347,855 13.2 % (1,443,056) (1,726,253) 1,635,000 $35.20 1,275,623
Energy Corridor
A 43 13,727,928 1,651,807 12.0 % 377,985 674,370 1,664,801 $28.67 1,085,614
B 55 5,347,374 875,321 16.4 % (208,490) (339,645) 0 $24.23 586,498
C 8 393,192 18,790 4.8 % 0 (13,272) 0 $24.22 0
Energy Corridor Subtotal 106 19,468,494 2,545,918 13.1 % 169,495 321,453 1,664,801 $27.11 1,672,112
Fort Bend County
A 40 4,162,783 378,642 9.1 % 14,325 20,295 133,500 $28.27 147,473
B 19 1,195,530 102,452 8.6 % 42,381 43,180 0 $22.10 0
C 2 245,182 47,097 19.2 % (16,722) (14,639) 0 $17.83 0
Fort Bend County Subtotal 61 5,603,495 528,191 9.4 % 39,984 48,836 133,500 $26.14 147,473
Greenspoint
A 32 5,090,260 1,352,059 26.6 % (91,324) (413,864) 68,950 $22.39 392,109
B 41 4,555,039 1,590,463 34.9 % (105,288) (431,499) 0 $17.91 255,558
C 28 2,167,820 466,250 21.5 % (2,423) 71,860 0 $12.33 0
Greenspoint Subtotal 101 11,813,119 3,408,772 28.9 % (199,035) (773,503) 68,950 $18.92 647,667
Inner Loop
A 36 10,401,003 1,034,178 9.9 % 75,526 (250,915) 412,000 $31.62 66,891
B 102 10,617,550 1,304,543 12.3 % (16,555) (198,098) 0 $27.27 39,935
C 74 4,428,394 416,219 9.4 % (11,171) (22,437) 0 $18.32 10,148
Inner Loop Subtotal 212 25,446,947 2,754,940 10.8 % 47,800 (471,450) 412,000 $27.55 116,974
North/The Woodlands/Conroe
A 83 10,861,183 515,003 4.7 % 27,721 2,086,058 1,391,707 $33.20 248,574
B 76 4,669,910 826,649 17.7 % 47,933 (46,809) 0 $17.63 83,097
C 32 1,136,292 134,796 11.9 % 30,071 48,792 0 $13.21 0
North/The Woodlands/Conroe Subtotal
191 16,667,385 1,476,448 8.9 % 105,725 2,088,041 1,391,707 $22.66 331,671
Northeast
A 6 51,670 7,630 14.8 % 0 0 360,000 $25.50 0
B 17 731,811 87,121 11.9 % (9,753) (7,898) 0 $18.12 2,087
C 6 243,603 80,172 32.9 % (11,147) (11,147) 0 $15.38 0
Northeast Subtotal 29 1,027,084 174,923 17.0 % (20,900) (19,045) 360,000 $17.18 2,087
Northwest
A 41 4,513,888 704,328 15.6 % 69,182 504,029 247,171 $23.26 253,413
B 61 5,656,709 1,097,990 19.4 % 74,375 42,714 0 $19.43 61,394
C 22 833,110 130,128 15.6 % 13,347 13,347 0 $18.37 0
Northwest Subtotal 124 11,003,707 1,932,446 17.6 % 156,904 560,090 247,171 $20.75 314,807
© Copyright 2015 Commercial Gateway, the Commercial Division of the Houston Association of REALTORS ®This information has been compiled from various sources and is provided without guarantee or warranty.
Houston-Area Office Market Summary2015 Third Quarter
9

*** Rental rates weighted and averaged based on available space.
** Includes all general-purpose existing office buildings 20,000 square feet or larger.* Number of buildings calculated on specific buildings at each property address.
No. Vacant Vacancy Net Absorption Under Wted Avg SubleaseClass Bldgs * Bldg SF ** SF Rate Current YTD Construction Rent *** Avail
Southeast
A 18 2,057,376 259,565 12.6 % (2,590) (49,416) 0 $29.02 37,320
B 56 3,591,095 594,090 16.5 % 72,303 (38,457) 0 $18.67 1,311
C 47 2,011,292 370,833 18.4 % (1,313) 21,586 0 $16.87 26,330
Southeast Subtotal 121 7,659,763 1,224,488 16.0 % 68,400 (66,287) 0 $20.32 64,961
Southwest
A 5 1,227,586 402,695 32.8 % 3,454 28,275 0 $22.64 0
B 48 5,976,693 1,327,878 22.2 % 309,346 340,890 0 $17.48 8,703
C 84 5,117,259 430,500 8.4 % 197,707 254,370 0 $13.42 0
Southwest Subtotal 137 12,321,538 2,161,073 17.5 % 510,507 623,535 0 $17.63 8,703
Uptown
A 47 17,825,074 2,310,893 13.0 % 259,661 (41,910) 1,216,824 $39.03 313,711
B 79 10,162,138 1,167,269 11.5 % 31,734 (94,671) 0 $26.31 458,530
C 18 1,133,574 86,960 7.7 % 12,408 27,174 0 $16.25 0
Uptown Subtotal 144 29,120,786 3,565,122 12.2 % 303,803 (109,407) 1,216,824 $34.31 772,241
West
A 52 8,592,271 1,098,984 12.8 % 125,427 1,324,636 919,492 $27.88 194,105
B 39 3,167,821 252,778 8.0 % (17,887) 170,665 0 $18.10 18,196
C 38 2,568,814 72,956 2.8 % 6,945 13,684 0 $14.65 7,541
West Subtotal 129 14,328,906 1,424,718 9.9 % 114,485 1,508,985 919,492 $25.47 219,842
Westchase
A 33 8,954,144 743,494 8.3 % (26,823) (129,426) 1,517,000 $33.91 100,050
B 51 6,837,702 957,626 14.0 % 37,448 87,282 0 $22.52 68,511
C 19 833,516 90,546 10.9 % 79,963 84,620 0 $17.40 0
Westchase Subtotal 103 16,625,362 1,791,666 10.8 % 90,588 42,476 1,517,000 $26.98 168,561
Suburban
A 436 87,465,166 10,459,278 12.0 % 832,544 3,752,132 7,931,445 $30.35 2,839,260
B 644 62,509,372 10,184,180 16.3 % 257,547 (472,346) 0 $21.23 1,583,820
C 378 21,112,048 2,345,247 11.1 % 297,665 473,938 0 $15.42 44,019
Suburban Subtotal 1,458 171,086,586 22,988,705 13.4 % 1,387,756 3,753,724 7,931,445 $24.78 4,467,099
Houston-Area
A 469 118,396,199 13,522,837 11.4 % 682,907 3,232,804 9,566,445 $32.46 3,808,078
B 673 71,423,485 12,375,965 17.3 % (1,035,597) (1,727,070) 0 $22.72 1,889,198
C 386 21,860,944 2,437,758 11.2 % 297,390 521,737 0 $15.57 45,446
Houston-Area Total 1,528 211,680,628 28,336,560 13.4 % (55,300) 2,027,471 9,566,445 $26.93 5,742,722
© Copyright 2015 Commercial Gateway, the Commercial Division of the Houston Association of REALTORS ®This information has been compiled from various sources and is provided without guarantee or warranty.
Houston-Area Office Market Summary2015 Third Quarter
10
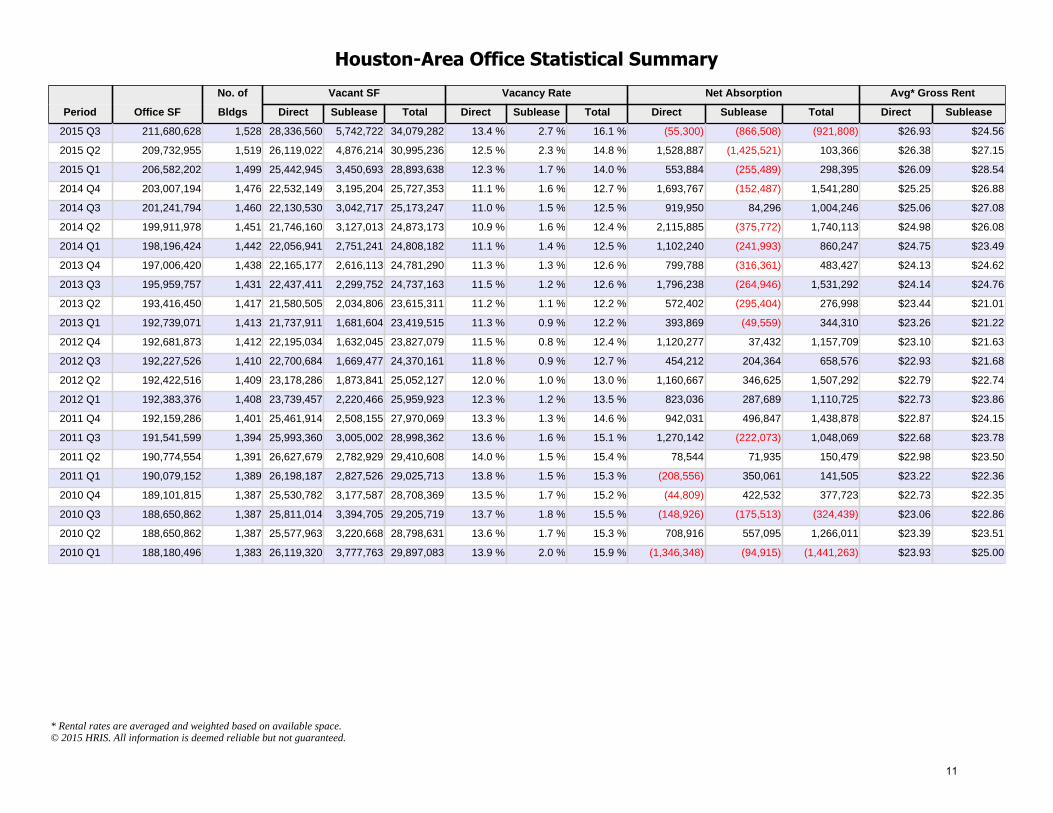
No. of Vacant SF Vacancy Rate Net Absorption Avg* Gross Rent
Period Office SF Bldgs Direct Sublease Total Direct Sublease Total Direct Sublease Total Direct Sublease
2015 Q3 211,680,628 1,528 28,336,560 5,742,722 34,079,282 13.4 % 2.7 % 16.1 % (55,300) (866,508) (921,808) $26.93 $24.56
2015 Q2 209,732,955 1,519 26,119,022 4,876,214 30,995,236 12.5 % 2.3 % 14.8 % 1,528,887 (1,425,521) 103,366 $26.38 $27.15
2015 Q1 206,582,202 1,499 25,442,945 3,450,693 28,893,638 12.3 % 1.7 % 14.0 % 553,884 (255,489) 298,395 $26.09 $28.54
2014 Q4 203,007,194 1,476 22,532,149 3,195,204 25,727,353 11.1 % 1.6 % 12.7 % 1,693,767 (152,487) 1,541,280 $25.25 $26.88
2014 Q3 201,241,794 1,460 22,130,530 3,042,717 25,173,247 11.0 % 1.5 % 12.5 % 919,950 84,296 1,004,246 $25.06 $27.08
2014 Q2 199,911,978 1,451 21,746,160 3,127,013 24,873,173 10.9 % 1.6 % 12.4 % 2,115,885 (375,772) 1,740,113 $24.98 $26.08
2014 Q1 198,196,424 1,442 22,056,941 2,751,241 24,808,182 11.1 % 1.4 % 12.5 % 1,102,240 (241,993) 860,247 $24.75 $23.49
2013 Q4 197,006,420 1,438 22,165,177 2,616,113 24,781,290 11.3 % 1.3 % 12.6 % 799,788 (316,361) 483,427 $24.13 $24.62
2013 Q3 195,959,757 1,431 22,437,411 2,299,752 24,737,163 11.5 % 1.2 % 12.6 % 1,796,238 (264,946) 1,531,292 $24.14 $24.76
2013 Q2 193,416,450 1,417 21,580,505 2,034,806 23,615,311 11.2 % 1.1 % 12.2 % 572,402 (295,404) 276,998 $23.44 $21.01
2013 Q1 192,739,071 1,413 21,737,911 1,681,604 23,419,515 11.3 % 0.9 % 12.2 % 393,869 (49,559) 344,310 $23.26 $21.22
2012 Q4 192,681,873 1,412 22,195,034 1,632,045 23,827,079 11.5 % 0.8 % 12.4 % 1,120,277 37,432 1,157,709 $23.10 $21.63
2012 Q3 192,227,526 1,410 22,700,684 1,669,477 24,370,161 11.8 % 0.9 % 12.7 % 454,212 204,364 658,576 $22.93 $21.68
2012 Q2 192,422,516 1,409 23,178,286 1,873,841 25,052,127 12.0 % 1.0 % 13.0 % 1,160,667 346,625 1,507,292 $22.79 $22.74
2012 Q1 192,383,376 1,408 23,739,457 2,220,466 25,959,923 12.3 % 1.2 % 13.5 % 823,036 287,689 1,110,725 $22.73 $23.86
2011 Q4 192,159,286 1,401 25,461,914 2,508,155 27,970,069 13.3 % 1.3 % 14.6 % 942,031 496,847 1,438,878 $22.87 $24.15
2011 Q3 191,541,599 1,394 25,993,360 3,005,002 28,998,362 13.6 % 1.6 % 15.1 % 1,270,142 (222,073) 1,048,069 $22.68 $23.78
2011 Q2 190,774,554 1,391 26,627,679 2,782,929 29,410,608 14.0 % 1.5 % 15.4 % 78,544 71,935 150,479 $22.98 $23.50
2011 Q1 190,079,152 1,389 26,198,187 2,827,526 29,025,713 13.8 % 1.5 % 15.3 % (208,556) 350,061 141,505 $23.22 $22.36
2010 Q4 189,101,815 1,387 25,530,782 3,177,587 28,708,369 13.5 % 1.7 % 15.2 % (44,809) 422,532 377,723 $22.73 $22.35
2010 Q3 188,650,862 1,387 25,811,014 3,394,705 29,205,719 13.7 % 1.8 % 15.5 % (148,926) (175,513) (324,439) $23.06 $22.86
2010 Q2 188,650,862 1,387 25,577,963 3,220,668 28,798,631 13.6 % 1.7 % 15.3 % 708,916 557,095 1,266,011 $23.39 $23.51
2010 Q1 188,180,496 1,383 26,119,320 3,777,763 29,897,083 13.9 % 2.0 % 15.9 % (1,346,348) (94,915) (1,441,263) $23.93 $25.00
* Rental rates are averaged and weighted based on available space.© 2015 HRIS. All information is deemed reliable but not guaranteed.
Houston-Area Office Statistical Summary
11

Class A Class B Class C All Classes
2015 Q3 682,907 (1,035,597) 297,390 (55,300)
Q2 1,676,367 (187,750) 40,270 1,528,887
Q1 873,530 (503,723) 184,077 553,884
2014 Q4 1,427,302 268,774 (2,309) 1,693,767
Q3 955,886 (133,200) 97,264 919,950
Q2 1,948,587 171,026 (3,728) 2,115,885
Q1 987,099 165,203 (50,062) 1,102,240
2013 Q4 608,883 272,608 (81,703) 799,788
Q3 1,809,844 76,501 (90,107) 1,796,238
Q2 836,376 (82,036) (181,938) 572,402
Q1 229,455 235,552 (71,138) 393,869
2012 Q4 566,957 639,219 (85,899) 1,120,277
Q3 405,430 18,446 30,336 454,212
Q2 1,066,677 63,081 30,909 1,160,667
Q1 43,439 645,798 133,799 823,036
2011 Q4 793,753 65,449 82,829 942,031
Q3 1,457,485 (222,599) 35,256 1,270,142
Q2 218,266 (130,246) (9,476) 78,544
Q1 195,659 (428,686) 24,471 (208,556)
2010 Q4 416,133 (337,040) (123,902) (44,809)
Q3 526,692 (724,927) 49,309 (148,926)
Q2 524,438 135,506 48,972 708,916
Q1 (224,705) (960,759) (160,884) (1,346,348)
Absorption square footage includes only net absorption for direct space; sublease space is excluded.© 2015 HRIS. All rights reserved. All information is deemed reliable but is not guaranteed.
Houston-Area Office Absorption by Class by Quarter
12

Class A Class B Class C All Classes
2015 YTD 3,232,804 (1,727,070) 521,737 2,027,471
2014 YTD 5,318,874 471,803 41,165 5,831,842
2013 YTD 3,484,558 502,625 (424,886) 3,562,297
2012 YTD 2,082,503 1,366,544 109,145 3,558,192
2011 YTD 2,665,163 (716,082) 133,080 2,082,161
2010 YTD 1,242,558 (1,887,220) (186,505) (831,167)
Absorption square footage includes only net absorption for direct space; sublease space is excluded.© HRIS. All rights reserved. All information is deemed reliable but is not guaranteed.
Houston-Area Office Absorption by Class by Year
13

* Gross rental rates are averaged and weighted based on available space.© 2015 HRIS. All rights reserved. All information is deemed reliable but is not guaranteed.
Houston-Area Office Vacancy and Rental Rates* by Quarter
14

Year-end numbers. *Gross rental rates are averaged and weighted based on available space.© 2015 HRIS. All rights reserved. All information is deemed reliable but is not guaranteed.
Houston-Area Office Vacancy and Rental Rates* by Year
15
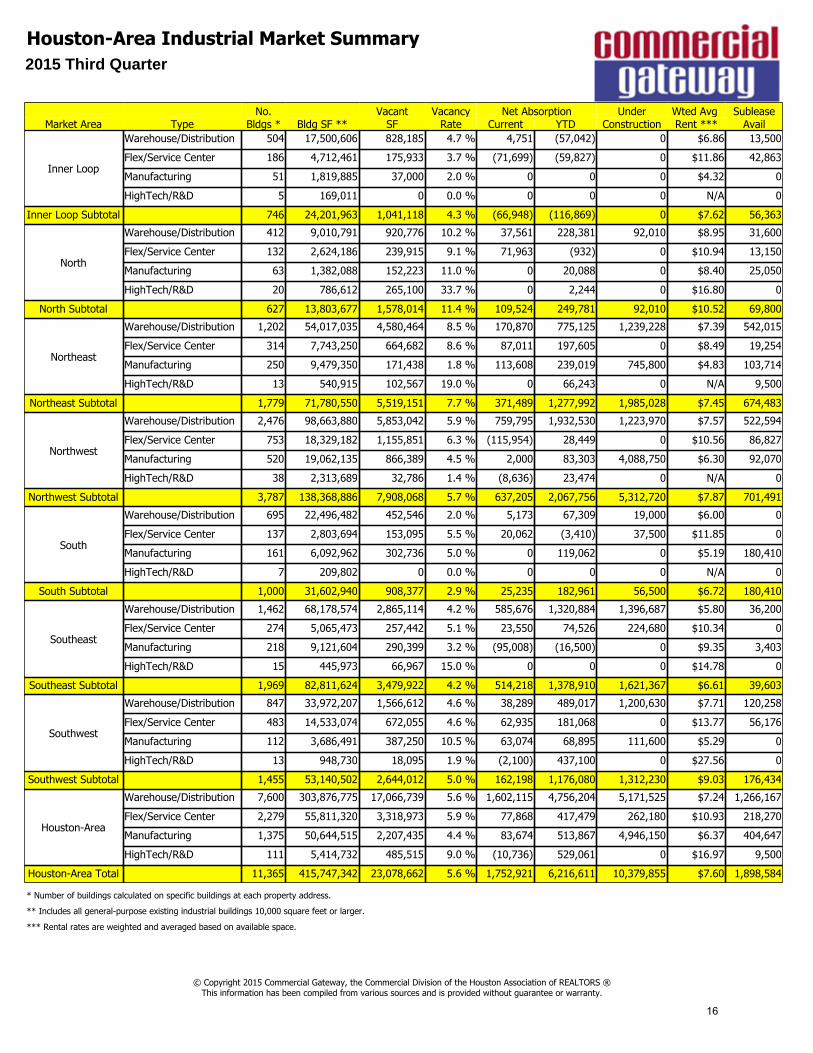
No. Vacant Vacancy Net Absorption Under Wted Avg SubleaseMarket Area Type Bldgs * Bldg SF ** SF Rate Current YTD Construction Rent *** Avail
Inner Loop
Warehouse/Distribution 504 17,500,606 828,185 4.7 % 4,751 (57,042) 0 $6.86 13,500
Flex/Service Center 186 4,712,461 175,933 3.7 % (71,699) (59,827) 0 $11.86 42,863
Manufacturing 51 1,819,885 37,000 2.0 % 0 0 0 $4.32 0
HighTech/R&D 5 169,011 0 0.0 % 0 0 0 N/A 0
Inner Loop Subtotal 746 24,201,963 1,041,118 4.3 % (66,948) (116,869) 0 $7.62 56,363
North
Warehouse/Distribution 412 9,010,791 920,776 10.2 % 37,561 228,381 92,010 $8.95 31,600
Flex/Service Center 132 2,624,186 239,915 9.1 % 71,963 (932) 0 $10.94 13,150
Manufacturing 63 1,382,088 152,223 11.0 % 0 20,088 0 $8.40 25,050
HighTech/R&D 20 786,612 265,100 33.7 % 0 2,244 0 $16.80 0
North Subtotal 627 13,803,677 1,578,014 11.4 % 109,524 249,781 92,010 $10.52 69,800
Northeast
Warehouse/Distribution 1,202 54,017,035 4,580,464 8.5 % 170,870 775,125 1,239,228 $7.39 542,015
Flex/Service Center 314 7,743,250 664,682 8.6 % 87,011 197,605 0 $8.49 19,254
Manufacturing 250 9,479,350 171,438 1.8 % 113,608 239,019 745,800 $4.83 103,714
HighTech/R&D 13 540,915 102,567 19.0 % 0 66,243 0 N/A 9,500
Northeast Subtotal 1,779 71,780,550 5,519,151 7.7 % 371,489 1,277,992 1,985,028 $7.45 674,483
Northwest
Warehouse/Distribution 2,476 98,663,880 5,853,042 5.9 % 759,795 1,932,530 1,223,970 $7.57 522,594
Flex/Service Center 753 18,329,182 1,155,851 6.3 % (115,954) 28,449 0 $10.56 86,827
Manufacturing 520 19,062,135 866,389 4.5 % 2,000 83,303 4,088,750 $6.30 92,070
HighTech/R&D 38 2,313,689 32,786 1.4 % (8,636) 23,474 0 N/A 0
Northwest Subtotal 3,787 138,368,886 7,908,068 5.7 % 637,205 2,067,756 5,312,720 $7.87 701,491
South
Warehouse/Distribution 695 22,496,482 452,546 2.0 % 5,173 67,309 19,000 $6.00 0
Flex/Service Center 137 2,803,694 153,095 5.5 % 20,062 (3,410) 37,500 $11.85 0
Manufacturing 161 6,092,962 302,736 5.0 % 0 119,062 0 $5.19 180,410
HighTech/R&D 7 209,802 0 0.0 % 0 0 0 N/A 0
South Subtotal 1,000 31,602,940 908,377 2.9 % 25,235 182,961 56,500 $6.72 180,410
Southeast
Warehouse/Distribution 1,462 68,178,574 2,865,114 4.2 % 585,676 1,320,884 1,396,687 $5.80 36,200
Flex/Service Center 274 5,065,473 257,442 5.1 % 23,550 74,526 224,680 $10.34 0
Manufacturing 218 9,121,604 290,399 3.2 % (95,008) (16,500) 0 $9.35 3,403
HighTech/R&D 15 445,973 66,967 15.0 % 0 0 0 $14.78 0
Southeast Subtotal 1,969 82,811,624 3,479,922 4.2 % 514,218 1,378,910 1,621,367 $6.61 39,603
Southwest
Warehouse/Distribution 847 33,972,207 1,566,612 4.6 % 38,289 489,017 1,200,630 $7.71 120,258
Flex/Service Center 483 14,533,074 672,055 4.6 % 62,935 181,068 0 $13.77 56,176
Manufacturing 112 3,686,491 387,250 10.5 % 63,074 68,895 111,600 $5.29 0
HighTech/R&D 13 948,730 18,095 1.9 % (2,100) 437,100 0 $27.56 0
Southwest Subtotal 1,455 53,140,502 2,644,012 5.0 % 162,198 1,176,080 1,312,230 $9.03 176,434
Houston-Area
Warehouse/Distribution 7,600 303,876,775 17,066,739 5.6 % 1,602,115 4,756,204 5,171,525 $7.24 1,266,167
Flex/Service Center 2,279 55,811,320 3,318,973 5.9 % 77,868 417,479 262,180 $10.93 218,270
Manufacturing 1,375 50,644,515 2,207,435 4.4 % 83,674 513,867 4,946,150 $6.37 404,647
HighTech/R&D 111 5,414,732 485,515 9.0 % (10,736) 529,061 0 $16.97 9,500
Houston-Area Total 11,365 415,747,342 23,078,662 5.6 % 1,752,921 6,216,611 10,379,855 $7.60 1,898,584
* Number of buildings calculated on specific buildings at each property address.
** Includes all general-purpose existing industrial buildings 10,000 square feet or larger.
*** Rental rates are weighted and averaged based on available space.
© Copyright 2015 Commercial Gateway, the Commercial Division of the Houston Association of REALTORS ®This information has been compiled from various sources and is provided without guarantee or warranty.
Houston-Area Industrial Market Summary2015 Third Quarter
16
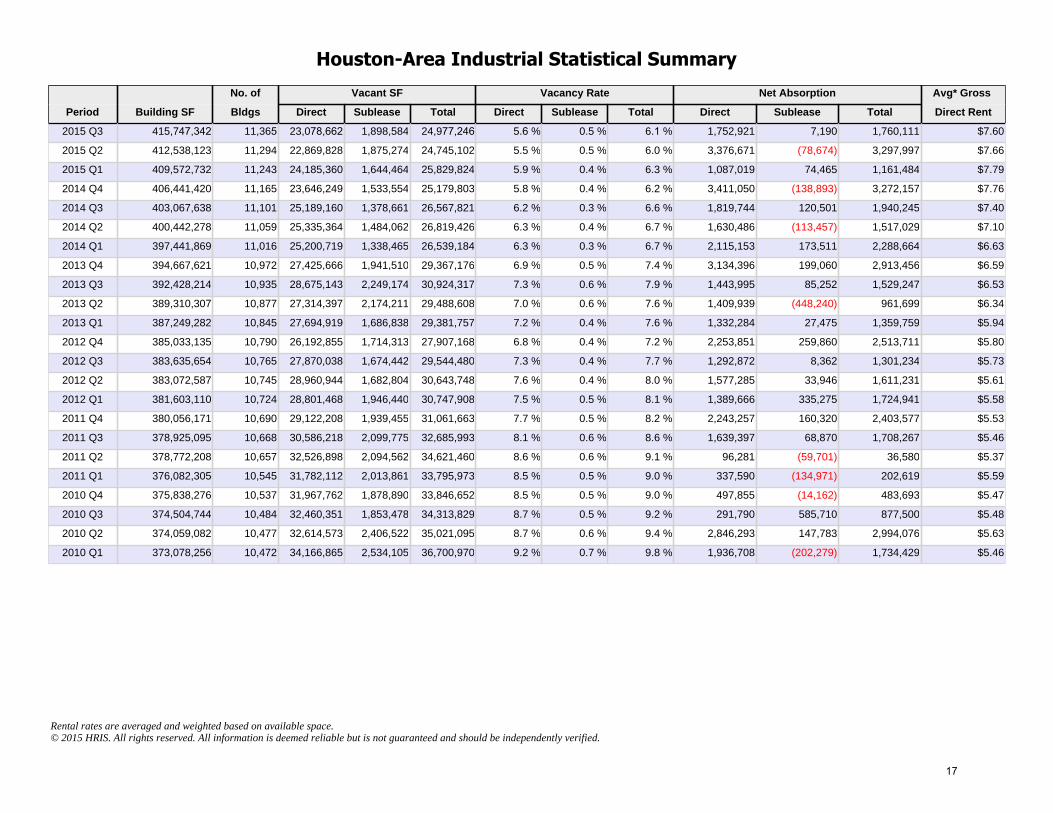
No. of Vacant SF Vacancy Rate Net Absorption Avg* Gross
Period Building SF Bldgs Direct Sublease Total Direct Sublease Total Direct Sublease Total Direct Rent
2015 Q3 415,747,342 11,365 23,078,662 1,898,584 24,977,246 5.6 % 0.5 % 6.1 % 1,752,921 7,190 1,760,111 $7.60
2015 Q2 412,538,123 11,294 22,869,828 1,875,274 24,745,102 5.5 % 0.5 % 6.0 % 3,376,671 (78,674) 3,297,997 $7.66
2015 Q1 409,572,732 11,243 24,185,360 1,644,464 25,829,824 5.9 % 0.4 % 6.3 % 1,087,019 74,465 1,161,484 $7.79
2014 Q4 406,441,420 11,165 23,646,249 1,533,554 25,179,803 5.8 % 0.4 % 6.2 % 3,411,050 (138,893) 3,272,157 $7.76
2014 Q3 403,067,638 11,101 25,189,160 1,378,661 26,567,821 6.2 % 0.3 % 6.6 % 1,819,744 120,501 1,940,245 $7.40
2014 Q2 400,442,278 11,059 25,335,364 1,484,062 26,819,426 6.3 % 0.4 % 6.7 % 1,630,486 (113,457) 1,517,029 $7.10
2014 Q1 397,441,869 11,016 25,200,719 1,338,465 26,539,184 6.3 % 0.3 % 6.7 % 2,115,153 173,511 2,288,664 $6.63
2013 Q4 394,667,621 10,972 27,425,666 1,941,510 29,367,176 6.9 % 0.5 % 7.4 % 3,134,396 199,060 2,913,456 $6.59
2013 Q3 392,428,214 10,935 28,675,143 2,249,174 30,924,317 7.3 % 0.6 % 7.9 % 1,443,995 85,252 1,529,247 $6.53
2013 Q2 389,310,307 10,877 27,314,397 2,174,211 29,488,608 7.0 % 0.6 % 7.6 % 1,409,939 (448,240) 961,699 $6.34
2013 Q1 387,249,282 10,845 27,694,919 1,686,838 29,381,757 7.2 % 0.4 % 7.6 % 1,332,284 27,475 1,359,759 $5.94
2012 Q4 385,033,135 10,790 26,192,855 1,714,313 27,907,168 6.8 % 0.4 % 7.2 % 2,253,851 259,860 2,513,711 $5.80
2012 Q3 383,635,654 10,765 27,870,038 1,674,442 29,544,480 7.3 % 0.4 % 7.7 % 1,292,872 8,362 1,301,234 $5.73
2012 Q2 383,072,587 10,745 28,960,944 1,682,804 30,643,748 7.6 % 0.4 % 8.0 % 1,577,285 33,946 1,611,231 $5.61
2012 Q1 381,603,110 10,724 28,801,468 1,946,440 30,747,908 7.5 % 0.5 % 8.1 % 1,389,666 335,275 1,724,941 $5.58
2011 Q4 380,056,171 10,690 29,122,208 1,939,455 31,061,663 7.7 % 0.5 % 8.2 % 2,243,257 160,320 2,403,577 $5.53
2011 Q3 378,925,095 10,668 30,586,218 2,099,775 32,685,993 8.1 % 0.6 % 8.6 % 1,639,397 68,870 1,708,267 $5.46
2011 Q2 378,772,208 10,657 32,526,898 2,094,562 34,621,460 8.6 % 0.6 % 9.1 % 96,281 (59,701) 36,580 $5.37
2011 Q1 376,082,305 10,545 31,782,112 2,013,861 33,795,973 8.5 % 0.5 % 9.0 % 337,590 (134,971) 202,619 $5.59
2010 Q4 375,838,276 10,537 31,967,762 1,878,890 33,846,652 8.5 % 0.5 % 9.0 % 497,855 (14,162) 483,693 $5.47
2010 Q3 374,504,744 10,484 32,460,351 1,853,478 34,313,829 8.7 % 0.5 % 9.2 % 291,790 585,710 877,500 $5.48
2010 Q2 374,059,082 10,477 32,614,573 2,406,522 35,021,095 8.7 % 0.6 % 9.4 % 2,846,293 147,783 2,994,076 $5.63
2010 Q1 373,078,256 10,472 34,166,865 2,534,105 36,700,970 9.2 % 0.7 % 9.8 % 1,936,708 (202,279) 1,734,429 $5.46
Rental rates are averaged and weighted based on available space.© 2015 HRIS. All rights reserved. All information is deemed reliable but is not guaranteed and should be independently verified.
Houston-Area Industrial Statistical Summary
17

Flex/Service Center Manufacturing
Warehouse/Distribution HighTech/R&D All Types
2015 Q3 94,067 184,682 1,484,908 (10,736) 1,752,921Q2 287,573 140,275 2,831,124 117,699 3,376,671Q1 35,839 188,910 440,172 422,098 1,087,019
2014 Q4 462,804 (143,098) 3,080,075 11,269 3,411,050Q3 125,904 408,958 1,278,932 5,950 1,819,744Q2 184,611 252,390 1,224,798 (31,313) 1,630,486Q1 169,999 486,848 1,436,300 22,006 2,115,153
2013 Q4 (197,531) 51,980 3,284,777 (4,830) 3,134,396Q3 164,712 65,704 1,172,153 41,426 1,443,995Q2 (10,307) (63,405) 1,646,883 (163,232) 1,409,939Q1 85,507 294,045 945,439 7,293 1,332,284
2012 Q4 144,932 268,394 1,696,686 143,839 2,253,851Q3 352,450 105,257 1,028,045 (192,880) 1,292,872Q2 153,636 44,180 1,517,731 (138,262) 1,577,285Q1 3,772 301,350 1,079,046 5,498 1,389,666
2011 Q4 (48,612) 537,804 1,909,691 (155,626) 2,243,257Q3 (146,515) 90,211 1,694,551 1,150 1,639,397Q2 (245,108) 29,313 416,515 (104,439) 96,281Q1 123,407 (46,076) 109,659 150,600 337,590
2010 Q4 188,845 (66,290) 111,141 264,159 497,855Q3 193,813 (113,250) 211,436 (209) 291,790Q2 376,345 351,499 2,151,996 (33,547) 2,846,293Q1 (12,387) 42,018 1,889,252 17,825 1,936,708
Absorption square footage includes only net absorption for direct space; sublease space is excluded. © 2015 HRIS. All rights reserved. All information is deemed reliable but is not guaranteed and should be independently verified.
Houston-Area Industrial Absorption by Type by Quarter
18

Flex/Service Center Manufacturing
Warehouse/Distribution HighTech/R&D All Types
2015 YTD 417,479 513,867 4,756,204 529,061 6,216,611
2014 943,318 1,005,098 7,020,105 7,912 8,976,433
2013 42,381 348,324 7,049,252 (119,343) 7,320,614
2012 654,790 719,181 5,321,508 (181,805) 6,513,674
2011 (316,828) 611,252 4,130,416 (108,315) 4,316,525
2010 746,616 213,977 4,363,825 248,228 5,572,646
Absorption square footage includes only net absorption for direct space; sublease space is excluded.© 2015 HRIS. All rights reserved. All information is deemed reliable but is not guaranteed and should be independently verified.
Houston-Area Industrial Absorption by Type by Year
19

* Gross rental rates are averaged and weighted based on available space.© 2015 HRIS. All rights reserved. All information is deemed reliable but is not guaranteed and should be independently verified.
Houston-Area Industrial Vacancy and Rental Rates* by Quarter
20

Year-end numbers. *Gross rental rates are averaged and weighted based on available space.© 2015 HRIS. All rights reserved. All information is deemed reliable but is not guaranteed and should be independently verified.
Houston-Area Industrial Vacancy and Rental Rates* by Year
21

Quarterly Market Overview Second Quarter 2015 FOR IMMEDIATE RELEASE
For more information, please contact: David Mendel, Public Relations Manager Phone: 713.629.1900 ext. 258 E‐mail: [email protected]
HOUSTON’S SECOND-QUARTER COMMERCIAL ACTIVITY
REFLECTS CHANGING ECONOMY
HOUSTON — (July 21, 2015) — Houston’s commercial real estate activity continues at
a steady albeit slower pace as the market adjusts to changing economic factors, according to
quarterly market research compiled by Commercial Gateway, the commercial division of the
Houston Association of Realtors.
The second quarter reported direct office net absorption of almost 1.7 million square
feet, representing the 17th consecutive quarter of positive absorption with a mid-year total of
more than 2.1 million square feet of direct net absorption. As in previous years, Class A
properties represent the bulk of the growth, almost 1.7 million square feet of positive absorption,
offset by Class B properties reporting a negative 174,306 square feet; Class C properties
reported 136,270 square feet of positive absorption.
Keeping the direct absorption positive primarily results from large companies occupying
their new space in recently completed build-to-suit and/or owner-occupied properties. The
largest at 1 million square feet represents the third and final move-in phase for ExxonMobil
(which represents 2 million for the year) followed by Noble Energy’s 456,000 square-foot move.
Other major moveins include GE Electric, 150,000 square feet in Westway Plaza; Sasol,
171,475 square feet in Woodbranch Plaza IV; Air Liquide, 145,000 in its new Memorial City
building; and Nabors Industry, 98,400 square feet in Commerce Green. Only five submarkets
recorded positive direct net absorption for the second quarter, and four of the five are attributed
to large moveins, while the Southwest submarket saw more small positive deals than negative
ones.
On the other side are the direct vacancies resulting from several company move-outs,
which turned some key submarkets to experience negative absorption. These move-outs
include BP in two Four Oaks Place buildings and one in the West, GE moving out of Park
Towers, Repsol vacating its space in 2001 Timberloch and Southwestern Energy and
ExxonMobil vacating their former spaces in the Greenspoint submarket.
Page 1

The changing economy related to the oil and gas downturn is also shown by the
increasing amounts of sublease space on the market; and when that sublease space enters the
picture, the absorption totals do change dramatically. However, sublease space appears on the
market for many reasons including downsizing and consolidations, but rent is usually being paid
for the space whether it is occupied or vacant. And that situation could easily change if a
company’s business volume changes. At the end of the second quarter, the Houston market
currently has more than 5 million square feet of sublease space available, and another 1 to 2
million square feet being marketed but not yet available – with almost half Class A space. This
total represents almost double the same period last year. Firms looking to move or expand will
be able to take advantage of reduced rates with limited terms, which could affect both the
overall leasing activity for the new buildings being completed in the next two years and certainly
could play a factor in delaying the starts of new buildings.
For the quarter, 10 new buildings were completed, adding almost 3.2 million square feet
to the market. The new buildings, including five owner-occupied or single-tenant, contributed
almost 2.2 million square feet of absorption. Upon completion, the new properties collectively
were almost 81.2% leased with rental rates averaging $32.70, marginally less than the overall
Class A rate of $32.88. The largest building completed this quarter was Trammell Crow’s
Energy Center Three at 546,604 square feet, which is 100% leased by ConocoPhilips with
movein scheduled for August.
Other than those noted above, the largest multi-tenant building to be completed this
quarter was Westway Plaza at 314,000 square feet, which was totally pre-leased to three
tenants. The second largest multi-tenant building to be completed this quarter and 15%
preleased was Legacy at Fallbrook, Liberty Property’s 206,754-square-foot property in the
Northwest at 10720 West Sam Houston Parkway North.
Construction starts halted to just one new building started in the second quarter:
Wildwood Corporate Center II in the north. However, two new buildings, one by MetroNational
in Memorial City for Cemex and one in Pearland, were just announced with construction starts
scheduled for the fall. Overall, the Houston under-construction office market boasts 36
properties with 38 buildings totaling almost 11.2 million square feet. Collectively, the under-
construction buildings are 50% preleased, with 24 properties classified as multi-tenant. The
multi-tenant properties represent almost 6.9 million square feet or 61.3% of the under-
Page 2

construction total and are currently reporting 20.2% preleased space. Of the multi-tenant spec
properties, 16 of the 24 are less than 10% preleased.
The largest project under construction is Phillips 66’s 1.2 million-square-foot campus in
the Westchase area, while the largest spec building under construction with the largest
availability remains Hines’ 609 Main at Texas building with1.05 million square feet.
The current 12.4% direct vacancy rate is an increase from the 12.3% vacancy recorded
last quarter, and the 10.9% during the same quarter a year ago. Class A space overall is at
10.4% vacancy, with the North/The Woodlands/Conroe submarket showing the lowest Class A
vacancy of 5.0% followed by the Westchase submarket at 6.9% and the Inner Loop submarket
at 8.2%. The West submarket is recording the lowest overall vacancy of all submarkets at
8.2%. Six of the 13 submarkets are recording single-digit vacancies in Class A space, with four
of the 13 boasting single-digit vacancies overall.
Rental rates represent a 6.0% increase during the past year with the current overall
averaged weighted rental rate of $26.49. Class A rates, now at $32.89 citywide and at $40.02 in
the CBD, experienced a slight increase from the same quarter last year. CBD’s Class A rates
increased 3.4% from the same quarter last year. Rates overall have shown increases due to
new space with higher rents entering the market along with increased operating expenses due
to tax jumps. Concessions are reportedly being offered to entice some tenants, but none are
being offered across the board.
Commercial Gateway Member/Broker Comments on the Houston Office Market
Mario A. Arriaga, First Group “With decreased job growth and higher vacancy rates, the
Houston area’s office market is definitely experiencing a slowdown. Large blocks of
direct space and sublease space have been added to the marketplace as many newly
completed buildings come on line and those tenants move from their current offices
while others are downsizing. Mergers and acquisitions are also still big news, and
duplicate facilities are being analyzed to determine what to keep at what cost.
“Leasing activity has dropped considerably. Many companies are delaying decisions
about their office space, some thinking a better deal is in the near future and others are
questioning their own business strategies and growth.
Page 3
“The industrial sector is still going very strong, with firms both expanding and moving into
the Houston area to participate in the growing petrochemical industry along with future
growth related to the Port of Houston and the Panama Canal. Despite the low price of
oil and other economic factors in turmoil, Houston’s industrial market is still considered
one of the healthiest in the country.”
David Baker, Executive Vice President, Houston Operations, Transwestern “In the second
quarter, the multi-tenant office market showed almost 900,000 square feet of positive
absorption while the overall office market was slightly negative. The absorption
continued to be primarily in Class A space. Notwithstanding the downturn in the energy
and manufacturing job base during the first half of the year, the overall office market has
managed to achieve positive absorption of more than 1.6 million square feet for the
year. There are still significant deals in the marketplace, which will be tempered by the
fact that available sublease space continues to increase.”
Jeff Peltier, Senior Associate, Colliers International “The pullback in the oil and gas industry
is creating holes in the Houston office market. Houston's office leasing activity dropped
an astonishing 67.5% in one year, recording only 1.8 million square feet of leasing
activity in the second quarter of 2015, compared to the 5.5 million square feet in Second
Quarter 2014. This lack of leasing velocity combined with an additional 2.1 million
square feet of new inventory delivered in the second quarter is pushing Houston’s
overall vacancy rate from a Second Quarter 2014 number of 11.6% to a now current
14.1% number.
“One of the most talked about sectors of the market is the available sublease space,
which totals 7.4 million square feet, or 3.3% of Houston's total office inventory. Houston's
available sublease space has almost doubled in the last 12 months, providing
discounted options to tenants with leases expiring in the near future. That being said, it
doesn’t help that the Houston office market overall posted 525,000 square feet of
negative net absorption (including direct and sublease space) in the second quarter; this
is the first time Houston has posted any negative net absorption in five years, since
Second Quarter 2010.
“Rental rates remain relatively flat despite the softening market; Class B rental rates fell
by 1% in the second quarter, but Class A rates increased by 2.7% in the same quarter to
$42.32 per square foot. New product and new ownership continue to push for steady
Page 4

Class A rates to please investors, but with the price of oil hovering just above $50, one
could wonder how long that could last.”
John Spafford, Executive Vice President, Director of Leasing, PM Realty Group “Houston’s
office leasing market has been one of the most active in the country over the past four
years, but growth has tapered and some softness is occurring due to slower demand
and a flood of new office buildings entering the market.
“In spite of the economic uncertainty, Houston’s office leasing market has held up
relatively well thus far and managed to record positive direct net absorption during the
first half of 2015, with the majority of this growth taking place in new projects recently
delivered. Leasing activity has certainly slowed down from its swift pace seen in recent
years, but it has been largely attributed to the lower volume of lease expirations and
companies delaying their long-term leasing decisions. As a result of the economic
uncertainty, some tenants are opting for short-term leases while others are moving
forward with early lease restructures.
“Houston’s sublease inventory has dramatically risen to nearly 7.5 million square feet,
which accounts for 17.2% of the total space available and 3.5% of the total rentable
inventory. The steady rise of sublease availability has resulted from energy-related
companies temporarily downsizing and offering portions of their leased space while
some have consolidated and relocated to new construction projects delivered in recent
quarters. However, it is important to point out that only 36% of the large contiguous
blocks of sublease space (40,000 square feet or greater) have a term remaining in
excess of 5 years, which makes them less competitive with direct space for most tenants
seeking stability.
“With likely lower employment growth on the horizon, Houston’s office market should
experience reduced direct absorption growth. As a result of the new deliveries and
slower office leasing activity, direct occupancy levels will slightly decline in 2015 but not
enough to significantly impact rents. Asking rental rates are expected to remain flat
during the second-half of 2015, but concessions such as rent abatement and tenant
improvement allowances will be increasing as a result of the added sublease inventory
and existing vacancy. However, with a high volume of leases expiring in 2017 through
2019 and the pent-up demand from tenants delaying office leasing decisions, market
activity is expected to return to increased levels in 2016 and 2017.”
Page 5

Houston Industrial Market
Houston’s industrial market continues to expand with positive direct net absorption of
more than 3.3 million square feet during the second quarter of 2015 despite economic
uncertainty, according to statistics released by Commercial Gateway.
This quarter’s absorption represents the 22nd consecutive quarter – over five years – of
positive absorption, with seven quarters recording more than 2 million square feet each. This
absorption is almost double when compared to the same quarter last year and is clearly a
positive sign in today’s marketplace of energy layoffs and cutbacks.
Major deals recorded during the quarter include McKesson Corporation’s 357,887-
square-foot lease at Duke’s Gateway Northwest One Building; Slay Industries (SI Warehousing)
and GLT Fabricators Inc., both at 100,000 square feet to totally lease up 2902 E. 13th Street;
Frontier Logistics’ 600,000-square-foot move into its new building at 225 Railport; DB
Schenker’s 150,000 square-foot move into its new building at Kenswick AirFreight Center;
Pathmark Transportation’s 76,234-square-foot move into Airtex Industrial Center Building; and
Tesla’s 33,525- square-foot move into DCT’s Airtex Business Center, both in the Greenspoint
area.
Net absorption was shared by all industrial types during the first quarter with warehouse/
distribution properties accounting for the bulk of absorption, 2.9 million square feet or 86.7% of
the total. Flex/service center space represented 237,466 square feet of absorption, or 7.1% of
the total. Manufacturing space accounted for 140,275 square feet, or 4.2% of the total while
high tech/R&D space represented 67,164 square feet, or 2.0% of the total.
The rate of absorption cased the vacancy rate’s slight decrease to 5.6% from 5.9% last
quarter and below the 6.3% of the same quarter a year ago. Vacancy for warehouse/distribution
space citywide is 5.7% with manufacturing space at 4.3%. Houston is still considered one of the
healthiest industrial markets nationwide due to its balance of supply and demand.
More than 1.8 million square feet in 33 buildings came online during the second quarter.
Collectively, the new buildings are currently 41.0% leased and represent about 1.2 million
square feet of absorption, or 36.4% recorded for the quarter. The largest spec buildings
completed during the second quarter and without preleasing include Beltway North Commerce
Building in Greenspoint at 352,680 square feet and DCT’s Northwest Crossroads Building along
Page 6

the North Belt at 320,430 square feet. All other completed spec buildings were smaller than
100,000 square feet with 15 buildings less than 20,000 square feet.
Construction activity is still high and may get higher with over 30 proposed properties,
half of which are planned for more than 100,000 square feet. Currently, 60 buildings are
underway in 55 projects representing more than 10.1 million square feet. Major spec projects
without major preleasing include Fallbrook Pines’ 560,312 square feet, Fallbrook 1 Pinto
Business Park’s 500,400 square feet, Interstate Commerce Center’s 416,930 square feet,
Bayou Bend Business Park’s 378,380 square feet, and Mason Ranch Industrial Park’s 373,860
square feet. The two largest BTS projects include Daiken’s 4 million square foot facility off
Highway 290 and FMC’s new project at Generation Park in the Northeast.
Rental rates have taken a minimal drop this quarter to $7.67 from $7.80 last quarter but
are still 7.9% higher than the $7.11 recorded during the same quarter last year. Rental rates
quoted are grossed up and weighted and averaged based on available space. Most new
buildings are now quoting net rents and passing on the increased taxes and operating costs.
Sublease space increased 14.0% from last quarter to more than 1.8 million square feet.
This quarter’s total is an increase of 26.4% from the same quarter a year ago, but is still below
square footage totals in 2013 and back through 2010.
Commercial Gateway Member/Broker Comments on the Houston Industrial Market
Andrew Jewett, Vice President, Industrial Services, Cresa Houston “Houston’s industrial
market in Houston is starting to see a very small shift in fundamentals as the prolonged
drop in the price of oil continues. However, demand is expected to taper off by year’s
end, regardless of the industrial market remaining largely unaffected by the economy
due to the diversification within the oil and gas industry.
“Going into the quarter most economists were cautiously optimistic, but many have
revised predictions including the number of jobs created in 2016, which has now been
cut significantly. Time will determine the true impact of the reduced job numbers, capital
budgets and exploration expenditures on Houston’s industrial market.
“A soft economy is implied via several economic indicators but in the second quarter,
Houston experienced increases in rental rates and decreases in vacancy year-over-year.
However, leasing activity continued to slow and absorption outpaced development
numbers by a small margin.
Page 7
“East Houston continues to dominate large petrochemical construction projects –
doubling citywide since a year ago – including new chemical plants along with
expansions and improvements to infrastructure. Absorption was positive in most
submarkets but leasing activity slowed to its lowest level since 2006 – signaling declining
fundamentals.
“Leasing activity and absorption numbers were the strongest in the Northwest
submarket, and simultaneously had the largest increases in rental rates. Landlord
concessions will increase in areas with weakening fundamentals to remain competitive
and retain tenants, mainly in west Houston.”
Mark G. Nicholas, SIOR, Executive Vice President and National Director, JLL Houston
“This is the busiest summer I have experienced in my 26 years in the Houston industrial
real estate and land markets. Activity is brisk; we are definitely experiencing a much
better year and summer than expected and seeing continuous and steady business.
“This activity reflects on the diversity of the market. We all know that Houston has
primarily been heavy into oil and gas-related businesses; however, there are so many
other industries relocating here from other parts of America and around the globe, with
existing companies expanding or consolidating their current facilities.
“I’m seeing a range of build-to-suits, leases and sales. Land prices have stabilized
somewhat, maybe even decreased a little from the very high prices of the last couple
years. We now have plenty of “spec” product available in certain markets that rents have
stabilized, with some rent concessions from select properties that have become
important for the tenant to move forward.
“We are still seeing many mergers, acquisitions and consolidations, with the latter
moving toward corporate, campus-style facilities. The east side is especially busy with
lots of activity due to the increasing petrochemical facilities there. We recently closed on
a 10-acre tract in Park 225, which will be the site of a 121,300-square-foot, rear-load,
distribution facility. Almost 35 percent of my business involves land deals.
“Buyers and tenants alike want a “shovel-ready” site that has utilities and detention in
place, preferring to take down the property sooner rather than later. Despite the plunge
in oil prices, the industrial/land market is still very active and alive in Houston.”
Page 8

Founded in 2001, Commercial Gateway, the commercial division of the Houston Association of Realtors (HAR), is a commercial information exchange of commercial real estate professionals engaged in every aspect of property sales and leasing, appraisal, property management and counseling.
###
Page 9

No. Vacant Vacancy Net Absorption Under Wted Avg SubleaseClass Bldgs * Bldg SF ** SF Rate Current YTD Construction Rent *** Avail
Central Business District
A 32 30,652,033 2,633,922 8.6 % 33,398 (369,691) 1,525,000 $40.02 1,076,340
B 29 8,914,113 898,641 10.1 % 48,580 38,420 0 $29.55 471,262
C 8 748,896 92,236 12.3 % 46,091 48,074 0 $19.22 0
Central Business District Subtotal
69 40,315,042 3,624,799 9.0 % 128,069 (283,197) 1,525,000 $36.90 1,547,602
Energy Corridor
A 41 13,091,281 1,167,803 8.9 % 115,579 309,846 1,965,701 $31.33 433,476
B 55 5,347,908 666,831 12.5 % 17,585 (131,155) 0 $24.44 523,689
C 8 393,192 18,790 4.8 % (6,940) (13,272) 0 $24.22 0
Energy Corridor Subtotal 104 18,832,381 1,853,424 9.8 % 126,224 165,419 1,965,701 $28.78 957,165
Fort Bend County
A 40 4,162,783 392,967 9.4 % (7,702) 5,970 133,500 $28.37 144,976
B 19 1,195,530 144,833 12.1 % (9,188) 799 0 $21.62 0
C 2 245,182 30,375 12.4 % (1,769) 2,083 0 $16.77 0
Fort Bend County Subtotal 61 5,603,495 568,175 10.1 % (18,659) 8,852 133,500 $26.03 144,976
Greenspoint
A 32 5,096,921 1,260,735 24.7 % 82,640 (322,540) 0 $23.14 372,275
B 41 4,549,789 1,435,765 31.6 % (59,557) (312,853) 0 $18.40 57,896
C 28 2,167,820 463,827 21.4 % 34,297 74,283 0 $12.21 0
Greenspoint Subtotal 101 11,814,530 3,160,327 26.7 % 57,380 (561,110) 0 $19.38 430,171
Inner Loop
A 35 10,008,003 825,004 8.2 % (119,380) (326,441) 1,025,151 $31.09 69,757
B 102 10,617,550 1,287,988 12.1 % 38,302 (181,543) 0 $26.68 26,424
C 77 4,455,894 405,048 9.1 % (21,743) (11,266) 0 $18.18 10,148
Inner Loop Subtotal 214 25,081,447 2,518,040 10.0 % (102,821) (519,250) 1,025,151 $26.76 106,329
North/The Woodlands/Conroe
A 83 10,861,183 542,724 5.0 % 1,011,924 2,058,337 1,391,707 $33.46 147,272
B 76 4,672,123 874,582 18.7 % (65,757) (94,742) 0 $17.66 79,585
C 32 1,136,292 164,867 14.5 % 1,675 18,721 0 $12.02 0
North/The Woodlands/Conroe Subtotal
191 16,669,598 1,582,173 9.5 % 947,842 1,982,316 1,391,707 $22.49 226,857
Northeast
A 6 51,670 7,630 14.8 % 0 0 360,000 $25.50 0
B 17 731,811 77,368 10.6 % (4,068) 1,855 0 $18.36 2,087
C 6 243,603 69,025 28.3 % 0 0 0 $13.25 0
Northeast Subtotal 29 1,027,084 154,023 15.0 % (4,068) 1,855 360,000 $16.43 2,087
Northwest
A 39 4,284,787 770,508 18.0 % 447,571 438,607 347,559 $28.03 195,436
B 62 5,678,969 1,172,365 20.6 % (22,279) (31,661) 0 $20.25 51,948
C 22 831,022 47,475 5.7 % 96,000 96,000 0 $19.40 0
Northwest Subtotal 123 10,794,778 1,990,348 18.4 % 521,292 502,946 347,559 $23.24 247,384
© Copyright 2015 Commercial Gateway, the Commercial Division of the Houston Association of REALTORS ®This information has been compiled from various sources and is provided without guarantee or warranty.
Houston-Area Office Market Summary2015 Second Quarter
Page 10

*** Rental rates weighted and averaged based on available space.
** Includes all general-purpose existing office buildings 20,000 square feet or larger.* Number of buildings calculated on specific buildings at each property address.
No. Vacant Vacancy Net Absorption Under Wted Avg SubleaseClass Bldgs * Bldg SF ** SF Rate Current YTD Construction Rent *** Avail
Southeast
A 18 2,057,376 234,815 11.4 % 13,454 (46,826) 0 $27.65 7,783
B 56 3,588,266 666,393 18.6 % (61,774) (110,760) 0 $18.72 1,311
C 47 2,011,292 369,520 18.4 % (10,312) 22,899 0 $16.86 0
Southeast Subtotal 121 7,656,934 1,270,728 16.6 % (58,632) (134,687) 0 $19.83 9,094
Southwest
A 5 1,227,586 406,149 33.1 % 0 24,821 0 $19.64 0
B 52 6,008,695 1,582,807 26.3 % 12,395 31,544 0 $17.61 1,711
C 83 4,974,976 608,297 12.2 % 7,963 56,663 0 $13.09 0
Southwest Subtotal 140 12,211,257 2,597,253 21.3 % 20,358 113,028 0 $16.87 1,711
Uptown
A 46 17,637,210 2,403,554 13.6 % (294,119) (301,571) 1,383,824 $37.96 324,612
B 79 10,162,138 1,199,003 11.8 % (1,666) (126,405) 0 $25.89 403,971
C 18 1,133,574 99,368 8.8 % 6,297 14,766 0 $16.63 0
Uptown Subtotal 143 28,932,922 3,701,925 12.8 % (289,488) (413,210) 1,383,824 $33.48 728,583
West
A 50 8,186,595 830,130 10.1 % 514,615 1,199,209 1,325,168 $27.55 129,417
B 39 3,167,821 234,891 7.4 % 4,745 188,552 0 $17.91 44,572
C 39 2,588,814 79,901 3.1 % 1,207 6,739 0 $15.08 1,440
West Subtotal 128 13,943,230 1,144,922 8.2 % 520,567 1,394,500 1,325,168 $24.70 175,429
Westchase
A 33 8,954,144 614,671 6.9 % (104,392) (102,603) 1,517,000 $34.43 319,368
B 51 6,834,269 1,015,641 14.9 % (71,624) 29,267 0 $22.15 155,040
C 19 833,516 170,509 20.5 % (16,496) 4,657 0 $18.35 0
Westchase Subtotal 103 16,621,929 1,800,821 10.8 % (192,512) (68,679) 1,517,000 $25.98 474,408
Suburban
A 428 85,619,539 9,456,690 11.0 % 1,660,190 2,936,809 9,449,610 $30.90 2,144,372
B 649 62,554,869 10,358,467 16.6 % (222,886) (737,102) 0 $21.13 1,348,234
C 381 21,015,177 2,527,002 12.0 % 90,179 272,273 0 $15.03 11,588
Suburban Subtotal 1,458 169,189,585 22,342,159 13.2 % 1,527,483 2,471,980 9,449,610 $24.58 3,504,194
Houston-Area
A 460 116,271,572 12,090,612 10.4 % 1,693,588 2,567,118 10,974,610 $32.89 3,220,712
B 678 71,468,982 11,257,108 15.8 % (174,306) (698,682) 0 $21.81 1,819,496
C 389 21,764,073 2,619,238 12.0 % 136,270 320,347 0 $15.18 11,588
Houston-Area Total 1,527 209,504,627 25,966,958 12.4 % 1,655,552 2,188,783 10,974,610 $26.49 5,051,796
© Copyright 2015 Commercial Gateway, the Commercial Division of the Houston Association of REALTORS ®This information has been compiled from various sources and is provided without guarantee or warranty.
Houston-Area Office Market Summary2015 Second Quarter
Page 11

No. of Vacant SF Vacancy Rate Net Absorption Avg* Gross Rent
Period Office SF Bldgs Direct Sublease Total Direct Sublease Total Direct Sublease Total Direct Sublease
2015 Q2 209,504,627 1,527 25,966,958 5,051,796 31,018,754 12.4 % 2.4 % 14.8 % 1,655,552 (1,601,103) 54,449 $26.49 $26.90
2015 Q1 206,355,962 1,507 25,453,598 3,450,693 28,904,291 12.3 % 1.7 % 14.0 % 533,231 (255,489) 277,742 $26.22 $28.46
2014 Q4 202,768,866 1,483 22,802,149 3,195,204 25,997,353 11.2 % 1.6 % 12.8 % 1,691,679 (152,487) 1,539,192 $25.38 $26.88
2014 Q3 200,731,138 1,466 22,130,530 3,042,717 25,173,247 11.0 % 1.5 % 12.5 % 919,950 84,296 1,004,246 $25.06 $27.08
2014 Q2 199,401,322 1,457 21,746,160 3,127,013 24,873,173 10.9 % 1.6 % 12.5 % 2,115,885 (375,772) 1,740,113 $24.98 $26.08
2014 Q1 197,690,184 1,448 22,056,941 2,751,241 24,808,182 11.2 % 1.4 % 12.5 % 1,102,240 (241,993) 860,247 $24.75 $23.49
2013 Q4 196,500,180 1,444 22,165,177 2,616,113 24,781,290 11.3 % 1.3 % 12.6 % 799,788 (316,361) 483,427 $24.13 $24.62
2013 Q3 195,453,517 1,437 22,437,411 2,299,752 24,737,163 11.5 % 1.2 % 12.7 % 1,798,414 (264,946) 1,533,468 $24.14 $24.76
2013 Q2 192,910,210 1,423 21,582,681 2,034,806 23,617,487 11.2 % 1.1 % 12.2 % 572,402 (295,404) 276,998 $23.44 $21.01
2013 Q1 192,232,831 1,419 21,740,087 1,681,604 23,421,691 11.3 % 0.9 % 12.2 % 393,869 (49,559) 344,310 $23.26 $21.22
2012 Q4 192,175,633 1,418 22,197,210 1,632,045 23,829,255 11.6 % 0.8 % 12.4 % 1,120,277 37,432 1,157,709 $23.10 $21.63
2012 Q3 191,721,286 1,416 22,702,860 1,669,477 24,372,337 11.8 % 0.9 % 12.7 % 454,212 204,364 658,576 $22.92 $21.68
2012 Q2 191,916,276 1,415 23,180,462 1,873,841 25,054,303 12.1 % 1.0 % 13.1 % 1,160,667 346,625 1,507,292 $22.79 $22.74
2012 Q1 191,877,136 1,414 23,741,633 2,220,466 25,962,099 12.4 % 1.2 % 13.5 % 820,860 287,689 1,108,549 $22.73 $23.86
2011 Q4 191,653,046 1,407 25,461,914 2,508,155 27,970,069 13.3 % 1.3 % 14.6 % 942,031 496,847 1,438,878 $22.87 $24.15
2011 Q3 191,035,359 1,400 25,993,360 3,005,002 28,998,362 13.6 % 1.6 % 15.2 % 1,270,142 (222,073) 1,048,069 $22.68 $23.78
2011 Q2 190,268,314 1,397 26,627,679 2,782,929 29,410,608 14.0 % 1.5 % 15.5 % 78,544 71,935 150,479 $22.98 $23.50
2011 Q1 189,572,912 1,395 26,198,187 2,827,526 29,025,713 13.8 % 1.5 % 15.3 % (208,556) 350,061 141,505 $23.22 $22.36
2010 Q4 188,595,575 1,393 25,530,782 3,177,587 28,708,369 13.5 % 1.7 % 15.2 % (44,809) 422,532 377,723 $22.73 $22.35
2010 Q3 188,144,622 1,393 25,811,014 3,394,705 29,205,719 13.7 % 1.8 % 15.5 % (148,926) (175,513) (324,439) $23.06 $22.86
2010 Q2 188,144,622 1,393 25,577,963 3,220,668 28,798,631 13.6 % 1.7 % 15.3 % 709,745 557,095 1,266,840 $23.39 $23.51
2010 Q1 187,674,256 1,389 26,120,149 3,777,763 29,897,912 13.9 % 2.0 % 15.9 % (1,346,348) (94,915) (1,441,263) $23.93 $25.00
* Rental rates are averaged and weighted based on available space.© 2015 HRIS. All information is deemed reliable but not guaranteed.
Houston-Area Office Statistical Summary
Page 12

Class A Class B Class C All Classes
2015 Q2 1,693,588 (174,306) 136,270 1,655,552
Q1 873,530 (524,376) 184,077 533,231
2014 Q4 1,427,302 268,774 (4,397) 1,691,679
Q3 955,886 (133,200) 97,264 919,950
Q2 1,948,587 171,026 (3,728) 2,115,885
Q1 987,099 165,203 (50,062) 1,102,240
2013 Q4 608,883 272,608 (81,703) 799,788
Q3 1,809,844 78,677 (90,107) 1,798,414
Q2 836,376 (82,036) (181,938) 572,402
Q1 229,455 235,552 (71,138) 393,869
2012 Q4 566,957 639,219 (85,899) 1,120,277
Q3 405,430 18,446 30,336 454,212
Q2 1,066,677 63,081 30,909 1,160,667
Q1 43,439 643,622 133,799 820,860
2011 Q4 793,753 65,449 82,829 942,031
Q3 1,457,485 (222,599) 35,256 1,270,142
Q2 218,266 (130,246) (9,476) 78,544
Q1 195,659 (428,686) 24,471 (208,556)
2010 Q4 416,133 (337,040) (123,902) (44,809)
Q3 526,692 (724,927) 49,309 (148,926)
Q2 524,438 136,335 48,972 709,745
Q1 (224,705) (960,759) (160,884) (1,346,348)
Absorption square footage includes only net absorption for direct space; sublease space is excluded.© 2015 HRIS. All rights reserved. All information is deemed reliable but is not guaranteed.
Houston-Area Office Absorption by Class by Quarter
Page 13

Class A Class B Class C All Classes
2015 YTD 2,567,118 (698,682) 320,347 2,188,783
2014 YTD 5,318,874 471,803 39,077 5,829,754
2013 YTD 3,484,558 504,801 (424,886) 3,564,473
2012 YTD 2,082,503 1,364,368 109,145 3,556,016
2011 YTD 2,665,163 (716,082) 133,080 2,082,161
2010 YTD 1,242,558 (1,886,391) (186,505) (830,338)
Absorption square footage includes only net absorption for direct space; sublease space is excluded.© HRIS. All rights reserved. All information is deemed reliable but is not guaranteed.
Houston-Area Office Absorption by Class by Year
Page 14

* Gross rental rates are averaged and weighted based on available space.© 2015 HRIS. All rights reserved. All information is deemed reliable but is not guaranteed.
Houston-Area Office Vacancy and Rental Rates* by Quarter
Page 15

Year-end numbers. *Gross rental rates are averaged and weighted based on available space.© 2015 HRIS. All rights reserved. All information is deemed reliable but is not guaranteed.
Houston-Area Office Vacancy and Rental Rates* by Year
Page 16

No. Vacant Vacancy Net Absorption Under Wted Avg SubleaseMarket Area Type Bldgs * Bldg SF ** SF Rate Current YTD Construction Rent *** Avail
Inner Loop
Warehouse/Distribution 503 17,485,606 832,936 4.8 % 38,233 (61,793) 21,646 $6.15 35,066
Flex/Service Center 186 4,711,061 104,234 2.2 % 31,698 11,872 0 $15.01 39,617
Manufacturing 51 1,883,663 37,000 2.0 % 0 0 0 $4.32 0
HighTech/R&D 5 169,011 0 0.0 % 0 0 0 N/A 0
Inner Loop Subtotal 745 24,249,341 974,170 4.0 % 69,931 (49,921) 21,646 $7.03 74,683
North
Warehouse/Distribution 397 8,427,241 436,415 5.2 % (64,896) 190,820 543,256 $9.66 17,300
Flex/Service Center 132 2,564,546 311,878 12.2 % (3,080) (72,895) 0 $12.28 13,150
Manufacturing 62 1,371,958 152,223 11.1 % 20,088 (76,912) 0 $8.40 0
HighTech/R&D 14 526,612 5,100 1.0 % 2,856 2,244 0 $16.80 10,432
North Subtotal 605 12,890,357 905,616 7.0 % (45,032) 43,257 543,256 $10.39 40,882
Northeast
Warehouse/Distribution 1,193 53,412,897 4,482,296 8.4 % 251,145 604,255 1,357,874 $7.29 470,429
Flex/Service Center 313 7,952,871 833,407 10.5 % 89,209 110,594 0 $8.56 23,223
Manufacturing 247 9,358,327 285,046 3.0 % 84,747 125,411 783,300 $6.63 103,714
HighTech/R&D 13 540,915 102,567 19.0 % 66,243 66,243 0 N/A 0
Northeast Subtotal 1,766 71,265,010 5,703,316 8.0 % 491,344 906,503 2,141,174 $7.44 597,366
Northwest
Warehouse/Distribution 2,467 97,941,477 5,997,175 6.1 % 720,364 1,254,421 2,303,536 $7.69 502,949
Flex/Service Center 755 18,497,341 1,039,897 5.6 % 97,950 128,204 0 $10.65 146,875
Manufacturing 516 18,987,345 771,545 4.1 % 54,178 81,303 4,054,250 $6.22 161,560
HighTech/R&D 37 2,093,013 24,150 1.2 % 0 32,110 0 N/A 0
Northwest Subtotal 3,775 137,519,176 7,832,767 5.7 % 872,492 1,496,038 6,357,786 $7.94 811,384
South
Warehouse/Distribution 699 22,638,442 457,719 2.0 % 92,641 62,136 45,640 $5.67 0
Flex/Service Center 132 2,701,134 173,157 6.4 % (357) (23,472) 0 $13.31 0
Manufacturing 158 6,082,162 302,736 5.0 % (22,719) 119,062 0 $5.19 180,410
HighTech/R&D 12 312,302 0 0.0 % 0 0 0 N/A 0
South Subtotal 1,001 31,734,040 933,612 2.9 % 69,565 157,726 45,640 $6.93 180,410
Southeast
Warehouse/Distribution 1,457 68,293,128 3,421,500 5.0 % 1,437,344 790,971 68,614 $5.96 58,280
Flex/Service Center 270 5,021,873 280,992 5.6 % 7,850 50,976 25,000 $10.34 0
Manufacturing 214 9,072,348 181,972 2.0 % 16,160 (22,500) 0 $9.35 5,585
HighTech/R&D 18 496,508 117,502 23.7 % (50,535) 0 0 $14.78 0
Southeast Subtotal 1,959 82,883,857 4,001,966 4.8 % 1,410,819 819,447 93,614 $6.68 63,865
Southwest
Warehouse/Distribution 839 33,879,879 1,480,055 4.4 % 424,328 450,728 867,426 $7.70 79,734
Flex/Service Center 479 14,391,049 830,351 5.8 % 14,196 60,668 0 $13.89 26,950
Manufacturing 110 3,601,891 450,324 12.5 % (12,179) 5,821 111,600 $5.51 0
HighTech/R&D 13 948,730 15,995 1.7 % 48,600 439,200 0 $29.60 0
Southwest Subtotal 1,441 52,821,549 2,776,725 5.3 % 474,945 956,417 979,026 $9.32 106,684
Houston-Area
Warehouse/Distribution 7,557 302,115,870 17,108,096 5.7 % 2,899,159 3,291,538 5,207,992 $7.16 1,163,758
Flex/Service Center 2,267 55,839,875 3,573,916 6.4 % 237,466 265,947 25,000 $11.29 249,815
Manufacturing 1,358 50,357,694 2,180,846 4.3 % 140,275 232,185 4,949,150 $6.37 451,269
HighTech/R&D 112 5,087,091 265,314 5.2 % 67,164 539,797 0 $16.57 10,432
Houston-Area Total 11,294 413,400,530 23,128,172 5.6 % 3,344,064 4,329,467 10,182,142 $7.67 1,875,274
* Number of buildings calculated on specific buildings at each property address.
** Includes all general-purpose existing industrial buildings 10,000 square feet or larger.
*** Rental rates are weighted and averaged based on available space.
© Copyright 2015 Commercial Gateway, the Commercial Division of the Houston Association of REALTORS ®This information has been compiled from various sources and is provided without guarantee or warranty.
Houston-Area Industrial Market Summary2015 Second Quarter
Page 17

No. of Vacant SF Vacancy Rate Net Absorption Avg* Gross
Period Building SF Bldgs Direct Sublease Total Direct Sublease Total Direct Sublease Total Direct Rent
2015 Q2 413,400,530 11,294 23,128,172 1,875,274 25,003,446 5.6 % 0.5 % 6.0 % 3,344,064 (78,674) 3,265,390 $7.67
2015 Q1 410,062,222 11,242 24,257,107 1,644,464 25,901,571 5.9 % 0.4 % 6.3 % 985,403 74,465 1,059,868 $7.80
2014 Q4 406,871,910 11,163 23,672,655 1,533,554 25,206,209 5.8 % 0.4 % 6.2 % 3,363,870 (138,893) 3,224,977 $7.76
2014 Q3 403,639,628 11,100 25,268,386 1,378,661 26,647,047 6.3 % 0.3 % 6.6 % 1,798,624 120,501 1,919,125 $7.40
2014 Q2 401,024,876 11,059 25,461,662 1,484,062 26,945,724 6.3 % 0.4 % 6.7 % 1,614,486 (88,457) 1,526,029 $7.11
2014 Q1 398,024,467 11,016 25,343,115 1,363,465 26,706,580 6.4 % 0.3 % 6.7 % 2,076,199 148,511 2,224,710 $6.64
2013 Q4 395,226,236 10,971 27,506,608 1,941,510 29,448,118 7.0 % 0.5 % 7.5 % 3,130,396 199,060 2,909,456 $6.60
2013 Q3 392,986,829 10,934 28,752,085 2,249,174 31,001,259 7.3 % 0.6 % 7.9 % 1,406,045 85,252 1,491,297 $6.55
2013 Q2 389,898,922 10,877 27,353,389 2,174,211 29,527,600 7.0 % 0.6 % 7.6 % 1,425,939 (448,240) 977,699 $6.36
2013 Q1 387,837,897 10,845 27,749,911 1,686,838 29,436,749 7.2 % 0.4 % 7.6 % 1,332,284 27,475 1,359,759 $5.94
2012 Q4 385,540,508 10,789 26,166,605 1,714,313 27,880,918 6.8 % 0.4 % 7.2 % 2,253,851 259,860 2,513,711 $5.79
2012 Q3 384,142,412 10,764 27,843,788 1,674,442 29,518,230 7.2 % 0.4 % 7.7 % 1,386,122 8,362 1,394,484 $5.73
2012 Q2 383,579,345 10,744 29,027,944 1,682,804 30,710,748 7.6 % 0.4 % 8.0 % 1,577,285 33,946 1,611,231 $5.61
2012 Q1 382,058,172 10,721 28,771,468 1,946,440 30,717,908 7.5 % 0.5 % 8.0 % 1,389,666 335,275 1,724,941 $5.58
2011 Q4 380,542,033 10,690 29,102,208 1,939,455 31,041,663 7.6 % 0.5 % 8.2 % 2,243,257 160,320 2,403,577 $5.53
2011 Q3 379,410,957 10,668 30,566,218 2,099,775 32,665,993 8.1 % 0.6 % 8.6 % 1,639,397 68,870 1,708,267 $5.46
2011 Q2 379,258,070 10,657 32,506,898 2,094,562 34,601,460 8.6 % 0.6 % 9.1 % 96,281 (59,701) 36,580 $5.37
2011 Q1 376,568,167 10,545 31,762,112 2,013,861 33,775,973 8.4 % 0.5 % 9.0 % 337,590 (134,971) 202,619 $5.59
2010 Q4 376,324,138 10,537 31,947,762 1,878,890 33,826,652 8.5 % 0.5 % 9.0 % 497,855 (14,162) 483,693 $5.47
2010 Q3 374,990,606 10,484 32,440,351 1,853,478 34,293,829 8.7 % 0.5 % 9.1 % 314,689 585,710 900,399 $5.48
2010 Q2 374,544,944 10,477 32,617,472 2,406,522 35,023,994 8.7 % 0.6 % 9.4 % 2,901,893 147,783 3,049,676 $5.64
2010 Q1 373,564,118 10,467 34,225,364 2,534,105 36,759,469 9.2 % 0.7 % 9.8 % 1,946,252 (202,279) 1,743,973 $5.45
Rental rates are averaged and weighted based on available space.© 2015 HRIS. All rights reserved. All information is deemed reliable but is not guaranteed and should be independently verified.
Houston-Area Industrial Statistical Summary
Page 18

Flex/Service Center Manufacturing
Warehouse/Distribution HighTech/R&D All Types
2015 Q2 237,466 140,275 2,848,624 117,699 3,344,064Q1 28,481 91,910 442,914 422,098 985,403
2014 Q4 457,754 (121,978) 3,016,825 11,269 3,363,870Q3 125,904 387,838 1,278,932 5,950 1,798,624Q2 178,611 252,390 1,214,798 (31,313) 1,614,486Q1 169,999 454,750 1,429,444 22,006 2,076,199
2013 Q4 (201,531) 51,980 3,284,777 (4,830) 3,130,396Q3 173,110 65,704 1,125,805 41,426 1,406,045Q2 (5,257) (63,405) 1,657,833 (163,232) 1,425,939Q1 85,507 294,045 945,439 7,293 1,332,284
2012 Q4 144,932 268,394 1,696,686 143,839 2,253,851Q3 346,860 202,257 1,029,885 (192,880) 1,386,122Q2 153,636 44,180 1,517,731 (138,262) 1,577,285Q1 (9,227) 301,350 1,092,045 5,498 1,389,666
2011 Q4 (48,612) 537,804 1,909,691 (155,626) 2,243,257Q3 (146,515) 90,211 1,694,551 1,150 1,639,397Q2 (245,108) 29,313 416,515 (104,439) 96,281Q1 123,407 (46,076) 109,659 150,600 337,590
2010 Q4 188,845 (66,290) 111,141 264,159 497,855Q3 228,652 (113,250) 199,496 (209) 314,689Q2 376,345 362,699 2,196,396 (33,547) 2,901,893Q1 (12,387) 42,018 1,898,796 17,825 1,946,252
Absorption square footage includes only net absorption for direct space; sublease space is excluded. © 2015 HRIS. All rights reserved. All information is deemed reliable but is not guaranteed and should be independently verified.
Houston-Area Industrial Absorption by Type by Quarter
Page 19

Flex/Service Center Manufacturing
Warehouse/Distribution HighTech/R&D All Types
2015 265,947 232,185 3,275,547 539,797 4,313,476
2014 932,268 973,000 6,939,999 7,912 8,853,179
2013 51,829 348,324 7,013,854 (119,343) 7,294,664
2012 636,201 816,181 5,336,347 (181,805) 6,606,924
2011 (316,828) 611,252 4,130,416 (108,315) 4,316,525
2010 781,455 225,177 4,405,829 248,228 5,660,689
Absorption square footage includes only net absorption for direct space; sublease space is excluded.© 2015 HRIS. All rights reserved. All information is deemed reliable but is not guaranteed and should be independently verified.
Houston-Area Industrial Absorption by Type by Year
Page 20

* Gross rental rates are averaged and weighted based on available space.© 2015 HRIS. All rights reserved. All information is deemed reliable but is not guaranteed and should be independently verified.
Houston-Area Industrial Vacancy and Rental Rates* by Quarter
Page 21

Year-end numbers. *Gross rental rates are averaged and weighted based on available space.© 2015 HRIS. All rights reserved. All information is deemed reliable but is not guaranteed and should be independently verified.
Houston-Area Industrial Vacancy and Rental Rates* by Year
Page 22