housing trends and affordability at last, some ... · yet ownership cost pressures are still...
TRANSCRIPT

HOUSING TRENDS AND AFFORDABILITY | MARCH 2018 HOUSING TRENDS AND AFFORDABILITY | APRIL 2018
1
Cooling in Ontario’s housing
market brings (modest) af-
fordability benefits
The steady and rapid deterioration
in home ownership affordability
over the past two years in Canada
finally came to a stop in the fourth
quarter. It was, for the most part,
because home prices dipped in On-
tario after reaching dizzying heights
earlier last year. More specifically,
detached home prices in the Toron-
to area gave back some of their out-
sized gains of recent years. Demand
for high-priced detached homes fell
following the introduction of Ontar-
io’s Fair Housing Plan in April and as earlier policy measures increasingly constrained buyers’ budgets. RBC’s aggregate measure
dropped by 2.3 percentage points to 75.1% in the Toronto area (a decrease in the measure represents an improvement in affordability).
This was a sufficiently large change to move the needle at the national level where RBC’s aggregate measure eased by 0.2 percentage
points to 48.3% in the fourth quarter.
Yet ownership cost pressures are still intense in Toronto...
Toronto homebuyers will welcome any relief in affordability. However, it’s doubtful that they will feel much of a difference. The
HOUSING TRENDS AND AFFORDABILITY April 5, 2018
At last, some affordability relief for Ontario homebuyers
Long overdue improvement. RBC’s overall housing affordability measure for Canada improved in the fourth quarter of 2017 for the first time in more than two years.
It was mostly due to a drop in Toronto prices. The significant cool-ing in the Toronto market since the introduction of Ontario’s Fair Housing Plan led to a modest decline in single-detached home prices.
Affordability remains stretched. That’s true nationally, in Canada’s long-standing ‘hot spots’ Toronto and Vancouver, and increasingly so in Montreal.
Still not an issue in the Prairies and Atlantic Canada. Affordability levels remain close to historical norms in these regions.
Are we at a turning point for affordability? No. The scope for fur-ther affordability improvement in Canada is limited in the short term. Rising interest rates will put upward pressure on home ownership costs, and recent policy measures are more likely to reduce household and market risks than provide material affordability relief.
20
30
40
50
60
1985 1987 1989 1991 1993 1995 1997 1999 2001 2003 2005 2007 2009 2011 2013 2015 2017
Single-detachedAggregateAggregate long-term averageCondo apartment
Ownership costs as % of median household income
RBC Housing Affordability Measures - Canada
Craig Wright | Chief Economist | 416-974-7457 | [email protected]
Robert Hogue | Senior Economist | 416-974-6192 | [email protected]
-2.0
-1.5
-1.0
-0.5
0.0
0.5
1.0
1.5
2.0
2013 2014 2015 2016 2017
Toronto
Vancouver
Other markets
Canada total
Percentage point contribution to quarterly changes in RBC's aggregate affordability measure for Canada
A drop in Toronto detached home prices was the main factor improving affordability in Canada
Source:RPS, Royal LePage, Statistics Canada, Bank of Canada, RBC Economics Research
Q4

HOUSING TRENDS AND AFFORDABILITY | APRIL 2018
2
HOUSING TRENDS AND AFFORDABILITY | APRIL 2018
costs of owning a home at today’s prices are still onerous compared to all other markets in Canada except the Vancouver area. And
these costs remain very close to the highest they’ve ever been in the Toronto area. The drop in RBC’s aggregate affordability meas-
ure in the fourth quarter rolled back only a small part of the 8.2 percentage point rise it recorded over the previous nine quarters.
Condominium apartments are the more affordable housing option in the Toronto area and attracted more buyers in the past year. Un-
fortunately, that segment of the market saw no affordability relief in the fourth quarter.
...and British Columbia
Pressures got more intense in Canada’s other affordability-stressed markets. The re-acceleration of home prices in Vancouver and
continued appreciation in Victoria further increased pressure on BC homebuyers. In fact, Vancouver-area buyers experienced the
most significant deterioration in RBC’s aggregate affordability measure in Canada in the fourth quarter, rising by 1.8 percentage
points. Victoria’s measure edged 0.5 percentage points higher. RBC’s measures are at their worst-ever levels in both these markets.
In light of such challenging affordability trends, it wasn’t a surprise to see the BC government announce further housing policy initi-
atives to cool the market in its 2018 budget. These initiatives included an increase in the foreign-buyer tax from 15% to 20% and the
introduction of a property tax on unoccupied properties owned by non-residents (including other Canadians) in certain urban mar-
kets.
Montreal’s market upswing comes at a cost: an erosion of affordability
One of the more encouraging developments in Canada’s housing market in the last two years has been the vitality of markets in
Montreal and Ottawa. Both benefited from a strengthening in regional economies and renewed consumer confidence. The pick-up in
activity has led to a firming in prices and gradual erosion of affordability, although this is not overly concerning at this stage. RBC’s
measures aren’t far off historical norms. Still, Montreal just saw the ninth increase in its aggregate measure in the past ten quarters.
This trend is starting to take some of the shine off its reputation as an affordable market—especially for detached homes.
The Prairies and Atlantic Canada: still broadly affordable
Home ownership costs generally remained manageable for homebuyers in the rest of the country. RBC’s aggregate measures stood
near long-run averages in the Prairies and Atlantic Canada. That being said, a small increase in mortgage rates contributed to a slight
deterioration in affordability in most markets.
This is not a turning point for affordability in Canada
It would be tempting to view the fourth quarter’s affordability improvement in Canada as the start of a new, friendlier trend for
homebuyers. But this is unlikely to be the case for a few key reasons. First, we expect the reprieve in the Toronto area to be short-
lived. We believe that Toronto prices will bottom out sometime this spring. Second, we expect interest rates to rise further. Our view
is that the Bank of Canada will hike its overnight rate to 2.25% by the first half of 2019 and we expect longer-term rates to rise in
tandem. Higher interest rates have the potential to stress housing affordability markedly in Canada. We estimate that, everything else
remaining constant, a 100-basis-point increase in mortgage rates would lift RBC’s aggregate affordability measure for Canada by
about 4 percentage points. Some of the adverse impact on affordability could be offset by household income gains, but it’s unlikely
that incomes would rise fast enough to provide a full offset. Third, mortgage qualifying rules are more stringent. The new rules that
came into effect in January, as well as earlier rule changes, have raised the ownership bar for buyers who need a new mortgage—like
the vast majority of first-time homebuyers.

HOUSING TRENDS AND AFFORDABILITY | MARCH 2018 HOUSING TRENDS AND AFFORDABILITY | APRIL 2018
3
Victoria – Increasingly unaffordable due to a dearth of sellers
The costs of home ownership reached record-high levels in Victoria as 2017
drew to a close. Home prices have been on a steady climb in the area amid
tight demand-supply conditions in the past three years. Sharply deteriorating
affordability—Victoria recorded the second-largest rise in RBC’s aggregate
affordability measure in Canada in the past year—has priced buyers out of the
market. Home resales fell by 15.6% in the area in 2017. But it’s a relative
lack of sellers that’s keeping the market so tight. It seems that sky-high prices
aren’t enough to convince would-be sellers to put their properties up for sale.
RBC’s aggregate affordability measure rose again in the fourth quarter by 0.5
percentage points to 61.6%.
Vancouver area – Soaring prices prompt further policy intervention
The re-acceleration of home prices since the middle of last year put housing
affordability back at the top of the list of concerns in the Vancouver area.
RBC’s aggregate measure jumped by 1.8 percentage points in the fourth quar-
ter. This came on the heels of even larger increases in the previous two quar-
ters. The unfortunate outcome for local homebuyers is that they are now chal-
lenged by the worst affordability levels ever recorded anywhere in Cana-
da. The costs of owning a home at today’s prices would have represented an
astounding 85.2% of a typical household’s income in the fourth quarter. The
worrying trend prompted the BC government to impose new and expanded
initiatives to cool the market down. The 2018 provincial budget announced
that the government will raise the foreign-buyer tax from 15% to 20%, ex-
pand it beyond Metro Vancouver to a number of other local markets, and in-
troduce a property tax on unoccupied properties owned by non-residents
(including other Canadians) in certain urban markets. A main objective is to
increase housing supply by ‘unlocking’ units that sit empty most of the year.
Calgary – Market recovery drives gradual rise in ownership costs
Home ownership costs are on a modest upward trend in the Calgary area but
that isn’t necessarily a bad sign. Costs are rising in large part because market
conditions are improving. Slowly—and unevenly—but surely. Home resales
rose by 6.0% in 2017, representing the first increase in three years. This con-
tributed to put a slight bid on home prices in the area. Yet it’s unlikely that
affordability poses problems to homebuyers. RBC’s aggregate affordability
measure remains close to its long-run average of 41.0%. The measure rose
marginally in the fourth quarter by 0.1 percentage points to 42.1%. We expect
the market to continue to recover in the year ahead alongside a provincial
economy that’s on the mend.
Edmonton – No complaints here about affordability
Affordability isn’t really an issue for Edmonton homebuyers. RBC’s aggre-
gate measure for the area, at 27.7% in the fourth quarter, is among the most
attractive in the country. The trend has been quite flat in the past couple of
years, reflecting the fact that prices have changed little overall over that peri-
od. Yet buyers haven’t been overly eager to jump in. Home resales rose just
0.5% in 2017. There was a late-surge of activity ahead of the new mortgage
RBC Housing Affordability Measures
Alberta
20
40
60
80
1985 1987 1989 1991 1993 1995 1997 1999 2001 2003 2005 2007 2009 2011 2013 2015 2017
Ownership costs as % of median household incomeCalgary
Source: RPS, Statistics Canada, Bank of Canada, Royal LePage, RBC Economics
Research
20
40
60
80
1985 1987 1989 1991 1993 1995 1997 1999 2001 2003 2005 2007 2009 2011 2013 2015 2017
Ownership costs as % of median household income
Edmonton
British Columbia
20
40
60
80
100
120
140
1985 1987 1989 1991 1993 1995 1997 1999 2001 2003 2005 2007 2009 2011 2013 2015 2017
Ownership costs as % of median household incomeVancouver Area
20
40
60
80
1985 1987 1989 1991 1993 1995 1997 1999 2001 2003 2005 2007 2009 2011 2013 2015 2017
Ownership costs as % of median household incomeVictoria
HOUSING TRENDS AND AFFORDABILITY | APRIL 2018
4
HOUSING TRENDS AND AFFORDABILITY | APRIL 2018
stress test that came into effect on January 1 but it has since been largely re-
versed. We expect the market to improve this year. A recent decline in Ed-
monton’s unemployment rate bodes well for demand to pick up.
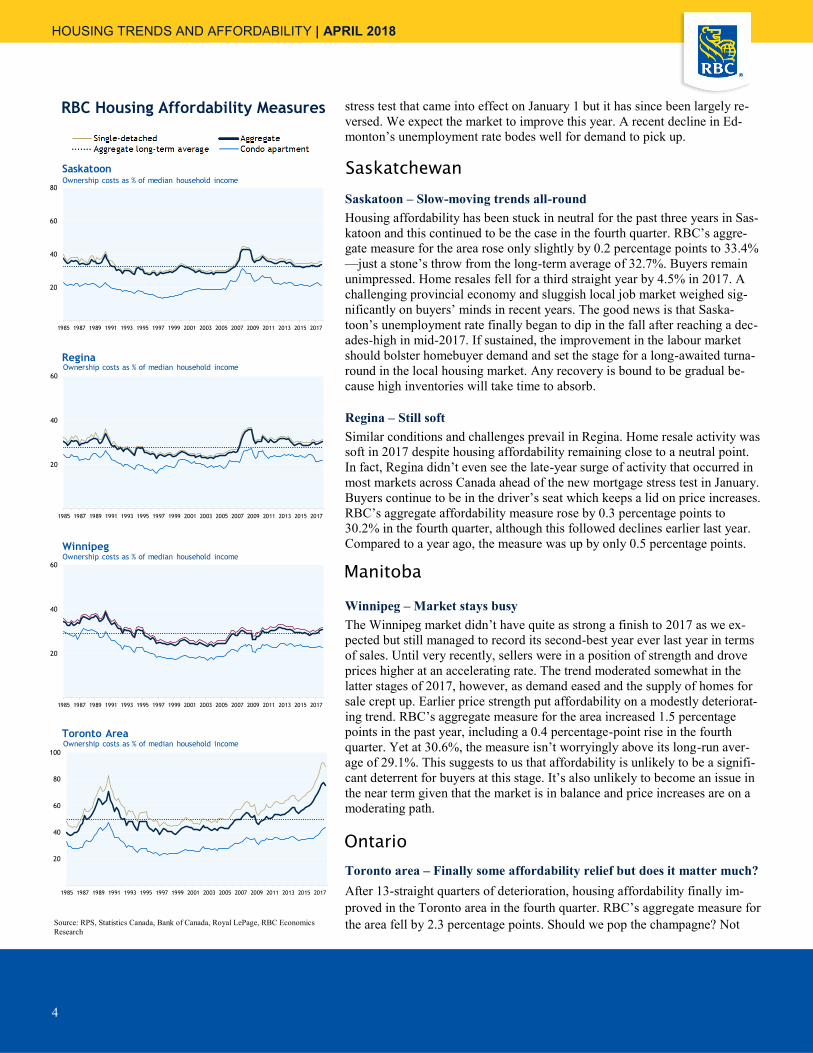
Saskatoon – Slow-moving trends all-round
Housing affordability has been stuck in neutral for the past three years in Sas-
katoon and this continued to be the case in the fourth quarter. RBC’s aggre-
gate measure for the area rose only slightly by 0.2 percentage points to 33.4%
—just a stone’s throw from the long-term average of 32.7%. Buyers remain
unimpressed. Home resales fell for a third straight year by 4.5% in 2017. A
challenging provincial economy and sluggish local job market weighed sig-
nificantly on buyers’ minds in recent years. The good news is that Saska-
toon’s unemployment rate finally began to dip in the fall after reaching a dec-
ades-high in mid-2017. If sustained, the improvement in the labour market
should bolster homebuyer demand and set the stage for a long-awaited turna-
round in the local housing market. Any recovery is bound to be gradual be-
cause high inventories will take time to absorb.
Regina – Still soft
Similar conditions and challenges prevail in Regina. Home resale activity was
soft in 2017 despite housing affordability remaining close to a neutral point.
In fact, Regina didn’t even see the late-year surge of activity that occurred in
most markets across Canada ahead of the new mortgage stress test in January.
Buyers continue to be in the driver’s seat which keeps a lid on price increases.
RBC’s aggregate affordability measure rose by 0.3 percentage points to
30.2% in the fourth quarter, although this followed declines earlier last year.
Compared to a year ago, the measure was up by only 0.5 percentage points.
Winnipeg – Market stays busy
The Winnipeg market didn’t have quite as strong a finish to 2017 as we ex-
pected but still managed to record its second-best year ever last year in terms
of sales. Until very recently, sellers were in a position of strength and drove
prices higher at an accelerating rate. The trend moderated somewhat in the
latter stages of 2017, however, as demand eased and the supply of homes for
sale crept up. Earlier price strength put affordability on a modestly deteriorat-
ing trend. RBC’s aggregate measure for the area increased 1.5 percentage
points in the past year, including a 0.4 percentage-point rise in the fourth
quarter. Yet at 30.6%, the measure isn’t worryingly above its long-run aver-
age of 29.1%. This suggests to us that affordability is unlikely to be a signifi-
cant deterrent for buyers at this stage. It’s also unlikely to become an issue in
the near term given that the market is in balance and price increases are on a
moderating path.
Toronto area – Finally some affordability relief but does it matter much?
After 13-straight quarters of deterioration, housing affordability finally im-
proved in the Toronto area in the fourth quarter. RBC’s aggregate measure for
the area fell by 2.3 percentage points. Should we pop the champagne? Not
RBC Housing Affordability Measures
20
40
60
80
1985 1987 1989 1991 1993 1995 1997 1999 2001 2003 2005 2007 2009 2011 2013 2015 2017
Ownership costs as % of median household income
Saskatoon
20
40
60
1985 1987 1989 1991 1993 1995 1997 1999 2001 2003 2005 2007 2009 2011 2013 2015 2017
Ownership costs as % of median household incomeRegina
Manitoba
Source: RPS, Statistics Canada, Bank of Canada, Royal LePage, RBC Economics
Research
20
40
60
1985 1987 1989 1991 1993 1995 1997 1999 2001 2003 2005 2007 2009 2011 2013 2015 2017
Ownership costs as % of median household income
Winnipeg
Saskatchewan
Ontario 20
40
60
80
100
1985 1987 1989 1991 1993 1995 1997 1999 2001 2003 2005 2007 2009 2011 2013 2015 2017
Ownership costs as % of median household income
Toronto Area

HOUSING TRENDS AND AFFORDABILITY | MARCH 2018 HOUSING TRENDS AND AFFORDABILITY | APRIL 2018
5
unless you think allocating 75.1% of a household’s income to cover owner-
ship costs is acceptable. That’s what a typical Toronto-area household would
need to allocate if it were to buy an average home today at today’s prices and
interest rates. Even buying a condo, the more affordable housing option,
would require a 43.1% share—still prohibitive for many. A significant cool-
ing in the market post-Fair Housing Plan provided relief in the fourth quarter.
The cooling brought the market back into balance and reduced the intense
upward price pressure that prevailed previously, although almost all of that
easing was concentrated in the higher-priced detached home segment. The
condo segment didn’t get any affordability relief in the fourth quarter. The
bad news is that we don’t expect the dip in RBC’s aggregate measure to be
the start of a new, buyer-friendly trend in the Toronto area. We expect home
prices to bottom out sometime this spring.
Ottawa – Still in good shape
Ottawa’s housing market is in good shape with resale activity and prices trend-
ing higher. Demand-supply conditions are firm, supported by solid economic
and demographic backdrops. Sellers are in command for the most part. Housing
affordability is on a slightly eroding path but remains at a manageable level.
Certainly, buyers have shown few signs that affordability is an issue for them.
Ottawa home resales set a new record-high last year, rising almost 11% from
2016. RBC’s aggregate measure eased marginally by 0.1 percentage points to
36.1% in the fourth quarter.
Montreal area – Gradual erosion of affordability not a big deal so far
Montreal’s housing market is on an impressive run. It just recorded its second
-strongest year ever in 2017. Home resales rose by 8% from 2016 and prices
climbed between 3% and 7% depending on the housing category. Sellers hold
the upper hand in the detached-home segment and are slowly gaining power
in the condo segment. Housing affordability eroded steadily since 2015
though this hasn’t dampened buyers’ enthusiasm. Quite the contrary, buyers
have become increasingly bullish thanks to a thriving regional economy and
strong labour market. RBC’s aggregate affordability measure inched higher
by 0.4 percentage points to 44.1% in the fourth quarter. This was the ninth
increase in the past 10 quarters, and the highest level since the third quarter of
2011. As with other markets across Canada, tighter mortgage lending rules
and the spectre of higher interest rates will generate some headwinds in 2018.
Still, we don’t expect the buzz about Montreal’s housing market to quiet
down much.
Quebec City – Buyers are in the driver’s seat
Quebec City’s housing market also is on a multi-year upswing although it lost
some momentum in the latter stages of 2017. The final tally for 2017 showed
a fourth-straight annual increase of 2% in home resales in the area. Yet activi-
ty was flat on a year-over-year basis in the fourth quarter. This slowdown
kept buyers in the driver’s seat in all housing categories. Buyers have plenty
of options to choose from and use this advantage to resist price increases. In
fact, prices changed little overall in the past year. The main exceptions are for
lower-priced properties where demand exceeds supply. This is because af-
fordability hurdles at the more expensive price points divert homebuyers to-
RBC Housing Affordability Measures
20
40
60
1985 1987 1989 1991 1993 1995 1997 1999 2001 2003 2005 2007 2009 2011 2013 2015 2017
Ownership costs as % of median household income
Ottawa
Source: RPS, Statistics Canada, Bank of Canada, Royal LePage, RBC Economics
Research
Quebec
20
40
60
80
1985 1987 1989 1991 1993 1995 1997 1999 2001 2003 2005 2007 2009 2011 2013 2015 2017
Ownership costs as % of median household income
Montreal Area
20
40
60
1985 1987 1989 1991 1993 1995 1997 1999 2001 2003 2005 2007 2009 2011 2013 2015 2017
Ownership costs as % of median household incomeQuebec City

HOUSING TRENDS AND AFFORDABILITY | APRIL 2018
6
HOUSING TRENDS AND AFFORDABILITY | APRIL 2018
ward the lower end of the market. Soft aggregate prices, therefore, have more
to do with the mismatch between demand and supply than outright slumping
demand. There’s been little change in housing affordability in the past year
and a half in Quebec City. RBC’s aggregate measure inched higher by 0.1
percentage points to 32.7% in the fourth quarter.
Saint John – Positive signs continue to emerge
Things are looking up for Saint John’s housing market. Home resales reached
a nine-year high in 2017 and prices began to firm up over the second half of
year. Demand-supply conditions are balanced. The area’s unemployment rate
fell since last spring and population growth picked up in the past couple of
years. Housing affordability isn’t a problem. Quite the opposite, it’s the most
attractive in among the markets that we track. RBC’s aggregate measure was
25.4% in the fourth quarter—the lowest on our list. The measure eased for a
third-straight time by 0.1 percentage points in the latest period.
Halifax – Confidence in the market is rising despite some affordability
erosion
Housing affordability deteriorated modestly since the first quarter of 2017 in
the Halifax area but this shouldn’t be a worry. At 32.3% in the fourth quarter,
RBC’s aggregate measure remained quite attractive. It was still below its long
-run average of 32.7% and the national mark of 48.3% in the quarter. Certain-
ly buyers have demonstrated increasing confidence in the market. Home re-
sales climbed to their highest level in five years in the Halifax area last year.
This tightened up demand-supply conditions to the point that sellers gained a
fair degree of pricing power by the end of the year. A recent spike in the ar-
ea’s employment and drop in its jobless rate, if sustained, bode well for fur-
ther gains in 2018.
St. John’s – Tough challenges remain
St. John’s is a buyer’s market. Still it’s difficult to motivate buyers to jump in
when the provincial economy is so unsettled and job prospects are uncertain.
Home resales dropped to an 11-year low in the area in 2017. Prices remained
generally flat for the third-straight year. Housing affordability is not an issue
because it compares favourably to historical norms. RBC’s aggregate measure
was 27.1% in the fourth quarter, below the long-run average of 27.3%. The
good news is that home resale activity regained some momentum over the
second half of last year—coinciding with the area’s unemployment rate eas-
ing from a 13-year high. This could be a sign that the worst might be behind
us for the market. Yet rapidly slowing population growth—including for peo-
ple of prime-buying age—is a reminder that tough challenges lie ahead.
RBC Housing Affordability Measures
20
40
60
1985 1987 1989 1991 1993 1995 1997 1999 2001 2003 2005 2007 2009 2011 2013 2015 2017
Ownership costs as % of median household incomeSaint John
Source: RPS, Statistics Canada, Bank of Canada, Royal LePage, RBC Economics
Research
Atlantic Canada
20
40
60
1985 1987 1989 1991 1993 1995 1997 1999 2001 2003 2005 2007 2009 2011 2013 2015 2017
Ownership costs as % of median household income
St. John's
20
40
60
1985 1987 1989 1991 1993 1995 1997 1999 2001 2003 2005 2007 2009 2011 2013 2015 2017
Ownership costs as % of median household incomeHalifax

HOUSING TRENDS AND AFFORDABILITY | MARCH 2018 HOUSING TRENDS AND AFFORDABILITY | APRIL 2018
7
The RBC Housing Affordability Measures show the
proportion of median pre-tax household income that
would be required to service the cost of mortgage pay-
ments (principal and interest), property taxes, and utili-
ties based on the average market price for single-family
detached homes and condo apartments, as well as for an
overall aggregate of all housing types in a given market.
Current home prices are sourced from RPS, and estab-
lished from sales prices from monthly transactions,
which are filtered to remove extreme values and other
outliers.
The aggregate of all categories includes information on
prices for housing styles not covered in this report (semi
-detached, row houses, townhouses and plexes) in addi-
tion to prices for single-family detached homes and
condominium apartments. In general, single-family
detached homes and condo apartments represent the
bulk of the owned housing stock across Canadian mar-
kets.
The affordability measures are based on a 25% down
payment, a 25-year mortgage loan at a five-year fixed
rate, and are estimated on a quarterly basis for 14 major
urban markets in Canada and a national composite. The
measures use household income rather than family in-
come to account for the growing number of unattached
individuals in the housing market. The measure is based
on quarterly estimates of this annual income, created by
annualizing and weighting average weekly earnings by
province and by urban area. (Median household income
is used instead of the arithmetic mean to avoid distor-
tions caused by extreme values at either end of the in-
come distribution scale. The median represents the val-
ue below and above which lays an equal number of
observations.)
The RBC Housing Affordability Measure is based on
gross household income estimates and, therefore, does
not show the effect of various provincial property-tax
credits, which could alter relative levels of affordability.
The higher the measure, the more difficult it is to afford
a home. For example, an affordability measure of 50%
means that home ownership costs, including mortgage
payments, utilities, and property taxes take up 50% of a
typical household’s pre-tax income.
Summary tables How the RBC Housing Affordability Measures work
Market Q4 2017 Q/Q Y/Y Q4 2017 Q/Q Y/Y Avg. since '85
($) % ch. % ch. (%) Ppt. ch. Ppt. ch. (%)
Canada 507,800 -0.4 8.5 48.3 -0.2 3.2 39.4
Victoria 773,200 0.5 12.5 61.6 0.5 6.5 44.5
Vancouver area 1,129,800 2.0 11.7 85.2 1.8 8.7 59.3
Calgary 500,700 0.0 3.8 42.1 0.1 1.6 41.0
Edmonton 408,200 -0.3 1.0 27.7 0.1 0.5 33.9
Saskatoon 373,700 0.1 -0.5 33.4 0.2 0.4 32.7
Regina 337,400 0.6 0.4 30.2 0.3 0.5 27.8
Winnipeg 311,200 0.2 5.5 30.6 0.4 1.5 29.1
Toronto area 866,300 -3.0 9.8 75.1 -2.3 6.0 49.7
Ottawa 403,800 0.2 5.6 36.1 -0.1 1.3 34.7
Montreal area 411,400 1.3 4.9 44.1 0.4 1.4 39.1
Quebec City 295,000 0.5 0.1 32.7 0.1 -0.3 29.9
Saint John 199,800 -0.1 -5.7 25.4 -0.1 -0.9 25.9
Halifax 320,000 -0.4 5.2 32.3 0.3 1.6 32.7
St. John's 322,100 1.3 -0.2 27.1 0.2 0.6 27.3
Aggregate of all categories
Price RBC Housing Affordability Measure
Market Q4 2017 Q/Q Y/Y Q4 2017 Q/Q Y/Y Avg. since '85
($) % ch. % ch. (%) Ppt. ch. Ppt. ch. (%)
Canada 557,600 -0.5 8.9 53.3 -0.2 3.7 42.0
Victoria 827,200 0.6 12.5 66.0 0.6 7.0 46.9
Vancouver area 1,570,200 1.6 8.6 116.5 2.1 9.3 69.0
Calgary 548,700 0.3 4.6 46.2 0.3 2.1 43.9
Edmonton 434,600 -0.7 0.9 29.7 0.0 0.5 36.0
Saskatoon 391,800 0.5 2.1 35.6 0.3 1.1 34.2
Regina 338,700 0.6 0.0 31.2 0.2 0.3 28.9
Winnipeg 315,800 0.1 5.0 31.8 0.4 1.5 30.4
Toronto area 1,039,900 -3.3 11.1 89.6 -3.0 8.1 57.3
Ottawa 451,600 0.3 6.4 40.7 -0.1 1.7 38.7
Montreal area 399,400 2.0 6.9 44.0 0.6 1.9 38.1
Quebec City 302,700 -0.1 -0.3 34.5 -0.1 -0.4 30.7
Saint John 210,500 1.0 -5.6 27.4 0.1 -0.9 28.5
Halifax 326,400 -0.8 5.3 33.7 0.3 1.7 33.3
St. John's 336,100 1.5 -0.5 28.8 0.2 0.6 28.8
Single-family detached
Price RBC Housing Affordability Measure
Market Q4 2017 Q/Q Y/Y Q4 2017 Q/Q Y/Y Avg. since '85
($) % ch. % ch. (%) Ppt. ch. Ppt. ch. (%)
Canada 443,100 1.0 15.3 41.1 0.3 4.7 34.1
Victoria 472,500 0.3 14.6 38.8 0.3 4.5 32.2
Vancouver area 626,200 3.1 20.2 48.9 1.5 7.7 39.6
Calgary 289,600 -1.8 -4.6 26.4 -0.3 -0.7 27.0
Edmonton 246,600 -1.4 1.2 18.0 -0.1 0.3 21.6
Saskatoon 220,700 -6.5 -8.2 20.9 -0.9 -1.0 20.4
Regina 239,500 -2.0 -8.2 21.7 -0.2 -1.1 21.8
Winnipeg 232,400 -3.7 -0.3 22.8 -0.4 0.2 22.6
Toronto area 479,100 0.6 19.1 43.1 0.1 5.8 31.4
Ottawa 302,900 -2.3 2.2 26.4 -0.5 0.4 23.8
Montreal area 326,700 0.9 2.4 34.6 0.2 0.4 32.4
Quebec City 245,100 2.1 -0.1 25.9 0.4 -0.2 23.9
Saint John n/a n/a n/a n/a n/a n/a n/a
Halifax 331,900 5.3 0.4 31.5 1.8 0.5 27.7
St. John's 278,300 -0.1 0.1 22.6 -0.1 0.5 23.1
RBC Housing Affordability Measure
Condominium apartment
Price

HOUSING TRENDS AND AFFORDABILITY | APRIL 2018
8
HOUSING TRENDS AND AFFORDABILITY | APRIL 2018
Our standard RBC Housing Affordability Measure captures the proportion of median pre-tax household income required to service the cost of a
mortgage on an existing housing unit at market prices, including principal and interest, property taxes and utilities; the modified measure used here
includes the cost of servicing a mortgage, but excludes property taxes and utilities due to data constraint in the smaller CMAs. This measure is
based on a 25% down payment, a 25-year mortgage loan at a five-year fixed rate, and is estimated on a quarterly basis. The higher the measure, the
more difficult it is to afford a house.
Mortgage carrying costs by city
The dashed line represents the long-term average for the market.
Source: RPS, Statistics Canada, Bank of Canada, Royal LePage, RBC Economics Research

HOUSING TRENDS AND AFFORDABILITY | MARCH 2018 HOUSING TRENDS AND AFFORDABILITY | APRIL 2018
9
Source: RPS, RBC Economics Research
Aggregate home price

HOUSING TRENDS AND AFFORDABILITY | APRIL 2018
10
HOUSING TRENDS AND AFFORDABILITY | APRIL 2018
Source: Canadian Real Estate Association, RBC Economics Research
Home sales-to-new listings ratio
The material contained in this report is the property of Royal Bank of Canada and may not be reproduced in any way, in whole or in part, without express authoriza-tion of the copyright holder in writing. The statements and statistics contained herein have been prepared by RBC Economics Research based on information from
sources considered to be reliable. We make no representation or warranty, express or implied, as to its accuracy or completeness. This publication is for the infor-
mation of investors and business persons and does not constitute an offer to sell or a solicitation to buy securities.
®Registered trademark of Royal Bank of Canada.
©Royal Bank of Canada.