housing market developments - ec.europa.eu
TRANSCRIPT

Page 1 |
1. INTRODUCTION
Housing market developments in the years
preceding the financial crisis, and notably
the accompanying rise in household indebtedness in a number of Member
States, have contributed to the build-up of macroeconomic imbalances. Indeed, before
2008 house prices were characterised by a long and unprecedentedly strong expansion
in most Member States. This expansion was accompanied by large increases in
construction volume and in credit.
Since then, the correction experienced in
EU Member States has been very uneven. In some Member States, notably in Ireland
and Romania, real house prices decreased by more than 50% in the few years
following the crisis. In contrast, in
Belgium, Luxemburg and Sweden, prices have barely adjusted or have continued to
grow.
As the economic recovery is gaining ground, demand factors have picked up.
Accordingly, house prices have accelerated
in most Member States in 2016. This development calls for renewed attention to
the potentially destabilising role that large swings in housing markets can have and
to the potential accelerating role that the credit market can play.
The remainder of this factsheet reviews potential vulnerabilities in the housing
market and policy actions taken in the Member States to address them. It first
looks at developments in house prices and volumes to assess potential risks, notably
linked with credit. Social aspects are also reviewed. In the second section, policy
priorities are discussed, focusing notably
on macro-prudential policy, tax policy and on measures to tackle supply constraints.
Developments in the credit market are an important qualifier for the assessment of
vulnerabilities related to the housing market. This factsheet should therefore be
read in conjunction with the one on the banking sector. Tax policy can also have a
significant impact on housing developments and should be taken into account. Finally, as
housing policy has bearings on social
protection and cohesion, the factsheet on this topic should also be considered.
2. CHALLENGES
2.1. House price dynamics
A number of Member States are experiencing high or rising housing-
market-related vulnerabilities. In a context where interest rates have reach an
historical low and where growth is
strengthening in most Member States, demand pressures on housing markets are
building up. House price increases picked up in most Member States (Figure 1). In
Hungary and Sweden, the cumulative growth of house prices in 2015 and 2016
exceeded 20%. In Greece, Italy and Finland, real house prices continued to
record negative growth in 2016. For
Greece and Italy, this means the ninth consecutive year of house price
contraction. In order to assess the risks of housing price corrections, a number of
valuation techniques can be used to complement the analysis of financial and
housing indicators. These rely on the analysis of developments in the ratio
EUROPEAN SEMESTER THEMATIC FACTSHEET
HOUSING MARKET DEVELOPMENTS

Page 2 |
between house prices and rents (price-to-rent ratio) or households' gross disposable
income per capita (price-to-income ratio). Statistical analysis is also used to
disentangle the contributions of the various house price drivers.
As house price time-series are only available in index, the absolute values for the price-to-
rent and price-to-income ratio are not informative. In particular, they cannot be
compared across countries. As a consequence, the analysis focuses on the
deviation of the price-to-income and price-to-
rent ratios from their long-term average. This gap provides a useful benchmark to gauge
house price developments. The price-to-income ratio provides an indication of the
efforts required by the average household to purchase a house. A level which is far above
the long-term average signals that affordability has reduced. This can affect
demand and bring house prices back to a more affordable level. Similarly, in
equilibrium and for a given cost of capital,
agents should be indifferent to the choice between owning and renting a house. Rent
and house prices should therefore move together. The ratios' deviation from their
long-term value can be interpreted as deviation from the equilibrium on the
housing market. This would result in a change in the demand for rental and owner-
occupied apartments, bringing the price-to-
rent ratio back to its long-term level.
Figure 1 — House price growth
2016 2015 2014 2000-2008 2008-2016
BE 1.1 1.3 -1.3 5.1 0.6
BG 7.5 1.6 1.5 12.9 -5.6
CZ 6.6 3.9 1.8 6.6 -0.2
DK 4.1 6.3 3.0 5.3 -1.0
DE 5.3 4.1 2.2 -1.7 2.5
EE 3.8 7.0 13.1 n.a. -1.2
IE 5.5 8.5 15.5 5.9 -4.5
EL -2.0 -3.5 -5.0 5.1 -7.4
ES 4.7 3.7 0.1 8.1 -5.6
FR 1.0 -1.8 -1.7 7.5 -0.7
HR 2.2 -2.4 -1.1 4.6 -4.3
IT -0.7 -2.6 -4.6 3.6 -3.5
CY 1.4 0.2 -1.3 n.a. -4.0
LV 7.5 -2.7 4.2 12.9 -4.7
LT 4.4 4.6 6.3 12.0 -4.8
LU 5.8 5.9 3.9 7.5 3.6
HU 9.8 11.6 3.2 n.a. -1.9
MT 4.8 5.0 2.5 11.6 0.0
NL 4.4 3.3 0.0 2.4 -2.8
AT 7.2 3.5 1.4 -0.2 4.4
PL 2.4 2.7 1.1 n.a. -3.1
PT 6.0 2.3 3.9 -1.2 -0.9
RO 6.5 1.9 -3.3 n.a. -9.7
SI 3.6 1.4 -6.5 n.a. -4.1
SK 7.0 5.5 1.5 n.a. -2.4
FI -0.3 -0.3 -1.7 3.4 0.0
SE 7.5 12.1 8.2 6.5 5.8
UK 5.8 5.6 6.2 7.5 0.6
Source : Eurostat
% change in deflated House
Prices% CAGR
Page 3 |
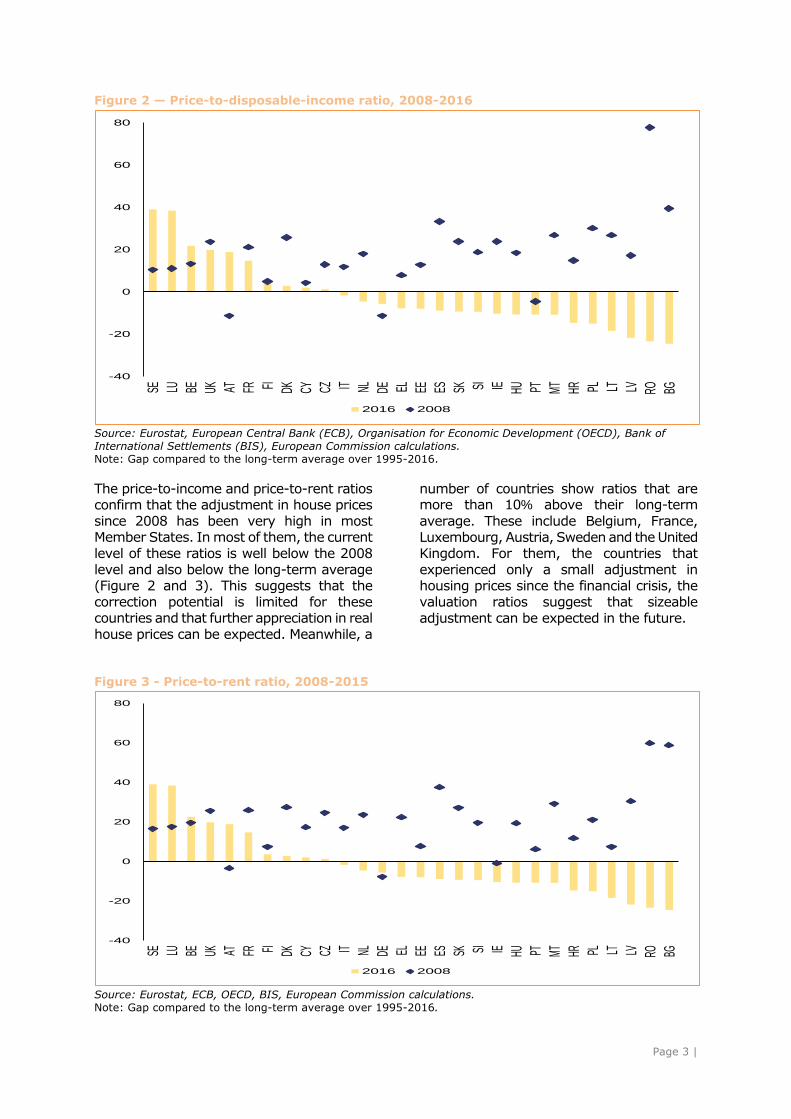
Figure 2 — Price-to-disposable-income ratio, 2008-2016
Source: Eurostat, European Central Bank (ECB), Organisation for Economic Development (OECD), Bank of
International Settlements (BIS), European Commission calculations. Note: Gap compared to the long-term average over 1995-2016.
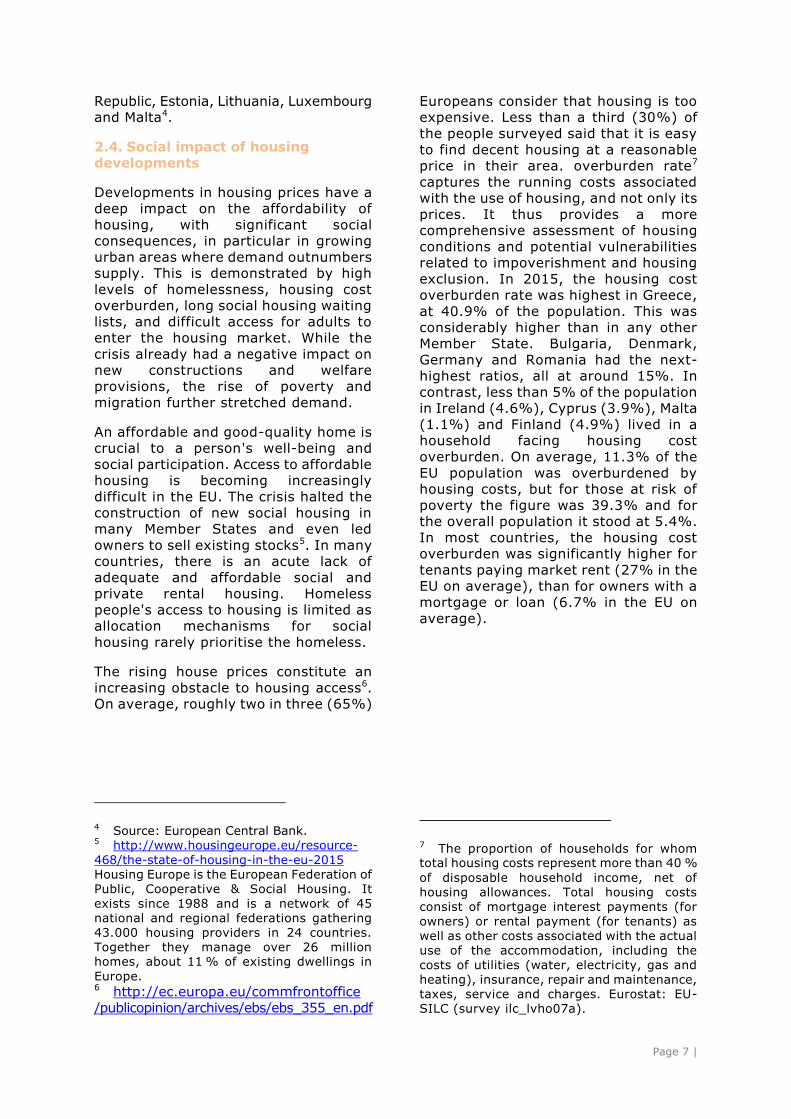
The price-to-income and price-to-rent ratios confirm that the adjustment in house prices
since 2008 has been very high in most Member States. In most of them, the current
level of these ratios is well below the 2008
level and also below the long-term average (Figure 2 and 3). This suggests that the
correction potential is limited for these countries and that further appreciation in real
house prices can be expected. Meanwhile, a
number of countries show ratios that are more than 10% above their long-term
average. These include Belgium, France,
Luxembourg, Austria, Sweden and the United Kingdom. For them, the countries that
experienced only a small adjustment in housing prices since the financial crisis, the
valuation ratios suggest that sizeable
adjustment can be expected in the future.
Figure 3 - Price-to-rent ratio, 2008-2015
Source: Eurostat, ECB, OECD, BIS, European Commission calculations.
Note: Gap compared to the long-term average over 1995-2016.
-40
-20
0
20
40
60
80
SE LU BE UK AT FR FI DK CY CZ IT NL DE EL EE ES SK SI IE HU PT MT
HR PL LT LV RO BG
2016 2008
-40
-20
0
20
40
60
80
SE LU BE UK AT FR FI DK CY CZ IT NL DE EL EE ES SK SI IE HU PT MT HR PL LT LV RO BG
2016 2008

Page 4 |
In order to complement the analysis through valuation ratios, statistical analysis can be
conducted to analyse if the developments in
real house prices are in line with what macroeconomic drivers would suggests1.
Indeed, in some cases, the strong growth in house prices may be linked to demographic
and supply factors, to a pick-up in income or to the particularly low interest rates. In other
cases, these usual fundamental drivers do not suffice to explain the rise in real house
prices. This suggests that house prices could be overvalued. Combining the information
from this fundamental analysis with the
analysis through ratios, a valuation gap is estimated. This makes it possible to map
countries based on the risk of correction in real housing prices and on the recent
developments (Figure 4). The mapping shows that in most Member
States, real house prices are within 10% of the level suggested by the various valuation
metrics. Looking to countries where prices
have increased fast recently, two groups can be delineated. In the first group,
including Luxembourg, Austria, Sweden and the United Kingdom, prices are increasing
at a fast pace although the valuation gaps are sizeable. These countries are thus those
where price dynamics need to be monitored
most closely as they cumulate risks of overvaluation and dynamic price
developments. In a second group, including notably Bulgaria, the Czech Republic,
Latvia, Hungary and Slovakia, house prices have picked up recently and are increasing
fast. Still, real house prices in these Member States remain below the peak
values recorded in 2008 and valuation metrics do not show significant over-
valuation. In these cases, the increase in
prices could give rise to speculative bubbles which may be difficult to deflate. Among
countries with large valuation gaps, Belgium and France stand out. In both countries, the
correction in prices and in valuation metrics following the 2008 crisis was relatively
limited. However, housing price developments since then have remained
muted. As a consequence, while risk have
not deflated significantly since the crisis, the sluggish growth in house prices, if sustained
through the economic recovery, could lead to a soft return towards fundamental values.
Figure 4 — Valuation gap and real growth in house prices, 2016
Source: European Commission, ECB, OECD, BIS, European Commission analysis.
Note: The valuation gap was calculated based on the price-to-rent ratio, the price-to-income ratio and a statistical model for fundamental drivers of house prices.
1 For details on the methodology, see Philiponnet N. and A. Turrini (2017), 'Assessing house price developments in the EU', Discussion paper, European Economy.
BE
DEIE
EL
ES
FR
IT
CY
LU
MT
NL
AT
PT
SI
SK
FI
BG
CZ
DKEE
LV
LT
HU
PL
RO
SE
UK
HR
-2
0
2
4
6
8
10
-30 -20 -10 0 10 20 30 40
Def
late
d H
P gr
owth
, 201
6 (%
)
Estimated valuation gap, 2016 (%)

Page 5 |
2.2. Volume developments
Volume indicators for housing markets are
useful for quantifying developments in construction activity, and should be seen as a
complement to house price developments. In particular, developments in the housing
market are affected by how the housing supply reacts to price and demand pressures.
Supply constraints, which induce a slow response of volumes to prices, can result in
longer episodes of booms and busts, with
higher price volatility. On the other hand, a more responsive housing supply means that
hikes in house prices translate into higher levels of construction activity. While rising
supply has a mitigating effect on price developments, it also means that the
macroeconomic impact of a correction in house prices accompanied by a drop in
volume will be much more severe.
Residential construction is a volume indicator that measures investment in residential
buildings in a given period. On average in the EU, dwelling investment represented 4.7% of
GDP in 20162, markedly below the 6.0% peak reached in 2007 but also below the pre-boom
levels. Investment in dwellings increased in 2016 across the Member States, with only a
few exceptions. This reflects the general
improvement in macroeconomic conditions and shows that, as a share of GDP, dwelling
investment remained close to its 2015 level.
In some Member States (e.g. Spain), the drop in housing investment reflects the
overinvestment of a few years ago; in others,
this is related to impaired credit supply and demand, and regulatory bottlenecks.
Germany, Austria, Sweden and the United Kingdom are the only Member States where
investment in dwellings as a share of GDP was higher in 2016 than before the crisis.
Beyond the actual investment, the number of building permits awarded within a year is an
early indicator of residential investment. This figure gives an indication of the number of
development projects under way. Building
permits have rebounded in 2016, with strong growth recorded in some countries, notably
those where the construction sector suffered most following the crisis (Figure 5). The
Netherlands and Romania are the only Member States in which issuance of new
building permits is still decreasing. At the other extreme, the number of building
permits is increasing fast in some Member
States, notably in Hungary and Malta. Despite the recent growth, construction activity in
2016 was generally well below its pre-crisis level. Germany, Lithuania, Poland, Slovakia,
and Sweden are notable exceptions. In these Member States, the number of building
permits issued is above the average recorded for the 2000-2007 period and continues to
increase at an annual rate of more than 10%.
Figure 5 — Number of building permits, in % change, 2016
Source: European Commission.
Note: Data for Luxembourg is not included.
2 Source: European Commission.
-100
-50
0
50
100
150
200
NL RO EL IT SI FI BG CZ UK DK EE AT ES PT IE CY LV HRHU FR BE MTDE SK PL LT SE
Contracting <10% growth p.a. >10% growth p.a.
Level relative to 2000-07 average Latest annual growth rate

Page 6 |
While building permits focus on new buildings, the number of residential
property transactions relates to both new
and existing buildings. As is the case for building permits, the number of overall
transactions has decreased dramatically
after the crisis and now appears to be picking up again. Still, this process
remains very slow and both the number
and the total values of transactions remain well below pre-crisis levels
(Figure 6).
Figure 6 — House transactions, 2007-2016
Source: ECB
Note: Data for the EU-28 where available. When information for a specific country is missing, values
are grossed up to the EU-28 average to avoid that the aggregate is impacted by country composition.
2.3. Impact of credit developments
Besides the potential valuation gap, the potential risks stemming from housing
price developments are notably linked to the level of banks' exposure to mortgages
and the indebtedness of households. Developments in the housing market can
significantly contribute to vulnerabilities in
the financial sector. This includes banks' growing reliance on mortgages,
persistently high leverage and weak lending standards (e.g. elevated loan-to-
value ratios, long loan amortisation maturities, low risk-weights on banks'
balance sheets for real estate exposure, etc.). In countries where household
indebtedness is high (e.g. Denmark, the
Netherlands and the United Kingdom), challenges linked to households' financing
capacity may also be a risk for banks3.
3 Source: European Commission.
While house prices and construction
appear to be picking up in most Member
States, developments in mortgages are more subdued. In a number of Member
States, households still face significant deleveraging needs. Notably, household
debt exceeds gross disposable income in almost half of Member States. The flow
of mortgages is still negative in Ireland, Spain, Portugal and the United Kingdom.
In some cases, notably in Hungary and
Croatia, the lingering vulnerabilities in the banking sector weigh on mortgages.
In contrast, some Member States are
experiencing very strong growth in mortgages, suggesting risks of a credit-
induced housing boom in some of them.
In 2016, annual mortgage growth exceeded 10% in Romania and Slovakia
and was above 5% in Belgium, the Czech
0
1000
2000
3000
4000
5000
6000
7000
0
200000
400000
600000
800000
1000000
1200000
1400000
1600000
2007 2008 2009 2010 2011 2012 2013 2014 2015
Value (EUR bn.) Number ('000)
Page 7 |
Republic, Estonia, Lithuania, Luxembourg and Malta4.
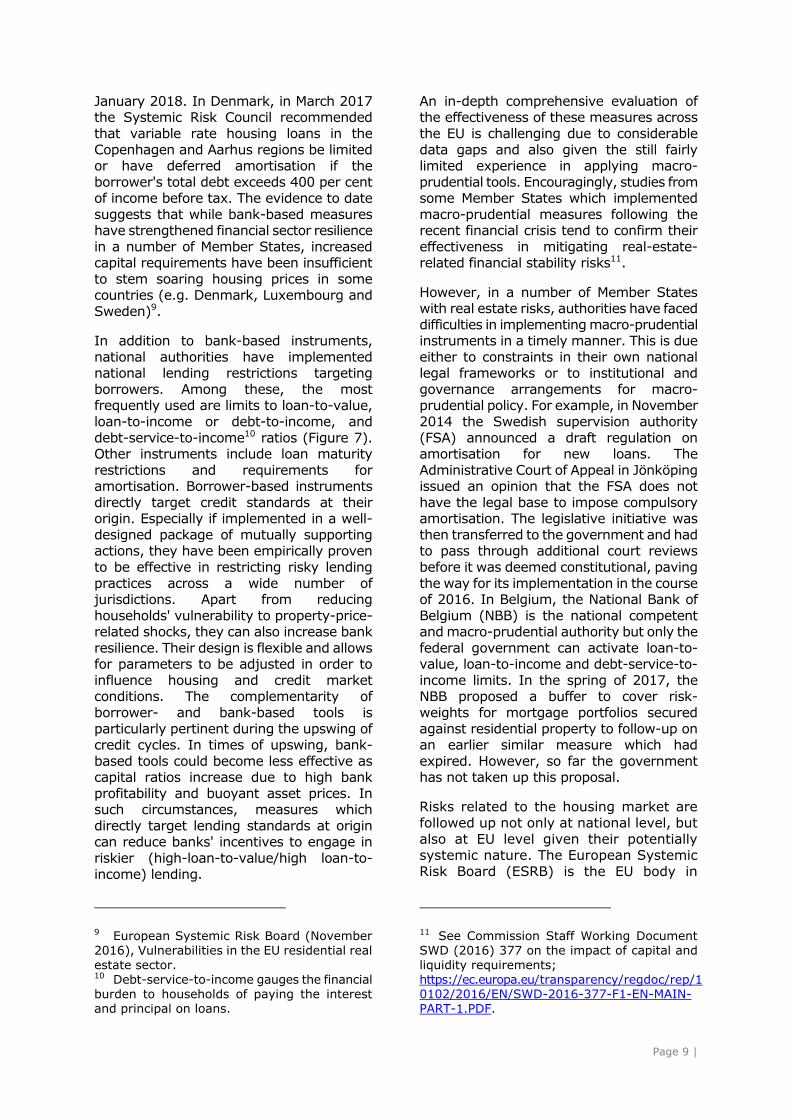
2.4. Social impact of housing developments
Developments in housing prices have a
deep impact on the affordability of
housing, with significant social consequences, in particular in growing
urban areas where demand outnumbers supply. This is demonstrated by high
levels of homelessness, housing cost overburden, long social housing waiting
lists, and difficult access for adults to enter the housing market. While the
crisis already had a negative impact on new constructions and welfare
provisions, the rise of poverty and
migration further stretched demand.
An affordable and good-quality home is crucial to a person's well-being and
social participation. Access to affordable housing is becoming increasingly
difficult in the EU. The crisis halted the
construction of new social housing in many Member States and even led
owners to sell existing stocks5. In many countries, there is an acute lack of
adequate and affordable social and private rental housing. Homeless
people's access to housing is limited as allocation mechanisms for social
housing rarely prioritise the homeless.
The rising house prices constitute an
increasing obstacle to housing access6. On average, roughly two in three (65%)
4 Source: European Central Bank. 5 http://www.housingeurope.eu/resource-
468/the-state-of-housing-in-the-eu-2015 Housing Europe is the European Federation of Public, Cooperative & Social Housing. It
exists since 1988 and is a network of 45 national and regional federations gathering
43.000 housing providers in 24 countries. Together they manage over 26 million homes, about 11 % of existing dwellings in
Europe. 6 http://ec.europa.eu/commfrontoffice /publicopinion/archives/ebs/ebs_355_en.pdf
Europeans consider that housing is too expensive. Less than a third (30%) of
the people surveyed said that it is easy
to find decent housing at a reasonable price in their area. overburden rate7
captures the running costs associated with the use of housing, and not only its
prices. It thus provides a more comprehensive assessment of housing
conditions and potential vulnerabilities related to impoverishment and housing
exclusion. In 2015, the housing cost overburden rate was highest in Greece,
at 40.9% of the population. This was
considerably higher than in any other Member State. Bulgaria, Denmark,
Germany and Romania had the next-highest ratios, all at around 15%. In
contrast, less than 5% of the population in Ireland (4.6%), Cyprus (3.9%), Malta
(1.1%) and Finland (4.9%) lived in a household facing housing cost
overburden. On average, 11.3% of the
EU population was overburdened by housing costs, but for those at risk of
poverty the figure was 39.3% and for the overall population it stood at 5.4%.
In most countries, the housing cost overburden was significantly higher for
tenants paying market rent (27% in the EU on average), than for owners with a
mortgage or loan (6.7% in the EU on
average).
7 The proportion of households for whom total housing costs represent more than 40 %
of disposable household income, net of housing allowances. Total housing costs consist of mortgage interest payments (for
owners) or rental payment (for tenants) as
well as other costs associated with the actual use of the accommodation, including the
costs of utilities (water, electricity, gas and heating), insurance, repair and maintenance, taxes, service and charges. Eurostat: EU-SILC (survey ilc_lvho07a).

Page 8 |
Figure 7 — Housing cost overburden rate by poverty status — 2015
Source: Eurostat
Households struggling with mortgage and
rent arrears, high utility bills and over-indebtedness and which are not receiving
any support may in the end face repossession and eviction. For the 2010-
2013 period, a sharp rise in evictions has
been registered in Bulgaria, Ireland, Spain, Cyprus, Latvia, Netherlands and the
United Kingdom8.
3. POLICY RESPONSES IN THE MEMBER STATES
Public policies can fuel or mitigate the build-up of vulnerabilities in the housing
sector. In a number of Member States, fiscal measures (e.g. deductibility of
mortgage interest payments) reduce the marginal cost of acquiring housing, which
- together with low interest rates and
expectations of future house price increases - can increase the potential for
speculative property investments by households and increases in household
leverage. Furthermore, supply-side measures (e.g. to boost the construction
of new properties amid high demand and rising property prices) can help improve
the responsiveness of the house supply to
potential price increases, limiting the risk of prices spiralling up. Given the strong
8 FEANTSA is the European Federation of National Organisations Working with the
Homeless http://www.feantsa.org/en/report/2017/03/21/the-second-overview-of-housing-exclusion-in-europe-2017.
link between housing and credit, macro-
prudential policies, which seek to ensure financial stability, can have a strong
impact on housing market developments.
3.1. Macro-prudential policies
Several Member States have actively
implemented macro-prudential measures to address vulnerabilities stemming from the
real estate sector. Their primary objective is
to dampen the inherent pro-cyclical dynamics between property lending and
housing prices but they also strengthen the resilience of the banking and household
sectors to financial shocks. Macro-prudential measures can take the form of bank-based
measures or borrower-based measures.
Measures targeting banks typically aim to
ensure appropriate capital requirements and impose a capital buffer to this end. Such
buffers can target economy-wide systemic risk but also be directly related to exposures
to real estate. Other macro-prudential measures may, for instance, aim to align
the risk-weights for specific items on banks'
balance sheets - such as mortgage loans - with risk profiles. Specific capital require-
ment add-ons for mortgage portfolios have been introduced in a number of Member
States (e.g. Belgium, Estonia, Austria, Slovakia and Sweden) with the aim of
increasing the banking sector's resilience amid heightened real-estate-related
vulnerabilities. Finland will introduce an
institution-specific risk-weight floor for mortgages on houses on its territory as of
Page 9 |
January 2018. In Denmark, in March 2017 the Systemic Risk Council recommended
that variable rate housing loans in the
Copenhagen and Aarhus regions be limited or have deferred amortisation if the
borrower's total debt exceeds 400 per cent of income before tax. The evidence to date
suggests that while bank-based measures have strengthened financial sector resilience
in a number of Member States, increased capital requirements have been insufficient
to stem soaring housing prices in some countries (e.g. Denmark, Luxembourg and
Sweden)9.
In addition to bank-based instruments,
national authorities have implemented national lending restrictions targeting
borrowers. Among these, the most frequently used are limits to loan-to-value,
loan-to-income or debt-to-income, and
debt-service-to-income10 ratios (Figure 7). Other instruments include loan maturity
restrictions and requirements for amortisation. Borrower-based instruments
directly target credit standards at their origin. Especially if implemented in a well-
designed package of mutually supporting actions, they have been empirically proven
to be effective in restricting risky lending
practices across a wide number of jurisdictions. Apart from reducing
households' vulnerability to property-price-related shocks, they can also increase bank
resilience. Their design is flexible and allows for parameters to be adjusted in order to
influence housing and credit market conditions. The complementarity of
borrower- and bank-based tools is
particularly pertinent during the upswing of credit cycles. In times of upswing, bank-
based tools could become less effective as capital ratios increase due to high bank
profitability and buoyant asset prices. In such circumstances, measures which
directly target lending standards at origin can reduce banks' incentives to engage in
riskier (high-loan-to-value/high loan-to-
income) lending.
9 European Systemic Risk Board (November 2016), Vulnerabilities in the EU residential real
estate sector. 10 Debt-service-to-income gauges the financial burden to households of paying the interest and principal on loans.
An in-depth comprehensive evaluation of the effectiveness of these measures across
the EU is challenging due to considerable
data gaps and also given the still fairly limited experience in applying macro-
prudential tools. Encouragingly, studies from some Member States which implemented
macro-prudential measures following the recent financial crisis tend to confirm their
effectiveness in mitigating real-estate-related financial stability risks11.
However, in a number of Member States with real estate risks, authorities have faced
difficulties in implementing macro-prudential instruments in a timely manner. This is due
either to constraints in their own national legal frameworks or to institutional and
governance arrangements for macro-prudential policy. For example, in November
2014 the Swedish supervision authority
(FSA) announced a draft regulation on amortisation for new loans. The
Administrative Court of Appeal in Jönköping issued an opinion that the FSA does not
have the legal base to impose compulsory amortisation. The legislative initiative was
then transferred to the government and had to pass through additional court reviews
before it was deemed constitutional, paving
the way for its implementation in the course of 2016. In Belgium, the National Bank of
Belgium (NBB) is the national competent and macro-prudential authority but only the
federal government can activate loan-to-value, loan-to-income and debt-service-to-
income limits. In the spring of 2017, the NBB proposed a buffer to cover risk-
weights for mortgage portfolios secured
against residential property to follow-up on an earlier similar measure which had
expired. However, so far the government has not taken up this proposal.
Risks related to the housing market are
followed up not only at national level, but
also at EU level given their potentially systemic nature. The European Systemic
Risk Board (ESRB) is the EU body in
11 See Commission Staff Working Document SWD (2016) 377 on the impact of capital and
liquidity requirements; https://ec.europa.eu/transparency/regdoc/rep/10102/2016/EN/SWD-2016-377-F1-EN-MAIN-PART-1.PDF.

Page 10 |
charge of monitoring macro-financial risks. It has a mandate to issue warnings
when significant systemic risks are
identified and when it is necessary to flag them. The ESRB has undertaken
systematic work on analysing vulnerabilities in the EU residential real
estate sector. In November 2016, this culminated in the ESRB issuing warnings
for eight EU Member States: Belgium, Denmark, Luxembourg, the Netherlands,
Austria, Finland, Sweden, and the United Kingdom12. The key vulnerabilities
highlighted by the ESRB assessment are
of a medium-term nature. They relate in particular to: high or rising household
indebtedness, notably in Belgium, Denmark, the Netherlands, Finland,
Sweden and the United Kingdom; overvaluation or strong price dynamics of
residential real estate, e.g. in Belgium, Denmark, Luxemburg, Austria, Sweden
and the United Kingdom; loosening
lending conditions or the pace of bank lending, e.g. in Austria, Belgium and
Luxemburg; and/or potential spill-over effects for other countries especially in
the Nordic-Baltic region if risks were to
materialise e.g. in Denmark, Finland and Sweden. As regards the remaining
Member States, the ESRB either did not identify a build-up of material
vulnerabilities relating to the residential real estate sector, or identified such
vulnerabilities but considered that the policy stance was sufficient to address
them. This was the case for Estonia and Slovakia.
Since the ESRB warnings were issued,
country-specific monitoring under the European Semester will follow real estate
developments in the countries for which real-estate-related stability risks are a
concern. The analysis of real estate markets in the EU is hampered by
sizeable data gaps, however. Against this background, the ESRB has issued a
specific recommendation on closing real
estate data gaps13.
Figure 7 — Macro-prudential measures targeting real estate risks on bank balance sheets
Source: ESR
Note: LTI – Loan-to-value; LTI – Loan-to-income; DTI – Debt-to-income; DSTI – Debt service-to-
income; PTI – Price-to-income.
12 ESRB press release of 28 November 2016: http://www.esrb.europa.eu/news/pr/date/2016/
html/pr161128.en.html. 13 See: http://www.esrb.europa.eu/pub/pdf/recommendations/2016/ESRB_2016_14.en.pdf.
Measure EU Member State(s) using the measure
Adjusted risk-weights BE, HR, IE, LU, MT, RO, SI, FI, SE, UK
LTV limits CZ, DK, EE, IE, CY, LV, LT, LU, HU, MT, NL,
PL, RO, SK, FI, SE
LTI/DTI limits IE, PL, UK
DSTI/PTI limits EE, CY, LT, HU, PL, RO, SK
Stress test/sensitivity test/other
prudent lending standards requirements
BE, CZ, DK, IE, CY, LU, RO, SK, UK
Loan maturity EE, LT, NL, PL, RO, SK
Loan amortisation requirements DK, NL, SK, SE
Page 11 |
3.2. Tax policy
Housing-related tax policy can shape
incentives on the housing market. Tax
measures can notably weigh on the preference between renting and buying.
Two specific types of measure are important in this respect. First, the tax system may
induce a debt-bias, thus favouring home ownership. Indeed, more than one-third of
Member States have a tax system that subsidises mortgage debt financing, notably
through mortgage interest deductibility. Steps to reduce such measures have been
taken in recent years, as they often
encourage house price hikes and favour high-income households. In particular, the
countries where mortgage interest deductibility remains important, i.e.
Belgium, Denmark, the Netherlands, and Sweden, are all characterised by high
household indebtedness and have seen a significant increase in housing prices. In
2017, the Council addressed country-
specific recommendations to the Netherlands and Sweden to reduce
mortgage tax deductibility so as to reduce distortions on the housing market.
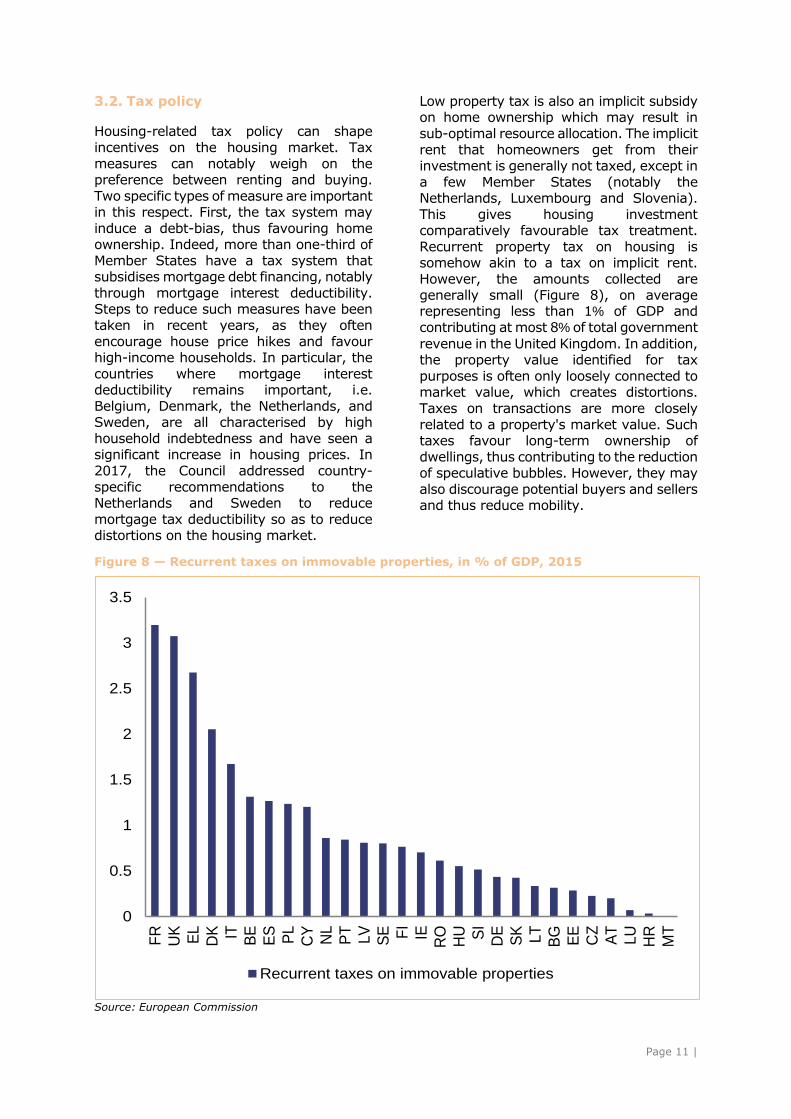
Low property tax is also an implicit subsidy on home ownership which may result in
sub-optimal resource allocation. The implicit
rent that homeowners get from their investment is generally not taxed, except in
a few Member States (notably the Netherlands, Luxembourg and Slovenia).
This gives housing investment comparatively favourable tax treatment.
Recurrent property tax on housing is somehow akin to a tax on implicit rent.
However, the amounts collected are generally small (Figure 8), on average representing less than 1% of GDP and
contributing at most 8% of total government
revenue in the United Kingdom. In addition, the property value identified for tax
purposes is often only loosely connected to market value, which creates distortions.
Taxes on transactions are more closely
related to a property's market value. Such taxes favour long-term ownership of
dwellings, thus contributing to the reduction of speculative bubbles. However, they may
also discourage potential buyers and sellers and thus reduce mobility.
Figure 8 — Recurrent taxes on immovable properties, in % of GDP, 2015
Source: European Commission
0
0.5
1
1.5
2
2.5
3
3.5
FR
UK
EL
DK IT BE
ES
PL
CY
NL
PT
LV
SE FI
IE
RO
HU SI
DE
SK LT
BG
EE
CZ
AT
LU
HR
MT
Recurrent taxes on immovable properties

Page 12 |
3.3. Addressing supply constraints
3.3.1. Zoning restrictions
Restrictions on the supply of housing, such
as zoning or construction regulations, result in higher elasticity of prices to
housing demand. In countries with
significant demographic pressure, this contributed to an increase in prices, with
differentiated impact on the various regions. Relaxing zoning regulations in a
context of accelerating housing prices can lead to resources being diverted towards
the construction sector. In 2017, the Council addressed country-specific
recommendations to Sweden and the United Kingdom recommending that they
support investment and construction,
notably by revising planning rules.
3.3.2. Rental market regulations
The way the rental market operates can
have deep implications for housing market dynamics. Because they are an essential
source of affordable housing, rental markets are usually subject to strong
public intervention with, on average, one
third of tenants in the EU paying a reduced or no rent. Beyond such social
measures, market rents themselves can be controlled, notably through caps on
annual rent increases. The degree of rent control is particularly strong in Denmark,
Austria, Sweden and Germany14. On the one hand, a higher degree of rent control
protects tenants from booms and busts in the housing market. On the other hand, it
may result in rents being disconnected
from house prices, thus depressing rental yields when house prices increase and
discouraging the supply of rental housing, which contributes to a home ownership
bias.
Date: 22.11.2017
14 Bricongne J.-C. and A. Mordonu (forthcoming), 'Rental Market in a macroeconomic context',
European Economy based on a methodology described in Cuerpo C., P. Pontuch and S. Kalantaryan (2014), 'Rental market regulation in the European Union', European Economy.