housing finance at a glance
TRANSCRIPT
August 2021
1
A MONTHLY CHARTBOOK
HOUSING FINANCE POLICY CENTER
HOUSING FINANCEAT A GLANCE

ABOUT THE CHARTBOOK
The Housing Finance Policy Center’s (HFPC) mission is to produce analyses and ideas that promote sound public policy, efficient markets, and access to economic opportunity in the area of housing finance. At A Glance, a monthly chartbook and data source for policymakers, academics, journalists, and others interested in the government’s role in mortgage markets, is at the heart of this mission.
We welcome feedback from our readers on how we can make At A Glance a more useful publication. Please email any comments or questions to [email protected].
To receive regular updates from the Housing Finance Policy Center, please visit here to sign up for our bi-weekly newsletter.
HOUSING FINANCE POLICY CENTER STAFF
Laurie GoodmanCenter Vice President
Janneke RatcliffeAssociate Vice President and Managing Director
Jim ParrottNonresident Fellow
Jun ZhuNonresident Fellow
DeQuendre Neeley-BertrandDirector of Strategic Communications
Karan KaulSenior Research Associate
Michael Neal Senior Research Associate
Jung ChoiSenior Research Associate
Linna ZhuResearch Associate
John WalshResearch Analyst
Peter MattinglyResearch Analyst
Caitlin YoungResearch Assistant
Daniel PangResearch Assistant
Liam ReynoldsResearch Assistant
Alison Rincon Director, Center Operations
Gideon Berger Senior Policy Program Manager
CONTENTSOverview
Market Size OverviewValue of the US Residential Housing Market 6Size of the US Residential Mortgage Market 6Private Label Securities 7Agency Mortgage-Backed Securities 7
Origination Volume and Composition First Lien Origination Volume & Share 8
Mortgage Origination Product TypeComposition (All Originations)9Percent Refi at Issuance
9Cash-Out Refinances
Loan Amount After Refinancing10Cash-out Refinance Share of All Originations 10Total Home Equity Cashed Out 10
Nonbank Origination ShareNonbank Origination Share: All Loans 11Nonbank Origination Share: Purchase Loans 11Nonbank Origination Share: Refi Loans 11
Securitization Volume and CompositionAgency/Non-Agency Share of Residential MBS Issuance 12Non-Agency MBS Issuance 12Non-Agency Securitization 12
Credit Box
Housing Credit Availability Index (HCAI)Housing Credit Availability Index 13Housing Credit Availability Index by Channel 13-14
Credit Availability for Purchase LoansBorrower FICO Score at Origination Month 15Combined LTV at Origination Month 15DTI at Origination Month 15Origination FICO and LTV by MSA 16
Nonbank Credit BoxAgency FICO: Bank vs. Nonbank 17GSE FICO: Bank vs. Nonbank 17Ginnie Mae FICO: Bank vs. Nonbank 17GSE LTV: Bank vs. Nonbank 18Ginnie Mae LTV: Bank vs. Nonbank 18GSE DTI: Bank vs. Nonbank 18Ginnie Mae DTI: Bank vs. Nonbank 18
State of the Market
Mortgage Origination Projections & Originator ProfitabilityTotal Originations and Refinance Shares 19Originator Profitability and Unmeasured Costs 19

Housing SupplyMonths of Supply 20Housing Starts and Home Sales 20
Housing Affordability National Housing Affordability Over Time 21Affordability Adjusted for MSA-Level DTI 21
Home Price IndicesNational Year-Over-Year HPI Growth 22Changes in CoreLogic HPI for Top MSAs 22
First-Time HomebuyersFirst-Time Homebuyer Share 23Comparison of First-time and Repeat Homebuyers, GSE and FHA Originations 23
Delinquencies and Loss Mitigation Activity Negative Equity Share 24Loans in Serious Delinquency/Foreclosure 24Forbearance Rates by Channel 24
GSEs under Conservatorship
GSE Portfolio Wind-DownFannie Mae Mortgage-Related Investment Portfolio 25Freddie Mac Mortgage-Related Investment Portfolio 25
Effective Guarantee Fees & GSE Risk-Sharing Transactions Effective Guarantee Fees 26Fannie Mae Upfront Loan-Level Price Adjustment 26GSE Risk-Sharing Transactions and Spreads 27-28
Serious Delinquency RatesSerious Delinquency Rates – Fannie Mae, Freddie Mac, FHA & VA 29Serious Delinquency Rates – Single-Family Loans & Multifamily GSE Loans 29
Agency Issuance
Agency Gross and Net IssuanceAgency Gross Issuance 30Agency Net Issuance 30
Agency Gross Issuance & Fed PurchasesMonthly Gross Issuance 31Fed Absorption of Agency Gross Issuance 31
Mortgage Insurance ActivityMI Activity & Market Share 32FHA MI Premiums for Typical Purchase Loan 33Initial Monthly Payment Comparison: FHA vs. PMI 33
Related HFPC Work
Publications and Events 34

0%
2%
4%
6%
8%
10%
12%
14%
16%
18%
20%
2013 2014 2015 2016 2017 2018 2019 2020 2021
Second and Investment home Share
12-month moving average
GSE Second and Investor Home Loan Share of All Loans Acquired
Source: FHFA and Urban Institute calculations of eMBS data.
INTRODUCTIONThe GSE second and investor home share fallsIn addition to loans on primary residences, Fannie Mae and Freddie Mac, the government-sponsored enterprises (GSEs), also purchase loans used for second and investor homes. Prior to the cyclical recovery in home sales in the second half of 2020, the share of second and investor home loans acquired by the GSEs had been on a sustained downward trend that predated the onset of the COVID-19 recession.
On a 12-month moving average basis, the share of second and investor home loans acquired by the GSEs fell 3.9 percentage points between January 2019 and July 2020 from 12 percent to 8.1 percent. This coincides with an increase in the refinancing activity, and second and investor home. In particular, investor homes are more expensive to refinance due to substantial loan level pricing adjustments (LLPAs), upfront risk-based fees assessed on new mortgage loans.
However, since January 2021, the share of second and investor home loans acquired by the GSEs has fallen, first slowly between January and March, and then more rapidly beginning in April. As a result, the 12-month moving average of the GSE second and investor home loan share began to fall in May and sits at 8.5 percent in June.
The drop in the GSE second and investor home loan share followed a change to the senior preferred stock purchase agreements (PSPAs) made on January 14, 2021 that placed a seven percent cap on GSE acquisitions of second and investor home loans. And the accelerating decline comes amid reports that the GSEs began requiring some lenders to adjust loan deliveries as early as April. Instead of GSE execution, some of these second and investor home loans were instead securitized into non-agency mortgage-backed securities or traded as portfolio loans. However, there were some temporary disruptions, as originators scrambled to find a home for these loans.
The market disruptions were magnified by the look-back implied by the rule. The seven percent cap is calculated on a 52-week rolling basis, which means that the pace of acquisitions must drop quickly and dramatically in order to push the GSE share below an average of seven percent over a one-year period. Even after falling by seven percentage points between January and June, the 12-month moving average, a proxy for the 52-week rolling basis calculation, currently still exceeds seven percent because the GSE share exceeded this threshold between July 2020 and April 2021. And since the GSE second and investor home loan share was rising through the end of 2020, due mostly to seasonal factors, getting below the seven percent level by the end of this year will be difficult.
And since the GSE second and investor home loan share was rising through the end of 2020, due mostly to seasonal factors, getting below the seven percent level by the end of this year will be difficult. To the extent the cap reflects concerns about risk, we note that LLPAs on second homes and investment properties more than adequately cover this risk. Second home mortgages with LTVs over 80 percent pay an additional 25 basis points, while investment properties pay additional LLPAs ranging from 2.125 to 4.125 percent depending on LTV. Given the market disruptions that have materialized, as we have argued before, it is worth reviewingthis change to the PSPAs.
INSIDE THIS ISSUE
• Serious delinquency rates, while still elevated, continued to decline for GSEs and FHA in June 2021 as more borrowers resume making payments (Page 29).
• The PMI share of mortgage insurance market stood at 44.4 percent in Q2 2021, compared to 45.3 percent in Q2 2020. In comparison, the FHA share increased slightly from 22.4 to 24.4 percent over the same period (Page 32).

7.8
0
1
2
3
4
5
6
7
8
2000
:Q1
2000
:Q4
2001
:Q3
2002
:Q2
2003
:Q1
2003
:Q4
2004
:Q3
2005
:Q2
2006
:Q1
2006
:Q4
2007
:Q3
2008
:Q2
2009
:Q1
2009
:Q4
2010
:Q3
2011
:Q2
2012
:Q1
2012
:Q4
2013
:Q3
2014
:Q2
2015
:Q1
2015
:Q4
2016
:Q3
2017
:Q2
2018
:Q1
2018
:Q4
2019
:Q3
2020
:Q2
2021
:Q1
Agency MBS Private Label Securities
Home Equity Loans Unsecuritized First Liens (Bank Portfolio)
Unsecuritized First Liens (Other)
Sources: Federal Reserve Flow of Funds and Urban Institute. Last updated June 2021.Notes: Unsecuritized First Liens (Other) includes mortgages not held on bank balance sheets.
Composition of the US Single Family Mortgage Market($ trillions)
2.2
1.0
6
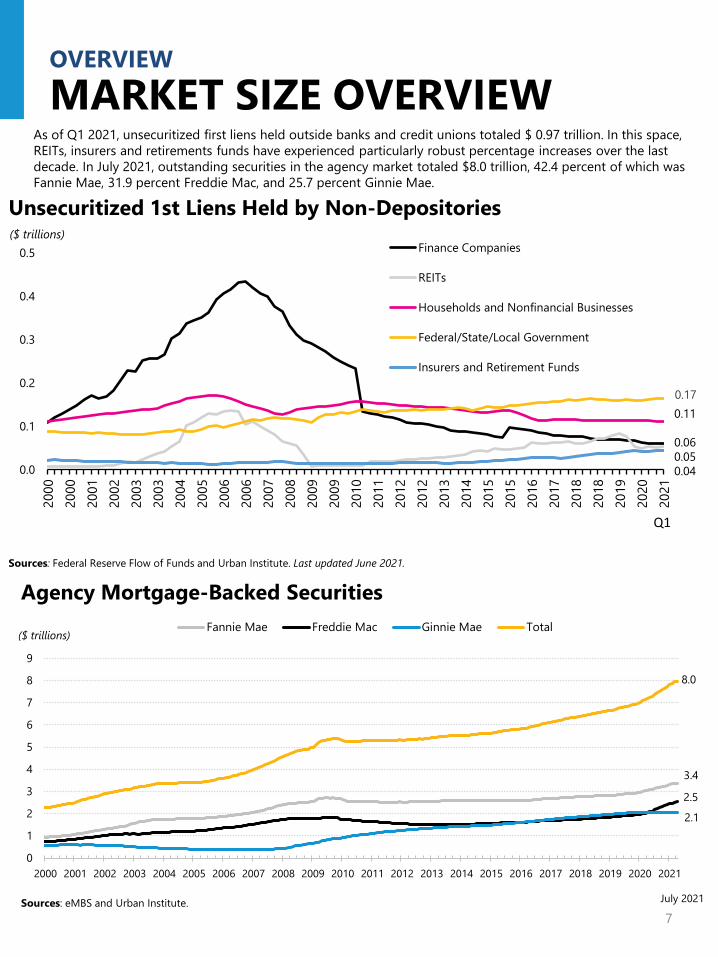
MARKET SIZE OVERVIEWThe Federal Reserve’s Flow of Funds Report has indicated a gradually increasing total value of the housing market, driven primarily by growing home equity since 2012. Mortgage debt outstanding increased slightly from $11.7 trillion in Q4 2020 to $11.8 trillion in Q1 2021, while total household equity increased from $22.4 trillion to $24.2 trillion. The total value of the housing market reached $36.0 trillion in the first quarter of 2021, 40.8 percent higher than the pre-crisis peak in 2006. Agency MBS account for 66.0 percent of the total mortgage debt outstanding, private-label securities make up 3.3 percent, and home equity loans make up 3.6 percent. Unsecuritized first liens comprise the remaining 27.1 percent with banks making up 18.9 percent, credit unions 4.5 percent, and other non-depositories accounting for 3.7 percent of the total.
OVERVIEW
$11.8
$24.2
$36.0
0.05.0
10.015.020.025.030.035.040.0
2000 2001 2002 2003 2004 2005 2006 2007 2008 2009 2010 2011 2012 2013 2014 2015 2016 2017 2018 2019 2020 2021Q1
($ trillions)Debt Household equity Total value
Value of the US Single Family Housing Market
Sources: Federal Reserve Flow of Funds and Urban Institute. Last updated June 2021.Note: Single family includes 1-4 family mortgages. The home equity number is grossed up from Fed totals to include the value of households and the non-financial business sector.
0.4
7
MARKET SIZE OVERVIEWOVERVIEW
As of Q1 2021, unsecuritized first liens held outside banks and credit unions totaled $ 0.97 trillion. In this space, REITs, insurers and retirements funds have experienced particularly robust percentage increases over the last decade. In July 2021, outstanding securities in the agency market totaled $8.0 trillion, 42.4 percent of which was Fannie Mae, 31.9 percent Freddie Mac, and 25.7 percent Ginnie Mae.
3.4
2.1
2.5
8.0
0
1
2
3
4
5
6
7
8
9
2000 2001 2002 2003 2004 2005 2006 2007 2008 2009 2010 2011 2012 2013 2014 2015 2016 2017 2018 2019 2020 2021
($ trillions)Fannie Mae Freddie Mac Ginnie Mae Total
Agency Mortgage-Backed Securities
Sources: eMBS and Urban Institute. July 2021
0.17
0.0
0.1
0.2
0.3
0.4
0.5
2000
2000
2001
2002
2003
2003
2004
2005
2006
2006
2007
2008
2009
2009
2010
2011
2012
2012
2013
2014
2015
2015
2016
2017
2018
2018
2019
2020
2021
Finance Companies
REITs
Households and Nonfinancial Businesses
Federal/State/Local Government
Insurers and Retirement Funds
Sources: Federal Reserve Flow of Funds and Urban Institute. Last updated June 2021.
Unsecuritized 1st Liens Held by Non-Depositories($ trillions)
0.11
0.060.050.04
Q1

8
OVERVIEWORIGINATION VOLUMEAND COMPOSITION
$0.0
$0.5
$1.0
$1.5
$2.0
$2.5
$3.0
$3.5
$4.0
$4.5
2001 2002 2003 2004 2005 2006 2007 2008 2009 2010 2011 2012 2013 2014 2015 2016 2017 2018 2019 2020 2021Q1
2021Q2
($ trillions)
First Lien Origination Volume
GSE securitization FHA/VA securitization PLS securitization Portfolio
Mortgage origination activity remained very strong in the second quarter of 2021, totaling $1.23 trillion. The share of portfolio originations was 24.6 percent in the second quarter of 2021, a slight decrease from the 24.7 percent share in the second quarter of 2020. The GSE share was higher in the second quarter of 2021 at 58.0 percent, compared to 56.9 percent in the second quarter of 2020. The FHA/VA share in the second quarter of 2021 stood at 15.5 percent, down from 17.5 percent in the second quarter of 2020. The PLS share was slightly higher in the second quarter of 2021 at 1.93 percent, compared to 0.80 percent in the second quarter of 2020, but a fraction of its share pre-2008. The smaller share of portfolio and PLS in 2020relative to 2019 reflects the impact of COVID-19, which made it difficult to originate mortgages without government support. The higher GSE share in 2020 and 2021 reflects heavy refinance activity. With private capital pulling back because of the COVID-19 downturn, the federal government played an outsized role in the market in 2020 relative to 2019, a trend that largely persists into 2021.
Sources: Inside Mortgage Finance and Urban Institute. Last updated August 2021.
$302.6
$23.8
$190.8
$712.9
0%
10%
20%
30%
40%
50%
60%
70%
80%
90%
100%
2001 2002 2003 2004 2005 2006 2007 2008 2009 2010 2011 2012 2013 2014 2015 2016 2017 2018 2019 2020 2021Q1
2021Q2
Sources: Inside Mortgage Finance and Urban Institute. Last updated August 2021.
(Share, percent)
24.6%
1.9%
15.5%
58.0%

9
MORTGAGE ORIGINATION PRODUCT TYPEThe 30-year fixed-rate mortgage continues to remain the bedrock of the US housing finance system, accounting
for 77.3 percent of new originations in June 2021. The share of 15-year fixed-rate mortgages, predominantly a refinance product, was 14.5 percent of new originations in June 2021. The ARM share accounted for 1.7 percent of new originations. From late 2018-though July 2021, while there has been some month-to-month variation, the refinance share (bottom chart) has generally grown for both the GSEs and for Ginnie Mae as interest rates have dropped. The past few months, in reaction to slightly higher interest rates, the refi share has dropped. In July 2021, the GSE refi shares are in the 57 to 58 percent range; the Ginnie Mae refi share was 38.5 percent.
OVERVIEWPRODUCT COMPOSITION AND REFINANCE SHARE
0%10%20%30%40%50%60%70%80%90%
100%
2000 2001 2002 2003 2004 2005 2006 2007 2008 2009 2010 2011 2012 2013 2014 2015 2016 2017 2018 2019 2020 2021
Product CompositionFixed-rate 30-year mortgage Fixed-rate 15-year mortgage Adjustable-rate mortgage Other
Sources: Black Knight, eMBS, HMDA, SIFMA and Urban Institute. Note: Includes purchase and refinance originations.
June 2021
0.0%
1.0%
2.0%
3.0%
4.0%
5.0%
6.0%
7.0%
0%10%20%30%40%50%60%70%80%90%
Jul-0
5Ja
n-06
Jul-0
6Ja
n-07
Jul-0
7Ja
n-08
Jul-0
8Ja
n-09
Jul-0
9Ja
n-10
Jul-1
0Ja
n-11
Jul-1
1Ja
n-12
Jul-1
2Ja
n-13
Jul-1
3Ja
n-14
Jul-1
4Ja
n-15
Jul-1
5Ja
n-16
Jul-1
6Ja
n-17
Jul-1
7Ja
n-18
Jul-1
8Ja
n-19
Jul-1
9Ja
n-20
Jul-2
0Ja
n-21
Jul-2
1
Percent Refi at IssuanceFreddie Mac Fannie Mae Ginnie Mae Mortgage rate
Sources: eMBS and Urban Institute.Note: Based on at-issuance balance. Figure based on data from July 2021.
Mortgage ratePercent refi

CASH-OUT REFINANCESOVERVIEW
$0.0
$10.0
$20.0
$30.0
$40.0
$50.0
$60.0
$70.0
$80.0
$90.0
1996 1999 2002 2005 2008 2011 2014 2017 2020
$ billions
Equity Take-Out from Conventional Mortgage Refinance Activity
Sources: eMBS and Urban Institute.Note: Data as of June 2021.
2021 Q1
When mortgage rates are low, the share of cash-out refinances tends to be relatively smaller, as rate/term refinancing allows borrowers to save money by taking advantage of lower rates. But when rates are high, the cash-out refinance share is higher since the rate reduction incentive is gone and the only reason to refinance is to take out equity. The cash-out refi share generally declined during 2020 due to increased rate refinances amidst historically low rates. As rates have increased slightly in recent months, the cash-out share rose from 34 percent in Q3 2020 to 37 percent in Q4 2020 and again to 38 percent in Q1 2021. Note that while home prices have risen, equity take-out volumes are substantially lower compared to the bubble years.
0%
5%
10%
15%
20%
25%
30%
Jun-14 Jun-15 Jun-16 Jun-17 Jun-18 Jun-19 Jun-20 Jun-21
FHA VA Freddie Mac Fannie Mae
Sources: Freddie Mac and Urban Institute.Note: These quarterly estimates include conventional mortgages only.
Cash-out Refi Share of All Originations
0%
10%
20%
30%
40%
50%
60%
70%
80%
90%
100%At least 5% higher loan amount No change in loan amount Lower loan amount
10
Sources: Freddie Mac and Urban Institute.Note: Estimates include conventional mortgages only.
Loan Amount after Refinancing
Sources: eMBS and Urban Institute. Sources: eMBS and Urban Institute.
0%10%20%30%40%50%60%70%80%90%
100%
Apr-
13Ju
l-13
Oct
-13
Jan-
14Ap
r-14
Jul-1
4O
ct-1
4Ja
n-15
Apr-
15Ju
l-15
Oct
-15
Jan-
16Ap
r-16
Jul-1
6O
ct-1
6Ja
n-17
Apr-
17Ju
l-17
Oct
-17
Jan-
18Ap
r-18
Jul-1
8O
ct-1
8Ja
n-19
Apr-
19Ju
l-19
Oct
-19
Jan-
20Ap
r-20
Jul-2
0O
ct-2
0Ja
n-21
Apr-
21Ju
l-21
Nonbank Origination Share: All LoansAll Fannie Freddie Ginnie
91%
77%74%71%
0%10%20%30%40%50%60%70%80%90%
100%
Jul-1
3Ja
n-14
Jul-1
4Ja
n-15
Jul-1
5Ja
n-16
Jul-1
6Ja
n-17
Jul-1
7Ja
n-18
Jul-1
8Ja
n-19
Jul-1
9Ja
n-20
Jul-2
0Ja
n-21
Jul-2
1
All Fannie Freddie Ginnie
0%10%20%30%40%50%60%70%80%90%
100%
Jul-1
3Ja
n-14
Jul-1
4Ja
n-15
Jul-1
5Ja
n-16
Jul-1
6Ja
n-17
Jul-1
7Ja
n-18
Jul-1
8Ja
n-19
Jul-1
9Ja
n-20
Jul-2
0Ja
n-21
Jul-2
1
All Fannie Freddie Ginnie
Nonbank Origination Share: Refi Loans
11
AGENCY NONBANK ORIGINATION SHARE
OVERVIEW
Nonbank Origination Share: Purchase Loans
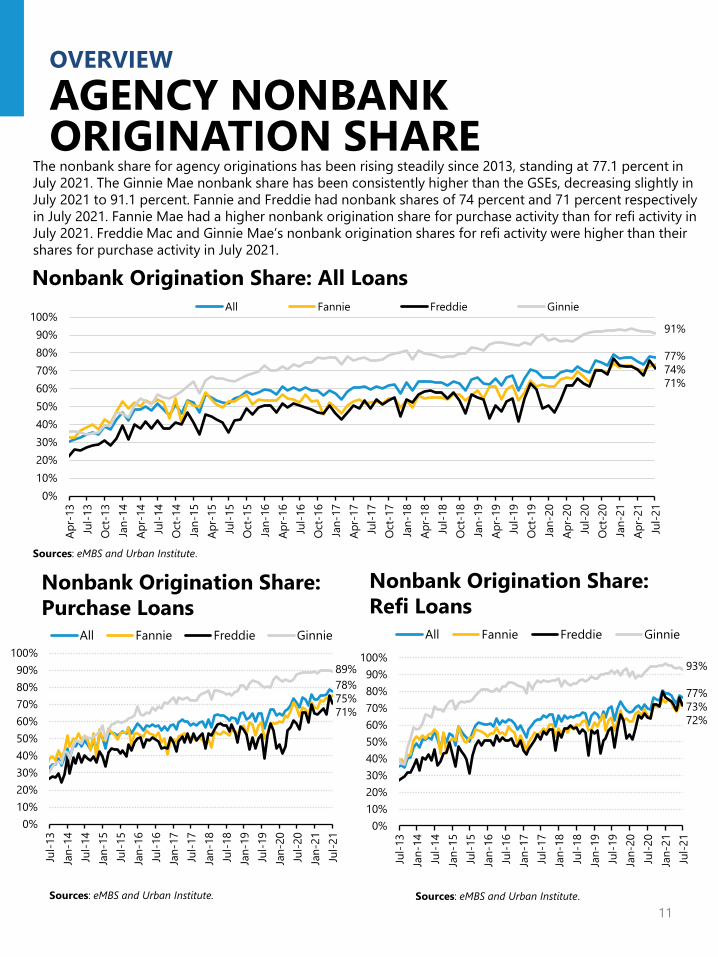
The nonbank share for agency originations has been rising steadily since 2013, standing at 77.1 percent in July 2021. The Ginnie Mae nonbank share has been consistently higher than the GSEs, decreasing slightly in July 2021 to 91.1 percent. Fannie and Freddie had nonbank shares of 74 percent and 71 percent respectively in July 2021. Fannie Mae had a higher nonbank origination share for purchase activity than for refi activity in July 2021. Freddie Mac and Ginnie Mae’s nonbank origination shares for refi activity were higher than their shares for purchase activity in July 2021.
Sources: eMBS and Urban Institute.
89%78%75%71%
93%
77%73%72%

$-
$200
$400
$600
$800
$1,000
$1,200
$1,400
($ billions)Re-REMICs and otherScratch and dentAlt ASubprimePrime
Sources: Inside Mortgage Finance and Urban Institute.
Non-Agency MBS Issuance
$4.83$13.35$9.31$1.08$14.40
Q22021
12
SECURITIZATION VOLUME AND COMPOSITION
OVERVIEW
96.76%
3.24%0%
10%
20%
30%
40%
50%
60%
70%
80%
90%
100%
1995
1997
1999
2001
2003
2005
2007
2009
2011
2013
2015
2017
2019
2021
Agency share Non-agency share
Agency/Non-Agency Share of Residential MBS IssuanceThe non-agency share of mortgage securitizations increased gradually over the post-crisis years, from 1.83 percent in 2012 to 5.0 percent in 2019. In 2020, the non-agency share dropped to 2.44 percent, and as of June 2021, it stood at 3.24 percent. The sharp drop in 2020 reflects less non-agency production due to dislocations caused by COVID-19; the market is recovering in 2021, albeit not to 2019 levels. Non-agency securitization volume totaled $42.97 billion in Q2 2021, an increase relative to Q2 2020. Non-agency securitizations continue to be tiny compared to pre-housing market crisis levels.
Sources: Inside Mortgage Finance and Urban Institute.Note: Based on data from June 2021. Monthly non-agency volume is subject to revision.
19.01
$0$2$4$6$8
$10$12$14$16$18$20
Jun-
16Se
p-16
Dec
-16
Mar
-17
Jun-
17Se
p-17
Dec
-17
Mar
-18
Jun-
18Se
p-18
Dec
-18
Mar
-19
Jun-
19Se
p-19
Dec
-19
Mar
-20
Jun-
20Se
p-20
Dec
-20
Mar
-21
Jun-
21
($ billions)
Monthly Non-Agency Securitization
Sources: Inside Mortgage Finance and Urban Institute.
02468
1012141618
1999 2000 2001 2002 2003 2004 2005 2006 2007 2008 2009 2010 2011 2012 2013 2014 2015 2016 2017 2018 2019 2020 2021
Percent Total default risk
Borrower risk
Product risk
Reasonable lending
standards
GSE Channel
13
HOUSING CREDIT AVAILABILITY INDEX
CREDIT BOX
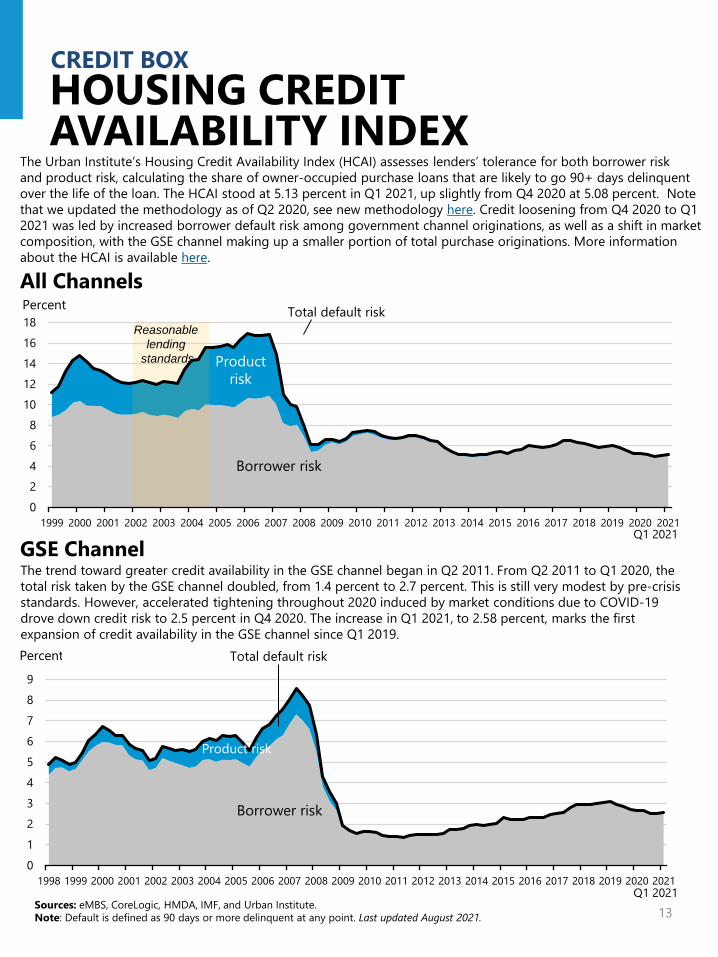
The Urban Institute’s Housing Credit Availability Index (HCAI) assesses lenders’ tolerance for both borrower riskand product risk, calculating the share of owner-occupied purchase loans that are likely to go 90+ days delinquent over the life of the loan. The HCAI stood at 5.13 percent in Q1 2021, up slightly from Q4 2020 at 5.08 percent. Note that we updated the methodology as of Q2 2020, see new methodology here. Credit loosening from Q4 2020 to Q1 2021 was led by increased borrower default risk among government channel originations, as well as a shift in market composition, with the GSE channel making up a smaller portion of total purchase originations. More information about the HCAI is available here.
Q1 2021
All Channels
0123456789
1998 1999 2000 2001 2002 2003 2004 2005 2006 2007 2008 2009 2010 2011 2012 2013 2014 2015 2016 2017 2018 2019 2020 2021
Percent Total default risk
Product risk
Borrower risk
Sources: eMBS, CoreLogic, HMDA, IMF, and Urban Institute.Note: Default is defined as 90 days or more delinquent at any point. Last updated August 2021.
Q1 2021
The trend toward greater credit availability in the GSE channel began in Q2 2011. From Q2 2011 to Q1 2020, the total risk taken by the GSE channel doubled, from 1.4 percent to 2.7 percent. This is still very modest by pre-crisis standards. However, accelerated tightening throughout 2020 induced by market conditions due to COVID-19 drove down credit risk to 2.5 percent in Q4 2020. The increase in Q1 2021, to 2.58 percent, marks the first expansion of credit availability in the GSE channel since Q1 2019.
14
HOUSING CREDIT AVAILABILITY INDEX
CREDIT BOX
Government Channel
Portfolio and Private Label Securities Channels
0
5
10
15
20
25
1998 1999 2000 2001 2002 2003 2004 2005 2006 2007 2008 2009 2010 2011 2012 2013 2014 2015 2016 2017 2018 2019 2020 2021
Percent
Total default risk
Borrower risk
Product risk
Q1 2021
0
5
10
15
20
25
1998 1999 2000 2001 2002 2003 2004 2005 2006 2007 2008 2009 2010 2011 2012 2013 2014 2015 2016 2017 2018 2019 2020 2021
Percent Total default risk
Borrower risk
Product risk
Q1 2021Sources: eMBS, CoreLogic, HMDA, IMF, and Urban Institute.Note: Default is defined as 90 days or more delinquent at any point. Last updated August 2021.
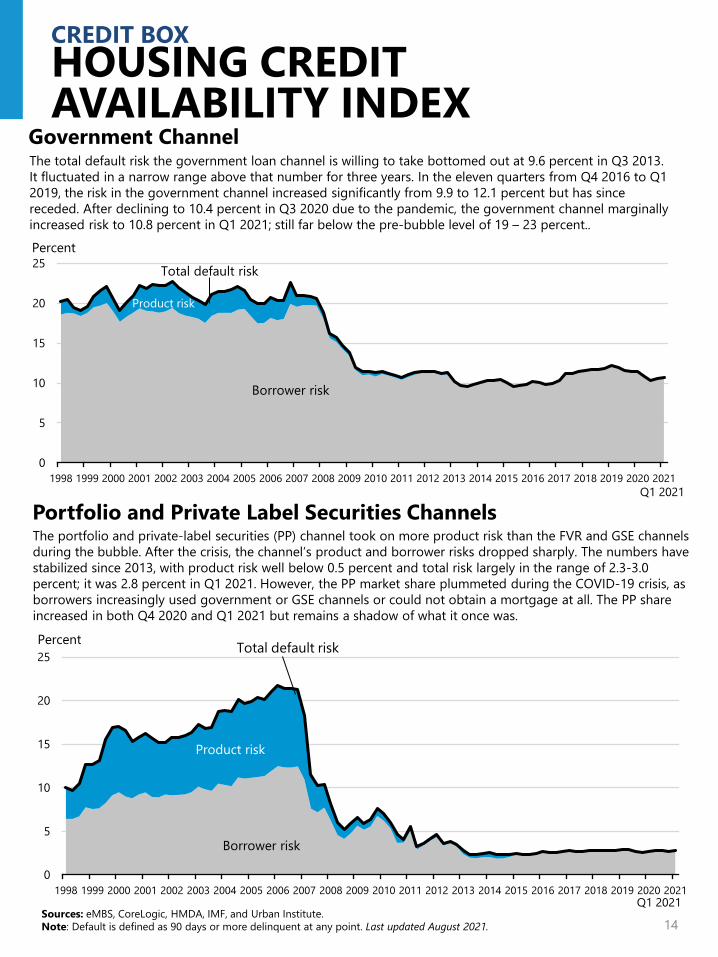
The total default risk the government loan channel is willing to take bottomed out at 9.6 percent in Q3 2013. It fluctuated in a narrow range above that number for three years. In the eleven quarters from Q4 2016 to Q1 2019, the risk in the government channel increased significantly from 9.9 to 12.1 percent but has since receded. After declining to 10.4 percent in Q3 2020 due to the pandemic, the government channel marginally increased risk to 10.8 percent in Q1 2021; still far below the pre-bubble level of 19 – 23 percent..
The portfolio and private-label securities (PP) channel took on more product risk than the FVR and GSE channels during the bubble. After the crisis, the channel’s product and borrower risks dropped sharply. The numbers have stabilized since 2013, with product risk well below 0.5 percent and total risk largely in the range of 2.3-3.0 percent; it was 2.8 percent in Q1 2021. However, the PP market share plummeted during the COVID-19 crisis, as borrowers increasingly used government or GSE channels or could not obtain a mortgage at all. The PP share increased in both Q4 2020 and Q1 2021 but remains a shadow of what it once was.

15
CREDIT AVAILABILITY FORAccess to credit remains tight, especially for lower FICO borrowers. The median FICO for current purchase loans is about 40 points higher than the pre-housing crisis level of around 700. The 10th percentile, which represents the lower bound of creditworthiness to qualify for a mortgage, was 650 in May 2021, which is high compared to low-600s pre-bubble. The median LTV at origination of 95 percent also remains high, reflecting the rise of FHA and VA lending. Origination DTIs trended lower over the course of 2020 and early 2021, reflecting the sharp decline in mortgage rates.
CREDIT AVAILABILITY FOR PURCHASE LOANS
CREDIT BOX
30405060708090
100110
2001 2002 2003 2004 2005 2006 2007 2008 2009 2010 2011 2012 2013 2014 2015 2016 2017 2018 2019 2020 2021
LTVCombined LTV at Origination
1009588
72
Sources: Black Knight, eMBS, HMDA, SIFMA, CoreLogic and Urban Institute.Note: Includes owner-occupied purchase loans only. DTI data prior to April 2018 is from CoreLogic; after that date, it is from Black Knight.Data as of May 2021.
0
10
20
30
40
50
60
2001 2002 2003 2004 2005 2006 2007 2008 2009 2010 2011 2012 2013 2014 2015 2016 2017 2018 2019 2020 2021
DTI at Origination
49
3837
23
DTI
500550600650700750800850
2001 2002 2003 2004 2005 2006 2007 2008 2009 2010 2011 2012 2013 2014 2015 2016 2017 2018 2019 2020 2021
FICO ScoreBorrower FICO Score at Origination
Mean 90th percentile 10th percentile Median
799740731
650
16
CREDIT AVAILABILITY FORCREDIT AVAILABILITY BY MSA FOR PURCHASE LOANS
CREDIT BOX
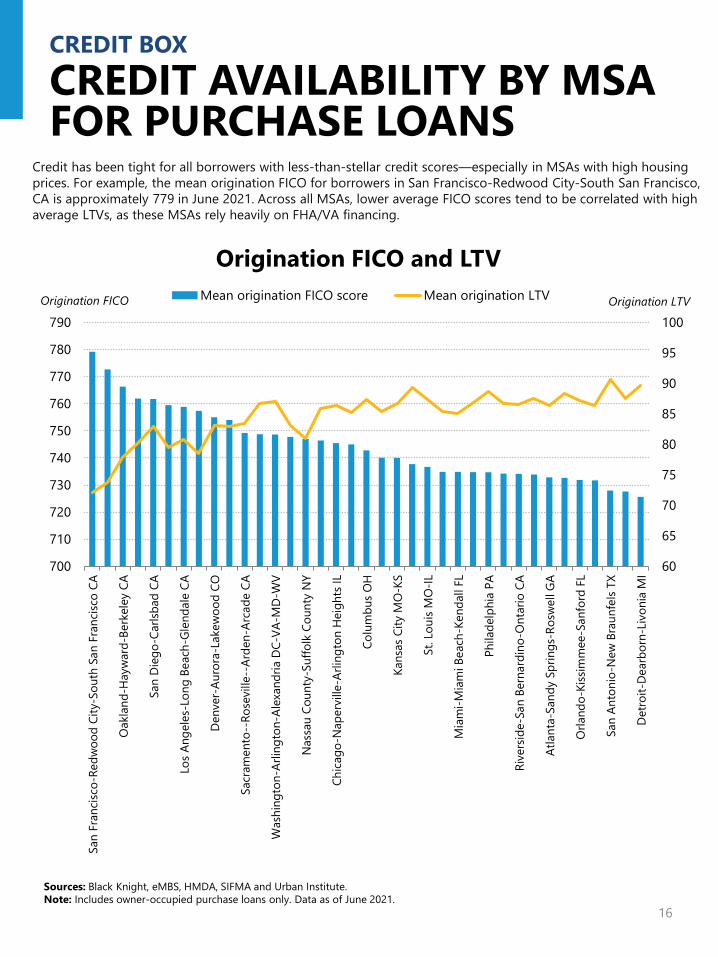
Credit has been tight for all borrowers with less-than-stellar credit scores—especially in MSAs with high housing prices. For example, the mean origination FICO for borrowers in San Francisco-Redwood City-South San Francisco, CA is approximately 779 in June 2021. Across all MSAs, lower average FICO scores tend to be correlated with high average LTVs, as these MSAs rely heavily on FHA/VA financing.
60
65
70
75
80
85
90
95
100
700
710
720
730
740
750
760
770
780
790
San
Fran
cisc
o-Re
dwoo
d Ci
ty-S
outh
San
Fra
ncisc
o CA
Oak
land
-Hay
war
d-Be
rkel
ey C
A
San
Die
go-C
arlsb
ad C
A
Los
Ange
les-
Long
Bea
ch-G
lend
ale
CA
Den
ver-
Auro
ra-L
akew
ood
CO
Sacr
amen
to--
Rose
ville
--Ar
den-
Arca
de C
A
Was
hing
ton-
Arlin
gton
-Ale
xand
ria D
C-VA
-MD-
WV
Nas
sau
Coun
ty-S
uffo
lk C
ount
y N
Y
Chic
ago-
Nap
ervi
lle-A
rling
ton
Hei
ghts
IL
Colu
mbu
s O
H
Kans
as C
ity M
O-K
S
St. L
ouis
MO
-IL
Mia
mi-M
iam
i Bea
ch-K
enda
ll FL
Phila
delp
hia
PA
Rive
rsid
e-Sa
n Be
rnar
dino
-Ont
ario
CA
Atla
nta-
Sand
y Sp
rings
-Ros
wel
l GA
Orla
ndo-
Kiss
imm
ee-S
anfo
rd F
L
San
Anto
nio-
New
Bra
unfe
ls TX
Det
roit-
Dear
born
-Liv
onia
MI
Origination LTVOrigination FICO
Origination FICO and LTVMean origination FICO score Mean origination LTV
Sources: Black Knight, eMBS, HMDA, SIFMA and Urban Institute.Note: Includes owner-occupied purchase loans only. Data as of June 2021.

Sources: eMBS and Urban Institute. Sources: eMBS and Urban Institute.
680690700710720730740750760770780
Jul-1
4
Oct
-14
Jan-
15
Apr-
15
Jul-1
5
Oct
-15
Jan-
16
Apr-
16
Jul-1
6
Oct
-16
Jan-
17
Apr-
17
Jul-1
7
Oct
-17
Jan-
18
Apr-
18
Jul-1
8
Oct
-18
Jan-
19
Apr-
19
Jul-1
9
Oct
-19
Jan-
20
Apr-
20
Jul-2
0
Oct
-20
Jan-
21
Apr-
21
Jul-2
1
Agency FICO: Bank vs. NonbankAll Median FICO Bank Median FICO Nonbank Median FICOFICO
Sources: eMBS and Urban Institute.
660
680
700
720
740
760
780
Jul-1
4
Jan-
15Ju
l-15
Jan-
16
Jul-1
6
Jan-
17Ju
l-17
Jan-
18Ju
l-18
Jan-
19Ju
l-19
Jan-
20
Jul-2
0
Jan-
21Ju
l-21
All Median FICOBank Median FICONonbank Median FICO
Ginnie Mae FICO: Bank vs. Nonbank
660
680
700
720
740
760
780
Jul-1
4Ja
n-15
Jul-1
5Ja
n-16
Jul-1
6Ja
n-17
Jul-1
7Ja
n-18
Jul-1
8Ja
n-19
Jul-1
9Ja
n-20
Jul-2
0Ja
n-21
Jul-2
1
All Median FICOBank Median FICONonbank Median FICO
GSE FICO: Bank vs. Nonbank
17
CREDIT BOX
AGENCY NONBANK CREDIT BOX
FICO FICO
In the GSE space, FICO scores for banks and nonbanks have dipped in 2021 although they remain elevated. The difference between the two stood at 7 points in July 2021, compared to the 30 point gap between bank and nonbank FICOs in the Ginnie space. FICO scores for banks and nonbanks in both GSE and Ginnie Mae segments increased during the Q1 2019 to Q1 2021 period, due to increased refi activity; with refi activity now waning, originators, particularly nonbank originators, have been aggressively competing for new business, and are now more accommodating to borrowers with lower credit scores. Note that there has been a sharp cut-back in FHA lending by banks post-2008. As pointed out on page 11, banks now comprise only about 9 percent of GinnieMae originations.
766761759
710
682680
763748742

Sources: eMBS and Urban Institute. Sources: eMBS and Urban Institute.
66687072747678808284868890
Jul-1
4
Jan-
15
Jul-1
5
Jan-
16
Jul-1
6
Jan-
17
Jul-1
7
Jan-
18
Jul-1
8
Jan-
19
Jul-1
9
Jan-
20
Jul-2
0
Jan-
21
Jul-2
1
All Median LTV Bank Median LTVNonbank Median LTV
Sources: eMBS and Urban Institute.
GSE LTV: Bank vs. Nonbank
90919293949596979899
100
Jul-1
4
Jan-
15
Jul-1
5
Jan-
16
Jul-1
6
Jan-
17
Jul-1
7
Jan-
18
Jul-1
8
Jan-
19
Jul-1
9
Jan-
20
Jul-2
0
Jan-
21
Jul-2
1
All Median LTV Bank Median LTVNonbank Median LTV
Sources: eMBS and Urban Institute.
30
32
34
36
38
40
42
44
46
Jul-1
4
Jan-
15
Jul-1
5
Jan-
16
Jul-1
6
Jan-
17
Jul-1
7
Jan-
18
Jul-1
8
Jan-
19
Jul-1
9
Jan-
20
Jul-2
0
Jan-
21
Jul-2
1
All Median DTI Bank Median DTINonbank Median DTI
30
32
34
36
38
40
42
44
Jul-1
4
Jan-
15
Jul-1
5
Jan-
16
Jul-1
6
Jan-
17
Jul-1
7
Jan-
18
Jul-1
8
Jan-
19
Jul-1
9
Jan-
20
Jul-2
0
Jan-
21
Jul-2
1
GSE DTI: Bank vs. NonbankAll Median DTI Bank Median DTINonbank Median DTI
18
CREDIT BOX
AGENCY NONBANK CREDIT BOX
Ginnie Mae LTV: Bank vs. Nonbank
Ginnie Mae DTI: Bank vs. Nonbank
LTV LTV
DTIDTI
The median LTVs for nonbank and bank originations are comparable, while the median DTI for nonbank loans is higher than for bank loans, more so in the Ginnie Mae space. From early 2017 to early 2019, there was a sustained increase in DTIs, which has reversed beginning in the spring of 2019. This is true for both Ginnie Mae and the GSEs, for banks and nonbanks. As interest rates in 2017 and 2018 increased, DTIs rose, because borrower payments were driven up relative to incomes. As rates fell during most of 2019 and 2020, DTIs fell as borrower payments declined relative to incomes. Over the last few months, DTIs have increased, reflecting the small rise in rates and steep house price increases, both of which force households to borrow more in relation to income.

19
STATE OF THE MARKETMORTGAGE ORIGINATION PROJECTIONS
Fannie Mae, Freddie Mac and the MBA estimate 2021 origination volume to be between $3.61 and $4.36 trillion, lower than the $3.83 to $4.54 trillion in 2020. 2020 was the highest origination year in the 21st century; page 8 top provides the longer historical time series. The very robust 2020 origination volume is due to very strong refinance activity. All three groups expect the 2021 refinance share to be 6 to 9 percentage points lower than in 2020.
Total Originations and Refinance Shares Originations ($ billions) Refi Share (percent)
Period Total, FNMA estimate
Total, FHLMC estimate
Total, MBA estimate
FNMA estimate
FHLMC estimate
MBA estimate
2020 Q1 752 690 563 61 60 542020 Q2 1096 990 928 68 67 632020 Q3 1346 1155 1076 62 62 612020 Q4 1342 1265 1261 64 65 672021 Q1 1257 1305 1094 71 71 712021 Q2 1210 1075 1050 59 56 562021 Q3 1058 853 862 51 44 522021 Q4 830 700 605 44 37 28
2017 1826 1810 1760 36 37 352018 1766 1700 1677 30 32 282019 2462 2432 2253 46 46 442020 4536 4100 3828 64 64 632021 4355 3933 3611 58 55 552022 3307 2626 2361 41 27 26
Sources: Fannie Mae, Freddie Mac, Mortgage Bankers Association and Urban Institute.Note: Shaded boxes indicate forecasted figures. All figures are estimates for total single-family market. Regarding interest rates, the yearly averages for 2017, 2018, 2019 and 2020 were 4.0, 4.6, 3.9, and 3.0 percent. For 2021, the respective projections for Fannie, Freddie, and MBA are 2.9, 3.2, and 3.3 percent. Freddie Mac forecasts are now released quarterly, last updated July 2021.
3.17
01234567Dollars per $100 loan
Originator Profitability and Unmeasured CostsIn July 2021, Originator Profitability and Unmeasured Costs (OPUC) stood at $3.17 per $100 loan, down from last month’s $3.20. Increased profitability reflects lender capacity constraints amidst strong refi demand. The continued decline reflects the fact that the backlog of refinance has been processed, and originators are competing more aggressively on price. OPUC, formulated and calculated by the Federal Reserve Bank of New York, is a good relative measure of originator profitability. OPUC uses the sales price of a mortgage in the secondary market (less par) and adds two sources of profitability; retained servicing (both base and excess servicing, net of g-fees), and points paid by the borrower. OPUC is generally high when interest rates are low, as originators are capacity constrained due to refinance demand and have no incentive to reduce rates. Conversely, when interestrates are higher and refi activity low, competition forces originators to lower rates, driving profitability down.
Sources: Federal Reserve Bank of New York, updated monthly and available at this link: http://www.ny.frb.org/research/epr/2013/1113fust.html and Urban Institute. Last updated July 2021.Note: OPUC is a is a monthly (4-week moving) average as discussed in Fuster et al. (2013).
2.6
0
2
4
6
8
10
12
14
1999
2000
2001
2002
2003
2004
2005
2006
2007
2008
2009
2010
2011
2012
2013
2014
2015
2016
2017
2018
2019
2020
2021
Months of supply
20
SERIOUS DELINQUENCY RAHOUSING SUPPLYSTATE OF THE MARKET
Housing Starts and Home Sales
Housing Starts, thousands Home Sales. thousands
YearTotal,FNMA
estimate
Total, MBA estimate
Total, NAHB
estimate
Total, FNMA
estimate
Total, FHLMC estimate
Total, MBA estimate
Total, NAHB
estimate*
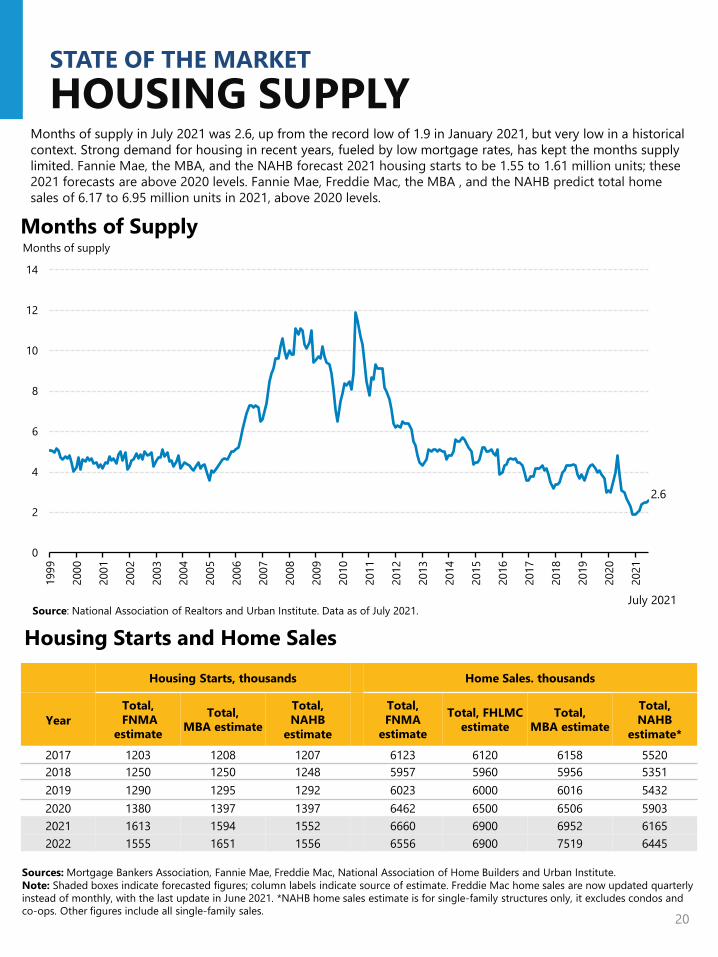
2017 1203 1208 1207 6123 6120 6158 55202018 1250 1250 1248 5957 5960 5956 53512019 1290 1295 1292 6023 6000 6016 54322020 1380 1397 1397 6462 6500 6506 59032021 1613 1594 1552 6660 6900 6952 61652022 1555 1651 1556 6556 6900 7519 6445
Sources: Mortgage Bankers Association, Fannie Mae, Freddie Mac, National Association of Home Builders and Urban Institute.Note: Shaded boxes indicate forecasted figures; column labels indicate source of estimate. Freddie Mac home sales are now updated quarterly instead of monthly, with the last update in June 2021. *NAHB home sales estimate is for single-family structures only, it excludes condos and co-ops. Other figures include all single-family sales.
Months of Supply
July 2021Source: National Association of Realtors and Urban Institute. Data as of July 2021.
Months of supply in July 2021 was 2.6, up from the record low of 1.9 in January 2021, but very low in a historical context. Strong demand for housing in recent years, fueled by low mortgage rates, has kept the months supply limited. Fannie Mae, the MBA, and the NAHB forecast 2021 housing starts to be 1.55 to 1.61 million units; these 2021 forecasts are above 2020 levels. Fannie Mae, Freddie Mac, the MBA , and the NAHB predict total home sales of 6.17 to 6.95 million units in 2021, above 2020 levels.

HOUSING AFFORDABILITYSTATE OF THE MARKET
National Mortgage Affordability Over TimeDespite historic low interest rates, increases in home prices have pushed affordability to the worst levels since 2008. As of July 2021, with a 20 percent down payment, the share of median income needed for the monthly mortgage payment stood at 26.4 percent; with 3.5 percent down it is 30.2 percent. These numbers are well above the 2001-2003 median, and represent a sharp worsening in affordability over the past year. As shown in the bottom picture, mortgage affordability varies widely by MSA.
0%
5%
10%
15%
20%
25%
30%
35%
40%
2001
2002
2003
2004
2005
2006
2007
2008
2009
2010
2011
2012
2013
2014
2015
2016
2017
2018
2019
2020
2021
Mortgage affordability with 20% downMortgage affordability with 3.5% down
Median housing expenses to income
Average Mortgage Affordability with 3.5%
Average Mortgage Affordability with 20% down (2001-2003)
0%10%20%30%40%50%60%70%80%90%
100%
San
Fran
cisc
o-O
akla
nd-B
erke
ley;
CASa
n Jo
se-S
unny
vale
-San
ta C
lara
; CA
San
Die
go-C
hula
Vist
a-Ca
rlsba
d; C
ALo
s An
gele
s-Lo
ng B
each
-Gle
ndal
e; C
AO
akla
nd-H
ayw
ard-
Berk
eley
; CA
Seat
tle-B
elle
vue-
Ever
ett;
WA
Rive
rsid
e-Sa
n Be
rnar
dino
-Ont
ario
; CA
Nas
sau
Coun
ty-S
uffo
lk C
ount
y; N
YBo
ston
; MA
Den
ver-
Auro
ra-L
akew
ood;
CO
Portl
and-
Vanc
ouve
r-H
illsb
oro;
OR-
WA
Sacr
amen
to-R
osev
ille-
Folso
m; C
ALa
s Ve
gas-
Hen
ders
on-P
arad
ise; N
VN
ewar
k; N
J-PA
New
Yor
k-Je
rsey
City
-Whi
te P
lain
s; N
Y-N
JPh
oeni
x-M
esa-
Chan
dler
; AZ
Orla
ndo-
Kiss
imm
ee-S
anfo
rd; F
LCh
arlo
tte-C
onco
rd-G
asto
nia;
NC-
SCW
ashi
ngto
n-Ar
lingt
on-A
lexa
ndria
; DC-
VA-M
D-W
VTa
mpa
-St.
Pete
rsbu
rg-C
lear
wat
er; F
LD
alla
s-Pl
ano-
Irvin
g; T
XSa
n An
toni
o-N
ew B
raun
fels;
TX
Hou
ston
-The
Woo
dlan
ds-S
ugar
Lan
d; T
XCh
icag
o-N
aper
ville
-Arli
ngto
n H
eigh
ts; I
LBa
ltim
ore-
Colu
mbi
a-To
wso
n; M
DM
inne
apol
is-St
. Pau
l-Blo
omin
gton
; MN
-WI
Atla
nta-
Sand
y Sp
rings
-Alp
hare
tta; G
ACo
lum
bus;
OH
Fort
Wor
th-A
rling
ton;
TX
Kans
as C
ity; M
O-K
SCi
ncin
nati;
OH
-KY-
INSt
. Lou
is; M
O-IL
Clev
elan
d-El
yria
; OH
Phila
delp
hia;
PA
Pitts
burg
h; P
AD
etro
it-D
earb
orn-
Livo
nia;
MI
Mortgage affordability with 20% downMortgage affordability with 3.5% downMortgage affordability index
Mortgage Affordability by MSA
Sources: National Association of Realtors, US Census Bureau, Current Population Survey, American Community Survey, Moody’sAnalytics, Freddie Mac Primary Mortgage Market Survey, and the Urban Institute.Note: Mortgage affordability is the share of median family income devoted to the monthly principal, interest, taxes, andinsurance payment required to buy the median home at the Freddie Mac prevailing rate 2018 for a 30-year fixed-rate mortgageand property tax and insurance at 1.75 percent of the housing value. Data for the bottom chart as of Q3 2020.
21
July 2021

19.22%
14.99%
-15%
-10%
-5%
0%
5%
10%
15%
20%
25%
22
National Year-Over-Year HPI Growth by Price Tier House prices escalated significantly in the second half of 2020 and into 2021 across all price tiers. Before the pandemic, lower priced homes appreciated much more than higher priced homes. With higher priced homes also experiencing steep appreciation last year, the gap has disappeared.
HOME PRICE INDICESSTATE OF THE MARKET
National Year-Over-Year HPI Growth According to Black Knight’s updated repeat sales index, year-over-year home price appreciation increased to 19.22 percent in June 2021, compared to 17.58 percent the previous month. Year-over-year home price appreciation as measured by Zillow’s hedonic index was 14.99 percent in June 2021, up from 13.20 in May. Although housing affordability remains constrained, especially at the lower end of the market, low rates serve as a partial offset.
Sources: Black Knight, Zillow, and Urban Institute. Note: Black Knight modified the methodology behind their HPI in February 2021, resulting in changes to historic price estimates. Data as of June 2021.
Black Knight HPI
Zillow HVI
Year-over-year growth
19.34%19.31%
-15%
-10%
-5%
0%
5%
10%
15%
20%
25%
Lowest-tier Middle-tier Highest-tier
19.17%
Sources: Black Knight and Urban Institute. Note: Black Knight modified the methodology behind their HPI in February 2021, resulting in changes to historic price estimates. Data as of June 2021.

23
FIRST-TIME HOMEBUYERSSTATE OF THE MARKET
20%
30%
40%
50%
60%
70%
80%
90%
2001 2002 2003 2004 2005 2006 2007 2008 2009 2010 2011 2012 2013 2014 2015 2016 2017 2018 2019 2020 2021
First-Time Homebuyer Share
GSEs FHA VA
In June 2021, the FTHB share for FHA, which has always been more focused on first time homebuyers, was 85.4 percent. The FTHB share of VA lending in June was 50.3 percent. The GSE FTHB share decreased in June relative to May, to 50.5 percent. The bottom table shows that based on mortgages originated in June 2021, the average FTHB was more likely than an average repeat buyer to take out a smaller loan, have a lower credit score, and have a higher LTV, thus paying a higher interest rate.
Sources: eMBS, Federal Housing Administration (FHA), and Urban Institute.Note: All series measure the first-time homebuyer share of purchase loans for principal residences.
85.4%
50.5%50.3%
Comparison of First-Time and Repeat Homebuyers, GSE and FHA Originations
GSEs FHA GSEs and FHA
Characteristics First-time Repeat First-time Repeat First-time Repeat
Loan Amount ($) 308,500 329,288 246,494 264,401 289,441 320,587
Credit Score 748 758 672 672 724 747
LTV (%) 87 79 95 94 90 81
DTI (%) 34 35 43 44 37 36
Loan Rate (%) 3.15 3.09 3.22 3.18 3.17 3.10
Sources: eMBS and Urban Institute.Note: Based on owner-occupied purchase mortgages originated in June 2021.
June 2021

3.25%3.92%
1.66%
7.15%
0%
2%
4%
6%
8%
10%
12%
14%
Forbearance Rates by ChannelTotal Ginnie Mae GSEs Other
STATE OF THE MARKET
DELINQUENCIES AND LOSS MITIGATION ACTIVITY
0%
2%
4%
6%
8%
10%
12%2Q
012Q
022Q
032Q
042Q
052Q
062Q
072Q
082Q
092Q
102Q
112Q
122Q
132Q
142Q
152Q
162Q
172Q
182Q
192Q
202Q
21
Percent of loans 90 days or more delinquentPercent of loans in foreclosurePercent of loans 90 days or more delinquent or in foreclosure
Sources: Mortgage Bankers Association and Urban Institute. Last updated August 2021.
0%
5%
10%
15%
20%
25%
30%
35%
2Q11
1Q12
4Q12
3Q13
2Q14
1Q15
4Q15
3Q16
2Q17
1Q18
4Q18
3Q19
2Q20
1Q21
Negative Equity ShareNegative equity Near or in negative equity
Sources: CoreLogic and Urban Institute.Note: Loans with negative equity refer to loans above 100 percent LTV. Loans near negative equity refer to loans above 95 percent LTV. Last updated June 2021.
Loans in Serious Delinquency/Foreclosure
24
Q2 2021
Source: MBA Weekly Forbearance and Call Volume Survey. Forbearance rates as of August 15, 2021.
Loans in and near negative equity continued to decline in Q1 2021; 2.6 percent now have negative equity, an additional 0.5 percent have less then 5 percent equity. Due to the effects of COVID-19, the share of loans that are 90 days or more delinquent or in foreclosure remained high but declined by 67 basis points , from 4.70 in Q1 2021 to 4.03 percent in Q2 2021. This number includes loans where borrowers have missed their payments, including loans in COVID-19 forbearance. The bottom chart shows the share of loans in forbearance according to the MBA Weekly Forbearance and Call Volume Survey, launched in March 2020. After peaking at 8.55 percent in early June 2020, the total forbearance rate has declined to 3.25 percent as of August 15, 2021. GSE loans have consistently had the lowest forbearance rates, standing at 1.66 percent as of August. The most recent forbearance rate for GinnieMae loans was 3.92 percent; other (e.g., portfolio and PLS) loans had the highest forbearance rate at 7.15 percent.
25
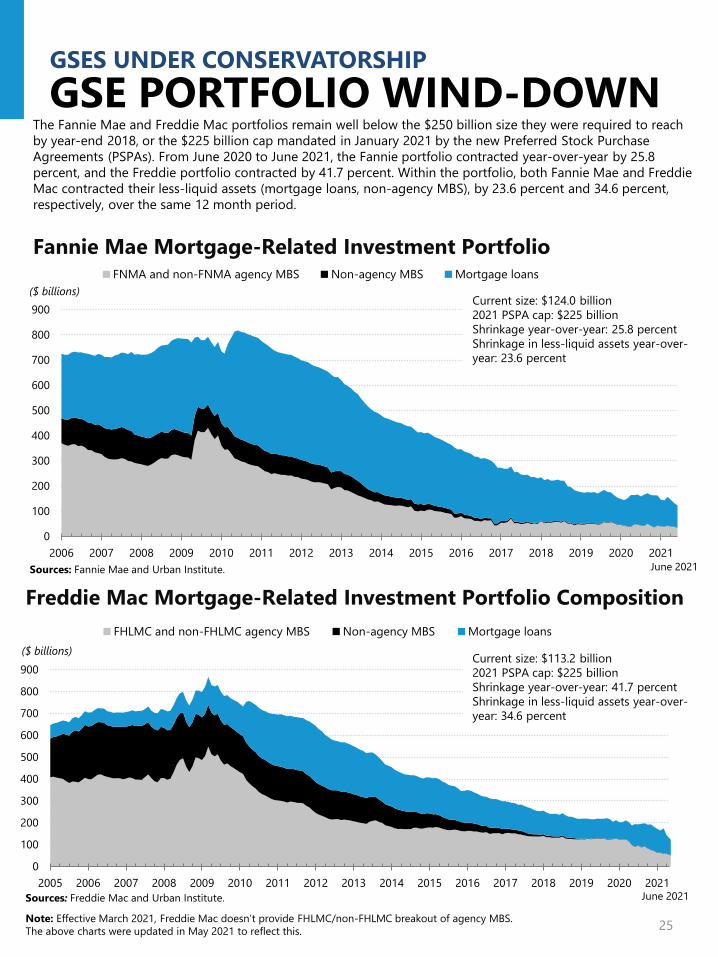
The Fannie Mae and Freddie Mac portfolios remain well below the $250 billion size they were required to reach by year-end 2018, or the $225 billion cap mandated in January 2021 by the new Preferred Stock Purchase Agreements (PSPAs). From June 2020 to June 2021, the Fannie portfolio contracted year-over-year by 25.8 percent, and the Freddie portfolio contracted by 41.7 percent. Within the portfolio, both Fannie Mae and Freddie Mac contracted their less-liquid assets (mortgage loans, non-agency MBS), by 23.6 percent and 34.6 percent, respectively, over the same 12 month period.
GSE PORTFOLIO WIND-DOWNGSES UNDER CONSERVATORSHIP
0
100
200
300
400
500
600
700
800
900
2005 2006 2007 2008 2009 2010 2011 2012 2013 2014 2015 2016 2017 2018 2019 2020 2021
($ billions)FHLMC and non-FHLMC agency MBS Non-agency MBS Mortgage loans
Sources: Freddie Mac and Urban Institute.
Freddie Mac Mortgage-Related Investment Portfolio Composition
Current size: $113.2 billion2021 PSPA cap: $225 billionShrinkage year-over-year: 41.7 percentShrinkage in less-liquid assets year-over-year: 34.6 percent
0
100
200
300
400
500
600
700
800
900
2006 2007 2008 2009 2010 2011 2012 2013 2014 2015 2016 2017 2018 2019 2020 2021
($ billions)FNMA and non-FNMA agency MBS Non-agency MBS Mortgage loans
Fannie Mae Mortgage-Related Investment Portfolio
Current size: $124.0 billion2021 PSPA cap: $225 billionShrinkage year-over-year: 25.8 percentShrinkage in less-liquid assets year-over-year: 23.6 percent
June 2021
June 2021
Sources: Fannie Mae and Urban Institute.
Note: Effective March 2021, Freddie Mac doesn’t provide FHLMC/non-FHLMC breakout of agency MBS. The above charts were updated in May 2021 to reflect this.

26
GSES UNDER CONSERVATORSHIP
EFFECTIVE GUARANTEE FEES
Fannie Mae Upfront Loan-Level Price Adjustments (LLPAs)
LTV (%)
Credit Score ≤60 60.01 – 70 70.01 – 75 75.01 – 80 80.01 – 85 85.01 – 90 90.01 – 95 95.01 – 97 >97
> 740 0.00 0.25 0.25 0.50 0.25 0.25 0.25 0.75 0.75720 – 739 0.00 0.25 0.50 0.75 0.50 0.50 0.50 1.00 1.00700 – 719 0.00 0.50 1.00 1.25 1.00 1.00 1.00 1.50 1.50680 – 699 0.00 0.50 1.25 1.75 1.50 1.25 1.25 1.50 1.50660 – 679 0.00 1.00 2.25 2.75 2.75 2.25 2.25 2.25 2.25640 – 659 0.50 1.25 2.75 3.00 3.25 2.75 2.75 2.75 2.75620 – 639 0.50 1.50 3.00 3.00 3.25 3.25 3.25 3.50 3.50< 620 0.50 1.50 3.00 3.00 3.25 3.25 3.25 3.75 3.75
Product Feature (Cumulative)
Investment Property 2.125 2.125 2.125 3.375 4.125 4.125 4.125 4.125 4.125
Sources: Fannie Mae and Urban Institute.Last updated March of 2021.
0
10
20
30
40
50
60
70
4Q09
2Q10
4Q10
2Q11
4Q11
2Q12
4Q12
2Q13
4Q13
2Q14
4Q14
2Q15
4Q15
2Q16
4Q16
2Q17
4Q17
2Q18
4Q18
2Q19
4Q19
2Q20
4Q20
2Q21
Guarantee Fees Charged on New AcquisitionsFannie Mae single-family average charged g-fee on new acquisitions
Freddie Mac single-family guarantee fees charged on new acquisitionsFannie Mae and Freddie Mac’s average g-fees charged have largely converged since the first quarter of 2020. Fannie Mae’s average g-fees charged on new acquisitions decreased from 59.0 bps in Q1 2021 to 57.9 bps in Q2 2021. Freddie’s also decreased from 60.0 bps to 59.0 bps. The gap between the two g-fees was 1.1 bps in Q2 2021. Today’s g-fees are markedly higher than g-fee levels in 2011 and 2012, and have contributed to the GSEs’ earnings; the bottom table shows Fannie Mae LLPAs, which are expressed as upfront charges.
Basis points
Sources: Fannie Mae, Freddie Mae and Urban Institute. Last updated August 2021.
59.057.9

GSE RISK-SHARING TRANSACTIONS
Sources: Fannie Mae, Freddie Mac and Urban Institute. Note: Classes A-H, M-1H, M-2H, and B-H are reference tranches only. These classes are not issued or sold. The risk is retained by Fannie Mae and Freddie Mac. “CE” = credit enhancement.
27
GSES UNDER CONSERVATORSHIP
Fannie Mae – Connecticut Avenue Securities (CAS)Date Transaction Reference Pool Size
($ m) Amount Issued ($m) % of Reference Pool Covered
2013 CAS 2013 deals $26,756 $675 2.52014 CAS 2014 deals $227, 234 $5,849 2.62015 CAS 2015 deals $187,126 $5,463 2.92016 CAS 2016 deals $236,459 $7,392 3.12017 CAS 2017 deals $264,697 $8,707 3.32018 CAS 2018 deals $205,900 $7,314 3.62019 CAS 2019 deals $291,400 $8,071 2.8January 2020 CAS 2020 - R01 $29,000 $1,030 3.6February 2020 CAS 2020 - R02 $29,000 $1,134 3.9March 2020 CAS 2020 - SBT1 $152,000 $966 0.6Total $1,649,572 $46,601 2.8
Freddie Mac – Structured Agency Credit Risk (STACR) Date Transaction Reference Pool Size
($ m) Amount Issued ($m) % of Reference Pool Covered
2013 STACR 2013 deals $57,912 $1,130 2.02014 STACR 2014 deals $147,120 $4,916 3.32015 STACR 2015 deals $209,521 $6,658 3.22016 STACR 2016 deals $183,421 $5,541 2.82017 STACR 2017 deals $248, 821 $5,663 2.32018 STACR 2018 deals $216,581 $6,055 2.82019 STACR 2019 deals $271,105 $5,947 2.2January 2020 STACR Series 2020 – DNA1 $29,641 $794 2.7February 2020 STACR Series 2020 – HQA1 $24,268 $738 3.0February 2020 STACR Series 2020 – DNA2 $43,596 $1,169 2.7March 2020 STACR Series 2020 – HQA2 $35,066 $1,006 2.9July 2020 STACR Series 2020 – DNA3 $48,328 $1,106 2.3July 2020 STACR Series 2020 – HQA3 $31,278 $835 2.7August 2020 STACR Series 2020 – DNA4 $41,932 $1,088 2.6September 2020 STACR Series 2020 – HQA4 $25,009 $680 2.7October 2020 STACR Series 2020 – DNA5 $43,406 $1,086 2.5November 2020 STACR Series 2020 - HQA5 $42,257 $1,080 2.6December 2020 STACR Series 2020 – DNA6 $38,810 $790 2.0January 2021 STACR Series 2021 – DNA1 $58,041 $970 1.7February 2021 STACR Series 2021 – HQA1 $62,980 $1,386 2.2March 2021 STACR Series 2021 – DNA2 $55,687 $1,188 2.1April 2021 STACR Series 2021 – DNA3 $44,585 $950 2.1June 2021 STACR Series 2021 – HQA2 $56,550 $550 1.0July 2021 STACR Series 2021 – DNA5 $71,388 $1,186 1.7Total $2,087,303 $52,512 2.5
Fannie Mae and Freddie Mac have been laying off back-end credit risk through CAS and STACR deals and through reinsurance transactions. They have also done front-end transactions with originators and reinsurers, and experimented with deep mortgage insurance coverage with private mortgage insurers. Historically, the GSEs have transferred vast majority of their credit risk to private markets. Fannie Mae's CAS issuances since inception total $1.65 trillion; Freddie's STACR totals $2.1 trillion. Since the COVID-19 induced spread widening in March 2020, Freddie Mac has issued thirteen deals, while Fannie has issued none.
0
200
400
600
800
1000
1200
1400
1600
1800
Dec
-18
Feb-
19Ap
r-19
Jun-
19Au
g-19
Oct
-19
Dec
-19
Feb-
20Ap
r-20
Jun-
20Au
g-20
Oct
-20
Dec
-20
Feb-
21Ap
r-21
Jun-
21Au
g-21
2017 Low Index 2018 Low Index
2019 Low Index 2020 Low Index
28Sources: Vista Data Services and Urban Institute. Note: Data as of August 17, 2021.
GSE RISK-SHARING INDICESGSES UNDER CONSERVATORSHIP
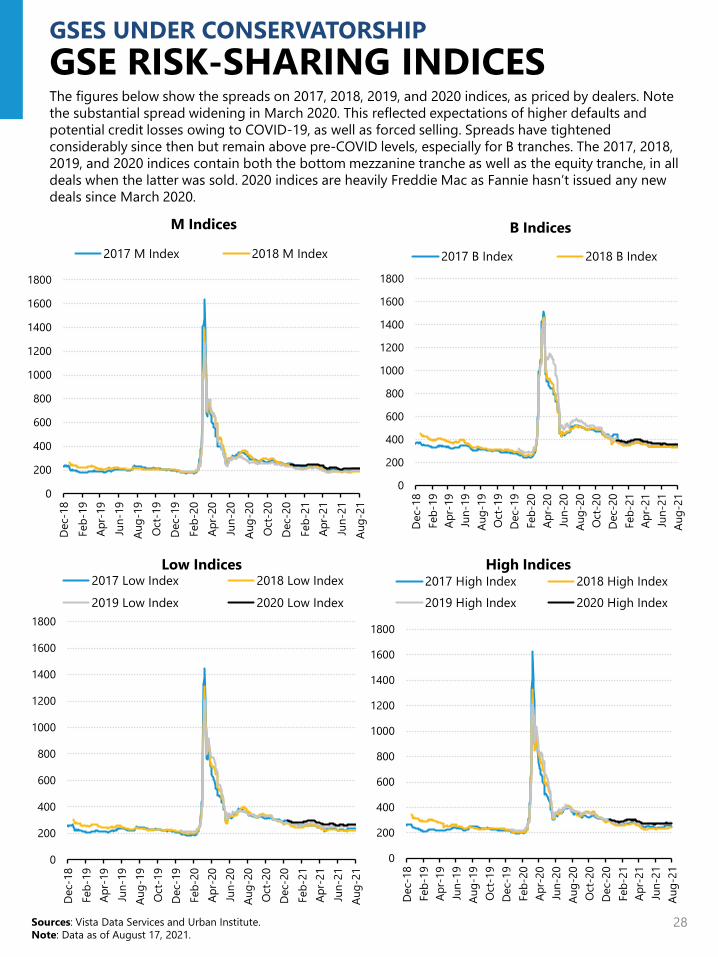
The figures below show the spreads on 2017, 2018, 2019, and 2020 indices, as priced by dealers. Note the substantial spread widening in March 2020. This reflected expectations of higher defaults and potential credit losses owing to COVID-19, as well as forced selling. Spreads have tightened considerably since then but remain above pre-COVID levels, especially for B tranches. The 2017, 2018, 2019, and 2020 indices contain both the bottom mezzanine tranche as well as the equity tranche, in all deals when the latter was sold. 2020 indices are heavily Freddie Mac as Fannie hasn’t issued any new deals since March 2020.
0
200
400
600
800
1000
1200
1400
1600
1800
Dec
-18
Feb-
19Ap
r-19
Jun-
19Au
g-19
Oct
-19
Dec
-19
Feb-
20Ap
r-20
Jun-
20Au
g-20
Oct
-20
Dec
-20
Feb-
21Ap
r-21
Jun-
21Au
g-21
2017 M Index 2018 M Index
0
200
400
600
800
1000
1200
1400
1600
1800
Dec
-18
Feb-
19Ap
r-19
Jun-
19Au
g-19
Oct
-19
Dec
-19
Feb-
20Ap
r-20
Jun-
20Au
g-20
Oct
-20
Dec
-20
Feb-
21Ap
r-21
Jun-
21Au
g-21
2017 High Index 2018 High Index2019 High Index 2020 High Index
Low Indices High Indices
M Indices B Indices
28
0
200
400
600
800
1000
1200
1400
1600
1800
Dec
-18
Feb-
19Ap
r-19
Jun-
19Au
g-19
Oct
-19
Dec
-19
Feb-
20Ap
r-20
Jun-
20Au
g-20
Oct
-20
Dec
-20
Feb-
21Ap
r-21
Jun-
21Au
g-21
2017 B Index 2018 B Index
29
SERIOUS DELINQUENCY RATESGSES UNDER CONSERVATORSHIP
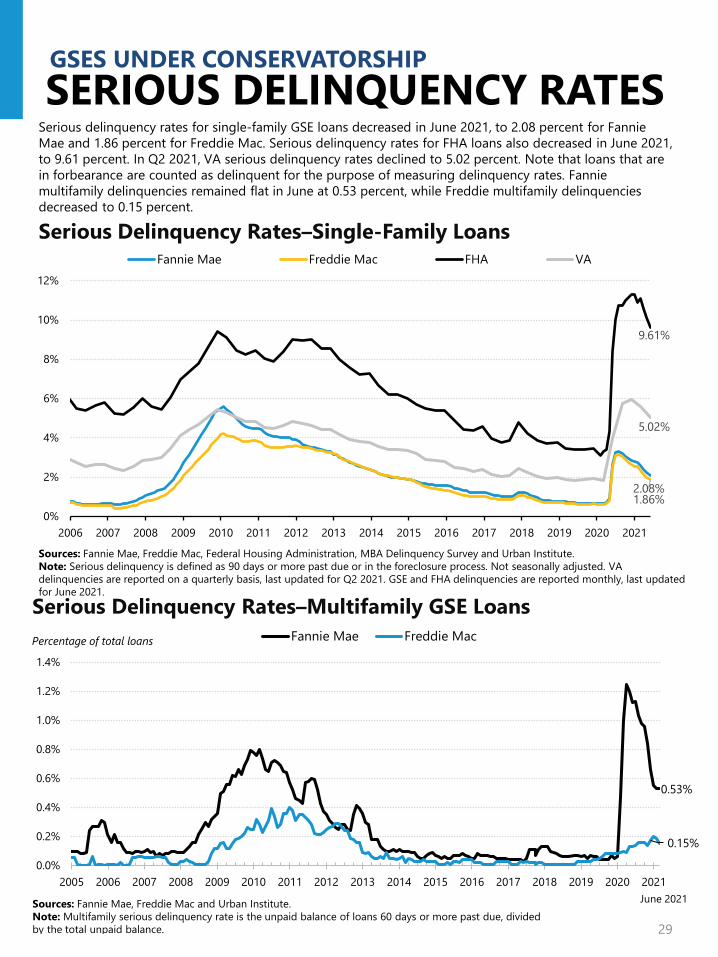
Serious delinquency rates for single-family GSE loans decreased in June 2021, to 2.08 percent for Fannie Mae and 1.86 percent for Freddie Mac. Serious delinquency rates for FHA loans also decreased in June 2021, to 9.61 percent. In Q2 2021, VA serious delinquency rates declined to 5.02 percent. Note that loans that are in forbearance are counted as delinquent for the purpose of measuring delinquency rates. Fannie multifamily delinquencies remained flat in June at 0.53 percent, while Freddie multifamily delinquencies decreased to 0.15 percent.
0.53%
0.15%
0.0%
0.2%
0.4%
0.6%
0.8%
1.0%
1.2%
1.4%
2005 2006 2007 2008 2009 2010 2011 2012 2013 2014 2015 2016 2017 2018 2019 2020 2021
Percentage of total loans
Serious Delinquency Rates–Multifamily GSE LoansFannie Mae Freddie Mac
Sources: Fannie Mae, Freddie Mac and Urban Institute.Note: Multifamily serious delinquency rate is the unpaid balance of loans 60 days or more past due, divided by the total unpaid balance.
June 2021
2.08%1.86%
9.61%
5.02%
0%
2%
4%
6%
8%
10%
12%
2006 2007 2008 2009 2010 2011 2012 2013 2014 2015 2016 2017 2018 2019 2020 2021
Fannie Mae Freddie Mac FHA VA
Sources: Fannie Mae, Freddie Mac, Federal Housing Administration, MBA Delinquency Survey and Urban Institute. Note: Serious delinquency is defined as 90 days or more past due or in the foreclosure process. Not seasonally adjusted. VA delinquencies are reported on a quarterly basis, last updated for Q2 2021. GSE and FHA delinquencies are reported monthly, last updated for June 2021.
Serious Delinquency Rates–Single-Family Loans

30
Agency Gross Issuance Agency Net Issuance
AGENCY GROSS AND NET ISSUANCE
AGENCY ISSUANCE
Issuance Year GSEs Ginnie Mae Total
2001 $885.1 $171.5 $1,056.62002 $1,238.9 $169.0 $1,407.92003 $1,874.9 $213.1 $2,088.02004 $872.6 $119.2 $991.92005 $894.0 $81.4 $975.32006 $853.0 $76.7 $929.72007 $1,066.2 $94.9 $1,161.12008 $911.4 $267.6 $1,179.02009 $1,280.0 $451.3 $1,731.32010 $1,003.5 $390.7 $1,394.32011 $879.3 $315.3 $1,194.72012 $1,288.8 $405.0 $1,693.82013 $1,176.6 $393.6 $1,570.12014 $650.9 $296.3 $947.22015 $845.7 $436.3 $1,282.02016 $991.6 $508.2 $1,499.8
2017 $877.3 $455.6 $1,332.9
2018 $795.0 $400.6 $1,195.3
2019 $1,042.6 $508.6 $1,551.2
2020 $2,407.5 $775.4 $3,182.9
2021 YTD $1,657.1 $525.5 $2,182.62021 %
Change Over 2020
47.6% 29.0% 42.6%
2021 Annualized $2,840.8 $900.6 $3,741.4
Agency gross issuance was $2.18 trillion for the first seven months of 2021, a 42.6 percent increase over the same period of 2020. The sharp increase is due to the refinance wave, which accelerated significantly in 2020 and into 2021. Net issuance (new securities issued less the decline in outstanding securities due to principal pay-downs or prepayments) totaled $443.5 billion in the first seven months of 2021, a 146.9 percent increase from the volume in the first seven months of 2020.
Sources: eMBS and Urban Institute.Note: Dollar amounts are in billions. Data as of July 2021.
Issuance Year GSEs Ginnie Mae Total
2001 $368.40 -$9.90 $358.50 2002 $357.20 -$51.20 $306.10 2003 $334.90 -$77.60 $257.30 2004 $82.50 -$40.10 $42.40 2005 $174.20 -$42.20 $132.00 2006 $313.60 $0.20 $313.80 2007 $514.90 $30.90 $545.70 2008 $314.80 $196.40 $511.30 2009 $250.60 $257.40 $508.00 2010 -$303.20 $198.30 -$105.002011 -$128.40 $149.60 $21.20 2012 -$42.40 $119.10 $76.80 2013 $69.10 $87.90 $157.00 2014 $30.5 $61.6 $92.12015 $75.1 $97.3 $172.52016 $127.4 $125.8 $253.1
2017 $168.5 $131.3 $299.7
2018 $149.4 $112.0 $261.5
2019 $197.8 $95.7 $293.5
2020 $632.8 $19.9 $652.7
2021 YTD $454.7 -$11.2 $443.52021 %
Change Over 2020
164.8% -43.0% 146.9%
2021 Annualized $779.4 -$19.2 $760.2
050
100150200250300350400
($ billions)
Fed Absorption of Agency Gross Issuance
Gross issuance Total Fed purchases
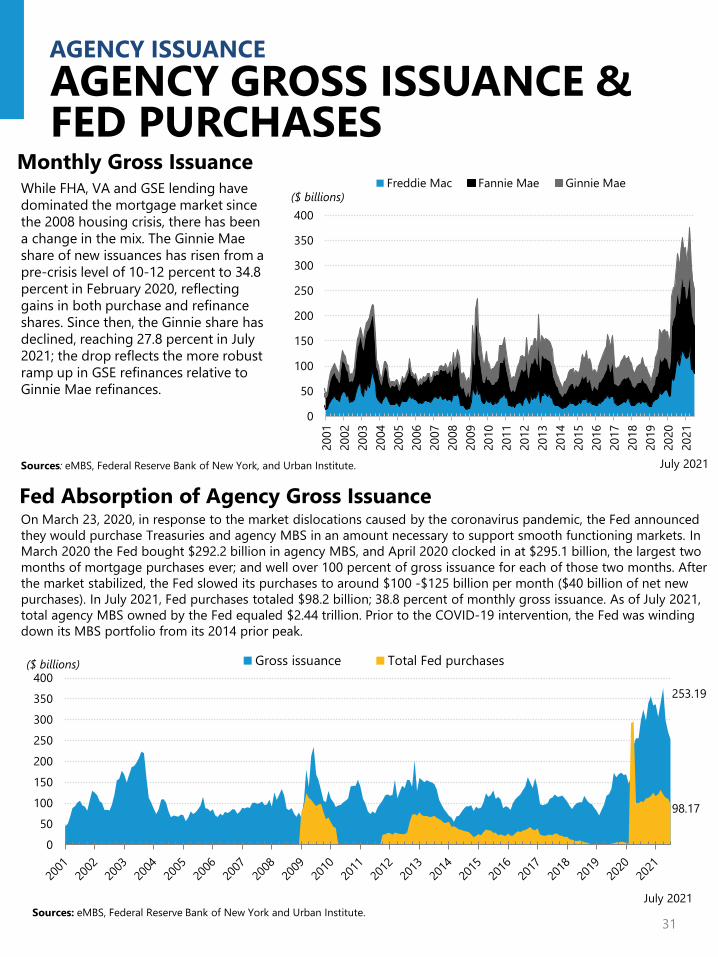
On March 23, 2020, in response to the market dislocations caused by the coronavirus pandemic, the Fed announced they would purchase Treasuries and agency MBS in an amount necessary to support smooth functioning markets. In March 2020 the Fed bought $292.2 billion in agency MBS, and April 2020 clocked in at $295.1 billion, the largest two months of mortgage purchases ever; and well over 100 percent of gross issuance for each of those two months. After the market stabilized, the Fed slowed its purchases to around $100 -$125 billion per month ($40 billion of net new purchases). In July 2021, Fed purchases totaled $98.2 billion; 38.8 percent of monthly gross issuance. As of July 2021, total agency MBS owned by the Fed equaled $2.44 trillion. Prior to the COVID-19 intervention, the Fed was winding down its MBS portfolio from its 2014 prior peak.
Sources: eMBS, Federal Reserve Bank of New York and Urban Institute.July 2021
253.19
98.17
31
AGENCY GROSS AND NET ISSUANCE BY MONTHAGENCY ISSUANCEAGENCY GROSS ISSUANCE & FED PURCHASES
0
50
100
150
200
250
300
350
400
2001
2002
2003
2004
2005
2006
2007
2008
2009
2010
2011
2012
2013
2014
2015
2016
2017
2018
2019
2020
2021
($ billions)
Monthly Gross IssuanceFreddie Mac Fannie Mae Ginnie Mae
July 2021Sources: eMBS, Federal Reserve Bank of New York, and Urban Institute.
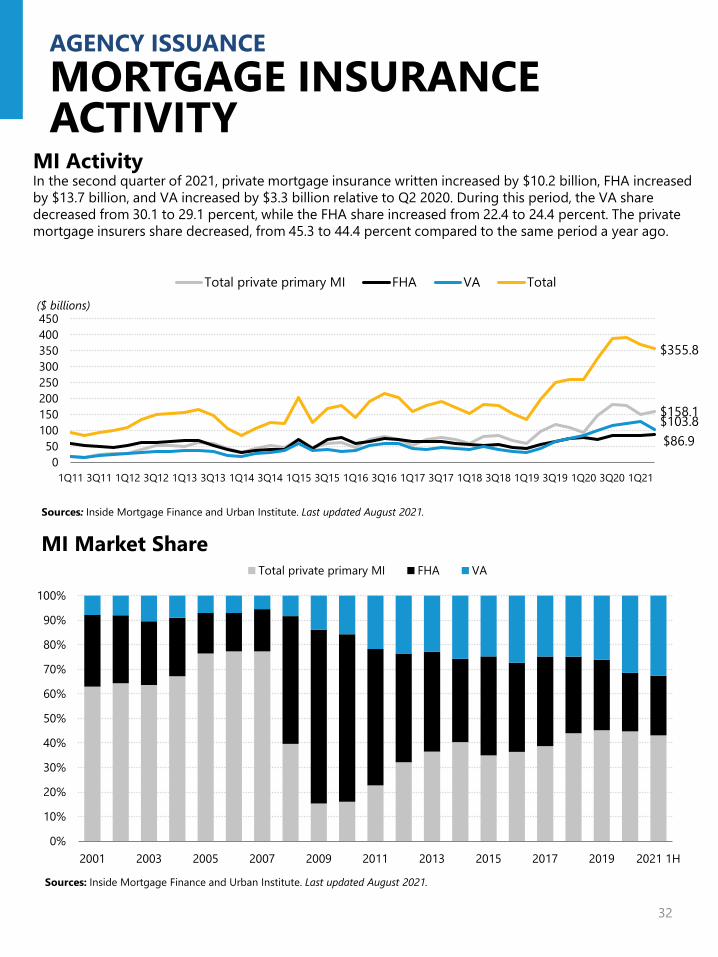
While FHA, VA and GSE lending have dominated the mortgage market since the 2008 housing crisis, there has been a change in the mix. The Ginnie Mae share of new issuances has risen from a pre-crisis level of 10-12 percent to 34.8 percent in February 2020, reflecting gains in both purchase and refinance shares. Since then, the Ginnie share has declined, reaching 27.8 percent in July 2021; the drop reflects the more robust ramp up in GSE refinances relative to Ginnie Mae refinances.
32
MORTGAGE INSURANCE ACTIVITY
AGENCY ISSUANCE
0%
10%
20%
30%
40%
50%
60%
70%
80%
90%
100%
2001 2003 2005 2007 2009 2011 2013 2015 2017 2019 2021 1H
MI Market Share Total private primary MI FHA VA
Sources: Inside Mortgage Finance and Urban Institute. Last updated August 2021.
$158.1
$86.9$103.8
$355.8
050
100150200250300350400450
1Q11 3Q11 1Q12 3Q12 1Q13 3Q13 1Q14 3Q14 1Q15 3Q15 1Q16 3Q16 1Q17 3Q17 1Q18 3Q18 1Q19 3Q19 1Q20 3Q20 1Q21
($ billions)
Total private primary MI FHA VA Total
MI Activity
Sources: Inside Mortgage Finance and Urban Institute. Last updated August 2021.
In the second quarter of 2021, private mortgage insurance written increased by $10.2 billion, FHA increased by $13.7 billion, and VA increased by $3.3 billion relative to Q2 2020. During this period, the VA share decreased from 30.1 to 29.1 percent, while the FHA share increased from 22.4 to 24.4 percent. The private mortgage insurers share decreased, from 45.3 to 44.4 percent compared to the same period a year ago.

33
MORTGAGE INSURANCE ACTIVITY
AGENCY ISSUANCE
FHA MI Premiums for Typical Purchase Loan Case number date Upfront mortgage insurance
premium (UFMIP) paidAnnual mortgage insurance
premium (MIP)1/1/2001 - 7/13/2008 150 507/14/2008 - 4/5/2010* 175 554/5/2010 - 10/3/2010 225 5510/4/2010 - 4/17/2011 100 904/18/2011 - 4/8/2012 100 1154/9/2012 - 6/10/2012 175 125
6/11/2012 - 3/31/2013a 175 1254/1/2013 – 1/25/2015b 175 135Beginning 1/26/2015c 175 85
Sources: Ginnie Mae and Urban Institute.Note: A typical purchase loan has an LTV over 95 and a loan term longer than 15 years. Mortgage insurance premiums are listed in basis points. * For a short period in 2008 the FHA used a risk based FICO/LTV matrix for MI. a Applies to purchase loans less than or equal to $625,500. Those over that amount have an annual premium of 150 bps.b Applies to purchase loans less than or equal to $625,500. Those over that amount have an annual premium of 155 bps.c Applies to purchase loans less than or equal to $625,500. Those over that amount have an annual premium of 105 bps.
FHA premiums rose significantly in the years following the housing crash, with annual premiums rising from 50 to 135 basis points between 2008 to 2013 as FHA worked to shore up its finances. In January 2015, President Obama announced a 50 bps cut in annual insurance premiums, making FHA mortgages more attractive than GSE mortgages for the overwhelming majority of borrowers putting down less than 5%. The April 2016 reduction in PMI rates for borrowers with higher FICO scores and April 2018 reduction for lower FICO borrowers has partially offset that. As shown in the bottom table, a borrower putting 3.5 percent down with a FICO of less than 720 will find FHA financing to be more financially attractive, borrowers with FICOs of 720 and above will find GSE execution with PMI to be more attractive.
AssumptionsProperty Value $250,000Loan Amount $241,250LTV 96.5Base Rate
Conforming 2.87FHA 3.08
Initial Monthly Payment Comparison: FHA vs. PMI
FICO 620 - 639 640 - 659 660 - 679 680 - 699 700 - 719 720 - 739 740 - 759 760 +
FHA MI PremiumsFHA UFMIP 1.75 1.75 1.75 1.75 1.75 1.75 1.75 1.75FHA MIP 0.85 0.85 0.85 0.85 0.85 0.85 0.85 0.85
PMIGSE LLPA* 3.50 2.75 2.25 1.50 1.50 1.00 0.75 0.75PMI Annual MIP 1.86 1.65 1.54 1.21 0.99 0.87 0.70 0.58
Monthly PaymentFHA $1,216 $1,216 $1,216 $1,216 $1,216 $1,216 $1,216 $1,216PMI $1,467 $1,404 $1,369 $1,283 $1,238 $1,201 $1,160 $1,136PMI Advantage -$250 -$188 -$152 -$66 -$22 $15 $56 $80
Sources: Genworth Mortgage Insurance, Ginnie Mae, and Urban Institute. FHA rate from MBA Weekly Applications Survey. Conforming rate from Freddie Mac Primary Mortgage Market Survey.Note: Rates as of July 2021.Mortgage insurance premiums listed in percentage points. Grey shade indicates FHA monthly payment is more favorable, while blue indicates PMI is more favorable. The PMI monthly payment calculation does not include special programs like Fannie Mae’s HomeReady and Freddie Mac’s Home Possible (HP), both offer more favorable rates for low- to moderate-income borrowers.LLPA= Loan Level Price Adjustment, described in detail on page 25.

Upcoming events:See our events page for more information on other upcoming and past events.
Projects
The Mortgage Servicing Collaborative
Housing Credit Availability Index (HCAI)
Home Mortgage Disclosure Act Projects
Mortgage Markets COVID-19 Collaborative
Reducing the Racial Homeownership Gap
Publications
Homeownership Assistance, Including for FirstGeneration HomeownersAuthors: Janneke Ratcliffe,Date: August 10, 2021
A Three-Decade Decline in the Homeownership Gender GapAuthors: Jung Choi, Laurie Goodman, Jun ZhuDate: August 25, 2021
Ginnie Mae’s Proposed Eligibility Requirements for Single-Family IssuersAuthors: Laurie Goodman, Karan Kaul, Ted TozerDate: August 6, 2021
Loss Mitigation Toolkit Improvements for Borrowers Exiting COVID-19 ForbearanceAuthors: Karan Kaul, Laurie Goodman, Michael NealDate: July 6, 2021
Mortgage Insurance Data At A GlanceAuthors: Karan Kaul, Laurie Goodman, John Walsh,Daniel Pang, Jun ZhuDate: July 1, 2021
FHFA’s Confused Critique of Fannie and Freddie’s Transfer of Credit RiskAuthors: Laurie Goodman, Jim Parrott, Bob Ryan, Mark ZandiDate: June 15, 2021
Homeownership Is Affordable HousingAuthors: Mike LoftinDate: May 7, 2021
Blog Posts
The FHA’s New Loss Mitigation Waterfall Will Offer MuchNeeded Relief to Borrowers Exiting ForbearanceAuthors: Karan Kaul & Laurie GoodmanDate: August 25, 2021
Fannie Mae’s Decision to Incorporate Rental Payments intothe Mortgage Origination Process Will Expand Access to Homeownership Over TimeAuthors: Laurie Goodman & Jun ZhuDate: August 12, 2021
If Repurposed for Their Intended Use, Guarantee Fees Can Help Advance Racial Equity in HousingAuthors: Michael StegmanDate: August 5, 2021
The Pandemic Is Making It Difficult for Mom-and-Pop Landlords to Maintain Their PropertiesAuthors: Laurie Goodman, Jung Hyun Choi, Daniel PangDate: July 23, 2021
The FHFA Has a Small Window to Enact a Policy to Create a More Equitable Housing Finance SystemAuthors: Michael StegmanDate: July 21, 2021
Increasing Diversity in the Appraisal Profession Combined with Short-Term Solutions Can Help Address Valuation Bias for Homeowners of ColorAuthors: Michael Neal, Peter MattinglyDate: July 1, 2021
With Just a Month Left of the Eviction Moratorium, Many Mom-and-Pop Landlords and Tenants Are Still Unaware of Federal Rental AssistanceAuthors: Jung Hyun Choi, Daniel Pang, Laurie GoodmanDate: June 30, 2021
Low-Density Infill’s Role in Fixing Los Angeles’s Housing Supply ShortageAuthors: Linna Zhu, John WalshDate: June 23, 2021
Goal Setting and Data Benchmarking Can Help Narrow the Racial Homeownership Gap Authors: Janneke Ratcliffe, Jung ChoiDate: June 18, 2021
PUBLICATIONS AND EVENTSRELATED HFPC WORK
34

35
Copyright June 2021. The Urban Institute. All rights reserved. Permission is granted for reproduction of this file, with attribution to the Urban Institute. The Urban Institute is a nonprofit, nonpartisan policy research and educational organization that examines the social, economic, and governance problems facing the nation.
Acknowledgments
The Housing Finance Policy Center (HFPC) was launched with generous support at the leadership level from the Citi Foundation and John D. and Catherine T. MacArthur Foundation. Additional support was provided by The Ford Foundation and The Open Society Foundations.
Ongoing support for HFPC is also provided by the Housing Finance Innovation Forum, a group of organizations and individuals that support high-quality independent research that informs evidence-based policy development. Funds raised through the Forum provide flexible resources, allowing HFPC to anticipate and respond to emerging policy issues with timely analysis. This funding supports HFPC’s research, outreach and engagement, and general operating activities.
The chartbook is funded by these combined sources. We are grateful to them and to all our funders, who make it possible for Urban to advance its mission.
The views expressed are those of the authors and should not be attributed to the Urban Institute, its trustees, or its funders. Funders do not determine research findings or the insights and recommendations of Urban experts. Further information on the Urban Institute’s funding principles is available at www.urban.org/support.
Housing Finance Innovation Forum Members as of June 2021
Organizations400 Capital ManagementAGNC Investment Corp.American Bankers AssociationAndrew Davidson & Co. Arch Capital GroupAuction.comBank of AmericaBlackRockCaliber Home LoansCitizens BankEllington Management GroupEnact (formerly Genworth MI)
FICOFreedom MortgageHousing Policy Council Ivory HomesMGICMortgage Bankers AssociationMovement MortgageMr. Cooper National Association of Home BuildersNational Association of RealtorsNational Foundation for Credit CounselingNew American FundingOcwen FinancialPretium PartnersPulte Home MortgageRiskSpanRocketMortgageSitusAMCTilden Park CapitalUnion Home MortgageU.S. Mortgage Insurers VantageScoreWells Fargo Zillow
IndividualsKenneth BaconMary MillerJim MillsteinShekar NarasimhanAndrew RippertFaith SchwartzCarl ShapiroBill YoungMark & Ava Zandi
Data PartnersAvailBlack Knight, Inc.CoreLogicFirst AmericanMoody’s Analytics
