housing and community in the compact city - … · housing and community in the compact city...
TRANSCRIPT
Housing and community in the compact city authored by Ernest Healy and Bob Birrell
Australian Housing and Urban Research Institute Swinburne-Monash Research Centre
February 2004 AHURI Positioning Paper No. 66
ISSN: 1834-9250 ISBN: 1 920941 01 0
ACKNOWLEDGEMENTS This material was produced with funding from the Commonwealth of Australia and the Australian States and Territories. AHURI Ltd gratefully acknowledges the financial and other support it has received from the Australian, State and Territory governments, without which this work would not have been possible.
DISCLAIMER AHURI Ltd is an independent, non-political body which has supported this project as part of its programme of research into housing and urban development, which it hopes will be of value to policy-makers, researchers, industry and communities. The opinions in this publication reflect the views of the authors and do not necessarily reflect those of AHURI Ltd, its Board or its funding organisations. No responsibility is accepted by AHURI Ltd or its Board or its funders for the accuracy or omission of any statement, opinion, advice or information in this publication.
AHURI POSITIONING PAPER SERIES AHURI Positioning Papers is a refereed series presenting the preliminary findings of original research to a diverse readership of policy makers, researchers and practitioners.
CONTENTS EXECUTIVE SUMMARY ................................................................................................. I 1. HOUSING PRACTICE AND POLICY, FROM FEDERATION TO THE 1960S .......... 1
1.1. Low-density suburbia still the preferred option: ................................................ 1 2. THE REACTION AGAINST LOW-DENSITY URBAN DEVELOPMENT: ................... 4
2.1. The Better Cities Program: ............................................................................... 5 2.2. The dominant compact city paradigms: ‘smart growth and ‘new urbanism’: .... 7 2.3. The compact city ideal and ‘cultural reform’: .................................................... 8 2.4. Global Economic Relevance and the Changing Role of Cities:...................... 10
3. POPULATION PRESSURE, METROPOLITAN DOMINANCE AND COMPACT CITY POLICY........................................................................................................... 12
3.1. Sydney:........................................................................................................... 13 3.2. Melbourne:...................................................................................................... 14 3.3. Brisbane: ........................................................................................................ 16 3.4. Perth: .............................................................................................................. 17
4. RESEARCH ISSUES: .............................................................................................. 18 4.1. Emerging uncertainties about urban consolidation:........................................ 18 4.2. Spatial polarisation and the metropolitan fringe: ............................................ 21 4.3. How will the Melbourne 2030 policy impact upon this situation?.................... 26
5. RESEARCH AIMS.................................................................................................... 30 5.1. Key questions to be explored by the research are: ........................................ 30
6. RESEARCH METHOD............................................................................................. 31 6.1. Understanding residential differentiation ........................................................ 31 6.2. Outer Surbuban Housing Developments........................................................ 33 6.3. Provisional case study areas:......................................................................... 37
BIBLIOGRAPHY ........................................................................................................... 49
LIST OF TABLES Figure 1: Projected Annual Increase in Households, Australian Capital Cities 2001-
2002 to 2019-2020................................................................................................12 Figure 2: Melton, men 25-64 years, per cent Net Gain/Loss by Income Group, 1996-
2001, and Income Profile......................................................................................34 Figure 3: Wyndham, Men 25-64 years, per cent Net Gain/Loss by Income Group,
1996-2001, and Income Profile 2001....................................................................34 Figure 4: Whittlesea, Men 25-64 years, per cent Net Gain/Loss by Individual Income,
1996-2001, and Income Profile 2001....................................................................35 Figure 5: Keilor, Men 25-64 years, per cent Net Gain/Loss by Income Group, and
Income Profile 2001..............................................................................................35 Figure 6: Map 1, Distribution of CDs within the Melbourne Statistical Division in 2001
..............................................................................................................................36
LIST OF FIGURES Table 1: Buildng approvals for new dwellings by type, Sydney and Melbourne 1996-
1997 to 2002-2003................................................................................................13 Table 2: Housing Affordability Index and Required Loan Repayments by Region,
Australia, March 2002 to June 2003 .....................................................................15 Table 3: Melbourne, selected SLAs, Men aged 25-64 years by Weekly Income,
Residential Location and Movement, 1991 and 1996...........................................23 Table 4: Sydney, selected LGAs, Men aged 25-64 years by Weekly Individual Income
and Persons aged 5+ years by Birthplace, 1996 - 2001.......................................25 Table 5: Median Price and Number of Sales of Houses, 1996, 1999, 2001 and
Preliminary 2002...................................................................................................26 Table 6: Net Gain/Loss 1996-2001 as % 1996 Residential Population .......................32
EXECUTIVE SUMMARY The 1990s was a watershed in the adoption of compact city policies by federal and state governments in Australia. Although these policies varied in detail from state to state, they were premised upon a common set of concerns relating to the economic cost of urban expansion, environmental degradation and the perceived negative cultural consequences of low-density suburban ‘sprawl’. This research undertakes an empirical exploration of the implications of the compact city approach for socially disadvantaged groups in Melbourne, the findings of which are expected to be relevant to the application of compact city policy in other Australian cities. The Victorian compact city policy, Melbourne 2030, is typical in so far as it advocates the need to increase residential densities across the Melbourne metropolitan area. It posits that, if environmental sustainability is to be realised, and future urban infrastructure costs curtailed, a less automobile dependent, more localised and higher-density urban form, and lifestyle, has to be implemented on a metropolitan-wide scale. Consistent with compact city policies in other states, Melbourne 2030 also makes strong community development claims, involving the creation of attractive, walkable and diverse communities, conducive to a greater sense of resident security, the preservation of neighbourhood character and an enhanced sense of place.
Although the compact city policies often emphasise a number of expected social benefits from urban consolidation, including the need for affordable housing and socially-mixed neighbourhoods, there is little recognition of the spatial differentiation of communities on class lines that now exist in metropolitan centres like Melbourne and Sydney, which make uniformly beneficial outcomes from urban consolidation uncertain. It is therefore important to explore the possibility that, in some circumstances, increased urban densities, un-moderated by ameliorative action, may pose further difficulties for those living in areas of concentrated social disadvantage. If the processes of social polarisation and increasing housing stress that currently characterise the cities like Melbourne continue under the new policy approach, then it is likely that residents in some areas will be drawn from lower socio-economic groups for whom high-density settings may be detrimental.
Our guiding hypothesis is that the housing or social characteristics of locations are important determinants of which areas become less favoured. Once an area begins to lose favour, those residents who have the necessary financial resources to move out will tend to so. As a consequence, the value of housing tends to decline relative to more favoured areas. At the same time, people who have limited resources are likely to gravitate to the area largely because there are limited alternative housing options for such people. The proposed research will explore the role of the built environment, particularly in relation to residential densities and local amenity, including the physical aesthetics of neighbourhoods, in shaping attitudes to particular residential areas. This will provide a better understanding of the key factors that contribute to the ‘residualisation’ of particular areas within Melbourne – the process whereby low-income persons with poor labour market prospects and multiple social problems become spatially concentrated.
The research will proceed in two phases. The first phase will review the factors involved in the consolidation of housing locations in established suburbs that have become residuals. We need to learn about these factors in order to better anticipate what may arise in other locations under various policy scenarios, including urban consolidation. An examination of the potential for some suburban fringe locations to become residuals is the second important focus of the research. Here, we will apply the insights and test the ideas gained from the first phase of analysis to explore what is happening on the suburban frontier.
i

This positioning paper sets the scene for the subsequent analysis. It first examines past Australian urban policy and practice as well as Australian housing ideas. It then explores the origin of compact city ideas, the empirical evidence to date in Australia, Europe and the United States, and the views of commentators about this experience. Finally, it details the research strategy to be employed during the inquiry.
ii
1. HOUSING PRACTICE AND POLICY, FROM FEDERATION TO THE 1960S
Historically, the central goal of urban policy in Australia has been to facilitate suburban development, an approach that accommodated a growing population with aspirations to a high level of home ownership. Beyond home ownership, residential aspirations also often focused on the provision of a healthy residential environment, in part characterised by ample open space, an ideal encapsulated in the idea of the garden city (Garnaut, 2000: 46-47). From the 19th Century, because of the relatively high wage levels and low housing costs in Australia, the predominant urban form that was adopted was one that only an affluent minority in England could aspire to. Low-density suburban development became a measure of the social progress and prosperity of the Australian colonies in relation to the ‘old world’ (See Frost and Dingle, 1995: 21-23). This was made possible by the ready availability of land, high incomes and a willingness of governments to fund transport and other infrastructure costs of metropolitan expansion. However, another factor was the emerging protectionist ethos of late 19th Century colonial societies in Australia. The protectionist, nation-building climate of the early federation period provided a platform upon which a progressive town planning movement could flourish. This movement, conscious of the potential problems associated with unplanned, market-driven urban development, promoted town planning as a basis for social reform. The garden city ideal played an integral role in the town planning vision for a society characterised by a healthy balance of town and country life, and free of overcrowding (Garnaut, 2000: 47). Although proposals varied, the provision of reserved open space and opportunities for contact with nature became important goals for town planning associations in Australian cities. Interestingly, green belts were sometimes advocated as a means for limiting metropolitan expansion (Garnaut, 2000: 53-55). Notably, although garden city principles largely reflected those of the town planning movement in Britain, suburban development in the Australian context was characterised by a preference for single-detached houses on larger blocks of land (Garnaut, 2000: 61). Under this approach, suburban developments were characterised by zoning systems, which largely separated residential, commercial, industrial and other activities (Garnaut, 2000: 61).
1.1. Low-density suburbia still the preferred option: Available survey data suggests that the low-density suburban model which consolidated in the post-federation period and which expanded rapidly after the Second World War remains the preferred urban form for the majority of Australians.
A 1981 survey of 1600 Melbourne households found that 60 per cent of households planning to move preferred detached housing. The survey also suggested that, although many people may settle for either a townhouse or villa unit, if desirable location and/or other priorities were met, their basic preference was for detached housing (AHURI, 1997: 127-132). A 1992 study of 550 households in Sydney found that 75 per cent of the respondents aged 26-30 years preferred detached housing (ibid.). And, while 31 percent of all respondents were totally committed to detached housing, another 35 per cent preferred detached housing, but would consider multi-unit housing if a trade off were possible in favour of other key factors, such as cost, design quality and good location (AHURI, 1997: 127-132). A 1987 study found that, while about half of those persons surveyed would consider townhouses and villa units, 90 per cent considered flats to be totally unacceptable (AHURI, 1997: 127-132).
1
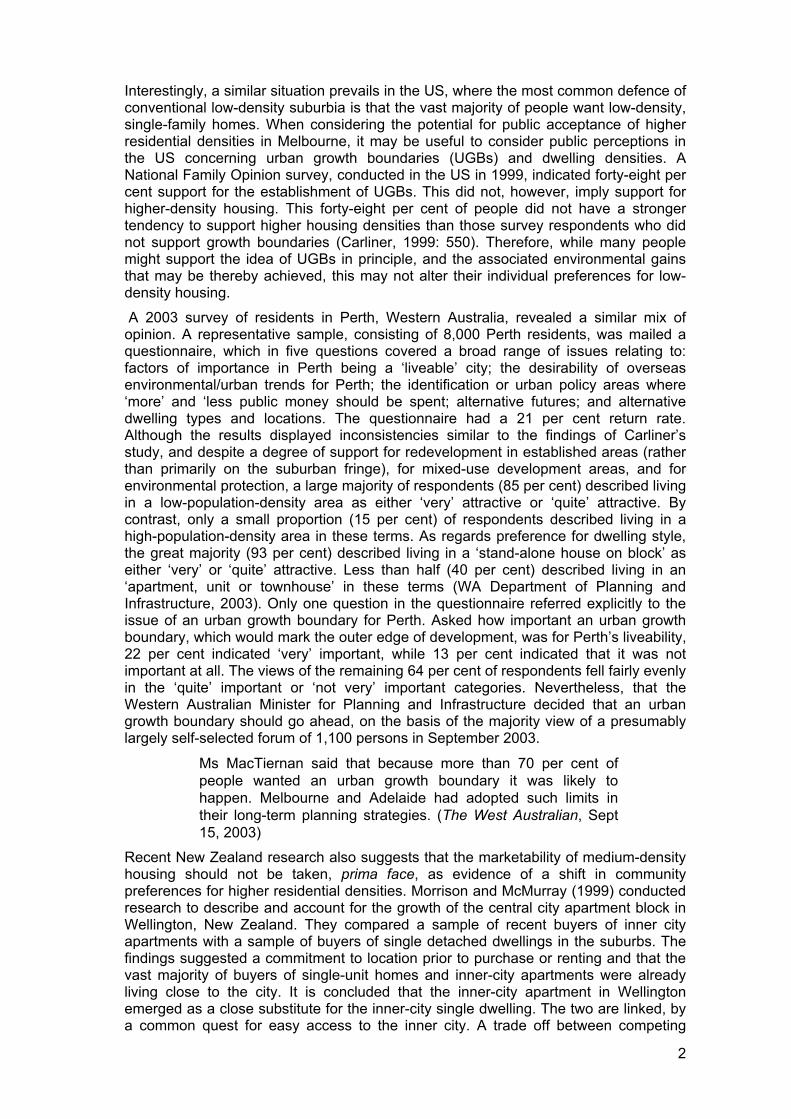
Interestingly, a similar situation prevails in the US, where the most common defence of conventional low-density suburbia is that the vast majority of people want low-density, single-family homes. When considering the potential for public acceptance of higher residential densities in Melbourne, it may be useful to consider public perceptions in the US concerning urban growth boundaries (UGBs) and dwelling densities. A National Family Opinion survey, conducted in the US in 1999, indicated forty-eight per cent support for the establishment of UGBs. This did not, however, imply support for higher-density housing. This forty-eight per cent of people did not have a stronger tendency to support higher housing densities than those survey respondents who did not support growth boundaries (Carliner, 1999: 550). Therefore, while many people might support the idea of UGBs in principle, and the associated environmental gains that may be thereby achieved, this may not alter their individual preferences for low-density housing.
A 2003 survey of residents in Perth, Western Australia, revealed a similar mix of opinion. A representative sample, consisting of 8,000 Perth residents, was mailed a questionnaire, which in five questions covered a broad range of issues relating to: factors of importance in Perth being a ‘liveable’ city; the desirability of overseas environmental/urban trends for Perth; the identification or urban policy areas where ‘more’ and ‘less public money should be spent; alternative futures; and alternative dwelling types and locations. The questionnaire had a 21 per cent return rate. Although the results displayed inconsistencies similar to the findings of Carliner’s study, and despite a degree of support for redevelopment in established areas (rather than primarily on the suburban fringe), for mixed-use development areas, and for environmental protection, a large majority of respondents (85 per cent) described living in a low-population-density area as either ‘very’ attractive or ‘quite’ attractive. By contrast, only a small proportion (15 per cent) of respondents described living in a high-population-density area in these terms. As regards preference for dwelling style, the great majority (93 per cent) described living in a ‘stand-alone house on block’ as either ‘very’ or ‘quite’ attractive. Less than half (40 per cent) described living in an ‘apartment, unit or townhouse’ in these terms (WA Department of Planning and Infrastructure, 2003). Only one question in the questionnaire referred explicitly to the issue of an urban growth boundary for Perth. Asked how important an urban growth boundary, which would mark the outer edge of development, was for Perth’s liveability, 22 per cent indicated ‘very’ important, while 13 per cent indicated that it was not important at all. The views of the remaining 64 per cent of respondents fell fairly evenly in the ‘quite’ important or ‘not very’ important categories. Nevertheless, that the Western Australian Minister for Planning and Infrastructure decided that an urban growth boundary should go ahead, on the basis of the majority view of a presumably largely self-selected forum of 1,100 persons in September 2003.
Ms MacTiernan said that because more than 70 per cent of people wanted an urban growth boundary it was likely to happen. Melbourne and Adelaide had adopted such limits in their long-term planning strategies. (The West Australian, Sept 15, 2003)
Recent New Zealand research also suggests that the marketability of medium-density housing should not be taken, prima face, as evidence of a shift in community preferences for higher residential densities. Morrison and McMurray (1999) conducted research to describe and account for the growth of the central city apartment block in Wellington, New Zealand. They compared a sample of recent buyers of inner city apartments with a sample of buyers of single detached dwellings in the suburbs. The findings suggested a commitment to location prior to purchase or renting and that the vast majority of buyers of single-unit homes and inner-city apartments were already living close to the city. It is concluded that the inner-city apartment in Wellington emerged as a close substitute for the inner-city single dwelling. The two are linked, by a common quest for easy access to the inner city. A trade off between competing
2
preferences can result in a market demand for an alternative dwelling style in a preferred location. This, however, does not mean that the demonstrated demand reflects purchasers’ first preference in dwelling style. The authors conclude:
The conversion of office blocks to apartments appears to have allowed a growing, pent-up demand among many Wellingtonians for location to be realised, rather than denoting the beginning of any reversal of the long-established preference for the single family unit per se. Single detached dwellings are simply unavailable within the CBD (Morrison and McMurray, 1999: 391).
Similarly, in a Canadian study conducted by Meligrana in the early 1990s, the author also highlighted the need to distinguish between market demand for alternative higher-density dwellings and dwelling preferences. The research, conducted across a number of Canadian cities, examined the impact of the condominium sector on households’ tenure transition by comparing condominium owner-occupants who had moved from the rental market with those who moved from the homeownership market (Meligrana, 1993).
Meligrana concluded that the condominium sector allowed young tenant households to acquire dwelling equity before their desired purchase of a single detached dwelling. While many previous renters were attracted to condominium tenure option because of attractive financing, they were often people who had been economically constrained from realizing their initial goal of a detached freehold dwelling. This group tended to settle on condominium tenure as a transition phase (Meligrana, 1993).
3
2. THE REACTION AGAINST LOW-DENSITY URBAN DEVELOPMENT:
This section provides a brief survey of the criticisms of low-density suburban development, which clearly had emerged by the 1960s and which gained momentum in the period leading up to the 1990s, when the federal government again became directly involved in urban policy issues. An examination of the nature of the criticisms of this earlier period provides a basis for better understanding current compact city policy, including the implications of the policy for the socially disadvantaged.
As indicated above, state infrastructure agencies played a key role in the planning for and development of the low-density urban growth model, with water, energy and transport departments engaged in facilitating urban expansion. They did not always plan effectively. For example, the Melbourne Metropolitan Planning Scheme never accurately foreshadowed actual growth outcomes, with suburban expansion often outstripping growth predictions (McLoughlin, 1992: 162-171). However, the reverse occurred too, with the MMBW planning scheme of the early 1970s anticipating Melbourne would grow at least to 4.5 million people by the year 2000 (MMBW, 1971: 21). It actually numbered 3.4 million. As a result, the planning problems of rapid post-war suburbanisation gave rise to considerable criticism, particularly by the 1970s.
In the early 1970s, for example, Labor Prime Minister Gough Whitlam criticised urban ‘sprawl’ as a product of unchecked speculation by private land developers, which he associated with “…poor planning of community services in outer suburbs…” and “…the decay and desolation of inner-city life…” (Whitlam, 1985: 373-375). The problems of poorly regulated ‘sprawl’, he argued, included poor roads and transport, too few recreation facilities, scattered civic amenities, neurosis, delinquency and vandalism (Whitlam, 1985: 374). Whitlam stated:
Government programs for housing renewals swim against the tide of private urban development. In the private housing market the greatest profits are made on the urban fringe. Inner-city areas are neglected. (Whitlam, 1985: 373)
Only governments, he contended, could reverse the trend of business involvement where the “…biggest and quickest profits [could] be made…” (Whitlam, 1985: 375). The Whitlam Labor government’s initiative in bringing urban planning into the federal political sphere was groundbreaking and reflected a more widely held criticism of post-war suburban expansion within the party. His predecessor, Arthur Calwell, also considered suburban sprawl “…with ugly houses…” an excess of free enterprise (Calwell, 1963: 122). These perspectives were lent support by Sandercock’s (1975) research, which showed that much urban planning was designed to facilitate profits from land development.
Some cultural commentators in this period, for example Robin Boyd (1963), linked this criticism of suburban development to a criticism of Australian culture in general, a tendency that would be revived during the 1990s and become integral to the advocacy of compact city development. Labor politician Don Dunstan was an influential example of the cultural cringe that had emerged by the 1970s concerning Australian identity and culture in general and its suburban manifestation in particular. Dunstan associated an alleged failure to identify with the natural environment by Australians with a perceived malaise of city life. In Dunstan’s view, Australian urban architecture went from a slavish and environmentally dysfunctional imitation of crowded English building styles during the colonial period to an impersonal conformist, low-density suburbia in the post-World-War-Two era. It allegedly lacked a sense of community and artificially separated residential, commercial and other activities (Dunstan, 1981: 33-34). It is notable that Dunstan promotes a view of suburban ‘sprawl’, which was to become part
4
of the rationale of the Better Cities Program a decade later under Brian Howe. Dunstan refers to:
…the problem with a continued urban sprawl [whereby] people on the lower levels of income are forced far out to the edge of cities living in isolated places like the newer outer suburbs, with no local amenities…you don’t have those people effectively living in a community… In consequence you can face a real breakdown at every level of human existence… (Dunstan, 1981: 34)
It seems that, in Dunstan’s view, fringe suburban existence represented a form of cultural depravity. A characteristic of Dustan’s perspective, which would carry over into the criticism of suburban ‘sprawl’ by compact city advocates during the 1990s, was the idea that the cultural redemption of Australian life would in part be achieved through a reversal of restrictive zoning provisions together with an abandonment of low-density residential development. Further, like the nostalgia for local ‘community’ characteristic of the compact city formulations of the 1990s, reflected in the idea of the ‘urban village’, Dunstan derided the auto-dependent growth of supermarkets and large, impersonal shopping centres at the expense of small local shops (Dunstan, 1981: 37). As discussed below, the idea of a ‘restoration’ of a sense of ‘community’ of an earlier era became a prominent feature of compact city rhetoric during the 1990s, most notably in the concept of the ‘urban village’.
It is clear that concern over the rapidity, scale and the social outcomes of suburban expansion had been simmering for a considerable period. During the late 1980s and early 1990s, however, efforts to incorporate compact city objectives into urban policy intensified. This in part reflected the changing political and economic circumstances at this time.
The influence of federal government urban policy initiatives upon state urban policy during the early to mid-1990s helps explain the intensification of interest in the compact city ideal and facilitated a high degree of cross-party and inter-jurisdictional consensus in favour of the compact city approach. The Better Cities Program exemplifies this approach.
2.1. The Better Cities Program: The Better Cities Program was the centrepiece of a revitalised, but relatively short-lived involvement by the federal Labor government in urban policy in the early-to-mid 1990s. Begun in 1991, its first phase was completed in 1997, with a second phase having been approved in the 1995 federal budget. The election of the Liberal-National Party Coalition in 1996 saw the program virtually wound up (Australian National Audit Office, 1996-97: 1).
The objectives of the program included accelerating inner-city growth, a reduction in demand for outer suburban development, the reduction of government expenditure on housing and urban infrastructure, improved utilisation of urban land and infrastructure, and ecological sustainability (Australian National Audit Office, 1996-97).
The Better Cities Program was not focused exclusively on inner-city redevelopment. Reflecting upon the evolution of the Program in 1995, Lyndsay Neilson, then Deputy Secretary of the Department of Housing and Regional Development, noted that the initial program, ‘…despite all the rhetoric around urban consolidation…’, was intended to include a fringe and an inner-city area in each of the major cities (Neilson, 1995: 4). Middle and outer-suburban locations that were targeted under the Better Cities Program included Werribee, Mill Park and Dandenong in Melbourne, and Blacktown and Parramatta in Sydney (Australian National Audit Office, 1996-97: 3).
5
The Program was very much a result of Left-Right factional dealing within the federal Labor Party, which saw senior left-wing faction member and urban consolidation advocate Brian Howe installed as Deputy Prime Minister. As such, the Better Cities Program represented an accommodation of Labor-left issues relating to social justice and environmental management to dry economic objectives including the reduction of the costs to government of urban development and the promotion of Australian cities as economically efficient and globally relevant (Lennon, 2000: 150-151). The program reflected the belief amongst left-wing elements of the federal Labor Party that social justice issues, including the issue of locational disadvantage could be integrated with free-market institutional-reform objectives, such as the rationalisation of state delivered community services, including health, education and transport (Australian National Audit Office, 1996-97: 2). In this view, a compact city would not only be more ‘just’, but more economically ‘efficient’. The degree to which the push for increased urban densities reflected the hope that traditional left social justice concerns could be harmonised with small government objectives is evident from the statement below, made by Brian Howe in 2001:
Some critics of the program saw it as being fundamentally about urban consolidation [see Troy, 1996]. I saw it as being much more about demonstrating the value of effective planning in the achievement of objectives to do with both economic efficiency and also superior social and environmental outcomes. (Howe, 2001, 39)
Reflecting this view, a diverse range of issues was targeted in the projects funded under the Better Cities Program, including infrastructure renewal, environmental works, improvement of rail and tram linkages, higher-density and affordable housing, and the development of new technologies (Australian National Audit Office, 1996-97: 3-4).
In retrospect, it is important to note that the link between low-density suburban fringe development and social disadvantage had not been empirically well substantiated when Howe embarked upon the Better Cities Program. Some commentators had claimed that suburban sprawl and the proliferation of job-remote, poorly serviced fringe locations was a key factor in explaining the spatial patterning of disadvantage. This line of thinking was politically appealing to Howe. Evidence of locational disadvantage on the suburban fringe would provide a social justice rationale for cost-cutting measures to maximise the utilisation of existing urban infrastructure and to curb the costs to government of metropolitan expansion. Nevertheless, work carried out by Chris Maher at Monash University (which had been sponsored by the federal government) interpreted metropolitan fringe areas quite differently. Maher argued that there was no evidence that the socially disadvantaged, in particular, were being channelled to urban fringe locations. In Maher’s view, people often made a calculated trade off between the inconvenience of distance and the perceived benefits of remoteness, such as abundant open space and lack of congestion. Maher’s findings were a setback for the Howe social justice/urban densification perspective. The findings suggested that the supposed link between locational and social disadvantage and suburban ‘sprawl’ was empirically tenuous and in part politically motivated. As Andrew Beer noted in 1994, the debate about locational disadvantage in the early 1990s had become ‘embroiled’ in the debates over the reform of infrastructure pricing and the need for a more dense urban form (Beer, 1994). This view is supported by Maher’s 1994 statement that:
The coincidence of locational disadvantage and social disadvantage has been assumed rather than demonstrated, seemingly in an attempt to bolster arguments about the need to alter the predominant form of urban growth – outward extension of low density suburbia. (Maher, 1994)
6
Despite these insights, Labor’s social justice agenda continued to be expressed in terms of achieving a more economically ‘efficient’ and socially just urban form through countering ‘sprawl’.
In 1994, Andrew Beer stressed that the various environmental, economic and social justice assumptions within urban policy needed ‘unpacking’, implying that the politicisation of urban policy stood in the way of a rational analysis of the distinct issues involved. He summed up the call to disentangle the components of the urban policy debate in the following terms:
The discussion of locational disadvantage and spatial inequality in Australia’s cities needs to be considered afresh. We need to unpack the arguments surrounding the structure of our cities and separate out those that are primarily concerned with housing preferences, those that relate to infrastructure pricing, and those that focus on the patterns of disadvantage and income. (Beer, 1994: 181)
As the following discussion indicates, in the decade since this debate took place, such ‘unpacking’ of the assumptions underpinning compact city policy has still not occurred.
2.2. The dominant compact city paradigms: ‘smart growth and ‘new urbanism’:
At this point, we outline the principal urban development perspectives that have directly influenced compact city policy in Australia during and since the 1990s. An examination of these perspectives further sheds light on the in-built assumptions of contemporary compact city policy, particularly in relation to the presumed social equity benefits of higher urban densities.
The shift in urban policy in Australia during the 1990s drew heavily upon similar urban policy developments overseas, particularly in the U.K. and U.S. Two distinct, but similar counter-‘sprawl’ perspectives that gained a strong following in the US, which have had their counter parts in the U.K. and European contexts, and which have significantly influenced the Australian policy debate, have found expression in ‘smart growth’ and ‘new urban’ movements. 2.2.1. Smart Growth: An explicit motivation for many urban density advocates has been to reassure an increasingly environmentally concerned population that continued economic growth is compatible with the achievement of sound environmental outcomes. Accordingly, U.S. smart growth advocates claim that, if managed properly, anti-sprawl measures would facilitate better environmental outcomes while not stifling economic growth. They emphasise that the smart growth approach stands to reduce growing community opposition to growth (Danielson, Lang, & Fulton, 1999: 514). They point to a coalition of interests which has formed around the objective of limiting suburban sprawl, including’…farmers, big-city mayors, some developers, and, …suburban voters who appear to be “fed up” with growth…’ (Danielson, Lang, & Fulton, 1999: 514) A range of measures is advocated to curb ‘sprawl’. These measures include mixed-land uses, enforced urban growth boundaries, reuse of existing infrastructure and land resources, an improved job/housing balance within localities, compact commercial districts, denser suburban subdivisions, infill housing, more efficient mass transit, and neighbourhoods with well-defined centres and edges (Danielson, Lang & Fulton, 1999: pp. 516-517).
2.2.2. New Urbanism: While sharing a great deal of common ground with the smart-growth perspective, the new-urban perspective is more heavily couched in reformist social ideals.
7
In the U.S., many new urban advocates have been inspired by an earlier, more pedestrian and communitarian mode of development. The social unit at the centre of their perspective is the neighbourhood, which, it is believed, provides the basis for both the social and economic well being of residents. It is therefore ostensibly a ‘traditionalist’ outlook. This revitalisation of community, it is argued, would be achieved through the creation of pedestrian, small-scale (and therefore space conserving) communities, with an emphasis upon the integration of public and private space, frequent face-to-face encounters, and a high level of local economic self-reliance. Such communities, it is expected, would be socially diverse, catering for a range of housing needs according to differences of income, age, and family type. A further expectation is that communities of this kind would be enduring.
In the U.K., the new urban goal of creating enduring, pedestrian, small-scale communities found expression in the ‘urban village’ ideal, an idea that embodies much the same set of goals as small town traditionalism in the U.S.
Urban policy in Australia during the 1990s has been strongly influenced by the urban village concept of facilitating small, face-to-face urban communities, reminiscent of the past and characterised by higher residential densities and strengthened community sentiment. The work of Newman and Kenworthy (1989) has been important in communicating these ideals.
2.3. The compact city ideal and ‘cultural reform’: The Urban Villages Project (UVP) provided a way for the new-urban perspectives then being refined in the U.S. and U.K. to be incorporated into Australian urban policy. It engaged several Victorian Government agencies (Energy Victoria, Environment Protection Authority, Department of Infrastructure, and Energy Research and Development Corporation, 1996). The urban village model was widely adopted in Australia during the 1990s. In Victoria, the model emerged from the Greenhouse Neighbourhood Project (GNP)(Loder and Bayly Consulting Group, 1993), jointly commissioned in 1992 by several Victorian Government agencies. The GNP project aimed to examine the possibilities for an improved relationship between urban form and energy conservation.
The extension of this early work into the Urban Villages Project (UVP) involved the incorporation of a social reform agenda, along with much of the new-urban discourse then being refined in the US and UK. The urban village concept thereby incorporated a concept of ‘sustainable’ urban form that in part supplanted earlier environmental and energy consumption concerns with a range of social and cultural reform considerations.
The UVP focused upon a number of selected sites, some of which were the local shopping centre nodes of established middle suburbs. However, the selection strategy did not make clear how many villages there needed to be, or whether spacing and size really mattered. The UVP appears to have been a precursor policy to Melbourne 2030 with its emphasis upon mixed-use ‘activity centres’. These centres closely resemble the urban village idea. The following statement illustrates this link.
Activity centres provide the focus for services, employment and social interaction in cities and towns. They are where people shop, work, meet, relax and live. Usually well-served by public transport, they range in size and intensity of use from local neighbourhood strip centres to traditional universities and major regional malls. They are not just shopping centres, they are multifunctional. (Department of Infrastructure, 2002)
8
In Melbourne 2030 the desired number of centres is enumerated, with just over 100 Principal, and Major Activity Centres distributed across metropolitan Melbourne. These, it is foreshadowed, will be in addition to the Central Activities District (the Melbourne central business district) and more than 900 small-scale Neighbourhood Activity Centres (Department of Infrastructure, 2002).
In the late 1990s, the local, small-scale focus and communitarian idealism of the urban village policy was modified through the Café Society concept for implementation in the Melbourne inner city. Much of the Café Society imagery, of a civic-commercial sphere based on conspicuous, street-level, see-and-be-seen life-style consumption, was subsequently incorporated as a dominant image into the Melbourne 2030 perspective (See Department of Infrastructure, 1998).
The UVP was imbued with new urban claims and justifications as it attempted to address the perceived problems of low-density sprawling suburbs. Citing the ills of ‘the prevailing pattern of suburban development in Australia’, including automobile reliance, remoteness from services and employment, high-energy use, poor air and water quality, and the downgrading of natural habitat, the report prescribed the ‘urban village’ as the ‘preferred form of development’ for the future (Energy Victoria, Environment Protection Authority, Department of Infrastructure, and Energy Research and Development Corporation, 1996). As a result of the inherent new urbanism of this approach, measures designed to address problems relating to energy use and environmental sustainability were often eclectically juxtaposed with prescriptions for social and cultural change.
It was expected that urban villages would provide ‘a range of dwelling types’ and ’a cross-section of people - families and single people of different ages’; ‘a high level of pedestrian amenity and surveillance’ and ’neighbourliness, but not too much of it’; ‘a mix of land uses…’and ’a harmonious but diverse architecture, with occasional buildings that stimulate as well as delight’/’a variety of residential, commercial and community uses and activities taking place around the clock’; and ’a range of lot sizes…’ with a ’clear…legible topography - disciplined, but not too much so’ (our emphasis). It was argued that areas which retained their economic values best had urban-village features and ‘…most important - have maintained a sense of place’ (UVP, 1996: 16)(Our emphases).
The advocacy of mixed land use environments within the UVP in part reflected the desire to integrate social/cultural reform with environmental sustainability and new forms of economic efficiency (UVP, 1996). Some UVP advocates felt that an increase in densities alone would not induce the desired social and cultural outcomes. Wendy Morris, a prominent urban designer with the Victorian Government in the early 1990s, felt that while new medium density building codes had facilitated “…more sustainable residential development…” they did ”…not address changes required to generate well-integrated mixed-use communities’ (Morris 1993)(Morris’ emphasis). The UVP, premised on nodes of mixed-use activity, was Morris’ solution to the perceived problem of augmenting higher densities with the generation of ‘community’.
Two additional, related factors, which provided significant impetus to the adoption of compact city policy during the 1990s were the shifting political climate, in favour of a greater reliance upon market forces, and the changing role of cities in an increasingly interdependent global economy. These are discussed in the following section.
9
2.4. Global Economic Relevance and the Changing Role of Cities:
The political climate underpinning urban planning formulations in Australia during the 1990s was shaped by market deregulation and a concern to make Australian society internationally relevant in a competitive global economy. In this context, two central concerns for urban planners were to reduce the costs to government of urban infrastructure provision and to free up inherited regulatory restraints upon business, including land-use zoning and residential-density controls.
This loosening of market restraints provided an opportunity for compact city advocates. Urban consolidation now could be equally supported by governments concerned to reduce the infrastructure costs of metropolitan growth and by those concerned to provide alternatives to the perceived social, cultural and environmental problems associated with suburban ‘sprawl’.
Compact city policies were given further impetus by the perception that cities played a crucial role in national economic success in a competitive global economy. Australian cities needed to become more efficient. Compact city policies, therefore, became increasingly associated with the creation of cities that would not only be economically efficient, but culturally vital with international appeal. From this perspective, low-density suburban form was stigmatised as anachronistic and costly. By contrast, central city areas became a new focus of high-density residential development and cultural revitalisation.
During the 1990s, a number of urban analysts argued that, because of the highly integrated nature of contemporary economies, some cities now perform a key command and control function that is essential to the operation of the global economic system.
Saskia Sassen, for instance, argues that the operation of the contemporary global economy, rather than dispersing the functions of power and command, relies upon a continued concentration of power, exercised through a ‘worldwide grid of strategic places’ for the servicing and financing of international trade and investment (Sassen, 1998).
...cities that are strategic sites in the global economy tend, in part, to become disconnected from their region and even nation... metropolitan business centers receive massive investments in real estate and telecommunications while low-income city areas are starved for resources...Highly educated workers in leading sectors see their incomes rise to unusually high levels whole low- or medium skilled workers in those same sectors see theirs sink... These trends are evident, with different levels of intensity, in a growing number of major cities in the developed world and increasingly in major cities of some of the developing countries... (Sassen, 1998: XXVI-XXVII)
Consistent with Sassen’s argument, the 1990s policy of promoting Melbourne as a city of international appeal has been associated with a policy focus on inner city high-density residential development and has contributed to the Core region becoming socially and economically distinctive and separate from the suburban hinterland.
The Federal Government’s view of the international role of cities was embraced by the Kennett Liberal Government in Victoria. One example of this is Creating Prosperity, a report prepared jointly in 1994 by the Victorian Government and the Melbourne City Council (Vic. Gov. & Melbourne City Council, 1994). Creating Prosperity provides an insight into the underlying priorities of the Victorian Government and sections of the
10
Victorian business establishment as to the contemporary role of Melbourne as a capital city, and the measures required to make Melbourne globally relevant.
Creating Prosperity was consistent with the priorities of the Federal Government’s Better Cities Program, which also aimed at making Australian cities attractive to internationally mobile persons with cutting-edge expertise in the knowledge-based service-sector industries.
(Vic. Gov. & Melbourne City Council, 1994: 2). The commitment to expanding Melbourne’s international role, in turn, helped shape a range of other concerns relating to the natural environment, the marketing of education to an international clientele, the provision of attractive retailing, and the staging of ‘world-class’ cultural and sporting events (Vic. Gov. & Melbourne City Council, 1994: 2). From this perspective, Melbourne needed to be a city “…that is exciting and welcoming to all people…” (Vic. Gov. & Melbourne City Council, 1994: 3) (Our emphasis).
With this policy, we gain some insight into the linkages between the advocacy of higher residential densities, greater urban efficiency, an emphasis upon cultural diversity and flexibility (including a diversity of housing types), and the pursuit of global market relevance.
The following statement by Neilson (then Deputy Secretary, Department of Housing and Regional Affairs) illustrates this view:
City residents help create City life and vitality. They stimulate a wide range of activities and ensure that the City is alive after business hours, as well as supporting business and services. In turn, the City is strengthened as a place for business by the increasing availability of a wide choice of housing. (Neilson, 1995: 33)
By 1998, the idea that inner Melbourne could be given international appeal, in part through compact inner city residential development was encapsulated under the rubric of the ‘café society’. The idea of the ‘café society’ was presented in an influential policy discussion paper called From Doughnut City to Café Society, published by the Victorian Department of Infrastructure. The authors posit a booming rejuvenation of the Melbourne inner city, led by a ‘new style of immigration from the suburbs’ (Department of Infrastructure, 1998: 1). The paper further argued that this residential development of inner Melbourne had reversed an historical decline in, or hollowing out of, the inner city population. Allegedly, this economic shift had given rise to a wave of demographic and cultural change that, in turn, had engendered divergent lifestyles and a greater multiplicity of residential and spatial needs that are inconsistent with established suburban forms. It envisages a shift in the organisation of production, society and culture that is antithetical to the isolated and independent households of traditional suburbia to new interdependent higher density households clustered around the inner city, where residents make great use of the local cafes and other life-style
11
3. POPULATION PRESSURE, METROPOLITAN DOMINANCE AND COMPACT CITY POLICY
Another factor, which has prompted a note of urgency to compact city policies, particularly in Sydney and Melbourne is the rate of population growth that these cities have had to cope with during the 1990s. In the preceding decade, the non-metropolitan areas of New South Wales and Victoria had grown faster than their respective metropolises. This was partly due to significant net intra-state losses from both Sydney and Melbourne through internal migration. This pattern has been reversed in the 1990s. Both Sydney and Melbourne have been growing faster than their respective hinterlands. This outcome is partly a consequence of job growth, particularly in the business services sector, which has been associated with the globalisation of Australia’s economy. Much of the job growth in question has been concentrated in Sydney and Melbourne (Juriedini and Healy, 1998; Birrell and O’Connor, 2000) In addition, there has been an increase in the overseas migration intake, nearly two-thirds of which is locating the Sydney and Melbourne.
These demographic developments have underpinned high rates of growth in metropolitan housing demand.
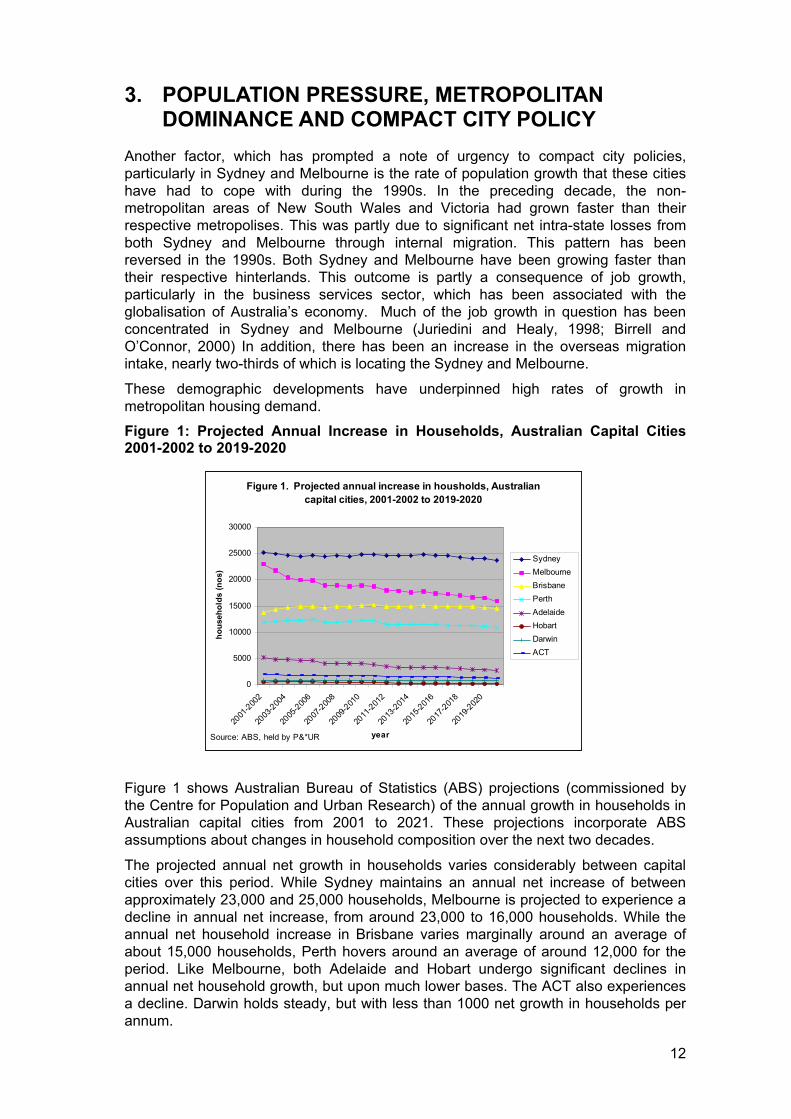
Figure 1: Projected Annual Increase in Households, Australian Capital Cities 2001-2002 to 2019-2020
Figure 1. Projected annual increase in housholds, Australian capital cities, 2001-2002 to 2019-2020
0
5000
10000
15000
20000
25000
30000
2001
-2002
2003
-2004
2005
-2006
2007
-2008
2009
-2010
2011
-2012
2013
-2014
2015
-2016
2017
-2018
2019
-2020
year
hous
ehol
ds (n
os)
Sydney Melbourne Brisbane Perth Adelaide Hobart Darwin ACT
Source: ABS, held by P&*UR
Figure 1 shows Australian Bureau of Statistics (ABS) projections (commissioned by the Centre for Population and Urban Research) of the annual growth in households in Australian capital cities from 2001 to 2021. These projections incorporate ABS assumptions about changes in household composition over the next two decades.
The projected annual net growth in households varies considerably between capital cities over this period. While Sydney maintains an annual net increase of between approximately 23,000 and 25,000 households, Melbourne is projected to experience a decline in annual net increase, from around 23,000 to 16,000 households. While the annual net household increase in Brisbane varies marginally around an average of about 15,000 households, Perth hovers around an average of around 12,000 for the period. Like Melbourne, both Adelaide and Hobart undergo significant declines in annual net household growth, but upon much lower bases. The ACT also experiences a decline. Darwin holds steady, but with less than 1000 net growth in households per annum.
12
These projected household growth numbers present varying challenges to planning authorities in the respective cities, depending upon their capacity to accommodate additional urban development. All, however, have incorporated some elements of the compact city approach into their planning. We regard this outcome as reflective of the influence of these ideas in city planning circles in Australia.
3.1. Sydney: The above data suggest that household growth pressures are particularly acute in Sydney. The main problem is that the city faces severe supply side constraints. These constraints include a shortage of available land for continued suburban expansion, partly due to the proximity of the Blue Mountains to the west of Sydney and a number of national parks on the city’s outskirts. The proximity of the Nepean/Hawkesbury River (the headwaters of which are the main source of water for Sydney) to urban fringe areas means that stringent anti-pollution measures are required for any new development. This adds significantly to the cost of suburban frontier development, as does the NSW government’s policy of charging property developers the full cost of infrastructure provision in new areas (including major roads, open space and other amenities) (Birrell and Healy, 2003: 51).
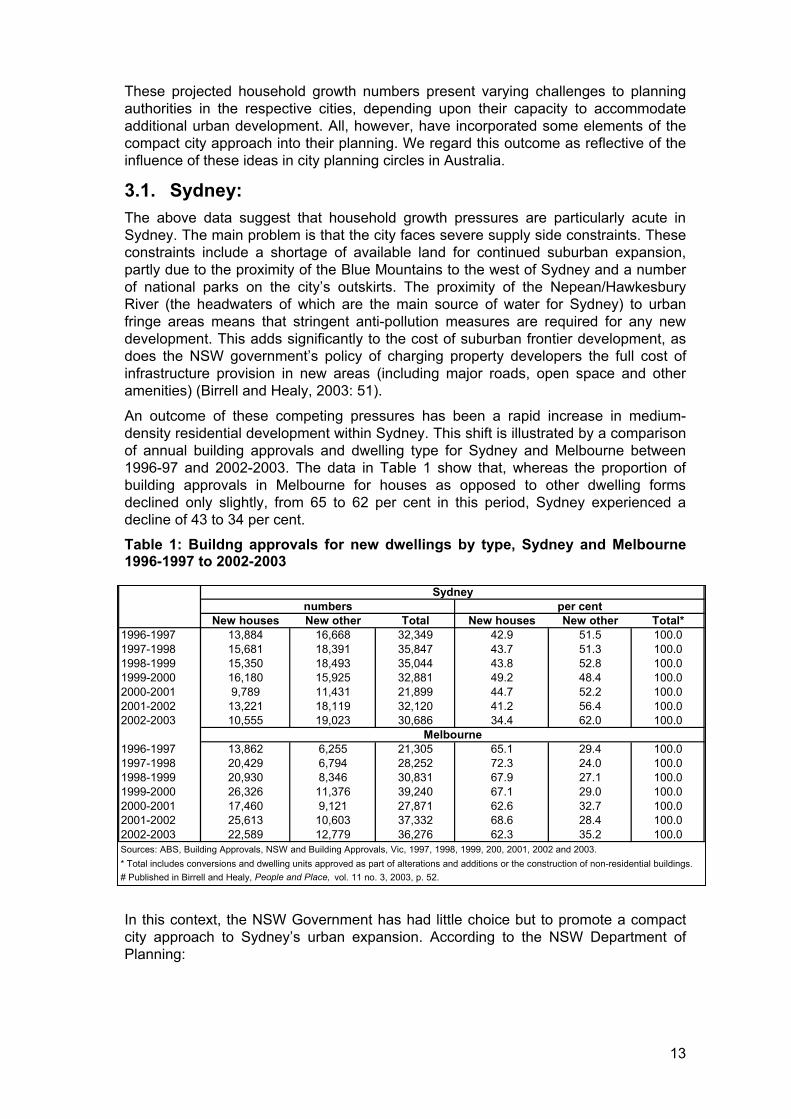
An outcome of these competing pressures has been a rapid increase in medium-density residential development within Sydney. This shift is illustrated by a comparison of annual building approvals and dwelling type for Sydney and Melbourne between 1996-97 and 2002-2003. The data in Table 1 show that, whereas the proportion of building approvals in Melbourne for houses as opposed to other dwelling forms declined only slightly, from 65 to 62 per cent in this period, Sydney experienced a decline of 43 to 34 per cent.
Table 1: Buildng approvals for new dwellings by type, Sydney and Melbourne 1996-1997 to 2002-2003
Sydneynumbers per cent
New houses New other Total New houses New other Total*1996-1997 13,884 16,668 32,349 42.9 51.5 100.01997-1998 15,681 18,391 35,847 43.7 51.3 100.01998-1999 15,350 18,493 35,044 43.8 52.8 100.01999-2000 16,180 15,925 32,881 49.2 48.4 100.02000-2001 9,789 11,431 21,899 44.7 52.2 100.02001-2002 13,221 18,119 32,120 41.2 56.4 100.02002-2003 10,555 19,023 30,686 34.4 62.0 100.0
Melbourne1996-1997 13,862 6,255 21,305 65.1 29.4 100.01997-1998 20,429 6,794 28,252 72.3 24.0 100.01998-1999 20,930 8,346 30,831 67.9 27.1 100.01999-2000 26,326 11,376 39,240 67.1 29.0 100.02000-2001 17,460 9,121 27,871 62.6 32.7 100.02001-2002 25,613 10,603 37,332 68.6 28.4 100.02002-2003 22,589 12,779 36,276 62.3 35.2 100.0Sources: ABS, Building Approvals, NSW and Building Approvals, Vic, 1997, 1998, 1999, 200, 2001, 2002 and 2003.* Total includes conversions and dwelling units approved as part of alterations and additions or the construction of non-residential buildings.# Published in Birrell and Healy, People and Place, vol. 11 no. 3, 2003, p. 52.
In this context, the NSW Government has had little choice but to promote a compact city approach to Sydney’s urban expansion. According to the NSW Department of Planning:
13
To accommodate new homes, the choice between low density or more compact cities is clear. Rapidly expanding outer suburban areas will have dire environmental, social and financial consequences. Containing expansion is more sustainable and coincides with people’s needs for a greater variety of housing and better access to jobs and services. (NSW Department of Planning, 1998: 6)
Though the government has not had much choice other than to pursue a compact city approach, as this quotation suggests, some planners believe it will have positive consequences. The document goers on to claim that the compact city strategy will provide sufficient and affordable housing, greater choice of housing types to better match people’s needs, better environmental outcomes, greater ‘equity’ through the provision of ‘safe and pleasant places to live’, better access between jobs and homes and better access to public transport. This clutch of laudable economic, social and environmental outcomes is underpinned by a belief in the efficacy of ‘good urban design’ (NSW Department of Planning, 1998: 16, 18).
Of particular relevance for the focus of this research is the belief that compact city policy will deliver social equity outcomes, including affordable housing. For example, a key planning principle in the NSW government’s ‘Shaping Our Cities Document’ states that State agencies and local governments will:
Manage the supply of new and redeveloped housing so as to create a compact urban structure with choice in home type and affordability throughout each or our cities. (NSW Department of Planning, 1998: 8)
3.2. Melbourne: In 2002, the Victorian Labor Government released its Melbourne 2030 planning policy, which advocated the need to increase residential densities across the Melbourne metropolitan area. According to the policy document, the expected population increase over the coming 30-year period (possibly 1 million persons) (Department of Infrastructure, 2002: 8), together with the demographic impact of the shift to smaller households (implying an additional 620,000 households) (Department of Infrastructure, 2002: 8) would necessitate a departure from the conventional low-density urban form that had underpinned metropolitan expansion throughout the post-war period. The government argues that, if environmental sustainability is to be realised, and future urban infrastructure costs curtailed, a less automobile dependent, more localised and higher-density urban form, and lifestyle, has to be implemented on a metropolitan-wide scale.
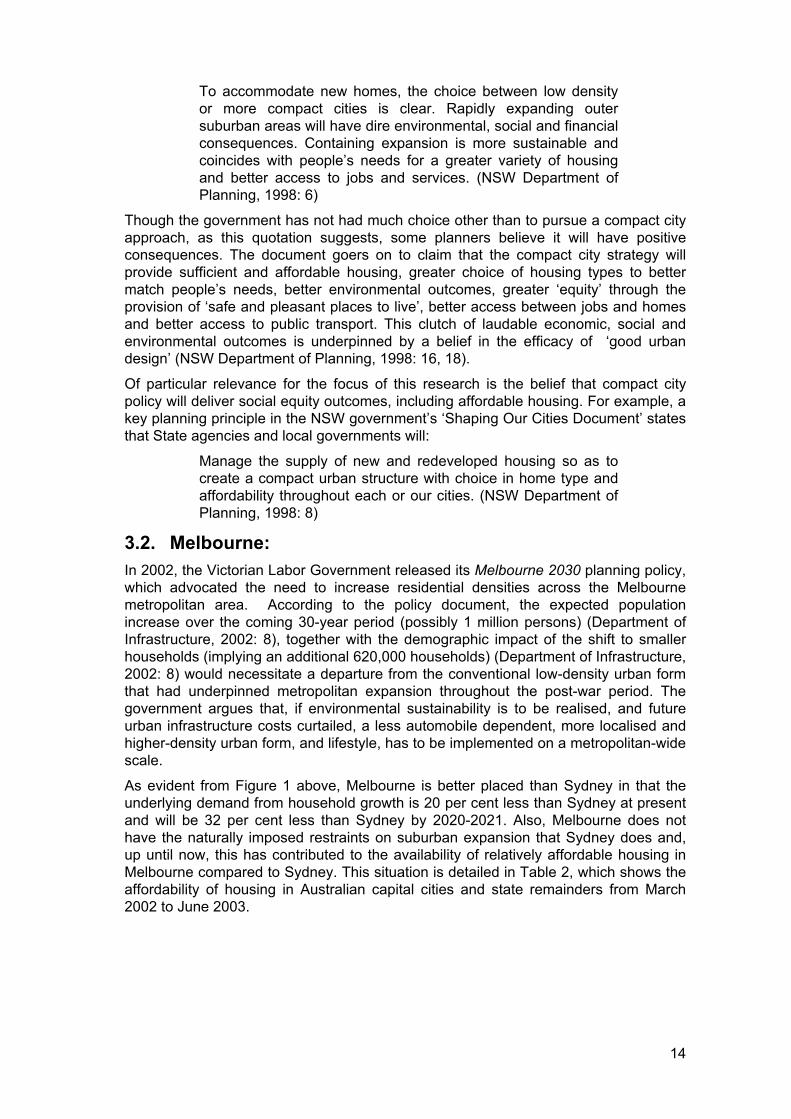
As evident from Figure 1 above, Melbourne is better placed than Sydney in that the underlying demand from household growth is 20 per cent less than Sydney at present and will be 32 per cent less than Sydney by 2020-2021. Also, Melbourne does not have the naturally imposed restraints on suburban expansion that Sydney does and, up until now, this has contributed to the availability of relatively affordable housing in Melbourne compared to Sydney. This situation is detailed in Table 2, which shows the affordability of housing in Australian capital cities and state remainders from March 2002 to June 2003.
14
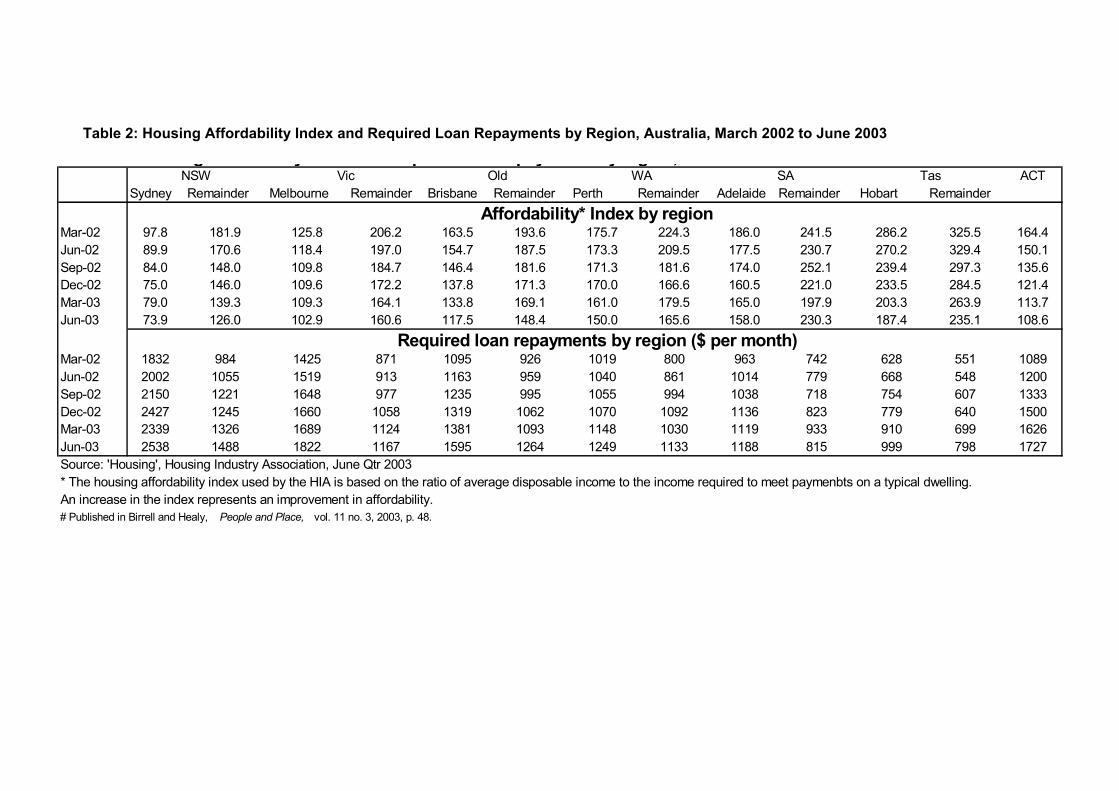
Table 2: Housing Affordability Index and Required Loan Repayments by Region, Australia, March 2002 to June 2003 g y q p y y g ,
NSW Vic Old WA SA Tas ACT Sydney Remainder Melbourne Remainder Brisbane Remainder Perth Remainder Adelaide Remainder Hobart Remainder
Affordability* Index by regionMar-02 97.8 181.9 125.8 206.2 163.5 193.6 175.7 224.3 186.0 241.5 286.2 325.5 164.4 Jun-02 89.9 170.6 118.4 197.0 154.7 187.5 173.3 209.5 177.5 230.7 270.2 329.4 150.1 Sep-02 84.0 148.0 109.8 184.7 146.4 181.6 171.3 181.6 174.0 252.1 239.4 297.3 135.6 Dec-02 75.0 146.0 109.6 172.2 137.8 171.3 170.0 166.6 160.5 221.0 233.5 284.5 121.4 Mar-03 79.0 139.3 109.3 164.1 133.8 169.1 161.0 179.5 165.0 197.9 203.3 263.9 113.7 Jun-03 73.9 126.0 102.9 160.6 117.5 148.4 150.0 165.6 158.0 230.3 187.4 235.1 108.6
Required loan repayments by region ($ per month)Mar-02 1832 984 1425 871 1095 926 1019 800 963 742 628 551 1089 Jun-02 2002 1055 1519 913 1163 959 1040 861 1014 779 668 548 1200 Sep-02 2150 1221 1648 977 1235 995 1055 994 1038 718 754 607 1333 Dec-02 2427 1245 1660 1058 1319 1062 1070 1092 1136 823 779 640 1500 Mar-03 2339 1326 1689 1124 1381 1093 1148 1030 1119 933 910 699 1626 Jun-03 2538 1488 1822 1167 1595 1264 1249 1133 1188 815 999 798 1727 Source: 'Housing', Housing Industry Association, June Qtr 2003* The housing affordability index used by the HIA is based on the ratio of average disposable income to the income required to meet paymenbts on a typical dwelling. An increase in the index represents an improvement in affordability.# Published in Birrell and Healy, People and Place, vol. 11 no. 3, 2003, p. 48.
Nonetheless, because of the environmental and infrastructure cost concerns mentioned above, the Victorian Government has decided to curb fringe settlement. Under Melbourne 2030, the prescribed interim UGB will provide for only 31 per cent of the predicted new dwelling demand generated in the 2001-2030 period to be met in fringe locations. Instead, it is expected that the greater part of new dwelling demand will be met in principal and major ‘activity centres’ in established suburban areas. These are expected to provide 41 per cent of the additional dwellings needed in Melbourne between 2001 and 2030, compared with 24 per cent in the 1996-1997 to 2000-2001 period.
3.3. Brisbane: Population growth pressures also posed a challenge to established state and local government urban planning provisions in Queensland by the end of the 1990s. By 2003-2004, the Queensland Minister for Local Government and Planning described the planning context as one of ‘rapid and continual change’ (Queensland Government, State Budge 2003-2004, Ministerial Portfolio Statement, 2003), with Queensland’s major cities and towns expected to absorb most of the state’s predicted population growth of almost one million people over the next decade (Queensland Department of Local Government and Planning, 2003). By the late 1990s, the conflicting land-use demands of different community ‘stakeholders’ and the lack of consistency in local government planning responses to developmental pressures, had led the Queensland Government to assert a greater level of control over local government planning decisions through the Integrated Planning Act 1997 (IPA). The stated aim of the Act was to ‘provide a platform that underpins the management of growth and sustainable development in the State’ (Queensland Government, State Budget 2003-04, Ministerial Portfolio Statement, 2003: 1). While local communities were ‘crying out for more open space’, greater control over foreshore development, and the protection of agricultural land, they were up against ‘developer-driven litigation’. Some local governments had gone so far as to call for a limit to population growth (Queensland Department of Local Government and Planning, 2003: 4). The state government believed that greater uniformity in local planning decisions, as well as certainty for developers and community interests would be achieved through curtailing the right of local governments to plan for their own areas.
As a result, during the 1990s, urban planning challenges arising from rapid population growth and the associated escalation in housing demand became particularly evident within the city of Brisbane. A 2003 Queensland Government study of available land for residential development within the Brisbane Statistical Division concluded that suitable broad hectare stocks within Brisbane were diminishing so rapidly that, on the basis of current development trends, ‘…land for residential development is likely to be exhausted by 2012’ (Queensland Department of Local Government and Planning, 2003). A key conclusion of the study was that new residential strategies would be required to meet future population growth, involving a shift from large-scale master-planned subdivisions to infill development and smaller-scale subdivisions. Achieving higher densities in appropriate locations would become a priority (Queensland Department of Local Government and Planning, 2003). The current redevelopment of a Brisbane inner-city defence force site into the Kelvin Grove Urban Village, incorporating tertiary education, residential, leisure and business activities, reflects the land scarcity issue, as well as a desire to achieve a higher level of integration between residential, commercial and employment activities.
3.4. Perth: As will be discussed further below, the incorporation of such mixed-use prescriptions for the achievement of greater economy in urban land use often denotes a concept of ‘sustainable’ urban development that extends beyond issues relating to the efficient use of space and environmental responsibility to include ‘cultural’ reform. This tendency is characteristic of the urban policy approach adopted in Western Australia during the 1990s.
For instance, the Premier of Western Australia, Geoff Gallop, in 2001, propounded an urban planning perspective, which linked the issues of population growth, infrastructure costs related to suburban expansion, automobile dependency, long home-work travel distances, greenhouse gas emissions, energy consumption, and deteriorating ‘sense of community’ (Gallop, 2001). From Gallop’s perspective, the rectification of economic and efficiency deficiencies inherent in traditional low-density urban planning practices is linked to the goal of restoration of ‘community’. He argues that the ‘human face of our suburbs’ had been lost through the process of urban sprawl, through auto-dependency (Gallop, 2001: 2-3). This loss of community is symbolised by the replacement of the ‘corner shop’ with ‘major shopping centres surrounded by bitumen and car parks’ (Gallop, 2001: 2-3). The solution lay in creating less wasteful, more people friendly suburbs with local employment opportunities and which facilitate socialisation and recreation. The emphasis, instead, should be upon the creation of walkable neighbourhoods with access to work, shopping areas, community services, recreation resources and education via ‘proximity’ rather than through ‘mobility’ (Gallop, 2001: 3-4). Therefore, the use of urban design principles that integrate business, community facilities and housing is the key to the problems thrown up by traditional low-density suburbia (Gallop, 2001: 5).
The Gallop Government’s perspective was strongly influenced by the views of Professor Peter Newman, who advocates a concept of ‘sustainability’ premised on a variety of ‘third way’ politics. Newman envisages the harmonisation of green, social justice and economic development objectives through community ‘partnerships’, rather than ‘paternalistic’ governance (Newman, 2001).
4. RESEARCH ISSUES: In this section, we outline emerging criticisms of compact city policy that have arisen from its application overseas and in Australia. These criticisms are important in that they are not confined to criticism at the conceptual level, but indicate the sorts of problems that can arise in practice. It is this criticism of compact city policy in its practical application that provides a basis for our research questions. A central theme in the criticisms considered below is that the social equity gains frequently associated with compact city policy, particularly in relation to the provision of affordable housing and harmonious, socially mixed communities, may be difficult to achieve in practice.
4.1. Emerging uncertainties about urban consolidation: The focus on compact city policy in Australia during the 1990s reflected similar urban policy developments overseas, particularly in the U.K. and U.S. Both in Australia and overseas, however, some critics of urban densification emphasised the lack of empirical evidence in support of the policy shift. Commenting upon urban policy developments in UK, urban policy analyst Michael Breheny (1995) observed that, although there had been a ‘…remarkable and rapid academic and political adoption of the idea…’ of the compact city, the fundamental question of whether radical consolidation policies could realistically be implemented, given the forces of decentralisation, remained virtually unasked (Breheny, 1995: 87). In his view, the claims for and against the growth of low-density suburbanisation often had been subjective and ideological with non-existent or only selective empirical support. Breheny (1995: 81) further suggests that this remarkable consensus amongst western countries, including the European Union, in favour of compact city policies was in part due to the very lack of sound academic evidence to link such an urban strategy to expected (and intellectually fashionable) outcomes (Breheny, 1995: 81).
Troy (1992), argues that such compact city policies have been adopted in Australia largely “…without translation or interpretation…’. Similarly, McLoughlin (1991) has pointed to the possibility that the claimed social and cultural benefits of urban densification may have been used as a rhetorical device to legitimise the attempts of governments to deal with fiscal crises relating to the costs of urban infrastructure. McLoughlin further noted that a significant body of literature, which showed that increased urban densities would not lead to significant savings in land use, was ignored by the Victorian government and ministerial advisors as they pursued higher densities in the early 1990s (McLoughlin, 1991:150).
As a result, many of the problems that have been highlighted in debates over the smart growth and new urban perspectives in the U.K. and U.S. appear to have been incorporated into Australian compact city policy initiatives during the 1990s without being resolved.
As these comments indicate, when the Bracks Labor Government in Victoria launched the Melbourne 2030 policy in October 2002, there was already scepticism about the benefits of the compact city approach. These doubts go beyond academic critics or the Save Our Suburbs organisations. They also include concern at the local government level. While state governments pushed ahead with urban consolidation policies after the demise of the Federal Labor Government and the influence of Brian Howe:
There has been growing criticism across Australia, both within the policy and academic community, that consolidation policy is not achieving its aims… and that it can be too readily appropriated as a “panacea for urban problems” … (Bunker et al., 2002: 144)
In particular, the Australian and overseas experience of compact city policy raises questions as to the credibility of the social equity claims of compact city advocates, particularly regarding the provision of affordable housing and the creation of socially mixed neighbourhoods.
Though it stresses the need to provide affordable housing, Melbourne 2030 does not address how the objectives of increased densities and socially mixed neighbourhoods with an adequate provision of affordable housing can be reconciled with a metropolitan environment where the tendency is towards greater spatial inequality.
The U.S. experience provides some insight into the difficulties of reconciling these goals. Citing attitudinal survey results, Danielson, Lang and Fulton (1999) conclude that, although there appears to be an interest in alternative suburban design principles in the U.S., this receptivity is overshadowed by the political reality of socio-economic ranking between neighbourhoods in the US.
When people buy a house, they also buy a place. Consumers currently associate low-density housing with a bundle of desirable community characteristics such as good schools, low crime, and moderate taxes…Thus large-lot zoning requirements are the result not only of market preferences but also of local political pressure to maintain an area’s exclusivity. Altering lot sizes therefore requires a change in the political climate even if it conforms to market reality. (Danielson, Lang, & Fulton, 1999: 522)
Although the link between residential location and socio-economic status or life chances may not be as acute in Australian cities as it is in the U.S., the idea that high urban densities, combined with the employment of community-inducing design principles will result in a paradigm shift to socially-mixed neighbourhoods may be problematic. Because those who live in the most affluent suburbs may be better able to resist the impact of a compact city policy, some of the greatest increases in density may consequently occur in lower to middle socio-economic areas, and thus lead to negative evaluations of the housing in question. If this were to happen, then smart growth policies may exacerbate the processes of spatial inequality.
An example of this process in Melbourne is indicated in the review of the Victorian Kennett Government higher-density residential building codes in 2002. The review noted that the application of higher residential densities within Melbourne was spatially selective, with some wealthier areas better able to protect the existing character of their housing (Department of Infrastructure, April 2000: 23). The review advocated that local governments be required to incorporate within their respective planning schemes areas of maximum and minimum density change. Some municipalities had already adopted this approach and the review considered that the meaning of these designations ought to be understood in relative terms:
…the City of Boroondara noted that ‘rate of change’ is a relative concept. What is significant change in a municipality like Boroondara is likely to be different to significant change in Port Phillip or Frankston. (Department of Infrastructure, April 2000: 23)
This shift in approach appears in part to have resulted from the success of the Save Our Suburbs movement in partially insulating affluent inner suburbs from the impact of higher urban densities.
Emily Talen (1999) raises a related issue. She argues that the new urban goal for a neighbourhood-orientated lifestyle appears to be odds with the preference for the geographically unconstrained interactions enjoyed by the more affluent sections of society. She suggests that persons with the widest range of economic choice are less attached to their neighbourhoods than the less affluent (Talen, 1999: 1373).
Another criticism of new urbanism that has emerged in the U.S. concerns the superficiality with which new urban ideals have been executed. Marshall (2001), for example, argues that the new urbanism in the U.S. has merely become another way of selling houses -- a superficial repackaging of existing suburban form. As such, he labels the new urbanism a ‘grand fraud’ (Marshall, 2001: 1). He also challenges the inherent architectural determinism of the new urbanism, arguing that cities are shaped by historically specific economic and social forces, which cannot be replicated through a simple copying of the architectural layout of an earlier period. Far from overcoming the class-segregated character of U.S. suburban life, he further argues that new urban developments have tended to be exclusive, sometimes gated and often low-density (Marshall, 2001).
Similar scepticism about the prospects of new urban developments delivering mixed neighbourhoods with affordable housing is emerging in Australia. For instance, it has been argued that a significant gap exists between expectations and outcomes for the East Perth urban village project (noted above), which was instigated in 1992 under the Better Cities Program. When 75 per cent complete in 2001, the project was being promoted as a ‘world class 21st century urban village’, providing for a ‘diverse range of people’ with ‘mixed residential developments and affordable housing’ (Morgan, 2001).i By 2003, however, the project was being criticised as having largely failed to meet its social equity objectives, particularly in the provision of ‘affordable housing’ (Crawford, 2003). Whereas the original concept flagged a minimum of one-third public housing, the completed project only provided 56 public or social housing units, less than 4 per cent of the total dwellings (Crawford, 2003: 84-85). The author concluded that the authority, which managed the project considered the provision of a significant proportion of ‘affordable’ housing unconducive to attracting private investment (Crawford, 2003: 90). University academic and compact city advocate, Jeff Kenworthy concedes this outcome for the East Perth development. He states that, while East Perth is a good example of a mixed use, compact suburb, ‘which can break away from the city’s traditional dependence upon the car’, it is ‘priced well beyond most people’ (The West Australian, Sept 24, 2003).
Recent overseas research leaves open the degree to which increased residential densities will facilitate a greater sense of community and social equity. Parkes et al. (2002) used 1997/98 survey data based on responses from 20,000 households to examine how socio-demographic characteristics, area type and subjective neighbourhood attributes can influence levels of neighbourhood dissatisfaction. The authors’ question some of the key assumptions of higher-density residential policy in the U.K., in particular the assumption that higher residential densities can be used as a means of recovering urban vitality (Parkes et al., 2002: 2434). The authors therefore conclude that the assumed benefits of higher residential densities should be subject to greater scrutiny (Parkes et al., 2002: 2434).
These commentaries indicate that some urban consolidation measures may exacerbate rather than diminish spatial polarisation.
4.1.1. Implications of an urban growth boundary The smart growth perspective often promotes urban growth boundaries (UGBs) to contain urban ‘sprawl’ and they have been attempted within the U.S. in various forms. Such boundaries might take the form of a defined limit beyond which growth is not permitted; the suspension of development in selected areas for specified periods; or control over the extension of basic suburban services and infrastructure to selected areas (Danielson, Lang, & Fulton, 1999: 527). There is a risk that, in some circumstances, the imposition of UGBs will create market pressures, which have undesirable social equity outcomes. Limiting the supply of land when there is upward market pressure on land prices would not be conducive to the supply of affordable housing even when land is zoned for multi-family housing (normally a cheaper housing option in the US (Danielson, Lang, & Fulton, 1999: 529). Easterbrook (1999) cites the example of Portland, Oregon, where spatial restrictions on fringe development have been imposed. Here, he argues, high housing demand has pushed multi-family housing up market (despite an underlying preference for low-density detached housing) (Easterbrook, 1999: p. 545). In Portland, this has led in turn to a leap frog effect, where persons wishing to work in Portland, but who are priced out, live a considerable distance beyond the UGB and commute considerable distances between home and workplace.
The use of UGBs in a high population growth context, as in Melbourne or Sydney, may contribute to housing affordability difficulties. Preliminary feedback from municipal officers of the City of Casey on Melbourne’s Eastern fringe points in this direction. In expectation of the imposition of the Melbourne UGB, developers are reportedly scrambling for new land in Casey, which has significantly driven up the price of broad acre land prior to subdivision. Similarly, the City of Whittlesea in Melbourne’s north, in its submission to the Productivity Commission Public Inquiry on First Home Ownership, in 2003, argued that the imposition of the Melbourne 2030 UGB had lead to speculative inflation of broad acre residential land prices within the municipality:
Council has been aware that in the 12 months since the Urban Growth Boundary was established in October of 2002 the value of land has increased by $150,000 per hectare. Developers are prepared to spend substantial amounts of money to ensure their supply of developable land into the future with the additional costs passed onto the future home purchasers. (City of Whittlesea, 2003: 13)
One example cited is of a developer, in 2003, buying lower quality land in the North Epping growth area for $350,000 per hectare (City of Whittlesea, 2003: 13).
4.2. Spatial polarisation and the metropolitan fringe: Just as there are implications of high-density development for equitable access to housing in established suburban areas, so too are there also implications from Melbourne 2030 policies for equitable housing on the fringe.
As noted above, differences between urban policy analysts concerning how to measure and explain the spatial patterning of disadvantage within Australian cities came to the fore in the early 1990s. Some commentators focused on the affects of suburban sprawl and the proliferation of job-remote, poorly serviced fringe locations as a principal factor in explaining the spatial patterning of locational disadvantage (See Howe, 1992). As indicated above, this line of thinking was in keeping with the assumptions of the Federal Government under the influence of Labor Deputy Prime Minister, Brian Howe who, by the early 1990s, had included locational disadvantage as a focus of the federal Labor government’s social justice strategy. Chris Maher, to the
contrary, argued that there was no evidence that those living on the fringe were particularly disadvantaged (see Beer, 1994; Maher, 1994).
Other analysts looked to the impact of economic restructuring to explain increasingly localised concentrations of labour market disadvantage, especially the decline of manufacturing employment. For example, Gregory and Hunter (1996) showed that over the period 1971 to 1991 there was a sharp spatial polarisation between rich and poor in urban areas. They further suggested that this process was linked to a substantial loss of manufacturing employment, in that areas where job loss was highest tended to become marked by high concentrations of the lower income residents (Gregory & Hunter, 1996). This explanation, however, did not sufficiently acknowledge the role of residential mobility in the concentration of disadvantage.
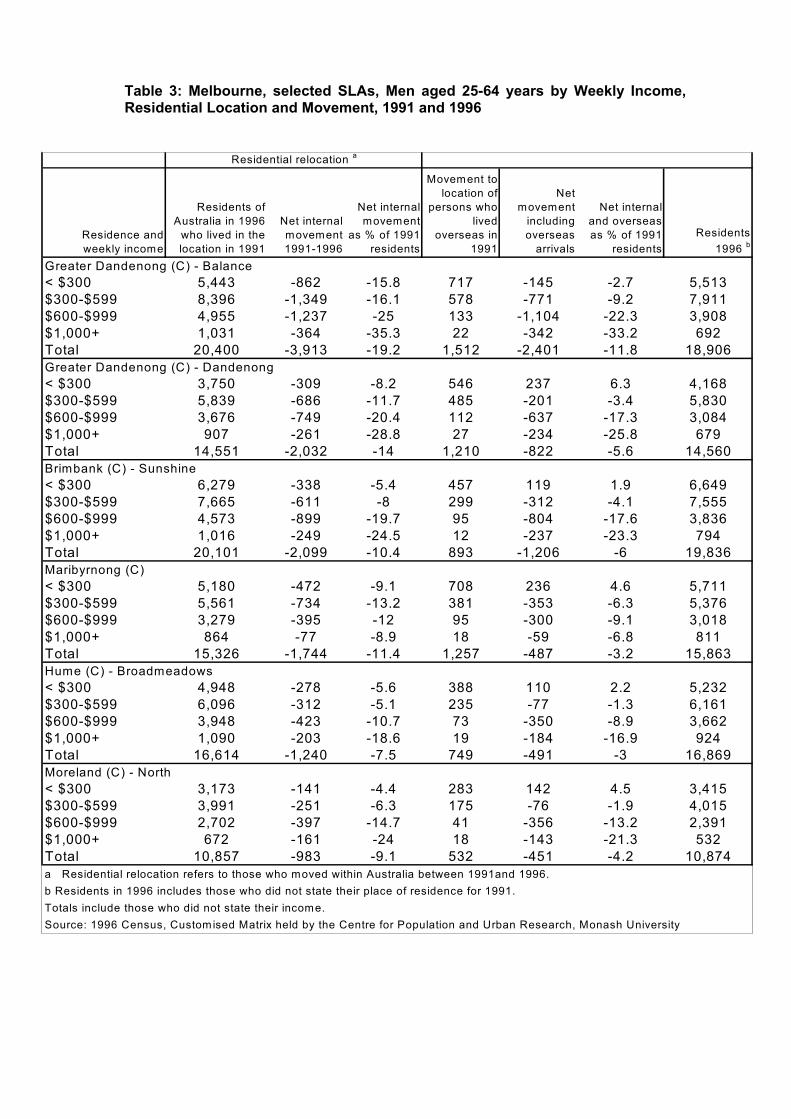
Table 3: Melbourne, selected SLAs, Men aged 25-64 years by Weekly Income, Residential Location and Movement, 1991 and 1996
Residential relocation a
Residence and weekly income
Residents of Australia in 1996
who lived in the location in 1991
Net internal movement 1991-1996
Net internal movement
as % of 1991 residents
Movement to location of
persons who lived
overseas in 1991
Net movement
including overseas
arrivals
Net internal and overseas as % of 1991
residentsResidents
1996 b
Greater Dandenong (C) - Balance< $300 5,443 -862 -15.8 717 -145 -2.7 5,513$300-$599 8,396 -1,349 -16.1 578 -771 -9.2 7,911$600-$999 4,955 -1,237 -25 133 -1,104 -22.3 3,908$1,000+ 1,031 -364 -35.3 22 -342 -33.2 692Total 20,400 -3,913 -19.2 1,512 -2,401 -11.8 18,906Greater Dandenong (C) - Dandenong< $300 3,750 -309 -8.2 546 237 6.3 4,168$300-$599 5,839 -686 -11.7 485 -201 -3.4 5,830$600-$999 3,676 -749 -20.4 112 -637 -17.3 3,084$1,000+ 907 -261 -28.8 27 -234 -25.8 679Total 14,551 -2,032 -14 1,210 -822 -5.6 14,560Brimbank (C) - Sunshine< $300 6,279 -338 -5.4 457 119 1.9 6,649$300-$599 7,665 -611 -8 299 -312 -4.1 7,555$600-$999 4,573 -899 -19.7 95 -804 -17.6 3,836$1,000+ 1,016 -249 -24.5 12 -237 -23.3 794Total 20,101 -2,099 -10.4 893 -1,206 -6 19,836Maribyrnong (C)< $300 5,180 -472 -9.1 708 236 4.6 5,711$300-$599 5,561 -734 -13.2 381 -353 -6.3 5,376$600-$999 3,279 -395 -12 95 -300 -9.1 3,018$1,000+ 864 -77 -8.9 18 -59 -6.8 811Total 15,326 -1,744 -11.4 1,257 -487 -3.2 15,863Hume (C) - Broadmeadows< $300 4,948 -278 -5.6 388 110 2.2 5,232$300-$599 6,096 -312 -5.1 235 -77 -1.3 6,161$600-$999 3,948 -423 -10.7 73 -350 -8.9 3,662$1,000+ 1,090 -203 -18.6 19 -184 -16.9 924Total 16,614 -1,240 -7.5 749 -491 -3 16,869Moreland (C) - North< $300 3,173 -141 -4.4 283 142 4.5 3,415$300-$599 3,991 -251 -6.3 175 -76 -1.9 4,015$600-$999 2,702 -397 -14.7 41 -356 -13.2 2,391$1,000+ 672 -161 -24 18 -143 -21.3 532Total 10,857 -983 -9.1 532 -451 -4.2 10,874a Residential relocation refers to those who moved within Australia between 1991and 1996.b Residents in 1996 includes those who did not state their place of residence for 1991.Totals include those who did not state their income.Source: 1996 Census, Customised Matrix held by the Centre for Population and Urban Research, Monash University
A number of analyses since the 1996 Census have also addressed the issue of growing spatial concentrations of poor persons within Australia’s major capital cities -- Melbourne and Sydney (Viviani, 1997; Healy 1997; Healy 1998; Birrell, and Byung-Soo Seol, 1998; Birrell, O’Connor and Rapson, 1999; Birrell, 1999; and Baum et al. 2000). Consistent with Maher’s analysis, but critical of the explanations based on manufacturing decline or sprawl, Birrell, O’Connor and Rapson (1999) argued that an understanding of the operation of housing markets was central to metropolitan patterns of social disadvantage in Melbourne during the late 1980s and the 1990s. Following Winter and Bryson (1998), they argued that unfavourable perceptions, or the stigmatisation, of an area can adversely affect its housing prices and rental values. When this happens people who can afford to move out do so, while those on very low-incomes with limited housing choice tend to remain.1 What this and other post-1996 studies also showed was that the locations of serious socio-economic disadvantage in Melbourne were in middle suburbia, rather than in fringe locations as claimed by compact city advocates in the early 1990s. Table 3, from a 1999 study (Birrell, O’Connor and Rapson, 1999), which uses internal migration data, provides an insight into the pattern of socio-economic decline in some middle-suburban locations. The table shows high rates of net out movement of more affluent male residents in each of the locations listed. Lower-income males (and their families) tend to be left behind. The authors noted that several of these areas, including Greater Dandenong, were relatively job rich. The relative concentration of low-income males (including recently arrived migrants) was a consequence of the limited or inappropriate job skills of the residents and not lack of jobs in their vicinity.
The tenuous nature of the link between ‘sprawl’ and locational disadvantage in Melbourne, pointed to by Maher, has been reaffirmed by subsequent research. For example, a recent study of the Cranbourne area on Melbourne’s eastern fringe found Cranbourne to have been underpinned by the growth of a family-orientated population of modest incomes with low levels of unemployment (Birrell and Rapson, 2003; Taylor and Birrell, 2003). The current residents of this area are not particularly disadvantaged.
1 This approach appears to draw on the perspective of William Julius Wilson in the U.S., as put forward in his book, The Truly Disadvantaged, The University of Chicago Press, Chicago, 1987.
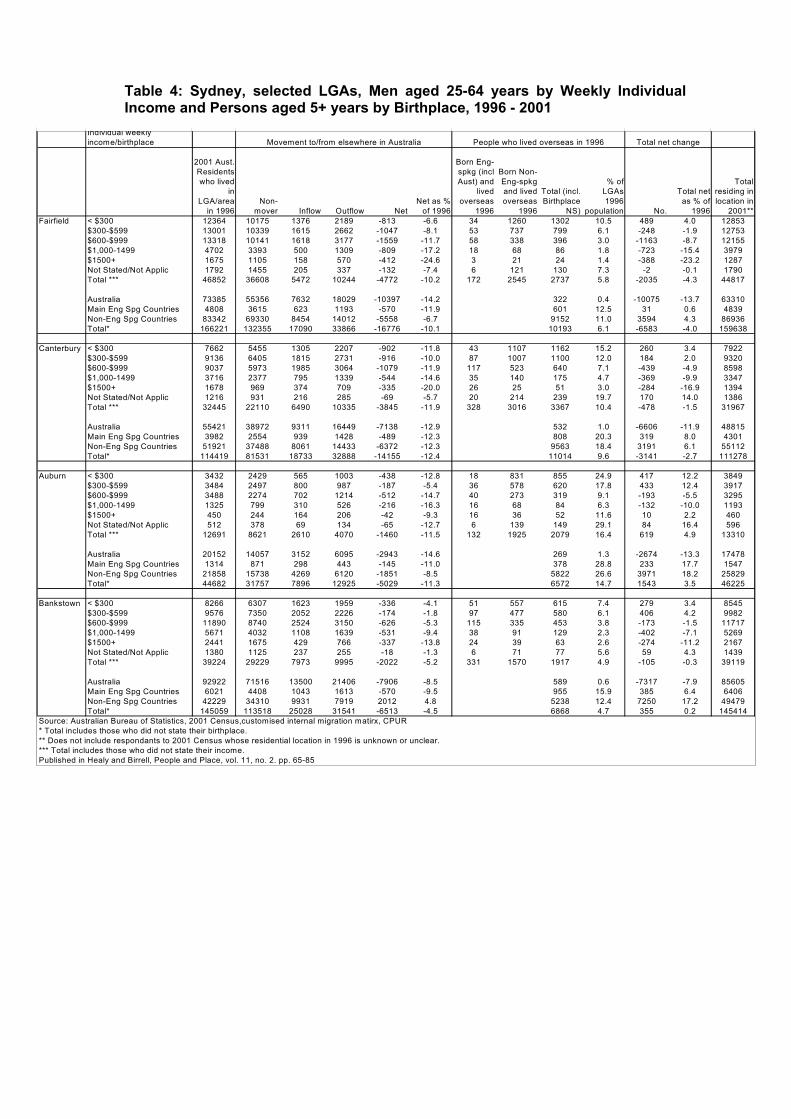
Table 4: Sydney, selected LGAs, Men aged 25-64 years by Weekly Individual Income and Persons aged 5+ years by Birthplace, 1996 - 2001
Individual weekly income/birthplace Movement to/from elsewhere in Australia People who lived overseas in 1996 Total net change
2001 Aust. Residents who lived
in LGA/area
in 1996Non-
mover Inflow Outflow NetNet as %
of 1996
Born Eng-spkg (incl Aust) and
lived overseas
1996
Born Non-Eng-spkg and lived overseas
1996
Total (incl. Birthplace
NS)
% of LGAs 1996
population No.
Total net as % of
1996
Total residing in location in
2001**Fairfield < $300 12364 10175 1376 2189 -813 -6.6 34 1260 1302 10.5 489 4.0 12853
$300-$599 13001 10339 1615 2662 -1047 -8.1 53 737 799 6.1 -248 -1.9 12753$600-$999 13318 10141 1618 3177 -1559 -11.7 58 338 396 3.0 -1163 -8.7 12155$1,000-1499 4702 3393 500 1309 -809 -17.2 18 68 86 1.8 -723 -15.4 3979$1500+ 1675 1105 158 570 -412 -24.6 3 21 24 1.4 -388 -23.2 1287Not Stated/Not Applic 1792 1455 205 337 -132 -7.4 6 121 130 7.3 -2 -0.1 1790Total *** 46852 36608 5472 10244 -4772 -10.2 172 2545 2737 5.8 -2035 -4.3 44817
Australia 73385 55356 7632 18029 -10397 -14.2 322 0.4 -10075 -13.7 63310Main Eng Spg Countries 4808 3615 623 1193 -570 -11.9 601 12.5 31 0.6 4839Non-Eng Spg Countries 83342 69330 8454 14012 -5558 -6.7 9152 11.0 3594 4.3 86936Total* 166221 132355 17090 33866 -16776 -10.1 10193 6.1 -6583 -4.0 159638
Canterbury < $300 7662 5455 1305 2207 -902 -11.8 43 1107 1162 15.2 260 3.4 7922$300-$599 9136 6405 1815 2731 -916 -10.0 87 1007 1100 12.0 184 2.0 9320$600-$999 9037 5973 1985 3064 -1079 -11.9 117 523 640 7.1 -439 -4.9 8598$1,000-1499 3716 2377 795 1339 -544 -14.6 35 140 175 4.7 -369 -9.9 3347$1500+ 1678 969 374 709 -335 -20.0 26 25 51 3.0 -284 -16.9 1394Not Stated/Not Applic 1216 931 216 285 -69 -5.7 20 214 239 19.7 170 14.0 1386Total *** 32445 22110 6490 10335 -3845 -11.9 328 3016 3367 10.4 -478 -1.5 31967
Australia 55421 38972 9311 16449 -7138 -12.9 532 1.0 -6606 -11.9 48815Main Eng Spg Countries 3982 2554 939 1428 -489 -12.3 808 20.3 319 8.0 4301Non-Eng Spg Countries 51921 37488 8061 14433 -6372 -12.3 9563 18.4 3191 6.1 55112Total* 114419 81531 18733 32888 -14155 -12.4 11014 9.6 -3141 -2.7 111278
Auburn < $300 3432 2429 565 1003 -438 -12.8 18 831 855 24.9 417 12.2 3849$300-$599 3484 2497 800 987 -187 -5.4 36 578 620 17.8 433 12.4 3917$600-$999 3488 2274 702 1214 -512 -14.7 40 273 319 9.1 -193 -5.5 3295$1,000-1499 1325 799 310 526 -216 -16.3 16 68 84 6.3 -132 -10.0 1193$1500+ 450 244 164 206 -42 -9.3 16 36 52 11.6 10 2.2 460Not Stated/Not Applic 512 378 69 134 -65 -12.7 6 139 149 29.1 84 16.4 596Total *** 12691 8621 2610 4070 -1460 -11.5 132 1925 2079 16.4 619 4.9 13310
Australia 20152 14057 3152 6095 -2943 -14.6 269 1.3 -2674 -13.3 17478Main Eng Spg Countries 1314 871 298 443 -145 -11.0 378 28.8 233 17.7 1547Non-Eng Spg Countries 21858 15738 4269 6120 -1851 -8.5 5822 26.6 3971 18.2 25829Total* 44682 31757 7896 12925 -5029 -11.3 6572 14.7 1543 3.5 46225
Bankstown < $300 8266 6307 1623 1959 -336 -4.1 51 557 615 7.4 279 3.4 8545$300-$599 9576 7350 2052 2226 -174 -1.8 97 477 580 6.1 406 4.2 9982$600-$999 11890 8740 2524 3150 -626 -5.3 115 335 453 3.8 -173 -1.5 11717$1,000-1499 5671 4032 1108 1639 -531 -9.4 38 91 129 2.3 -402 -7.1 5269$1500+ 2441 1675 429 766 -337 -13.8 24 39 63 2.6 -274 -11.2 2167Not Stated/Not Applic 1380 1125 237 255 -18 -1.3 6 71 77 5.6 59 4.3 1439Total *** 39224 29229 7973 9995 -2022 -5.2 331 1570 1917 4.9 -105 -0.3 39119
Australia 92922 71516 13500 21406 -7906 -8.5 589 0.6 -7317 -7.9 85605Main Eng Spg Countries 6021 4408 1043 1613 -570 -9.5 955 15.9 385 6.4 6406Non-Eng Spg Countries 42229 34310 9931 7919 2012 4.8 5238 12.4 7250 17.2 49479Total* 145059 113518 25028 31541 -6513 -4.5 6868 4.7 355 0.2 145414
Source: Australian Bureau of Statistics, 2001 Census,customised internal migration matirx, CPUR* Total includes those who did not state their birthplace.** Does not include respondants to 2001 Census whose residential location in 1996 is unknown or unclear.*** Total includes those who did not state their income.Published in Healy and Birrell, People and Place, vol. 11, no. 2. pp. 65-85
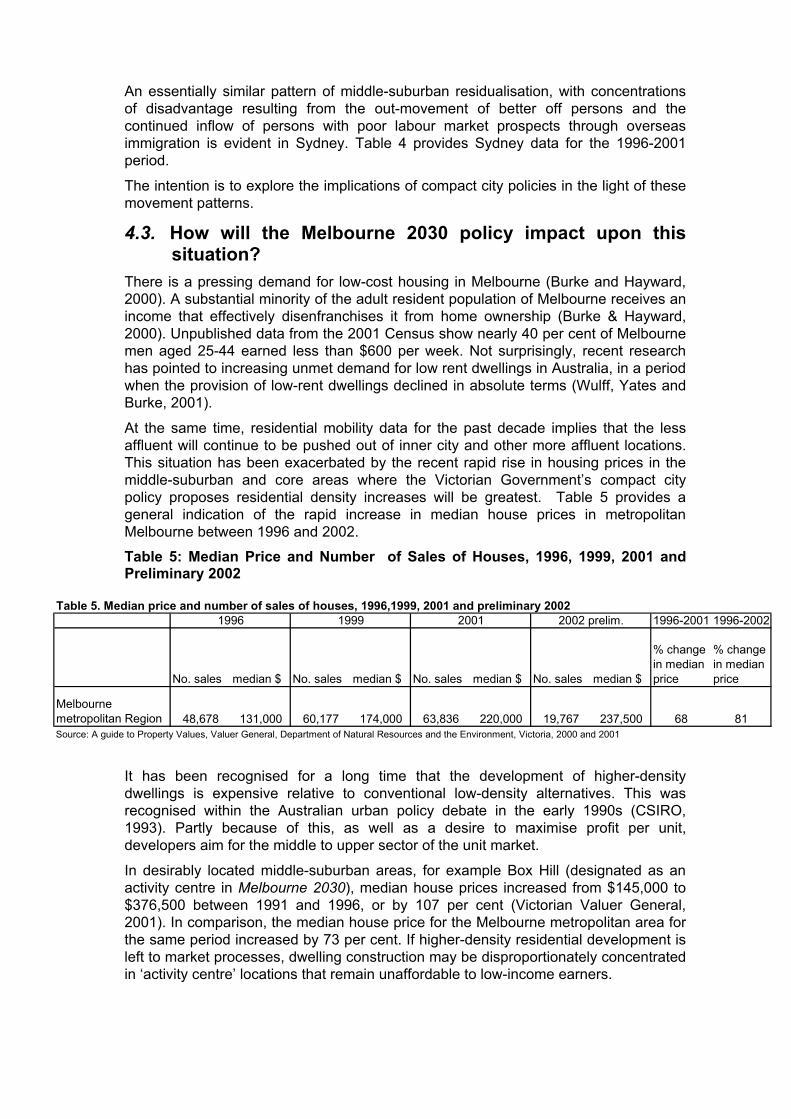
An essentially similar pattern of middle-suburban residualisation, with concentrations of disadvantage resulting from the out-movement of better off persons and the continued inflow of persons with poor labour market prospects through overseas immigration is evident in Sydney. Table 4 provides Sydney data for the 1996-2001 period.
The intention is to explore the implications of compact city policies in the light of these movement patterns.
4.3. How will the Melbourne 2030 policy impact upon this situation?
There is a pressing demand for low-cost housing in Melbourne (Burke and Hayward, 2000). A substantial minority of the adult resident population of Melbourne receives an income that effectively disenfranchises it from home ownership (Burke & Hayward, 2000). Unpublished data from the 2001 Census show nearly 40 per cent of Melbourne men aged 25-44 earned less than $600 per week. Not surprisingly, recent research has pointed to increasing unmet demand for low rent dwellings in Australia, in a period when the provision of low-rent dwellings declined in absolute terms (Wulff, Yates and Burke, 2001).
At the same time, residential mobility data for the past decade implies that the less affluent will continue to be pushed out of inner city and other more affluent locations. This situation has been exacerbated by the recent rapid rise in housing prices in the middle-suburban and core areas where the Victorian Government’s compact city policy proposes residential density increases will be greatest. Table 5 provides a general indication of the rapid increase in median house prices in metropolitan Melbourne between 1996 and 2002.
Table 5: Median Price and Number of Sales of Houses, 1996, 1999, 2001 and Preliminary 2002
Table 5. Median price and number of sales of houses, 1996,1999, 2001 and preliminary 20021996 1999 2001 2002 prelim. 1996-2001 1996-2002
No. sales median $ No. sales median $ No. sales median $ No. sales median $
% change in median price
% change in median price
Melbourne metropolitan Region 48,678 131,000 60,177 174,000 63,836 220,000 19,767 237,500 68 81Source: A guide to Property Values, Valuer General, Department of Natural Resources and the Environment, Victoria, 2000 and 2001
It has been recognised for a long time that the development of higher-density dwellings is expensive relative to conventional low-density alternatives. This was recognised within the Australian urban policy debate in the early 1990s (CSIRO, 1993). Partly because of this, as well as a desire to maximise profit per unit, developers aim for the middle to upper sector of the unit market.
In desirably located middle-suburban areas, for example Box Hill (designated as an activity centre in Melbourne 2030), median house prices increased from $145,000 to $376,500 between 1991 and 1996, or by 107 per cent (Victorian Valuer General, 2001). In comparison, the median house price for the Melbourne metropolitan area for the same period increased by 73 per cent. If higher-density residential development is left to market processes, dwelling construction may be disproportionately concentrated in ‘activity centre’ locations that remain unaffordable to low-income earners.
Yet, despite the high demand for low-income housing and the increasing cost of residential properties in many established suburban areas, the Melbourne 2030 policy only provides for 31 per cent of the anticipated demand for land to be supplied in fringe locations during the 2001 to 2030 period (compared with 38 per cent during the period 1996-97 to 2000-2001).
If socially disadvantaged and low-income persons are not incorporated into socially mixed local communities on a broad scale as metropolitan densities increase in the coming decades, then what spatial configuration of social advantage and affluence will result? Will existing areas of social ‘residualisation’ consolidate, thus remaining the principal locations of disadvantage? Or, despite fringe suburban locations not having been the focus of ‘residual’ populations in the past, might established residual areas be supplemented by the emergence of new residual locations on the metropolitan fringe?
Different scenarios are possible. To date, developers have experimented in the marketing of higher density developments, with some subdivisions designed to appeal to the more affluent sections of the housing market, while others have been pitched at low-income persons desperate to gain a foothold in home ownership. Yet other developments, informed by new urban design principles, have set out to incorporate a social mix. Some subdivisions within Cranbourne in Melbourne’s east, for example, have been targeted at the low-income end of the buyer spectrum. Roxburgh Park in Melbourne’s north was designed as a showpiece master planned ‘community’ and appears to have been designed to appeal to a socio-economic mix, from low-income homebuyers with little or no deposit to more affluent buyers. The size and stylistic mix of dwellings at Roxburgh Park reflect this intention, as the area includes small, barely-detached dwellings and large mock Georgian and Victorian row terraces in prominent locations within the estate. At the other extreme, VicUrban’s master planned Aurora estate (still in the design phase), also in Melbourne’s north, appears to be aimed exclusively at the more affluent and represents an attempt to replicate the lifestyle of the inner city professional classes on the urban fringe.
If developers decide that the high-density, low-income option is not sufficiently profitable and focus their efforts upon the development of exclusive, highly demarcated fringe estates, then this may, in turn, throw the weight of low-income housing demand back upon middle and outer suburban ‘holdenist’2 areas.
As the metropolitan population continues to grow over the nest twenty to thirty years, such pressures may fuel densification in established ‘holdenist’ areas through infill and redevelopment. Such densification, however, may stand in stark contrast to the ‘master planned’ density of the exclusive outer-suburban estates, some of which are governed by design covenants, which control the style, size and quality of the houses built. By contrast, ‘holdenist’ infill development will likely be largely ad hoc and poorly regulated with a significant loss of existing open-space amenity. In this situation, dilapidated ‘holdenist’ housing stock from the early post-war period may become infused with an overlay of high-density dwellings in the form of units and flats, which may, in turn, meet the needs of a relatively transient, low-income rental population. Therefore, a situation could emerge where the spatial concentration of disadvantage does not reflect high residential densities per se, but the ad hoc manner in which the densification occurs.
2 The term ‘holdenist’ describes those suburbs built in the 1950s and 1960s, which were largely populated by lower middle class and working class families of modest income.
A mix of the above scenarios is also possible. Developers may continue with conspicuous high-density, low-income developments in fringe areas while a proportion of low-income housing demand is met through ad hoc ‘holdenist’ infill. As discussed above, a factor that may bear upon the profitability of low-cost higher-density fringe subdivisions will be the impact of the Melbourne 2030 UGB on the cost of broad acre land. The high cost of undeveloped land within the UGB may limit the extent to which fringe areas will be developed for a low-income market. A key and as yet uncertain factor in this regard will be the willingness of the Victorian Government to expand the UGB in response to market pressures.
4.3.1. Neighbourhood effects The evidence examined above shows that the less affluent are being excluded from inner city locations and other sought after middle suburban areas. Although this means that neighbourhood studies of poor residents in inner-city (especially black) areas, as found in the U.S., are not really relevant to the present study, to the extent that low-income persons concentrate, there will be neighbourhood effects. The perceptions of residents and others can be important to the way neighbourhoods develop (Galster, 2001: 2114). The socio-economic character of residential mobility to and from a neighbourhood as well as levels of residential satisfaction within a neighbourhood appear, in part, to be a product of this subjective dimension (Parkes, et al., 2002). It is widely accepted that the experience of residing in a neighbourhood characterised by homelessness, conspicuous transience, predatory crime, informal street economies, illicit drug trade and youth despondency may itself become a factor that contributes to the further decline of ‘relegated’ neighbourhoods (Wacquant, 1999: 1). Wacquant (1999) argues that the way social marginalisation is expressed under contemporary conditions is evident in the formation of particularly concentrated ‘hard core’ areas of multiple disadvantage which are ‘…clearly identified by their own residents, no less than by outsiders…’ (Wacquant, 1999: 1644). In this context, the neighbourhood effects may now be more important in shaping disadvantage than was previously the case.
A pervading territorial stigma is firmly affixed upon the residents of such neighbourhoods of socio-economic exile… (Wacquant, 1999: 1644)
The priority for this study is to identify the extent and causes of low-income concentration associated with compact city policies. Where such concentration does occur, there is little doubt that there will be significant ‘neighbourhood effects’. The impact on schools of the accumulation of students from less affluent backgrounds is one important example. Parents with the resources to avoid locating in such areas are likely to do so, thus exacerbating the situation. These effects should be the subject of future analysis. They are not included in the brief for this study.
Some preliminary evidence suggests that some fringe localities are already becoming residuals and that high dwelling density may be a factor associated with this process. Some of these higher-density subdivisions have been in place for around a decade, thus allowing research exploring their characteristics.3 Preliminary work in Cranbourne suggests that some may be becoming ‘residuals’, marked by relatively low prices, the accumulation of low-income households and stigmatisation as repositories of those who cannot afford to locate elsewhere. One hypothesis stemming from this preliminary 3 The Victorian Government’s stated goal is to increase densities from the presumed current ‘norm’ of 12 dwellings per hectare to 15 per hectare (Melbourne 2030: 13).3 After taking account of land needed for roads and open space, a 15 per hectare estate implies blocks of around 500 square metres. Such densities are already evident in fringe locations. For example, lot sizes at Roxburgh Park in Melbourne’s north currently average around 20 dwellings per hectare. Subdivisions of 500 square metres or less are common in Cranbourne.
work is that the physical structure of small-lot detached housing creates circumstances, which promote an ugly streetscape that is quite different from the predominantly green streetscape of much of Melbourne’s established suburbia. This is because there is insufficient in front of the small lots for substantial shrubs or trees to be planted and because the narrow roads preclude their use for street parking. As a consequence cars have to be parked on the meagre space between roadway and buildings. The resulting cluttered, untidy settings can contribute to the stigmatisation of these areas as locations to be avoided. The key issue here is, once these outcomes become evident, they may usher in a change in the characteristics of residents towards more transient and low-income renters who have less interest in maintaining the physical condition of the properties in question.
Nevertheless, it is possible that increased residential densities will be judged differently in distinct socio-economic contexts. In some situations, high density may be stigmatised as a sign of impoverishment, while in other areas this may not occur if other attributes are present, like proximity to inner city amenities. Further, differences in the perception of urban density may vary according to the social capital of the residents in an area. In areas of relative affluence and easy access to a broad range of cultural and other services, residential propinquity may be conducive to the creation of the social capital that is important to the life chances of the professional middle class. The ideas of Richard Florida (2002), concerning the cultural and economic dynamism of ‘the creative class’ in the U.S., ideas which have been recently applied to the Australian context by Peter Brain (National Economics, 2002; Also see response by Birrell & Rapson, 2002), suggest that the professional class has a broad menu of cultural and knowledge-based resources which would potentially compensate for loss of spatial amenity and even augment the pursuit of individual and group self-interest in a medium density residential setting. Further, members of this class may often own or have access to recreational residential properties in non-urban areas where natural environmental amenity is plentiful. By comparison, the residents of socially disadvantaged areas with higher densities may not have the social and cultural capital to compensate for loss of spatial amenity, or to cope with a more confined, demanding social environment.
The occurrence of different social and cultural outcomes in areas of similar residential density would not necessarily mean that density is a neutral factor in the spatial demarcation of rich and poor. This is because high residential density can become an attribute of poverty, just as it can become an attribute of middle-class affluence. Some higher density areas will have been master planned with a view to the class-specific needs of future residents, while others may have developed in an uncoordinated way with little concern for the needs of residents or the overall character of the area. The impact of compact city policy upon specific areas is therefore likely to be mediated by a range of class-related factors.
5. RESEARCH AIMS
The research will proceed in two phases. The first phase will review the factors involved in the emergence of areas in established suburban zones in Melbourne which are defined as ‘residuals’ in the terms of this study. We need to learn about the contributing social processes in these areas in order to better anticipate what may arise on the metropolitan fringe. The second phase examines the potential for suburban fringe locations to residuals. Here, the focus will be on high-density outer suburban estates.
5.1. Key questions to be explored by the research are: 1. Why do certain urban areas become characterised by a process of ‘residualisation’
– characterised by high concentrations of low-income persons, depressed housing prices, multiple social problems and poor labour market outcomes, while other initially similar areas do not?
2. Can the process of ‘residualisation’ be satisfactorily explained by the loss of jobs in the areas in question?
3. Is limited residential mobility a factor in the development of spatial concentrations of serious social and economic disadvantage?
4. What is the role of the built environment – residential densities, local amenity and physical aesthetics of neighbourhoods -- in the process of ‘residualisation’?
5. Once an area comes to be characterised by a gravitation of people with limited means and depressed housing prices relative to other metropolitan locations, can this set in process a cycle of disadvantage and stigmatisation with further deleterious consequences?
6. What is the potential for suburban fringe locations to become residuals? Can residential density be a significant factor in the residualisation process?
7. What are the implications for the preceding questions of recent metropolitan planning changes?
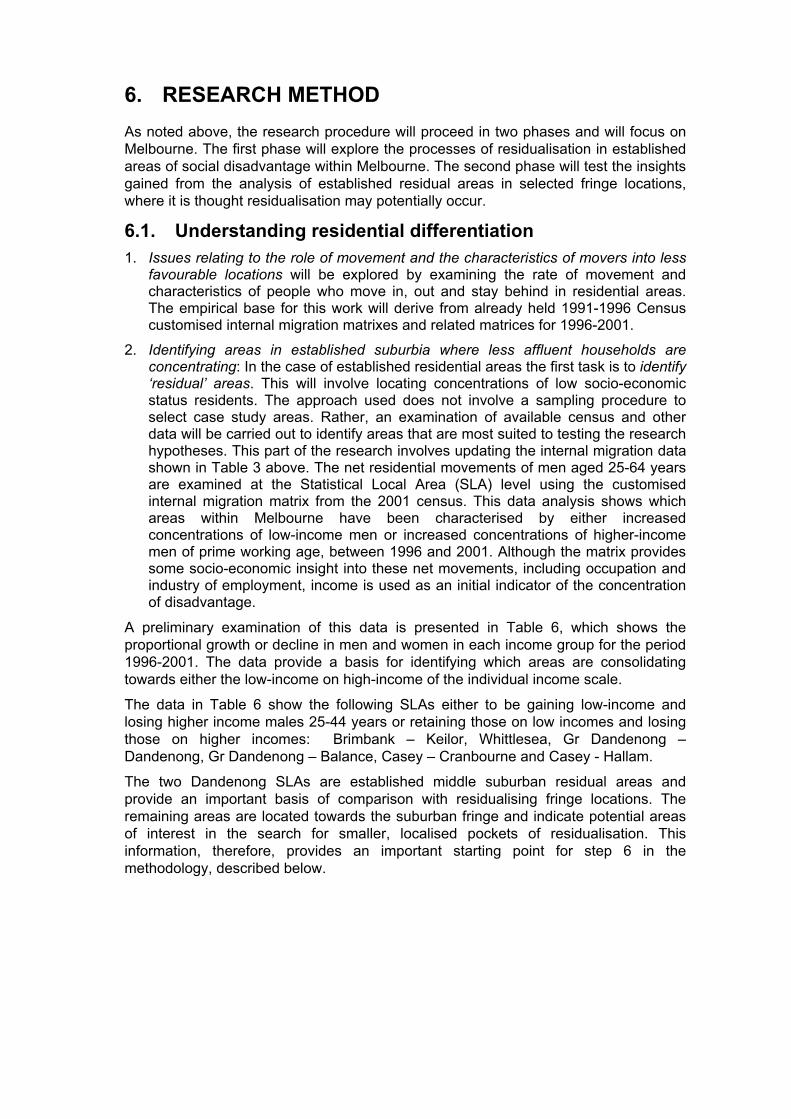
6. RESEARCH METHOD As noted above, the research procedure will proceed in two phases and will focus on Melbourne. The first phase will explore the processes of residualisation in established areas of social disadvantage within Melbourne. The second phase will test the insights gained from the analysis of established residual areas in selected fringe locations, where it is thought residualisation may potentially occur.
6.1. Understanding residential differentiation 1. Issues relating to the role of movement and the characteristics of movers into less
favourable locations will be explored by examining the rate of movement and characteristics of people who move in, out and stay behind in residential areas. The empirical base for this work will derive from already held 1991-1996 Census customised internal migration matrixes and related matrices for 1996-2001.
2. Identifying areas in established suburbia where less affluent households are concentrating: In the case of established residential areas the first task is to identify ‘residual’ areas. This will involve locating concentrations of low socio-economic status residents. The approach used does not involve a sampling procedure to select case study areas. Rather, an examination of available census and other data will be carried out to identify areas that are most suited to testing the research hypotheses. This part of the research involves updating the internal migration data shown in Table 3 above. The net residential movements of men aged 25-64 years are examined at the Statistical Local Area (SLA) level using the customised internal migration matrix from the 2001 census. This data analysis shows which areas within Melbourne have been characterised by either increased concentrations of low-income men or increased concentrations of higher-income men of prime working age, between 1996 and 2001. Although the matrix provides some socio-economic insight into these net movements, including occupation and industry of employment, income is used as an initial indicator of the concentration of disadvantage.
A preliminary examination of this data is presented in Table 6, which shows the proportional growth or decline in men and women in each income group for the period 1996-2001. The data provide a basis for identifying which areas are consolidating towards either the low-income on high-income of the individual income scale.
The data in Table 6 show the following SLAs either to be gaining low-income and losing higher income males 25-44 years or retaining those on low incomes and losing those on higher incomes: Brimbank – Keilor, Whittlesea, Gr Dandenong – Dandenong, Gr Dandenong – Balance, Casey – Cranbourne and Casey - Hallam.
The two Dandenong SLAs are established middle suburban residual areas and provide an important basis of comparison with residualising fringe locations. The remaining areas are located towards the suburban fringe and indicate potential areas of interest in the search for smaller, localised pockets of residualisation. This information, therefore, provides an important starting point for step 6 in the methodology, described below.
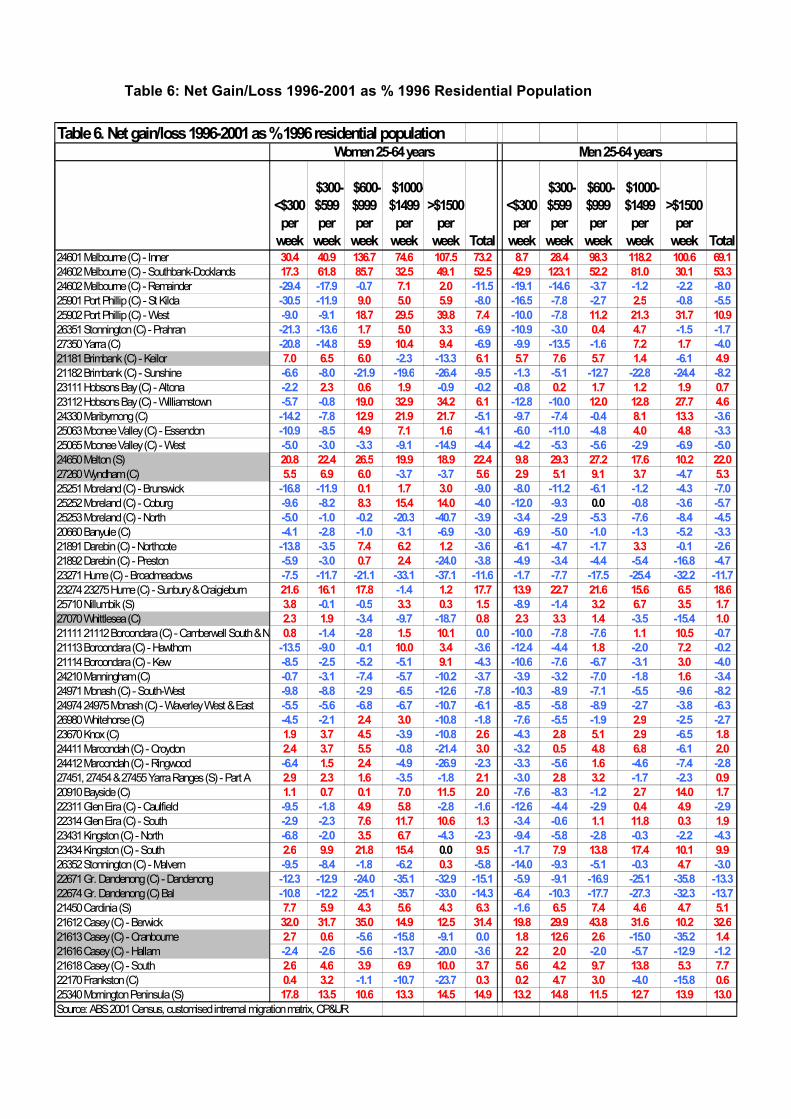
Table 6: Net Gain/Loss 1996-2001 as % 1996 Residential Population
Table 6. Net gain/loss 1996-2001 as % 1996 residential populationWomen 25-64 years Men 25-64 years
<$300 per
week
$300-$599 per
week
$600-$999 per
week
$1000-$1499 per
week
>$1500
per week Total
<$300 per
week
$300-$599 per
week
$600-$999 per
week
$1000-$1499 per
week
>$1500
per week Total
24601 Melbourne (C) - Inner24602 Melbourne (C) - Southbank-Docklands24602 Melbourne (C) - Remainder -29.4 -17.9 -0.7 -11.5 -19.1 -14.6 -3.7 -1.2 -2.2 -8.025901 Port Phillip (C) - St Kilda -30.5 -11.9 -8.0 -16.5 -7.8 -2.7 -0.8 -5.525902 Port Phillip (C) - West -9.0 -9.1 -10.0 -7.826351 Stonnington (C) - Prahran -21.3 -13.6 -6.9 -10.9 -3.0 -1.5 -1.727350 Yarra (C) -20.8 -14.8 -6.9 -9.9 -13.5 -1.6 -4.021181 Brimbank (C) - Keilor -2.3 -13.3 -6.121182 Brimbank (C) - Sunshine -6.6 -8.0 -21.9 -19.6 -26.4 -9.5 -1.3 -5.1 -12.7 -22.8 -24.4 -8.223111 Hobsons Bay (C) - Altona -2.2 -0.9 -0.2 -0.823112 Hobsons Bay (C) - Williamstown -5.7 -0.8 -12.8 -10.024330 Maribyrnong (C) -14.2 -7.8 -5.1 -9.7 -7.4 -0.4 -3.625063 Moonee Valley (C) - Essendon -10.9 -8.5 -4.1 -6.0 -11.0 -4.8 -3.325065 Moonee Valley (C) - West -5.0 -3.0 -3.3 -9.1 -14.9 -4.4 -4.2 -5.3 -5.6 -2.9 -6.9 -5.024650 Melton (S)27260 Wyndham (C) -3.7 -3.7 -4.725251 Moreland (C) - Brunswick -16.8 -11.9 -9.0 -8.0 -11.2 -6.1 -1.2 -4.3 -7.025252 Moreland (C) - Coburg -9.6 -8.2 -4.0 -12.0 -9.3 0.0 -0.8 -3.6 -5.725253 Moreland (C) - North -5.0 -1.0 -0.2 -20.3 -40.7 -3.9 -3.4 -2.9 -5.3 -7.6 -8.4 -4.520660 Banyule (C) -4.1 -2.8 -1.0 -3.1 -6.9 -3.0 -6.9 -5.0 -1.0 -1.3 -5.2 -3.321891 Darebin (C) - Northcote -13.8 -3.5 -3.6 -6.1 -4.7 -1.7 -0.1 -2.621892 Darebin (C) - Preston -5.9 -3.0 -24.0 -3.8 -4.9 -3.4 -4.4 -5.4 -16.8 -4.723271 Hume (C) - Broadmeadows -7.5 -11.7 -21.1 -33.1 -37.1 -11.6 -1.7 -7.7 -17.5 -25.4 -32.2 -11.723274 23275 Hume (C) - Sunbury & Craigieburn -1.425710 Nillumbik (S) -0.1 -0.5 -8.9 -1.427070 Whittlesea (C) -3.4 -9.7 -18.7 -3.5 -15.421111 21112 Boroondara (C) - Camberwell South & No -1.4 -2.8 0.0 -10.0 -7.8 -7.6 -0.721113 Boroondara (C) - Hawthorn -13.5 -9.0 -0.1 -3.6 -12.4 -4.4 -2.0 -0.221114 Boroondara (C) - Kew -8.5 -2.5 -5.2 -5.1 -4.3 -10.6 -7.6 -6.7 -3.1 -4.024210 Manningham (C) -0.7 -3.1 -7.4 -5.7 -10.2 -3.7 -3.9 -3.2 -7.0 -1.8 -3.424971 Monash (C) - South-West -9.8 -8.8 -2.9 -6.5 -12.6 -7.8 -10.3 -8.9 -7.1 -5.5 -9.6 -8.224974 24975 Monash (C) - Waverley West & East -5.5 -5.6 -6.8 -6.7 -10.7 -6.1 -8.5 -5.8 -8.9 -2.7 -3.8 -6.326980 Whitehorse (C) -4.5 -2.1 -10.8 -1.8 -7.6 -5.5 -1.9 -2.5 -2.723670 Knox (C) -3.9 -10.8 -4.3 -6.524411 Maroondah (C) - Croydon -0.8 -21.4 -3.2 -6.124412 Maroondah (C) - Ringwood -6.4 -4.9 -26.9 -2.3 -3.3 -5.6 -4.6 -7.4 -2.827451, 27454 & 27455 Yarra Ranges (S) - Part A -3.5 -1.8 -3.0 -1.7 -2.320910 Bayside (C) -7.6 -8.3 -1.222311 Glen Eira (C) - Caulfield -9.5 -1.8 -2.8 -1.6 -12.6 -4.4 -2.9 -2.922314 Glen Eira (C) - South -2.9 -2.3 -3.4 -0.623431 Kingston (C) - North -6.8 -2.0 -4.3 -2.3 -9.4 -5.8 -2.8 -0.3 -2.2 -4.323434 Kingston (C) - South 0.0 -1.726352 Stonnington (C) - Malvern -9.5 -8.4 -1.8 -6.2 -5.8 -14.0 -9.3 -5.1 -0.3 -3.022671 Gr. Dandenong (C) - Dandenong -12.3 -12.9 -24.0 -35.1 -32.9 -15.1 -5.9 -9.1 -16.9 -25.1 -35.8 -13.322674 Gr. Dandenong (C) Bal -10.8 -12.2 -25.1 -35.7 -33.0 -14.3 -6.4 -10.3 -17.7 -27.3 -32.3 -13.721450 Cardinia (S) -1.621612 Casey (C) - Berwick21613 Casey (C) - Cranbourne -5.6 -15.8 -9.1 0.0 -15.0 -35.221616 Casey (C) - Hallam -2.4 -2.6 -5.6 -13.7 -20.0 -3.6 -2.0 -5.7 -12.9 -1.221618 Casey (C) - South22170 Frankston (C) -1.1 -10.7 -23.7 -4.0 -15.825340 Mornington Peninsula (S)Source: ABS 2001 Census, customised intrernal migration matrix, CP&UR
30.4 40.9 136.7 74.6 107.5 73.2 8.7 28.4 98.3 118.2 100.6 69.117.3 61.8 85.7 32.5 49.1 52.5 42.9 123.1 52.2 81.0 30.1 53.3
7.1 2.09.0 5.0 5.9 2.518.7 29.5 39.8 7.4 11.2 21.3 31.7 10.91.7 5.0 3.3 0.4 4.75.9 10.4 9.4 7.2 1.7
7.0 6.5 6.0 6.1 5.7 7.6 5.7 1.4 4.9
2.3 0.6 1.9 0.2 1.7 1.2 1.9 0.719.0 32.9 34.2 6.1 12.0 12.8 27.7 4.612.9 21.9 21.7 8.1 13.34.9 7.1 1.6 4.0 4.8
20.8 22.4 26.5 19.9 18.9 22.4 9.8 29.3 27.2 17.6 10.2 22.05.5 6.9 6.0 5.6 2.9 5.1 9.1 3.7 5.3
0.1 1.7 3.08.3 15.4 14.0
7.4 6.2 1.2 3.30.7 2.4
21.6 16.1 17.8 1.2 17.7 13.9 22.7 21.6 15.6 6.5 18.63.8 3.3 0.3 1.5 3.2 6.7 3.5 1.72.3 1.9 0.8 2.3 3.3 1.4 1.00.8 1.5 10.1 1.1 10.5
10.0 3.4 1.8 7.29.1 3.0
1.6
2.4 3.0 2.91.9 3.7 4.5 2.6 2.8 5.1 2.9 1.82.4 3.7 5.5 3.0 0.5 4.8 6.8 2.0
1.5 2.4 1.62.9 2.3 1.6 2.1 2.8 3.2 0.91.1 0.7 0.1 7.0 11.5 2.0 2.7 14.0 1.7
4.9 5.8 0.4 4.97.6 11.7 10.6 1.3 1.1 11.8 0.3 1.93.5 6.7
2.6 9.9 21.8 15.4 9.5 7.9 13.8 17.4 10.1 9.90.3 4.7
7.7 5.9 4.3 5.6 4.3 6.3 6.5 7.4 4.6 4.7 5.132.0 31.7 35.0 14.9 12.5 31.4 19.8 29.9 43.8 31.6 10.2 32.62.7 0.6 1.8 12.6 2.6 1.4
2.2 2.02.6 4.6 3.9 6.9 10.0 3.7 5.6 4.2 9.7 13.8 5.3 7.70.4 3.2 0.3 0.2 4.7 3.0 0.617.8 13.5 10.6 13.3 14.5 14.9 13.2 14.8 11.5 12.7 13.9 13.0
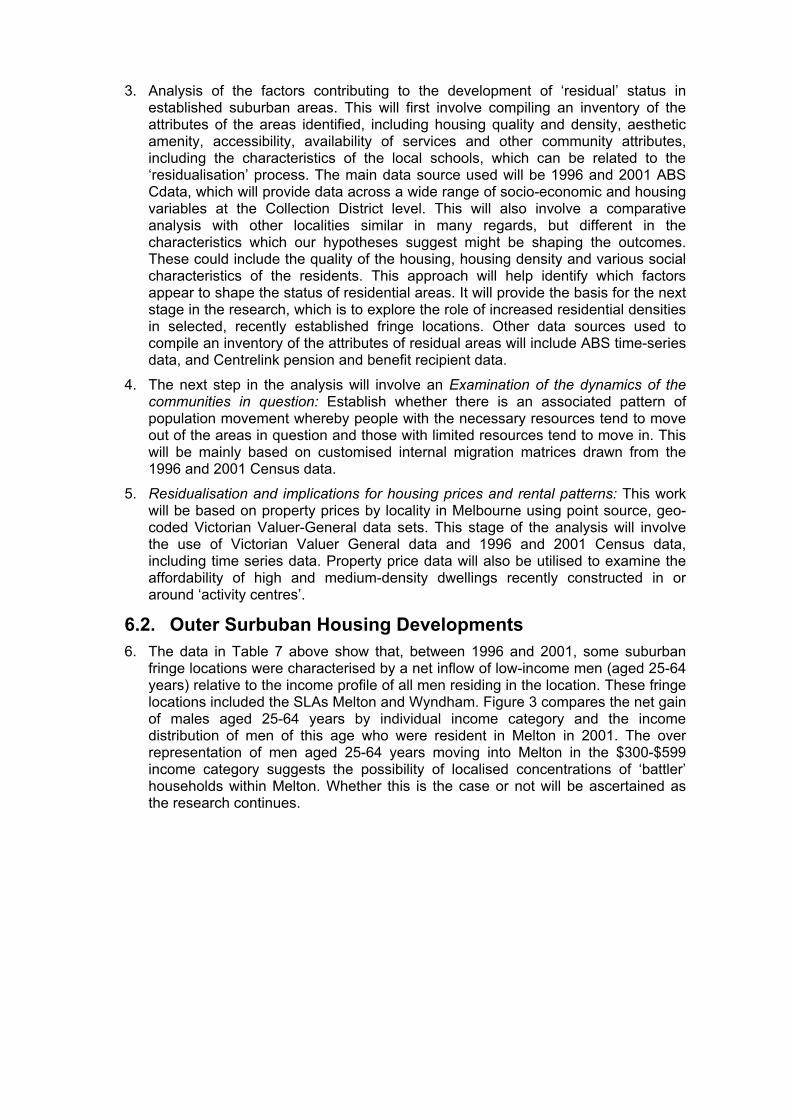
3. Analysis of the factors contributing to the development of ‘residual’ status in established suburban areas. This will first involve compiling an inventory of the attributes of the areas identified, including housing quality and density, aesthetic amenity, accessibility, availability of services and other community attributes, including the characteristics of the local schools, which can be related to the ‘residualisation’ process. The main data source used will be 1996 and 2001 ABS Cdata, which will provide data across a wide range of socio-economic and housing variables at the Collection District level. This will also involve a comparative analysis with other localities similar in many regards, but different in the characteristics which our hypotheses suggest might be shaping the outcomes. These could include the quality of the housing, housing density and various social characteristics of the residents. This approach will help identify which factors appear to shape the status of residential areas. It will provide the basis for the next stage in the research, which is to explore the role of increased residential densities in selected, recently established fringe locations. Other data sources used to compile an inventory of the attributes of residual areas will include ABS time-series data, and Centrelink pension and benefit recipient data.
4. The next step in the analysis will involve an Examination of the dynamics of the communities in question: Establish whether there is an associated pattern of population movement whereby people with the necessary resources tend to move out of the areas in question and those with limited resources tend to move in. This will be mainly based on customised internal migration matrices drawn from the 1996 and 2001 Census data.
5. Residualisation and implications for housing prices and rental patterns: This work will be based on property prices by locality in Melbourne using point source, geo-coded Victorian Valuer-General data sets. This stage of the analysis will involve the use of Victorian Valuer General data and 1996 and 2001 Census data, including time series data. Property price data will also be utilised to examine the affordability of high and medium-density dwellings recently constructed in or around ‘activity centres’.
6.2. Outer Surbuban Housing Developments 6. The data in Table 7 above show that, between 1996 and 2001, some suburban
fringe locations were characterised by a net inflow of low-income men (aged 25-64 years) relative to the income profile of all men residing in the location. These fringe locations included the SLAs Melton and Wyndham. Figure 3 compares the net gain of males aged 25-64 years by individual income category and the income distribution of men of this age who were resident in Melton in 2001. The over representation of men aged 25-64 years moving into Melton in the $300-$599 income category suggests the possibility of localised concentrations of ‘battler’ households within Melton. Whether this is the case or not will be ascertained as the research continues.
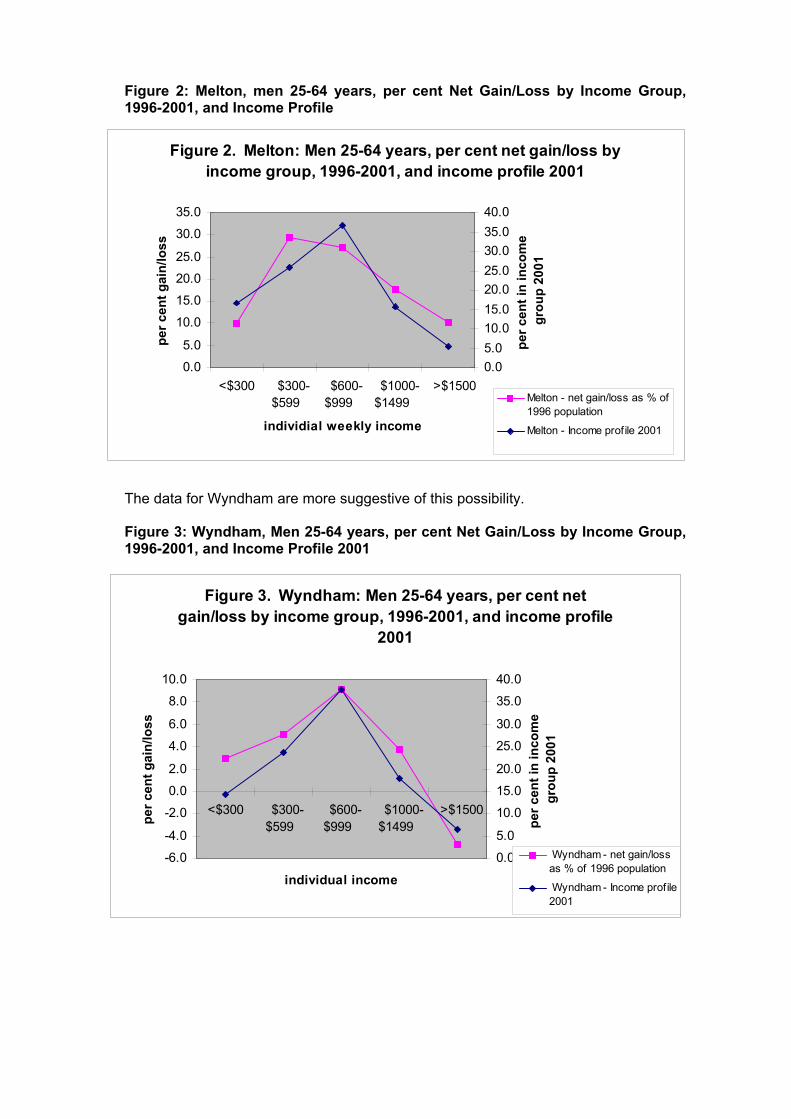
Figure 2: Melton, men 25-64 years, per cent Net Gain/Loss by Income Group, 1996-2001, and Income Profile
Figure 2. Melton: Men 25-64 years, per cent net gain/loss by income group, 1996-2001, and income profile 2001
0.0
5.0
10.0
15.0
20.0
25.0
30.0
35.0
<$300 $300-$599
$600-$999
$1000-$1499
>$1500
individial weekly income
per c
ent g
ain/
loss
0.05.010.015.020.025.030.035.040.0
per c
ent i
n in
com
e gr
oup
2001
Melton - net gain/loss as % of1996 population
Melton - Income profile 2001
The data for Wyndham are more suggestive of this possibility.
Figure 3: Wyndham, Men 25-64 years, per cent Net Gain/Loss by Income Group, 1996-2001, and Income Profile 2001
Figure 3. Wyndham: Men 25-64 years, per cent net gain/loss by income group, 1996-2001, and income profile
2001
-6.0
-4.0
-2.0
0.0
2.0
4.0
6.0
8.0
10.0
<$300 $300-$599
$600-$999
$1000-$1499
>$1500
individual income
per c
ent g
ain/
loss
0.0
5.0
10.0
15.0
20.0
25.0
30.0
35.0
40.0
per c
ent i
n in
com
e gr
oup
2001
Wyndham - net gain/lossas % of 1996 population
Wyndham - Income profile2001
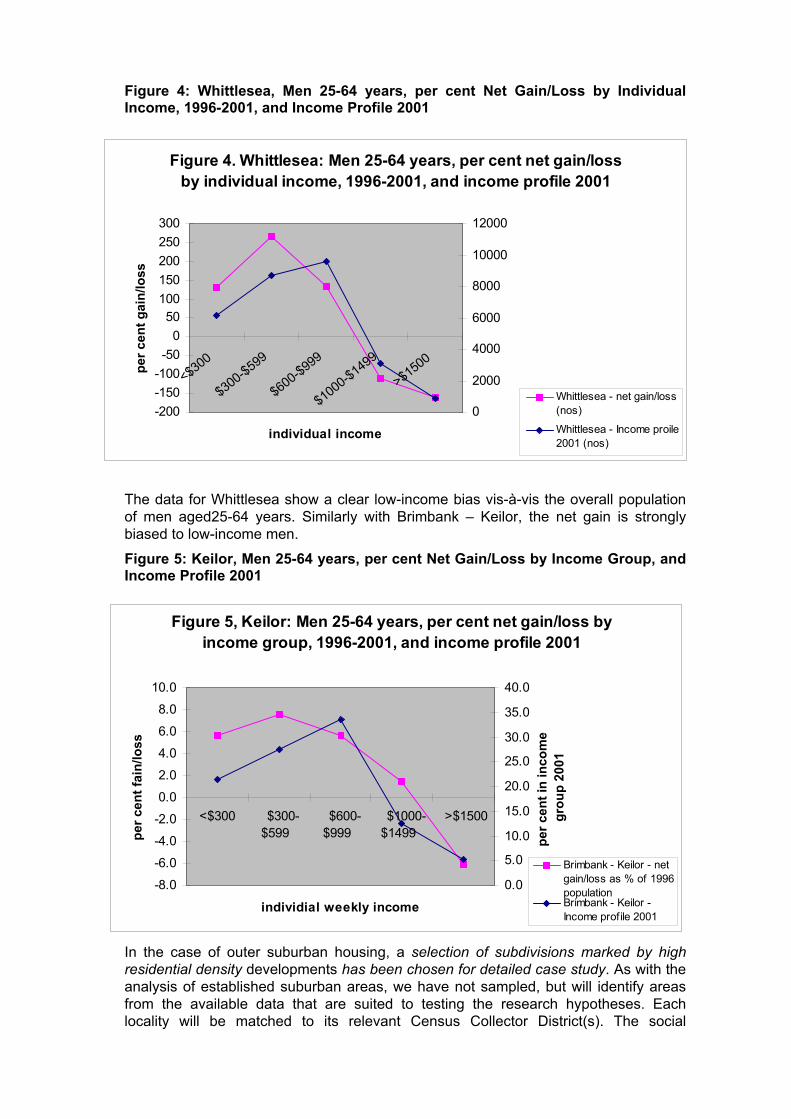
Figure 4: Whittlesea, Men 25-64 years, per cent Net Gain/Loss by Individual Income, 1996-2001, and Income Profile 2001
Figure 4. Whittlesea: Men 25-64 years, per cent net gain/loss by individual income, 1996-2001, and income profile 2001
-200-150-100-50
050
100150200250300
<$300
$300-$599
$600-$999
$1000-$1499
>$1500
individual income
per c
ent g
ain/
loss
0
2000
4000
6000
8000
10000
12000
Whittlesea - net gain/loss(nos)
Whittlesea - Income proile2001 (nos)
The data for Whittlesea show a clear low-income bias vis-à-vis the overall population of men aged25-64 years. Similarly with Brimbank – Keilor, the net gain is strongly biased to low-income men.
Figure 5: Keilor, Men 25-64 years, per cent Net Gain/Loss by Income Group, and Income Profile 2001
Figure 5, Keilor: Men 25-64 years, per cent net gain/loss by income group, 1996-2001, and income profile 2001
-8.0
-6.0
-4.0
-2.0
0.0
2.0
4.0
6.0
8.0
10.0
<$300 $300-$599
$600-$999
$1000-$1499
>$1500
individial weekly income
per c
ent f
ain/
loss
0.0
5.0
10.0
15.0
20.0
25.0
30.0
35.0
40.0
per c
ent i
n in
com
e gr
oup
2001
Brimbank - Keilor - netgain/loss as % of 1996population Brimbank - Keilor -Income profile 2001
In the case of outer suburban housing, a selection of subdivisions marked by high residential density developments has been chosen for detailed case study. As with the analysis of established suburban areas, we have not sampled, but will identify areas from the available data that are suited to testing the research hypotheses. Each locality will be matched to its relevant Census Collector District(s). The social
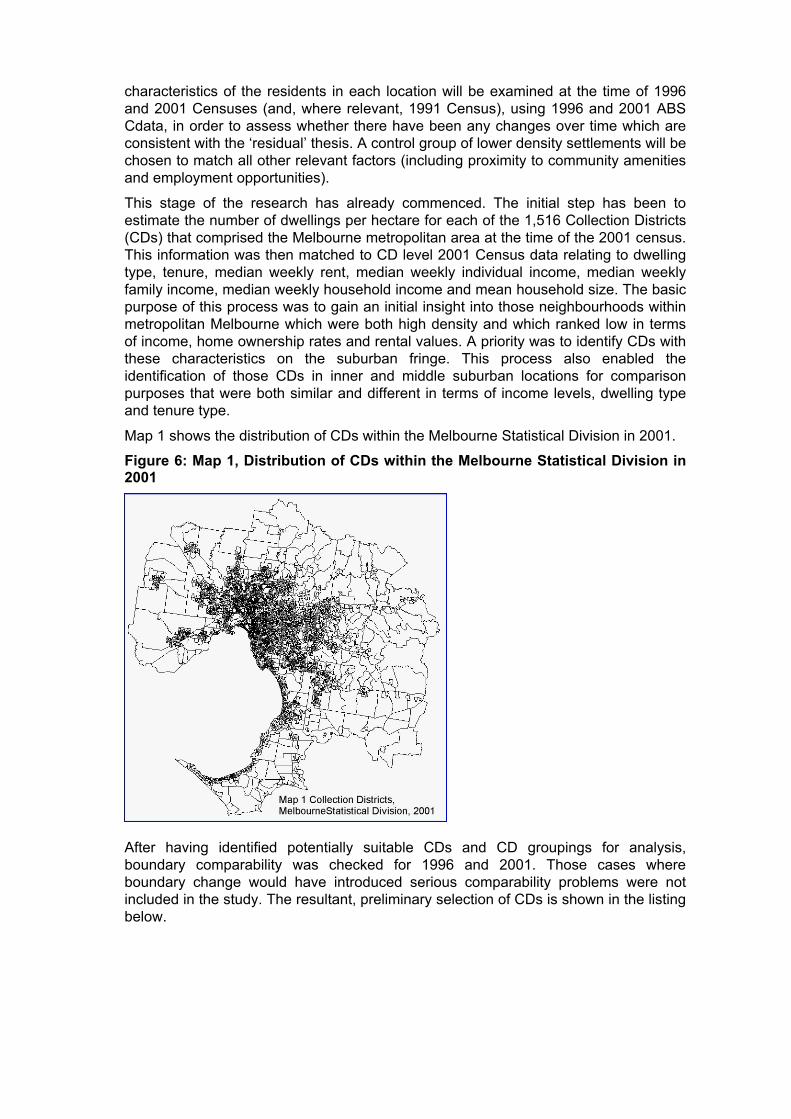
characteristics of the residents in each location will be examined at the time of 1996 and 2001 Censuses (and, where relevant, 1991 Census), using 1996 and 2001 ABS Cdata, in order to assess whether there have been any changes over time which are consistent with the ‘residual’ thesis. A control group of lower density settlements will be chosen to match all other relevant factors (including proximity to community amenities and employment opportunities).
This stage of the research has already commenced. The initial step has been to estimate the number of dwellings per hectare for each of the 1,516 Collection Districts (CDs) that comprised the Melbourne metropolitan area at the time of the 2001 census. This information was then matched to CD level 2001 Census data relating to dwelling type, tenure, median weekly rent, median weekly individual income, median weekly family income, median weekly household income and mean household size. The basic purpose of this process was to gain an initial insight into those neighbourhoods within metropolitan Melbourne which were both high density and which ranked low in terms of income, home ownership rates and rental values. A priority was to identify CDs with these characteristics on the suburban fringe. This process also enabled the identification of those CDs in inner and middle suburban locations for comparison purposes that were both similar and different in terms of income levels, dwelling type and tenure type.
Map 1 shows the distribution of CDs within the Melbourne Statistical Division in 2001.
Figure 6: Map 1, Distribution of CDs within the Melbourne Statistical Division in 2001
After having identified potentially suitable CDs and CD groupings for analysis, boundary comparability was checked for 1996 and 2001. Those cases where boundary change would have introduced serious comparability problems were not included in the study. The resultant, preliminary selection of CDs is shown in the listing below.
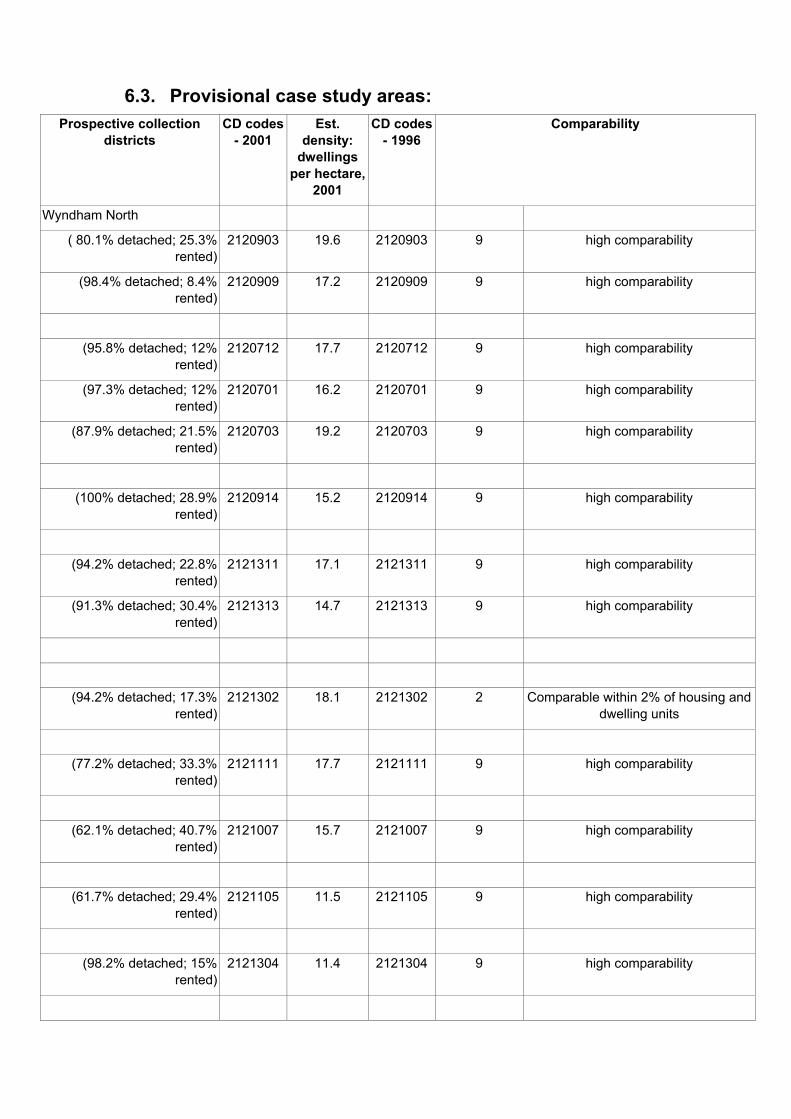
6.3. Provisional case study areas: Prospective collection
districts CD codes
- 2001 Est.
density: dwellings
per hectare, 2001
CD codes - 1996
Comparability
Wyndham North
( 80.1% detached; 25.3% rented)
2120903 19.6 2120903 9 high comparability
(98.4% detached; 8.4% rented)
2120909 17.2 2120909 9 high comparability
(95.8% detached; 12% rented)
2120712 17.7 2120712 9 high comparability
(97.3% detached; 12% rented)
2120701 16.2 2120701 9 high comparability
(87.9% detached; 21.5% rented)
2120703 19.2 2120703 9 high comparability
(100% detached; 28.9% rented)
2120914 15.2 2120914 9 high comparability
(94.2% detached; 22.8% rented)
2121311 17.1 2121311 9 high comparability
(91.3% detached; 30.4% rented)
2121313 14.7 2121313 9 high comparability
(94.2% detached; 17.3% rented)
2121302 18.1 2121302 2 Comparable within 2% of housing and dwelling units
(77.2% detached; 33.3% rented)
2121111 17.7 2121111 9 high comparability
(62.1% detached; 40.7% rented)
2121007 15.7 2121007 9 high comparability
(61.7% detached; 29.4% rented)
2121105 11.5 2121105 9 high comparability
(98.2% detached; 15% rented)
2121304 11.4 2121304 9 high comparability
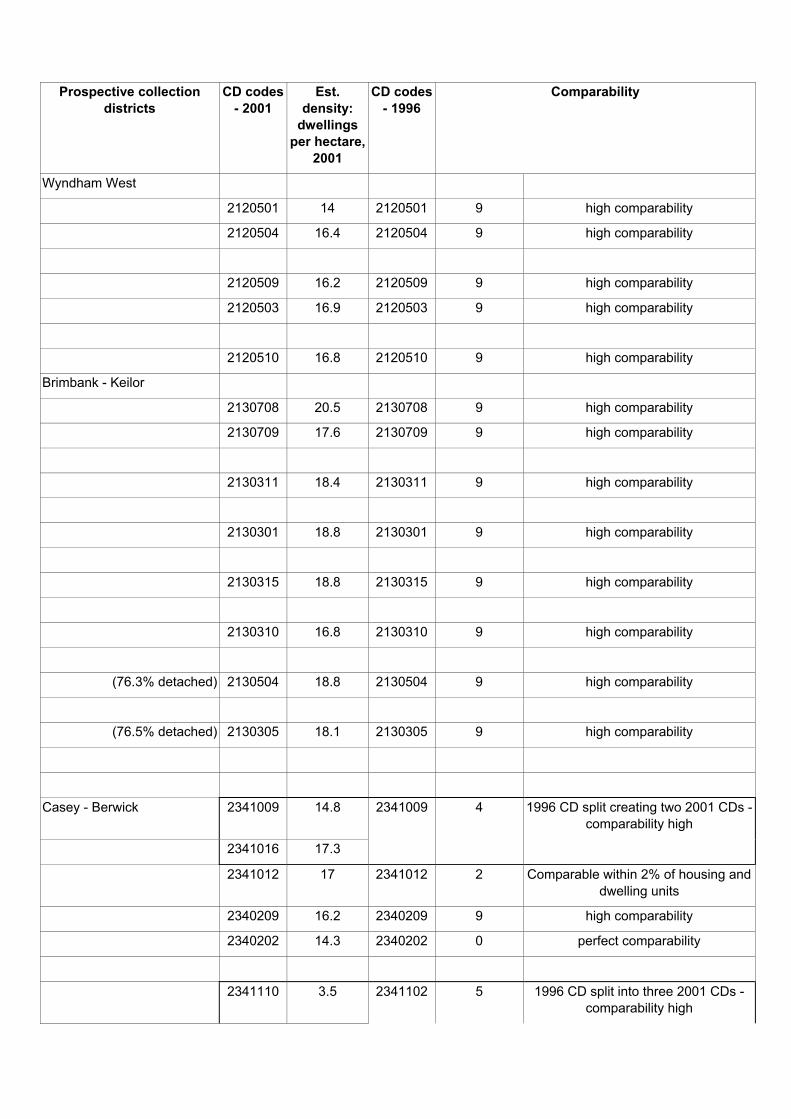
Prospective collection districts
CD codes - 2001
Est. density:
dwellings per hectare,
2001
CD codes - 1996
Comparability
Wyndham West
2120501 14 2120501 9 high comparability
2120504 16.4 2120504 9 high comparability
2120509 16.2 2120509 9 high comparability
2120503 16.9 2120503 9 high comparability
2120510 16.8 2120510 9 high comparability
Brimbank - Keilor
2130708 20.5 2130708 9 high comparability
2130709 17.6 2130709 9 high comparability
2130311 18.4 2130311 9 high comparability
2130301 18.8 2130301 9 high comparability
2130315 18.8 2130315 9 high comparability
2130310 16.8 2130310 9 high comparability
(76.3% detached) 2130504 18.8 2130504 9 high comparability
(76.5% detached) 2130305 18.1 2130305 9 high comparability
Casey - Berwick 2341009 14.8 2341009 4 1996 CD split creating two 2001 CDs -comparability high
2341016 17.3
2341012 17 2341012 2 Comparable within 2% of housing and dwelling units
2340209 16.2 2340209 9 high comparability
2340202 14.3 2340202 0 perfect comparability
2341110 3.5 2341102 5 1996 CD split into three 2001 CDs - comparability high
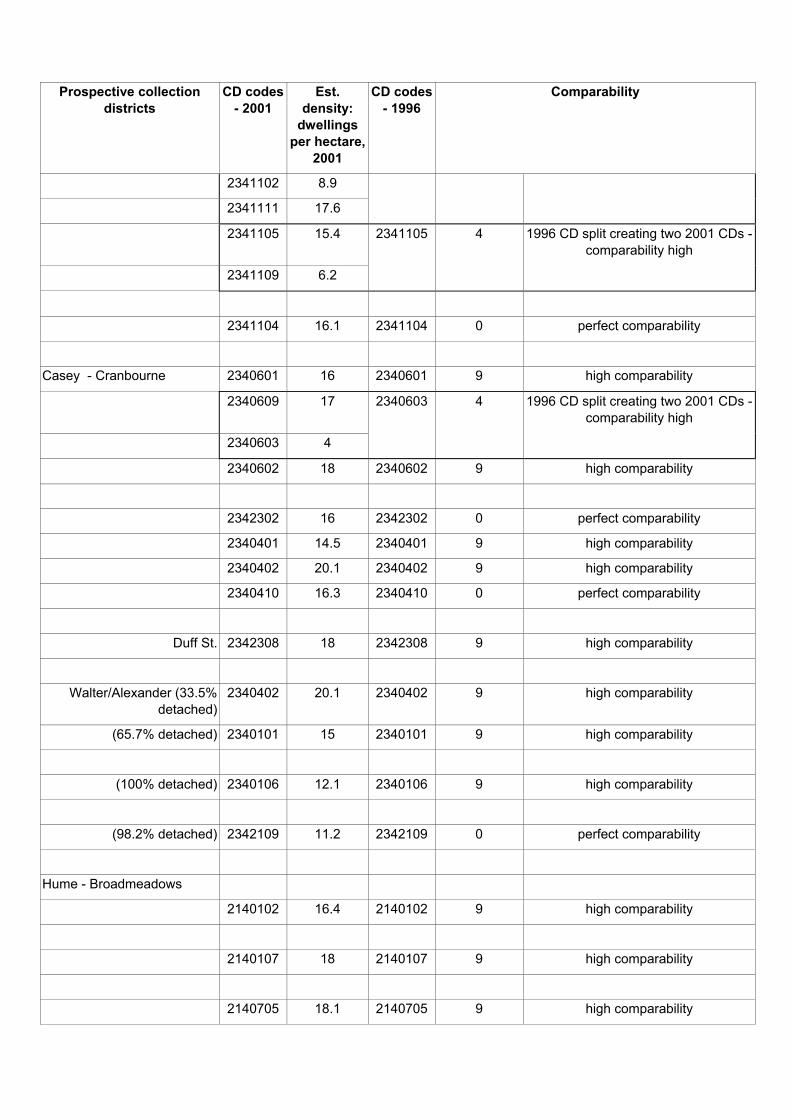
Prospective collection districts
CD codes - 2001
Est. density:
dwellings per hectare,
2001
CD codes - 1996
Comparability
2341102 8.9
2341111 17.6
2341105 15.4 2341105 4 1996 CD split creating two 2001 CDs -comparability high
2341109 6.2
2341104 16.1 2341104 0 perfect comparability
Casey - Cranbourne 2340601 16 2340601 9 high comparability
2340609 17 2340603 4 1996 CD split creating two 2001 CDs -comparability high
2340603 4
2340602 18 2340602 9 high comparability
2342302 16 2342302 0 perfect comparability
2340401 14.5 2340401 9 high comparability
2340402 20.1 2340402 9 high comparability
2340410 16.3 2340410 0 perfect comparability
Duff St. 2342308 18 2342308 9 high comparability
Walter/Alexander (33.5% detached)
2340402 20.1 2340402 9 high comparability
(65.7% detached) 2340101 15 2340101 9 high comparability
(100% detached) 2340106 12.1 2340106 9 high comparability
(98.2% detached) 2342109 11.2 2342109 0 perfect comparability
Hume - Broadmeadows
2140102 16.4 2140102 9 high comparability
2140107 18 2140107 9 high comparability
2140705 18.1 2140705 9 high comparability
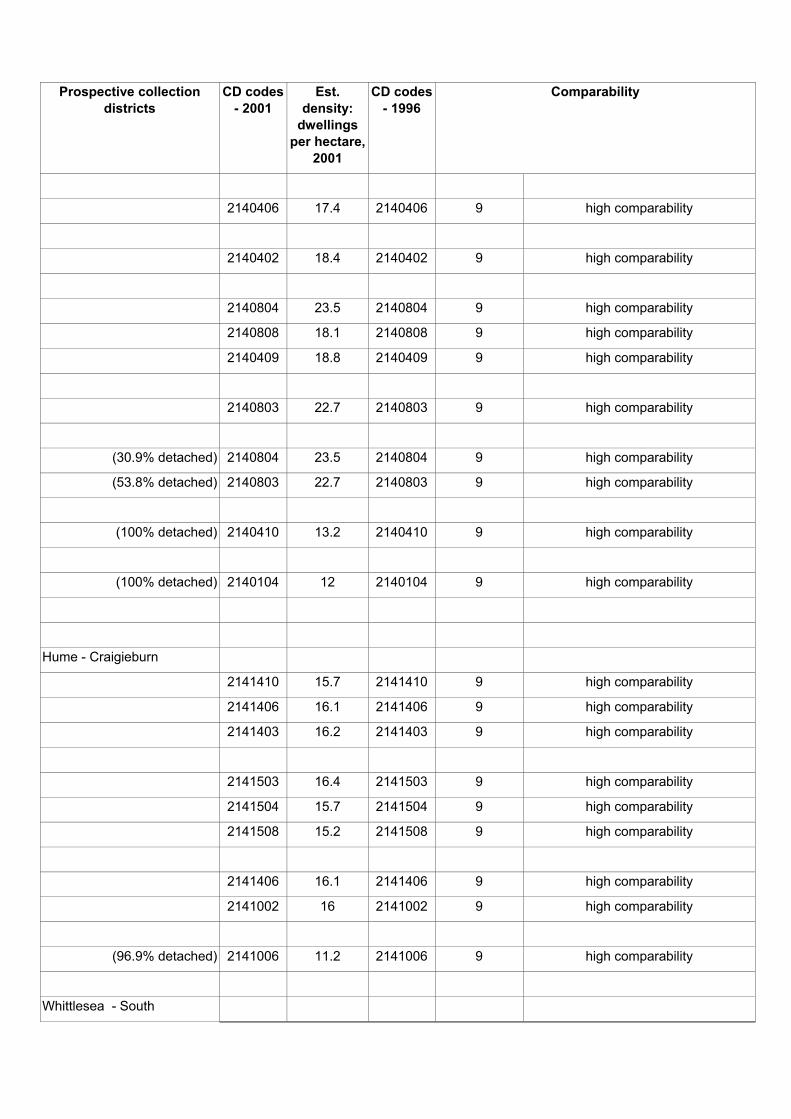
Prospective collection districts
CD codes - 2001
Est. density:
dwellings per hectare,
2001
CD codes - 1996
Comparability
2140406 17.4 2140406 9 high comparability
2140402 18.4 2140402 9 high comparability
2140804 23.5 2140804 9 high comparability
2140808 18.1 2140808 9 high comparability
2140409 18.8 2140409 9 high comparability
2140803 22.7 2140803 9 high comparability
(30.9% detached) 2140804 23.5 2140804 9 high comparability
(53.8% detached) 2140803 22.7 2140803 9 high comparability
(100% detached) 2140410 13.2 2140410 9 high comparability
(100% detached) 2140104 12 2140104 9 high comparability
Hume - Craigieburn
2141410 15.7 2141410 9 high comparability
2141406 16.1 2141406 9 high comparability
2141403 16.2 2141403 9 high comparability
2141503 16.4 2141503 9 high comparability
2141504 15.7 2141504 9 high comparability
2141508 15.2 2141508 9 high comparability
2141406 16.1 2141406 9 high comparability
2141002 16 2141002 9 high comparability
(96.9% detached) 2141006 11.2 2141006 9 high comparability
Whittlesea - South
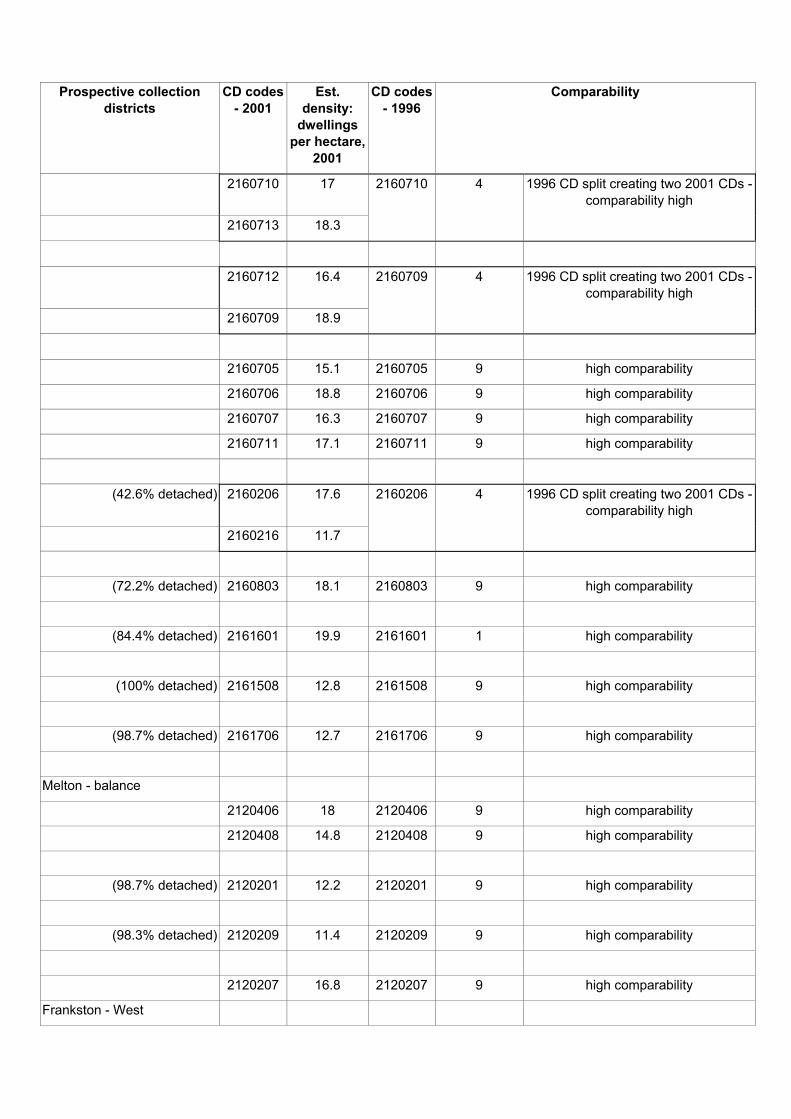
Prospective collection districts
CD codes - 2001
Est. density:
dwellings per hectare,
2001
CD codes - 1996
Comparability
2160710 17 2160710 4 1996 CD split creating two 2001 CDs -comparability high
2160713 18.3
2160712 16.4 2160709 4 1996 CD split creating two 2001 CDs -comparability high
2160709 18.9
2160705 15.1 2160705 9 high comparability
2160706 18.8 2160706 9 high comparability
2160707 16.3 2160707 9 high comparability
2160711 17.1 2160711 9 high comparability
(42.6% detached) 2160206 17.6 2160206 4 1996 CD split creating two 2001 CDs -comparability high
2160216 11.7
(72.2% detached) 2160803 18.1 2160803 9 high comparability
(84.4% detached) 2161601 19.9 2161601 1 high comparability
(100% detached) 2161508 12.8 2161508 9 high comparability
(98.7% detached) 2161706 12.7 2161706 9 high comparability
Melton - balance
2120406 18 2120406 9 high comparability
2120408 14.8 2120408 9 high comparability
(98.7% detached) 2120201 12.2 2120201 9 high comparability
(98.3% detached) 2120209 11.4 2120209 9 high comparability
2120207 16.8 2120207 9 high comparability
Frankston - West
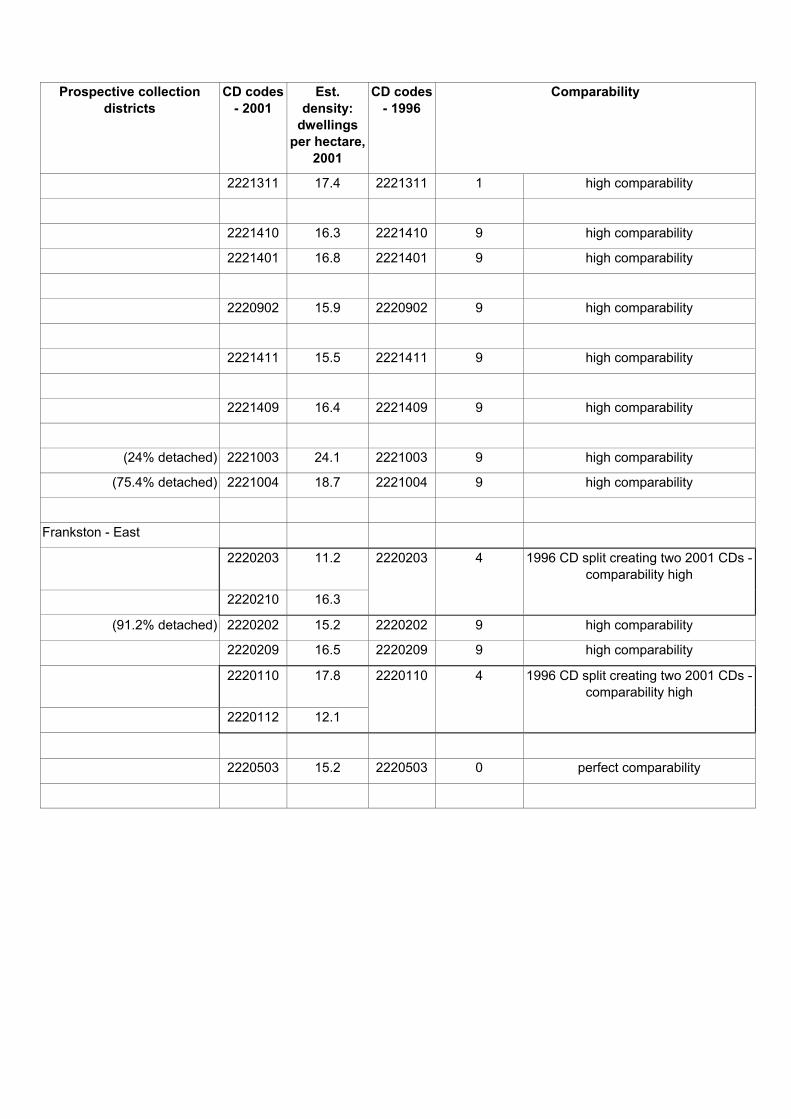
Prospective collection districts
CD codes - 2001
Est. density:
dwellings per hectare,
2001
CD codes - 1996
Comparability
2221311 17.4 2221311 1 high comparability
2221410 16.3 2221410 9 high comparability
2221401 16.8 2221401 9 high comparability
2220902 15.9 2220902 9 high comparability
2221411 15.5 2221411 9 high comparability
2221409 16.4 2221409 9 high comparability
(24% detached) 2221003 24.1 2221003 9 high comparability
(75.4% detached) 2221004 18.7 2221004 9 high comparability
Frankston - East
2220203 11.2 2220203 4 1996 CD split creating two 2001 CDs -comparability high
2220210 16.3
(91.2% detached) 2220202 15.2 2220202 9 high comparability
2220209 16.5 2220209 9 high comparability
2220110 17.8 2220110 4 1996 CD split creating two 2001 CDs -comparability high
2220112 12.1
2220503 15.2 2220503 0 perfect comparability
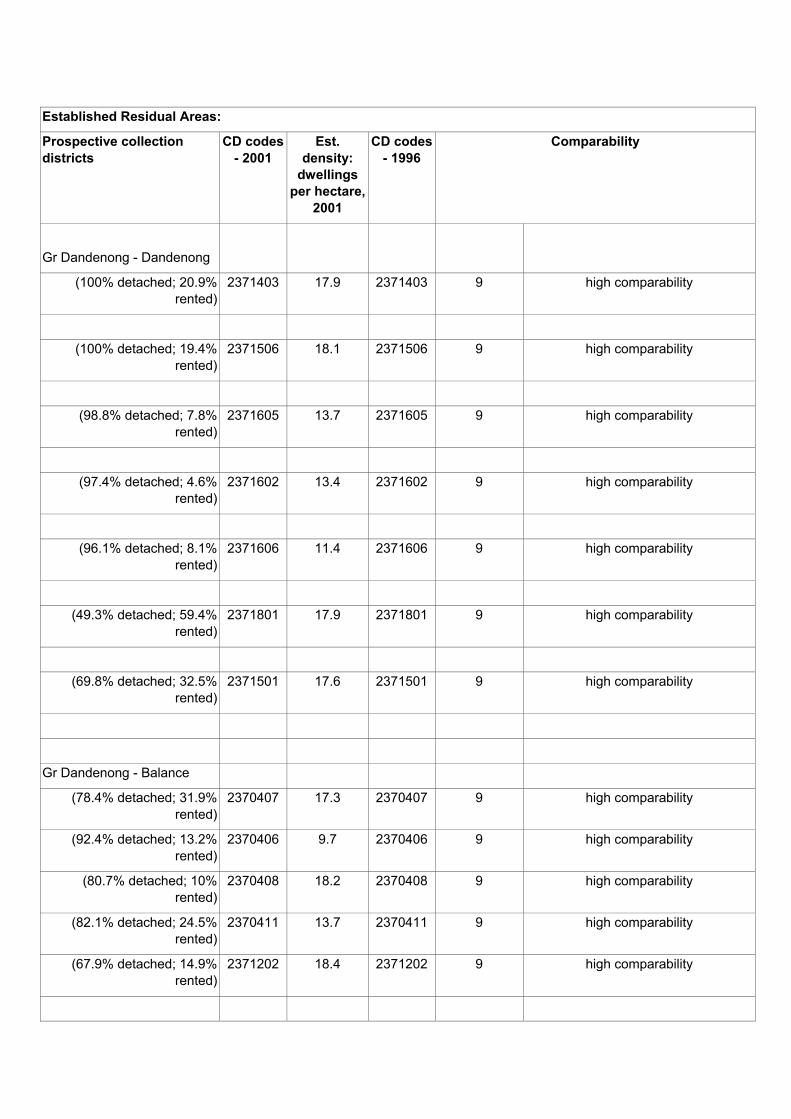
Established Residual Areas:
Prospective collection districts
CD codes - 2001
Est. density:
dwellings per hectare,
2001
CD codes - 1996
Comparability
Gr Dandenong - Dandenong
(100% detached; 20.9% rented)
2371403 17.9 2371403 9 high comparability
(100% detached; 19.4% rented)
2371506 18.1 2371506 9 high comparability
(98.8% detached; 7.8% rented)
2371605 13.7 2371605 9 high comparability
(97.4% detached; 4.6% rented)
2371602 13.4 2371602 9 high comparability
(96.1% detached; 8.1% rented)
2371606 11.4 2371606 9 high comparability
(49.3% detached; 59.4% rented)
2371801 17.9 2371801 9 high comparability
(69.8% detached; 32.5% rented)
2371501 17.6 2371501 9 high comparability
Gr Dandenong - Balance
(78.4% detached; 31.9% rented)
2370407 17.3 2370407 9 high comparability
(92.4% detached; 13.2% rented)
2370406 9.7 2370406 9 high comparability
(80.7% detached; 10% rented)
2370408 18.2 2370408 9 high comparability
(82.1% detached; 24.5% rented)
2370411 13.7 2370411 9 high comparability
(67.9% detached; 14.9% rented)
2371202 18.4 2371202 9 high comparability
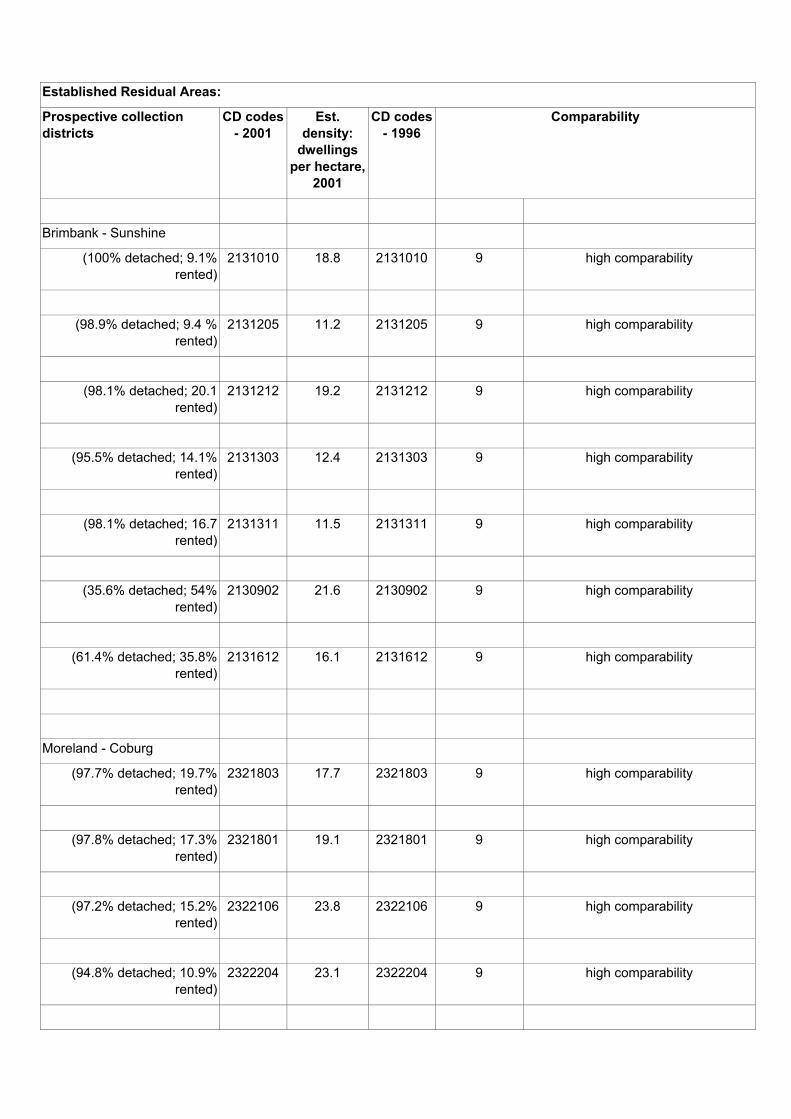
Established Residual Areas:
Prospective collection districts
CD codes - 2001
Est. density:
dwellings per hectare,
2001
CD codes - 1996
Comparability
Brimbank - Sunshine
(100% detached; 9.1% rented)
2131010 18.8 2131010 9 high comparability
(98.9% detached; 9.4 % rented)
2131205 11.2 2131205 9 high comparability
(98.1% detached; 20.1 rented)
2131212 19.2 2131212 9 high comparability
(95.5% detached; 14.1% rented)
2131303 12.4 2131303 9 high comparability
(98.1% detached; 16.7 rented)
2131311 11.5 2131311 9 high comparability
(35.6% detached; 54% rented)
2130902 21.6 2130902 9 high comparability
(61.4% detached; 35.8% rented)
2131612 16.1 2131612 9 high comparability
Moreland - Coburg
(97.7% detached; 19.7% rented)
2321803 17.7 2321803 9 high comparability
(97.8% detached; 17.3% rented)
2321801 19.1 2321801 9 high comparability
(97.2% detached; 15.2% rented)
2322106 23.8 2322106 9 high comparability
(94.8% detached; 10.9% rented)
2322204 23.1 2322204 9 high comparability
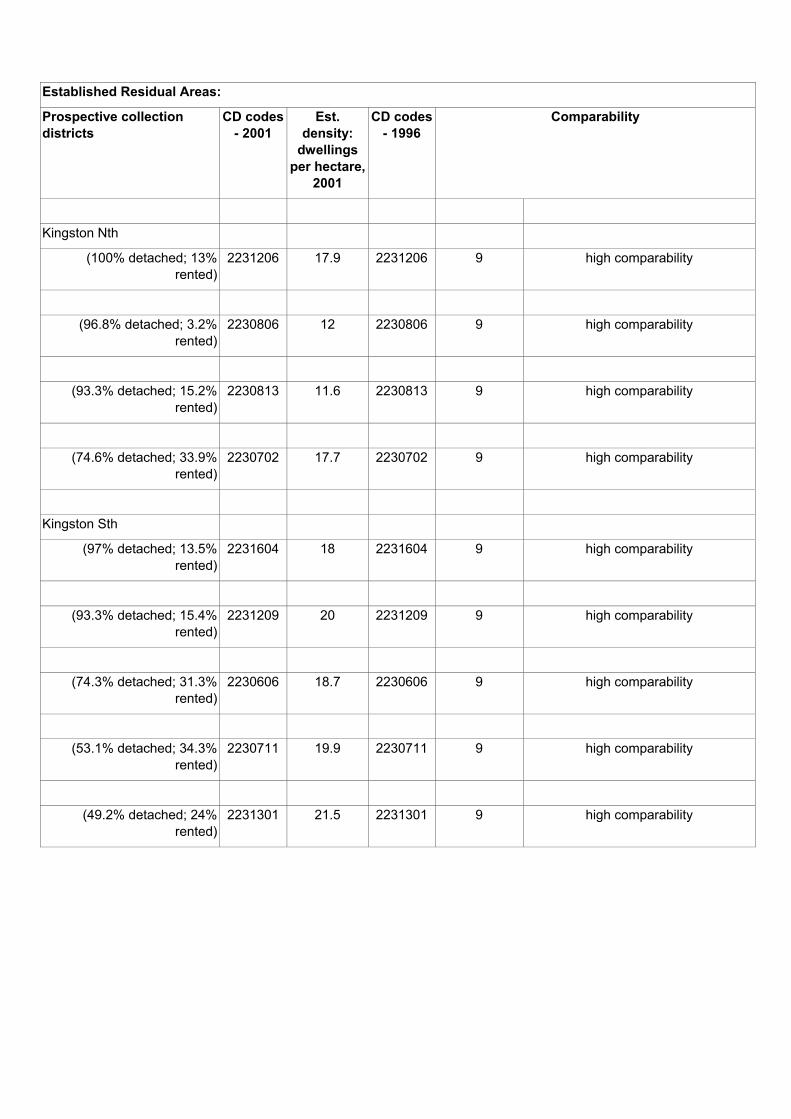
Established Residual Areas:
Prospective collection districts
CD codes - 2001
Est. density:
dwellings per hectare,
2001
CD codes - 1996
Comparability
Kingston Nth
(100% detached; 13% rented)
2231206 17.9 2231206 9 high comparability
(96.8% detached; 3.2% rented)
2230806 12 2230806 9 high comparability
(93.3% detached; 15.2% rented)
2230813 11.6 2230813 9 high comparability
(74.6% detached; 33.9% rented)
2230702 17.7 2230702 9 high comparability
Kingston Sth
(97% detached; 13.5% rented)
2231604 18 2231604 9 high comparability
(93.3% detached; 15.4% rented)
2231209 20 2231209 9 high comparability
(74.3% detached; 31.3% rented)
2230606 18.7 2230606 9 high comparability
(53.1% detached; 34.3% rented)
2230711 19.9 2230711 9 high comparability
(49.2% detached; 24% rented)
2231301 21.5 2231301 9 high comparability
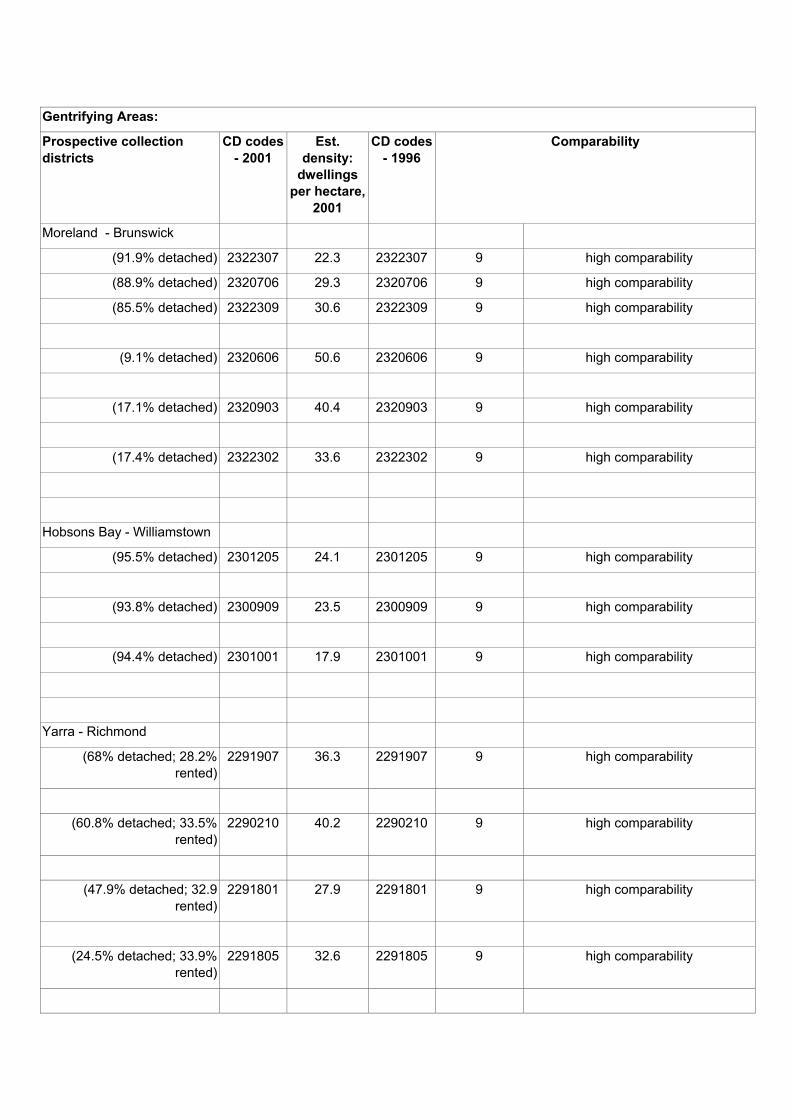
Gentrifying Areas:
Prospective collection districts
CD codes - 2001
Est. density:
dwellings per hectare,
2001
CD codes - 1996
Comparability
Moreland - Brunswick
(91.9% detached) 2322307 22.3 2322307 9 high comparability
(88.9% detached) 2320706 29.3 2320706 9 high comparability
(85.5% detached) 2322309 30.6 2322309 9 high comparability
(9.1% detached) 2320606 50.6 2320606 9 high comparability
(17.1% detached) 2320903 40.4 2320903 9 high comparability
(17.4% detached) 2322302 33.6 2322302 9 high comparability
Hobsons Bay - Williamstown
(95.5% detached) 2301205 24.1 2301205 9 high comparability
(93.8% detached) 2300909 23.5 2300909 9 high comparability
(94.4% detached) 2301001 17.9 2301001 9 high comparability
Yarra - Richmond
(68% detached; 28.2% rented)
2291907 36.3 2291907 9 high comparability
(60.8% detached; 33.5% rented)
2290210 40.2 2290210 9 high comparability
(47.9% detached; 32.9 rented)
2291801 27.9 2291801 9 high comparability
(24.5% detached; 33.9% rented)
2291805 32.6 2291805 9 high comparability
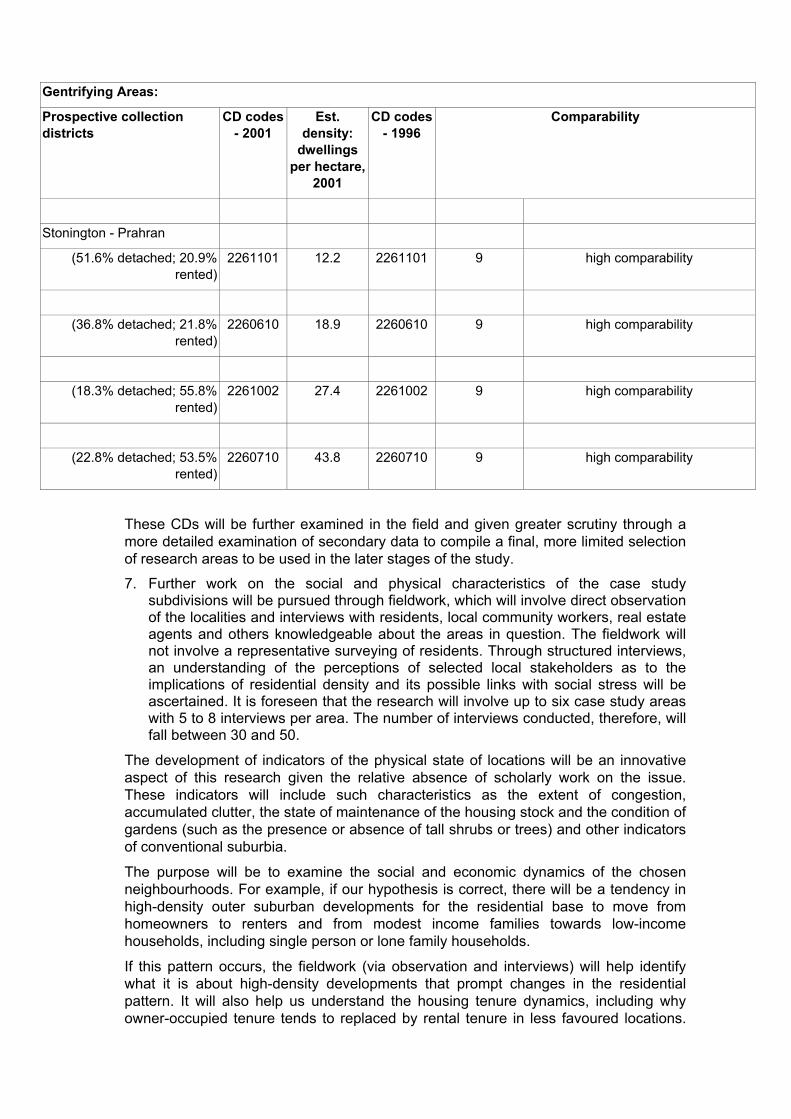
Gentrifying Areas:
Prospective collection districts
CD codes - 2001
Est. density:
dwellings per hectare,
2001
CD codes - 1996
Comparability
Stonington - Prahran
(51.6% detached; 20.9% rented)
2261101 12.2 2261101 9 high comparability
(36.8% detached; 21.8% rented)
2260610 18.9 2260610 9 high comparability
(18.3% detached; 55.8% rented)
2261002 27.4 2261002 9 high comparability
(22.8% detached; 53.5% rented)
2260710 43.8 2260710 9 high comparability
These CDs will be further examined in the field and given greater scrutiny through a more detailed examination of secondary data to compile a final, more limited selection of research areas to be used in the later stages of the study.
7. Further work on the social and physical characteristics of the case study subdivisions will be pursued through fieldwork, which will involve direct observation of the localities and interviews with residents, local community workers, real estate agents and others knowledgeable about the areas in question. The fieldwork will not involve a representative surveying of residents. Through structured interviews, an understanding of the perceptions of selected local stakeholders as to the implications of residential density and its possible links with social stress will be ascertained. It is foreseen that the research will involve up to six case study areas with 5 to 8 interviews per area. The number of interviews conducted, therefore, will fall between 30 and 50.
The development of indicators of the physical state of locations will be an innovative aspect of this research given the relative absence of scholarly work on the issue. These indicators will include such characteristics as the extent of congestion, accumulated clutter, the state of maintenance of the housing stock and the condition of gardens (such as the presence or absence of tall shrubs or trees) and other indicators of conventional suburbia.
The purpose will be to examine the social and economic dynamics of the chosen neighbourhoods. For example, if our hypothesis is correct, there will be a tendency in high-density outer suburban developments for the residential base to move from homeowners to renters and from modest income families towards low-income households, including single person or lone family households.
If this pattern occurs, the fieldwork (via observation and interviews) will help identify what it is about high-density developments that prompt changes in the residential pattern. It will also help us understand the housing tenure dynamics, including why owner-occupied tenure tends to replaced by rental tenure in less favoured locations.
The interviews will seek to establish who are the landlords, what their motives are (is it capital gain or rental income) and their attitudes towards the maintenance of their properties and their long term plans for their properties.
The field work will also be important in analysing the social processes at work in high and low density areas and the ways these social processes operate in circumstances where the social make-up of areas differ. It is our hypothesis that high-density areas can exacerbate community relations where people are closely packed and where the functions of play, transport and gardening tend to conflict with each other. However, it may be that residents with different social characteristics react to such circumstances differently. Areas with more low income, lone parent or child-intensive locations may find more difficulty coping than residents of higher income, less child-intensive areas. The reaction may also vary according to the ethnic make up of the area.
8. Integrating the statistical and fieldwork dimensions of the work: It will be evident that to reach valid conclusions about the processes in question will not be easy. The statistical work will give a good guide to some key characteristics of the areas chosen at point A in time and at point B five to ten years later. However, a variety of factors are likely to be involved in shaping any transition in between. These will be teased out by careful comparative examination of the attributes of each area, including via our understanding of the social and economic dynamics of any changes gained through the fieldwork.
9. The budget includes the purchase of high-resolution, time-series, aerial photographs. The reason is that one of the hypotheses guiding the work is that the look and feel of a recently developed suburb will be shaped in part by the space available to create a conventional green suburban setting. This in turn will be influenced by the amount of private space (front and backyard) and public space available for shrubs, trees and lawns. As suggested in the discussion above, an ample provision of green space within neighbourhoods may be significant in shaping public perceptions of an area and whether, in the absence of favourable cultural and other attributes, an area comes to be stigmatised as a residential area of last resort. Therefore, an accurate measurement of open space and of the potential for future greening at the neighbourhood level in the selected case study areas is important. This measurement will be obtained by utilising ortho-corrected aerial photographs overlayed with cadastral maps. The analysis of such aerial maps will also allow the amount of private and public space and trends over time to be quantified. An important additional aspect of aerial map analysis will be to measure residential densities (houses per hectare) at the neighbourhood level in the case study areas more accurately. Data at the Collector District level from the Census often tends to understate residential densities at the very local level. This is because parkland and other vacant space lower the average density for the Collector District as a whole.
In addition, aerial photographs will contribute to a more sophisticated understanding of the configuration of density (e.g. the extent to which open space is fragmented or aggregated). As found in the U.S., mapping analysis based on aerial photographs provides a means for better understanding the neighbourhood affects of dwelling configuration (Campoli and MacLean, 2002). We believe the aerial mapping component of the research is an innovative dimension of the analysis.
BIBLIOGRAPHY Australia, Australian National Audit Office, (1996-97) Audit Report No. 9,Parts 1 and 2,
Canberra.
Australian Housing and Urban Research Institute (AHURI), Re-shaping cities for a more sustainable future, - exploring the link between urban form, air quality, energy and greenhouse gas emissions, Research Monograph no. 6, November 1997.
S. Baum, R. Stimson, P. Mullins and K. O’Connor, ‘Welfare dependency in communities within Australian metropolitan regions’, People and Place, vol. no.3, 2000, 28-36.
A. Beer, ‘Spatial Inequality and Locational Disadvantage: New Perspectives on an Old Debate’, Urban Policy and Research, Vol. 12 No. 3, 1994, pp. 180-184.
R. Birrell and E. Healy, ‘Migration and the housing affordability crisis’, People and Place, vol.11 no. 3, 2003, pp. 43-55.
R. Birrell and K. O’Connor, ‘Regional Australia and the ‘new economy’, People and Place, vol. 8 no. 4., 2000, pp. 52-61
R. Birrell, and Byung-Soo Seol, ‘Sydney’s ethnic underclass’, People and Place, vol.6, no. 3, 1998, pp. 16-29
R. Birrell, K. O’Connor, and V. Rapson, ‘Explaining spatial concentrations of the poor in metropolitan Melbourne’, People and Place, vol. 7, no. 1, 1999, pp. 53-64
R. Birrell, ‘Residential relocation in Sydney and the NSW coast over the period 1991-1996’, People and Place, vol 7, no. 2., 1999, pp. 33-47
R. Birrell and V. Rapson, Cranbourne in 2001, a report prepared for the City of Casey by the Centre for Population and Urban Research, Monash, Melbourne, 2003
R. Birrell and V. Rapson, ‘How Gay in Australia’, People and Place, vol. 10 no. 4, 2002, pp.59-67.
M. Breheny, ‘The Compact City and Transport Consumption’, Transactions of the Institute of British Geographers, vol 20, 1995, pp. 81-101.
R. Boyd, The Australian Ugliness, Melbourne, Penguin Books, 1963.
R. Bunker et al., ‘The Local Impacts of Urban Consolidation in Sydney’, Urban Policy and Research, vol. 20 no. 2, 2002, pp. 143-167
T. Burke, and D. Haywood, Housing Past, Melbourne’s Housing Futures. Technical Report4, Planning Melbourne for the 21st Century, Department of Infrastructure, Melbourne, 2000.
A. Calwell, Labor’s Role in Modern Society, Melbourne, Lansdowne Press, 1963.
J. Campoli, and A. MacLean, Visualising Density, Lower Density Catalogue Images, 5 to 10.5 Units Per Acre’ Lincoln Institute of Land Policy Working Paper, 2002; www.lincolninst.edu/pubs/pub-detail.asp?id=797
M. Carliner, ‘Comment on Karen A. Danielsen, Robert E. Lang, and William Fulton’s “Retracting Suburbia: Smart Growth and the Future of Housing’, Housing Policy Debate, vol. 10 no. 3, Fannie Mae foundation, 1999.
E. Crawford, Equity and the city: the case of the east Perth redevelopment’, Urban Policy and Research, vol. 21 no. 1, 81-92, 2003
CSIRO, Division of Building, Construction and Engineering, Study into cost differentials in the housing industry, ‘Part 2: Non-Labour Market Issues’, prepared for the Department of Housing, Local Government and Community Services, June 1993.
K. Danielson, R. Lang, and W. Fulton ‘Retracting suburbia: Smart Growth and the Future of Housing’, Housing Policy Debate, Vol. 10, Issue 3, Fannie Mae Foundation, 1999.
Department of Infrastructure (1998), From Doughnut City to Café Society, Melbourne.
Department of Infrastructure, Final Report – The Standing Advisory Committee: Review of the Good Design Guide and VicCode 1, April 2000
Department of Natural Resources and Environment, A Guide to Property Values – Data and Analysis from the Records of the Valuer General, Victoria, 2001
Department of Infrastructure, Melbourne 2030: planning for sustainable growth, Melbourne, 2002.
D. Dunstan, Australia: A Personal View, Sydney, Kangaroo Press.
G. Easterbrook, ‘Comment on Karen A. Danielsen, Robert E. Lang, and William Fulton’s “Retracting Suburbia: Smart Growth and the Future of Housing’, Housing Policy Debate, vol. 10 no. 3, Fannie Mae foundation, 1999.
A. Ellaway, S. Macintyre and A. Kearns, ‘Perceptions of Place and Health in Socially Contrasting Neighbourhoods’, Urban Studies, vol. 38, no. 12, 2001, pp. 2299-2316
Energy Victoria, Environment Protection Authority, Department of Infrastructure, and Energy Research and Development Corporation (UVP), Urban Villages Project: Encouraging Sustainable Urban Form Summary Report, Melbourne, 1996.
R. Florida, Rebuilding Lower Manhattan for the Creative Age: Implications for the Greater New York Region, Paper prepared for the Regional Plan Association and the Civic Alliance, April 26, 2002
L. Frost and T. Dingle, Sustaining Suburbia: An Historical Perspective on Australia’s Growth, in P. Troy (Ed) Australian Cities – Issues Strategies and Policies for Urban Australia in the 1990s, Cambridge University Press, Melbourne, 1995, pp. 20-38.
G. Gallop, Opening Address to the Perth Future Directions Workshop, given at the Edith Cowen University, Joondalap, July 23, 2001.
G. Galster, ‘On the Nature of Neighbourhood’, Urban Studies, vol. 38 no. 12, 2001, pp. 2111-2124
C. Garnaut, Towards Metropolitan Organisation: Town Planning and the Garden City Idea, in Hamnett and Freestone (Eds) The Australian Metropolis – A Planning History, Allen & Unwin, St Leonards, pp. 46-64.
B. Gregory and B. Hunter, ‘Increasing regional inequality and the decline of manufacturing’ in P. Sheehan et al. (Eds) Dialogues on Australia’s Future, Victoria University, Melbourne, 1996, pp. 309-324.
E. Healy, ‘Census update – residential concentrations of the Vietnam-born in Melbourne and Sydney, People and Place, vol. 5, no. 3, 1997, pp. 58-66
E. Healy, ‘The emerging underclass: evidence from Melbourne and Sydney, People and Place, vol. 6, no. 1, 1998, pp. 26-34
E. Healy and B. Birrell, ‘Metropolis divided: the dynamic of spatial inequality and migrant settlement in Sydney’, People and Place, vol. 11 no. 2, 2003, pp.
B. Howe, ‘Social justice – vision and strategies’, in D. Kerr (Ed.) Reinventing Socialism, Pluto Press, Melbourne, 1992
B. Howe, ‘Reflecting on better cities’, Australian Planner, vol. 38, no. 1, 2001, pp. 38-44.
R. Juriedini and E. Healy, “A Decade of Change in Industry Employment”, People & Place vol. 6, no. 3, 1998.
M. Lennon, The Revival of Metropolitan Planning, In The Australian Metropolis: A Planning History, (S. Hamnett and R. Freestone Eds), Sydney, Allen & Unwin, 2000.
Loder and Bayly Consulting Group, (1993) Greenhouse Neighbourhood Project: the low energy suburb: summary report. Prepared for the Victorian Government's Department of Planning and Development, the Environment Protection Authority and Energy Victoria. Loder and Bayly Consulting Group, Melbourne.
C. Maher, ‘Residential mobility, locational disadvantage and spatial-equality in Australian cities’, Urban Policy and Research, Vol. 12 No. 3, 1994, pp. 185-191.
B. McLoughlin, Urban Consolidation and Urban Sprawl: A Question of Density’, Urban Policy and Research, vol. 9 no. 3, 1991, p. 148-155.
B. McLoughlin, Shaping Melbourne’s Future? Town Planning, the State and Civil Society, Melbourne, Cambridge University Press, 1992.
A. Marshall, ‘Suburb in disguise’, www.alexmarshall.org/am_articleFolder/SUBURB_IN _DISGUISE.htm, 2001.
J. Meligrana, ‘Exercising the condominium tenure option: a case study of the Canadian housing market’, Environment and Planning A, Vol. 25, 1993, pp. 961-973.
MMBW, Planning Policies for the Melbourne Metropolitan Area, November 1971, p.21.
T. Morgan, ‘East Perth has become a ‘classy’ urban village of the 21st Century’, Australian Property Journal, November, 2001
W. Morris, ‘Reshaping the Urban Design Process’, In Context, #35, Spring, 1993, p. 50.
Morrison and McMurray, ‘The inner city apartment versus the suburb: housing sub-markets in a New Zealand city’, Urban Studies, Vol. 36 No. 2, 1999, pp, 377-397
D. Myers and A. Kitsuse, The Debate Over Future Density of Development: An Interpretive Review, Lincoln Institute of Land Policy Working Paper, 1999
National Economics, State of the Regions Report 2002, Australian Local Government Association, ACT
NSW Department of Planning, Shaping Our Cities – Planning strategy for the Greater Metropolitan Region of Sydney, Newcastle, Wollongong and the Central Coast, 1998. http://www.planning.nsw.gov.au/plansforaction/metro.html
L. Neilson, Keynote Address, Facilitating Mixed Use Development, Occasional paper Series 2, A report prepared by the National Capital Planning Authority for the Better Cities Program, Canberra, Australian Government Publishing Service, 1995, pp. 3-9.
P. Newman and J. Kenworthy, Cities and Automobile Dependence: A Sourcebook, Brookfield, Vt. Gower Technical, 1989.
P. Newman, Presentation for Radio National, ‘Perspective’, November 22, 2001
A. Parkes et al., ‘What makes people dissatisfied with their neighbourhoods?’, Urban Studies, vol. 39. no. 13, 2002, pp. 2413-2438.
Queensland Department of Local Government and Planning, Official ministerial address to LGAQ Conference, September, 2003.
Queensland Government, State Budget 2003-04, Ministerial Portfolio Statement, Minister for Local Government and Planning. www.budget.qld.gov.au
L. Sandercock, Cities for Sale: Property, Politics and Urban Planning in Australia, London, Heinemann, 1975
S. Sassen, Globalisation and Its Discontents, New York, New Press, 1998.
E. Talen ‘Sense of Community and Neighbourhood Form: An Assessment of the Social Doctrine of New Urbanism’, Urban Studies, Vol 36 No. 8, 1999, pp. 1361-1379.
A. Taylor and R. Birrell, ‘Communities on the metropolitan periphery: the Sunshine Coast and Cranbourne compared’, People and Place, vol. 11, no. 1, 2003, pp. 42-53.
P. Troy, ‘The New Feudalism’, Urban Futures Journal, Vol. 2 no. 2, 1992, p. 36
Victorian Government & Melbourne City Council, Creating Prosperity: Victoria’s Capital City Policy, Melbourne, 1994.
N. Viviani, vol. 5, no. 3, ‘Vietnamese in Sydney and Melbourne in 1996: some preliminary results from the census’, People and Place, 1997, pp. 54-57
L. Wacquant, ‘Urban marginality in the coming millennium’, Urban Studies, vol. 36, no. 10, 1999, pp. 1639-1647
The West Australian, ‘Calls to limit city’s growth’, 15 September, 2003.
The West Australian, ‘Compact is the big idea’, 24 September, 2003.
Western Australian Department of Planning and Infrastructure, Dialogue with the City –Community Survey Report, 4 September, 2003.
G. Whitlam, The Whitlam Government 1972-1975, Melbourne, Viking, 1985. I. Winter and L. Bryson, ‘Economic restructuring and state intervention in Holdenist
suburbia: understanding urban poverty in Australia’, International Journal of Urban and Regional Research, vol. 22, no. 1, 1998.
M. Wulff, J. Yates and T. Burke, Low Rent Housing in Australia 1986 to 1996; How It Changed. Who does It Work For and Who Does It Fail?, Department of Family and Community Services, The Australian Housing Research Fund, Canberra, 2001
AHURI Research Centres
Sydney Research Centre
UNSW-UWS Research Centre
RMIT-NATSEM Research Centre
Swinburne-Monash Research Centre
Queensland Research Centre
Western Australia Research Centre
Southern Research Centre
Affiliates
Northern Territory University
National Community Housing Forum
Australian Housing and Urban Research Institute
Level 1 114 Flinders Street, Melbourne Victoria 3000
Phone +61 3 9660 2300 Fax +61 3 9663 5488
Email [email protected] Web www.ahuri.edu.au