household use of solid fuels 1. exposure data
TRANSCRIPT
–45–
HOUSEHOLD USE OF SOLID FUELS
1. Exposure Data
1.1 Description and determinants of use of household fuels
1.1.1 Introduction
All over the developing world, meals are cooked and homes are treated with home-made traditional stoves or open fires. These stoves are fired with either biomass fuels, such as wood, branches, twigs or dung, or coal. When these are not available, agricultural residues or even leaves and grass are used. The smoke emitted from such stoves is made up of particles and gaseous chemicals. It is estimated that as many as 70% of households in developing countries use fuels such as wood, dung and crop residues for cooking (International Energy Agency, 2002; WHO, 2006). The seemingly ‘free’ availability of biomass fuels from nature makes them the primary fuel source for household purposes.
The problems related to the use of biomass as an energy source have been an issue of concern for more than three decades. The traditional stoves commonly used for burning biomass energy have long been found to be highly inefficient and to emit copious quantities of smoke due to the incomplete combustion of fuels. This inefficiency has also had consequences on the environment, since intense collection of fuelwood has resulted in deforestation in highly populated areas. The use of such fuels has also adversely affected health. In addition, the cost involved in terms of human energy and time required to collect and process such fuel has serious implications for productivity and gender equity.
Attempts to convert households from these fuels to modern fuels or from traditional stoves to more efficient and cleaner burning stoves through reform of the energy sector or indigenous innovative technology have been very effective in some countries, but dismal or non-existent in others. This section provides a description of the various fuels and some background on their energy content and the efficiency of their use. Thereafter, the current trends and the known determinants that explain the widespread use of biomass fuels and coal are reviewed. Since indoor air pollution from the use of biomass and coal in the

46 IARC MONOGRAPHS VOLUME 95
domestic sector is largely a phenomenon of the developing world, emphasis is mainly on these countries.
1.1.2 Description of household fuels
(a) Types of solid fuel
A wide variety of fuels are used in households in developing countries for cooking and heating. Solid fuels refer to both biomass fuels and coal. The most common fuel used for cooking and heating is wood, followed by other solid biomass fuels, such as charcoal, dung, agricultural residues and sometimes even leaves and grass. These fuels are often collected from the local environment in rural areas and are purchased through markets in urban areas.
In some rural areas, farmers who own or manage livestock have the option of using a digester to turn dung and agricultural waste into biogas, which is a fuel that can be used for both heating and/or lighting. Electricity is not commonly used in developing countries for cooking, but is often used for other purposes, such as lighting and powering appliances. In China and some coal-producing regions in India and South Africa, coal is used as a cooking and heating fuel, sometimes in combination with other biomass fuels. Raw coal may be used in many forms from lumps to briquettes to fine powders. Coal may be processed as simply as forming coal balls or cakes by hand followed by sun-drying, or may undergo a sophisticated procedure, such as being blended into a uniform mixture with binders to reduce sulfur and particulate emissions and formed into briquettes designed to burn efficiently and cleanly in special stoves.
Modern fuels include liquefied petroleum gas (LPG), kerosene and electricity.
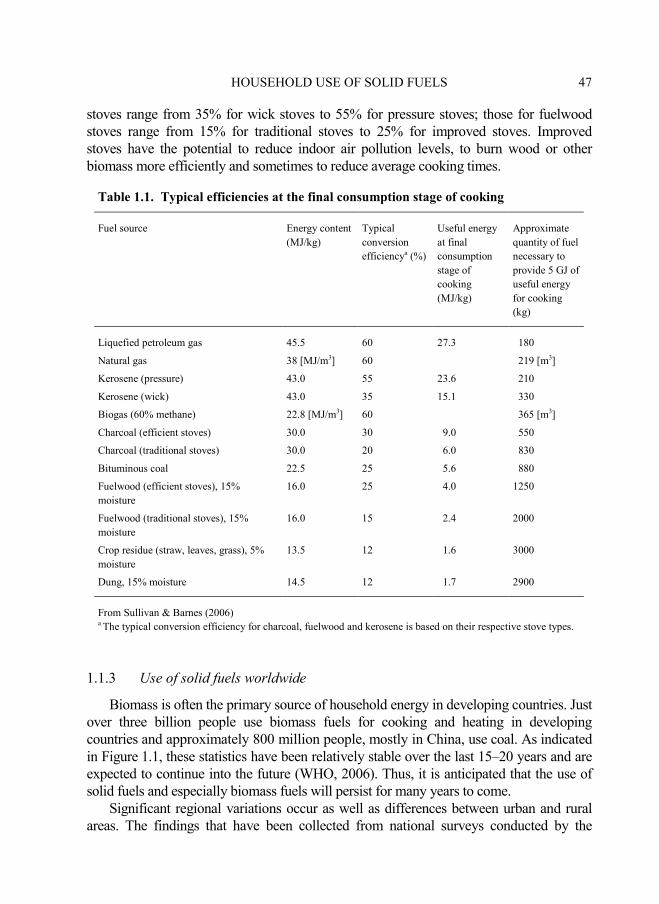
(b) Energy density and efficiency of fuels
Fuels differ in their energy densities and efficiency (Table 1.1). Modern fuels such as LPG have the highest energy content per kilogram of fuel at approximately 45 MJ/kg. In contrast, crop residues and dung have energy densities of about 14 MJ/kg of fuel. The efficiency of a fuel is measured by the amount of energy used for cooking compared with that which escapes from the stove without actually heating the food. The efficiency of cooking with LPG is estimated to be approximately 60% compared with only 12% for agricultural residues burnt in traditional stoves. This is one of the reasons that commercial fuels such as LPG are considered to be superior to crop residue and dung (see below). Coal is a highly variable fuel, and ranges from anthracite with a high heating value anthracite through various forms of bituminous coal to lignite and peat. Each of these types of coal can contain different levels of moisture, non-combustible inorganic material (ash), sulfur and sometimes significant levels of other impurities, such as arsenic, fluorine, lead and mercury.
All fuels are burned in various types of device to provide the heat necessary for cooking. The device can be relatively efficient or inefficient and be associated with high or low levels of pollution. As indicated in Table 1.1, conversion efficiencies for kerosene
HOUSEHOLD USE OF SOLID FUELS 47
stoves range from 35% for wick stoves to 55% for pressure stoves; those for fuelwood stoves range from 15% for traditional stoves to 25% for improved stoves. Improved stoves have the potential to reduce indoor air pollution levels, to burn wood or other biomass more efficiently and sometimes to reduce average cooking times.
Table 1.1. Typical efficiencies at the final consumption stage of cooking
Fuel source Energy content (MJ/kg)
Typical conversion efficiencya (%)
Useful energy at final consumption stage of cooking (MJ/kg)
Approximate quantity of fuel necessary to provide 5 GJ of useful energy for cooking (kg)
Liquefied petroleum gas 45.5 60 27.3 180
Natural gas 38 [MJ/m3] 60 219 [m3]
Kerosene (pressure) 43.0 55 23.6 210
Kerosene (wick) 43.0 35 15.1 330
Biogas (60% methane) 22.8 [MJ/m3] 60 365 [m3]
Charcoal (efficient stoves) 30.0 30 9.0 550
Charcoal (traditional stoves) 30.0 20 6.0 830
Bituminous coal 22.5 25 5.6 880
Fuelwood (efficient stoves), 15% moisture
16.0 25 4.0 1250
Fuelwood (traditional stoves), 15% moisture
16.0 15 2.4 2000
Crop residue (straw, leaves, grass), 5% moisture
13.5 12 1.6 3000
Dung, 15% moisture 14.5 12 1.7 2900
From Sullivan & Barnes (2006) a The typical conversion efficiency for charcoal, fuelwood and kerosene is based on their respective stove types.
1.1.3 Use of solid fuels worldwide
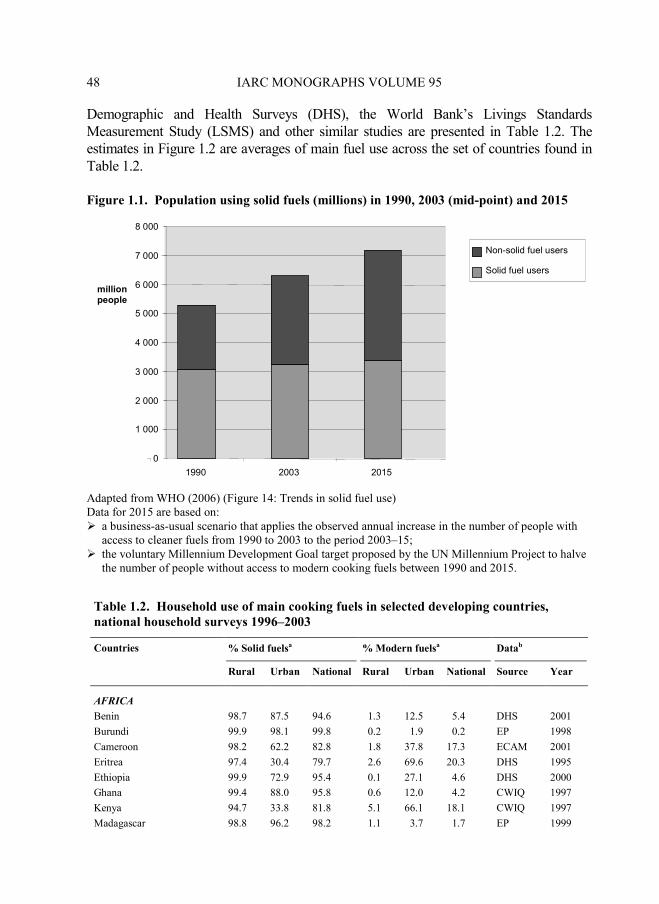
Biomass is often the primary source of household energy in developing countries. Just over three billion people use biomass fuels for cooking and heating in developing countries and approximately 800 million people, mostly in China, use coal. As indicated in Figure 1.1, these statistics have been relatively stable over the last 15–20 years and are expected to continue into the future (WHO, 2006). Thus, it is anticipated that the use of solid fuels and especially biomass fuels will persist for many years to come.
Significant regional variations occur as well as differences between urban and rural areas. The findings that have been collected from national surveys conducted by the
48 IARC MONOGRAPHS VOLUME 95
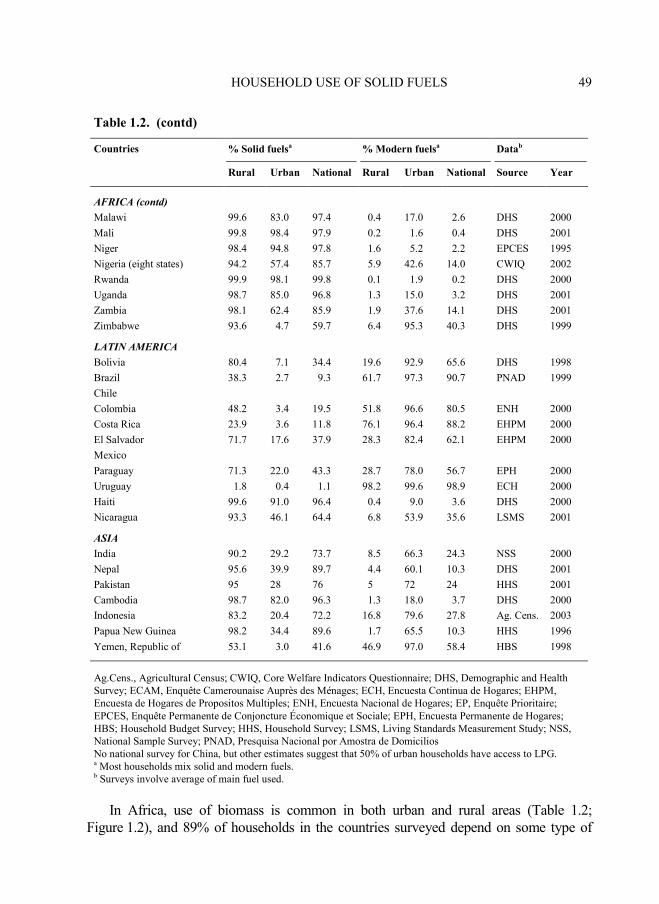
Demographic and Health Surveys (DHS), the World Bank’s Livings Standards Measurement Study (LSMS) and other similar studies are presented in Table 1.2. The estimates in Figure 1.2 are averages of main fuel use across the set of countries found in Table 1.2.
Figure 1.1. Population using solid fuels (millions) in 1990, 2003 (mid-point) and 2015
Adapted from WHO (2006) (Figure 14: Trends in solid fuel use) Data for 2015 are based on: � a business-as-usual scenario that applies the observed annual increase in the number of people with
access to cleaner fuels from 1990 to 2003 to the period 2003–15; � the voluntary Millennium Development Goal target proposed by the UN Millennium Project to halve
the number of people without access to modern cooking fuels between 1990 and 2015.
Table 1.2. Household use of main cooking fuels in selected developing countries,
national household surveys 1996–2003
% Solid fuelsa % Modern fuelsa Datab Countries
Rural Urban National Rural Urban National Source Year
AFRICA
Benin 98.7 87.5 94.6 1.3 12.5 5.4 DHS 2001
Burundi 99.9 98.1 99.8 0.2 1.9 0.2 EP 1998
Cameroon 98.2 62.2 82.8 1.8 37.8 17.3 ECAM 2001
Eritrea 97.4 30.4 79.7 2.6 69.6 20.3 DHS 1995
Ethiopia 99.9 72.9 95.4 0.1 27.1 4.6 DHS 2000
Ghana 99.4 88.0 95.8 0.6 12.0 4.2 CWIQ 1997
Kenya 94.7 33.8 81.8 5.1 66.1 18.1 CWIQ 1997
Madagascar 98.8 96.2 98.2 1.1 3.7 1.7 EP 1999
0
1 000
2 000
3 000
4 000
5 000
6 000
7 000
8 000
1990 2003 2015
million people
Solid fuel users
Non-solid fuel users
HOUSEHOLD USE OF SOLID FUELS 49
Table 1.2. (contd)
% Solid fuelsa % Modern fuelsa Datab Countries
Rural Urban National Rural Urban National Source Year
AFRICA (contd)
Malawi 99.6 83.0 97.4 0.4 17.0 2.6 DHS 2000
Mali 99.8 98.4 97.9 0.2 1.6 0.4 DHS 2001
Niger 98.4 94.8 97.8 1.6 5.2 2.2 EPCES 1995
Nigeria (eight states) 94.2 57.4 85.7 5.9 42.6 14.0 CWIQ 2002
Rwanda 99.9 98.1 99.8 0.1 1.9 0.2 DHS 2000
Uganda 98.7 85.0 96.8 1.3 15.0 3.2 DHS 2001
Zambia 98.1 62.4 85.9 1.9 37.6 14.1 DHS 2001
Zimbabwe 93.6 4.7 59.7 6.4 95.3 40.3 DHS 1999
LATIN AMERICA
Bolivia 80.4 7.1 34.4 19.6 92.9 65.6 DHS 1998
Brazil 38.3 2.7 9.3 61.7 97.3 90.7 PNAD 1999
Chile
Colombia 48.2 3.4 19.5 51.8 96.6 80.5 ENH 2000
Costa Rica 23.9 3.6 11.8 76.1 96.4 88.2 EHPM 2000
El Salvador 71.7 17.6 37.9 28.3 82.4 62.1 EHPM 2000
Mexico
Paraguay 71.3 22.0 43.3 28.7 78.0 56.7 EPH 2000
Uruguay 1.8 0.4 1.1 98.2 99.6 98.9 ECH 2000
Haiti 99.6 91.0 96.4 0.4 9.0 3.6 DHS 2000
Nicaragua 93.3 46.1 64.4 6.8 53.9 35.6 LSMS 2001
ASIA
India 90.2 29.2 73.7 8.5 66.3 24.3 NSS 2000
Nepal 95.6 39.9 89.7 4.4 60.1 10.3 DHS 2001
Pakistan 95 28 76 5 72 24 HHS 2001
Cambodia 98.7 82.0 96.3 1.3 18.0 3.7 DHS 2000
Indonesia 83.2 20.4 72.2 16.8 79.6 27.8 Ag. Cens. 2003
Papua New Guinea 98.2 34.4 89.6 1.7 65.5 10.3 HHS 1996
Yemen, Republic of 53.1 3.0 41.6 46.9 97.0 58.4 HBS 1998
Ag.Cens., Agricultural Census; CWIQ, Core Welfare Indicators Questionnaire; DHS, Demographic and Health Survey; ECAM, Enquête Camerounaise Auprès des Ménages; ECH, Encuesta Continua de Hogares; EHPM, Encuesta de Hogares de Propositos Multiples; ENH, Encuesta Nacional de Hogares; EP, Enquête Prioritaire; EPCES, Enquête Permanente de Conjoncture Économique et Sociale; EPH, Encuesta Permanente de Hogares; HBS; Household Budget Survey; HHS, Household Survey; LSMS, Living Standards Measurement Study; NSS, National Sample Survey; PNAD, Presquisa Nacional por Amostra de Domicilios No national survey for China, but other estimates suggest that 50% of urban households have access to LPG. a Most households mix solid and modern fuels. b Surveys involve average of main fuel used.
In Africa, use of biomass is common in both urban and rural areas (Table 1.2; Figure 1.2), and 89% of households in the countries surveyed depend on some type of
50 IARC MONOGRAPHS VOLUME 95
solid fuel, which includes both biomass and charcoal. In rural areas of Africa, virtually all households use biomass fuels.
Figure 1.2. Percentage use of solid fuel reported as main household cooking energy in national surveys, 1996–2003
0.0
10.0
20.0
30.0
40.0
50.0
60.0
70.0
80.0
90.0
100.0
Rural Urban
% U
sin
g s
oli
d f
ue
l
Africa
Asia
Latin America
From World Bank (2003) The figures are based on averages from the countries in Table 1.2.
In Asia, rural areas remain dependent on biomass energy, but many urban areas are increasingly switching to modern fuels (Figure 1.2). Overall, 74% of households in Asia report use of solid fuels, mostly in the form of biomass. However, in countries such as India and China, there are signs of significant change. In a case study in Hyderabad, India (World Bank, 1999; Barnes et al., 2005), most urban people in this large metropolitan area had switched to either kerosene or LPG for cooking in the 1990s (Figure 1.3). Recent national figures in India indicate that only about 20–30% of the urban population uses biomass energy, which is a significant change from 25 years ago. While rural areas are still dominated by biomass or other solid fuels, rising urban incomes and policies to facilitate the heterogeneity of modern fuel use in urban areas, including a significant conversion to kerosene and LPG in Asia, have been the main contributory factors to this trend.
The lack of regular national household energy surveys makes it impossible to quantify with confidence the state of household fuel use, but a variety of evidence can be used to establish estimates with some degree of confidence. For example, in China, the overall picture of household fuel use comes from the National Bureau of Statistics, which prepares national and provincial balances of commercial energy, excluding biofuels (e.g. National Bureau of Statistics, 2006), and the Ministry of Agriculture, which collects and occasionally publishes estimates of biofuel use by province (e.g. EBCREY, 1999). Published data do, however, show that more than 51% of urban households have access

HOUSEHOLD USE OF SOLID FUELS 51
Figure 1.3. Changes in choice of household cooking fuel in Hyderabad from
1982 to 1994
0%
20%
40%
60%
80%
100%
1982 1994
% H
ouseholds using fuels
% H
ouseholds using fuels
% H
ouseholds using fuels
% H
ouseholds using fuels
Wood and
kerosene
Kerosene
only
Kerosene and
LPG
LPG only
LPG only
Wood and kerosene
Kerosene
only
Kerosene
and LPG
Wood only
From Barnes et al. (2005) LPG, liquefied petroleum gas
to gas fuels (National Bureau of Statistics, 2005). While access to gas in rural areas is growing, fewer than 10% of rural households use gas fuels as their main cooking fuel (Sinton et al., 2004a). All but about 1% of households have at least nominal access to electricity. Despite the rapidly growing availability of electricity and gas, coal and especially biomass remain the overwhelming energy sources for households nationwide (Figure 1.4).
In Latin America, although some extremely poor countries such as Haiti have fuel use patterns that are similar to those seen in Africa, many other countries are switching to modern cooking fuels such as kerosene and LPG (Table 1.2). With the exception of a few countries, less than 10% of the populations in most urban areas in Latin America use biomass energy for cooking (Table 1.2), and the use of modern fuels is also growing in rural areas. For instance, in rural Costa Rica, the use of biomass energy has declined to less than one-quarter of its population, the majority of which has switched to modern fuels.
The transition from biomass fuels to modern fuels has been associated with improvement in economic prosperity and development (Figure 1.5). At very low levels of income or development, households depend on biomass fuels such as agricultural waste, dung or firewood. As incomes rise or the country becomes more developed, households
52 IARC MONOGRAPHS VOLUME 95
Figure 1.4. Total residential primary energy use in China
10
8
Biomass
6 Coal
Electricity
4 Gas fuels
2
0
1994 1995 1996 1997 1998 1999 2000 2001 2002 2003 2004
From International Energy Agency (2006a,b)
Figure 1.5. Transition from use of biomass fuels to use of modern fuels
From WHO (2006) (Figure 2: The energy ladder: household energy and development inextricably linked) Note: Ethanol and methanol are rarely, if ever, used. Dash: estimate
Tot
al r
esid
enti
al e
nerg
y us
e (1
018J)
Crop waste, dung
Increasing prosperity and development
Wood
Charcoal
Kerosene
Gas, liquefied petroleum gas
Ethanol, methanol
Solid fuels
Non-solid fuels
Electricity
Incre
asin
g u
se o
f cle
an
er,
mo
re e
ffic
ien
t an
d m
ore
co
nven
ien
t fu
els
fo
r co
okin
g
Coal
Natural gas
Very low
income
Low income Middle income High income
HOUSEHOLD USE OF SOLID FUELS 53
begin to convert to non-solid fuels such as kerosene, LPG or electricity. At middle income levels, households typically use both solid and non-solid fuels.
All over the developing world, significant variations in the use of biomass energy and coal are observed. Both rural and urban populations are switching to modern fuels. However, it is known that very poor countries generally can not afford to use modern fuels, and the richest of countries have already adopted them due to their convenience and cleanliness (see Section 1.4 on intervention and policies).
1.1.4 Determinants of choice of fuel and energy use
Most studies have found that three factors determine the choice of fuel (Leach, 1987; Leach & Mearns, 1988; Boberg, 1993; Barnes et al., 2005). The first is access to both modern fuels and to local biomass; the second involves affordability, as determined by household income, since modern fuels must be purchased on the market; the third is the policy options available, such as prices, subsidies and taxes, to reduce dependence on biomass.
(a) Availability and access to biomass and modern energy
The evolution of energy markets in developing countries is irregular. For modern fuels, the institutions that serve both urban and rural markets can be diverse: in some countries, government-run agencies control the flow of kerosene and LPG; in others, there is one dominant supplier that has a virtual monopoly; and in some others, a significant degree of competition exists among a limited number of private companies. In contrast, the supply of biomass is generally characterized by self production or collection of the fuel, local sales, or a market chain that spreads out from urban to rural areas. There is growing evidence that, if households have access to a variety of fuels, a greater acceptance of modern fuels occurs not only in urban (Barnes et al., 2005) but also often in some rural areas.
The type of biomass used in an area largely depends on what is available in the local environment. In Africa, wood is more readily available than in most other parts of the developing world. Most people rely on firewood in rural areas and both firewood and charcoal in urban areas to cook their meals. The use of wood, branches and, increasingly, brush is widespread in Asia and Africa. Dung cakes or balls are used more commonly in Asia and Latin America.
As wood becomes scarce due to deforestation, the use of agricultural residues as a source of energy increases. Crop residues are a very poor source of energy for cooking. In countries in Africa, charcoal is widely available and is thus used to almost the same extent as wood fuels. In China, coal is commonly used to cook and heat. In Bangladesh, a very densely populated country, the amount of local wood available to people is decreasing. A recent survey in Bangladesh (World Bank, 2006) indicated that people who live in areas where access to firewood from the local environment is minimal are turning towards
54 IARC MONOGRAPHS VOLUME 95
tree leaves, crop residue and dung (Table 1.3). In this situation, people are actually moving
Table 1.3. Consumption of energy in domestic activities: all divisions (per household/year: average over all households) in Bangladesh (2005)
Heating Type of energy All use
Cooking Parboiling rice Other
Biomass
Firewood (kg) Tree leaves (kg) Crop residue (kg) Dung cake/stick (kg) Saw dust (kg) Non-biomass
Candle (piece) Kerosene (litre) Natural gas (Tk.) LPG/LNG (litre) Grid electricity (kWh) Solar PV (kWh) Storage cell (kWh) Dry cell battery (piece)
1186 502 708 524 8 16 29 10 0.05 144 0.53 0.55 15
1065 471 539 504 8 – 1.8 10 0.05 0.25 – – –
29 30 164 16 0.02 – – – – – – – –
93 0.9 2.7 4.2 0.02 – 0.07 – – 4.00 – – –
From Asaduzzaman & Latif (2005)
down the energy ladder to lower and more polluting fuels. In Bangladesh, very little LPG is available in rural areas. In urban areas, the development of modern cities has resulted in a gradual decline in the use of biomass energy.
As seen in Table 1.4, when the population of a city reaches about 1 million, the use of biomass energy declines sharply, since access to local biomass energy becomes difficult. However, energy policies also play a role in the choice of household fuel. Thus, access to both biomass and modern fuels is an extremely important element in the choice of household fuel.
Table 1.4. Size and energy use in 45 cities in Bangladesh, 1980–88
Fuel (%) City type Population (in thousands)
Monthly income (US $ per capita) Firewood Charcoal Kerosene LPG Electricity
Town 33 38 52 40 33 46 64
Small city 102 41 25 36 37 60 78
Middle city 526 35 47 53 64 23 69
Large city 3718 55 4 28 61 37 95
From World Bank (1988, 1989, 1990a,b,c,d, 1991a,b, 1992, 1993, 1996a, 1999) (hereinafter ESMAP Household Energy Surveys) LPG, liquefied petroleum gas
HOUSEHOLD USE OF SOLID FUELS 55
(b) Income and affordability
Poverty is inextricably linked to the use of biomass. Most homes in developing countries use biomass energy, but there is a growing transition to modern fuels as well as a trend in the opposite direction. Modern fuels cost money–when households can afford to move up the energy ladder and access to modern fuels is not an issue, the transition is almost inevitable.
Affordability is only an issue if there is adequate access to modern fuels, which is often dictated by whether a household lives in an urban or a rural area. In many developing countries, an interesting pattern can be seen between income and fuel use. In the urban areas of India, Nepal, Guatemala and Nicaragua, for instance, the type of fuels used is dependent upon household income: solid fuels are more common among the poorer households and modern fuels are used by the rich. In some large urban areas, even the poor use kerosene and, in some instances, LPG for cooking. In contrast, in the rural areas of these countries, income has less influence on the type of fuel used. Across households of all income classes, solid fuels are common (World Bank, 2003).
In rural areas, affordability largely contributes to the widespread use of biomass energy. Households in rural areas are generally poor and biomass is often available to them from the local environment. The price of using biomass energy is simply the labour required in collecting it (World Bank, 1996a,b; WHO, 2006).
The amount of money spent by the poor on the small quantities of energy that they use is a very important portion of their overall household expenditure. The poor spend less on energy than the more wealthy households, but the percentage of income that they spend on energy is typically much greater. The urban poor spend between 10 and 20% of their income on energy, whereas the wealthy spend less than 5%.
In addition, the cost of energy services for the poor is also higher than that for the rich because cooking with fuelwood and lighting with kerosene are inefficient compared with cooking and lighting with modern fuels. Moreover, the poor often buy fuelwood and charcoal in small amounts, and the higher transaction costs of buying in small quantities inflate the price. Once the comparative efficiencies and transaction costs have been taken into consideration, the delivered energy for cooking often is more expensive for poorer people than for wealthy households.
Poorer people generally use biomass energy except under unusual circumstances. One study based on evidence from 45 cities has classified general points at which people switch from biomass to modern fuels (Barnes et al., 2005). Based on income figures given in 1980 US dollars, the study indicated that people start switching from wood at surprisingly low incomes–between US $12 and US $30 per person per month. However, where wood is inexpensive and readily available, people may continue its use at incomes of up to US $100 per person per month. The use of modern fuels, including electricity and LPG, generally intensifies at incomes of about US $40–50 per person per month. This suggests that definitive income ‘cut-offs’ for fuel substitution can not be identified precisely, only very broadly. The reason for this is the variation in access, pricing and
56 IARC MONOGRAPHS VOLUME 95
government policies. In addition, the study found that modern fuel consumption was higher than that anticipated among poorer households. This can reflect both the attractiveness of modern fuels and particular subsidy policies for some fuels; for example, subsidies for kerosene in Indonesia, coal in China and LPG in some countries.
1.1.5 Conclusion
The negative impact of biomass energy on the daily lives of populations (especially women and children) in the poorest parts of the developing world cannot be underestimated. Furthermore, evidence would strongly suggest that the persistent and widespread use of biomass energy largely depends on the factors of access, affordability and pricing policies.
1.2 Constituents of emissions
Wood consists primarily of two polymers: cellulose (50–70% by weight) and lignin (approximately 30% by weight) (Simoneit et al., 1999). Other biomass fuels (e.g. grasses, wheat stubble) also contain these polymers, although their relative proportions differ. In addition, small amounts of low-molecular-weight organic compounds (e.g. resins, waxes, sugars) and inorganic salts are present in wood. During combustion, pyrolysis occurs and the polymers break apart to produce a variety of smaller molecules. Even when they are intrinsically free of contaminants, biomass fuels and coals are difficult to burn in small simple combustion devices such as household cooking and heating stoves without substantial emissions of pollutants, principally due to the difficulty of completely pre-mixing the fuel and air during burning, which is easily done with liquid and gaseous fuels. Consequently, a substantial fraction of the fuel carbon is converted to products of incomplete combustion, i.e. compounds other than the ultimate product of complete combustion, carbon dioxide. For example, typical household coal and biomass stoves in China and India divert between more than 10% and up to ~30% of their fuel carbon into products of incomplete combustion (Smith et al., 2000; Zhang et al., 2000). Emissions of products of incomplete combustion from coal and biomass overlap largely depending on fuel species and stove types.
An individual product of incomplete combustion can be present in the gas phase, particle phase or both phases, depending on its volatility. Hence, products of incomplete combustion released from the combustion of biomass are a complex mixture of particulate and gaseous chemical species, including carbon monoxide, nitrogen dioxide and particulate matter (PM). Products of incomplete combustion also include a large number of hydrocarbons that are precursor components of photochemical smog and comprise ozone, aldehydes and particles (Tsai et al., 2003). Compared with biomass, many coals contain more intrinsic contaminants from their mineral deposits, such as sulfur, arsenic, silica, fluorine, lead and/or mercury. During combustion, these contaminants are not destroyed but are released into the air in their original or oxidized
HOUSEHOLD USE OF SOLID FUELS 57
form. Therefore, coal combustion tends to emit other pollutants in addition to products of incomplete combustion. In households that use sulfur-rich coals, for example, sulfur dioxide is present at elevated levels. Since the temperature of coal combustion is normally substantially higher than that of biomass combustion, higher emissions of oxides of nitrogen were measured for household coal combustion than for biomass combustion (Zhang et al., 2000).
Depending on the measurement and analytical methods used, the chemical constituents of biomass and coal smoke have been reported in different studies in the form of individual chemical compounds (e.g. carbon monoxide, benzene, formaldehyde), groups of compounds (e.g. total non-methane hydrocarbon, total organic carbon), elements (e.g. carbon, arsenic) or ions (e.g. fluoride, sulfate). The smoke constituents identified to date are summarized in Tables 1.5–1.7, by class of compound, element and ion, respectively. It should be noted that many of the wood smoke species reported in Table 1.5 were isolated from measurements of US appliances (e.g. woodstoves, fireplaces) and open-field combustion (e.g. wild fire, prescribed forest fire), because few studies have been conducted to characterize detailed chemical speciation for biomass stoves in developing countries. Compounds that are present in emissions from the combustion of wood or coal and have been evaluated by the IARC are listed in Table 1.8. One study has reported emission factors of some 60 hydrocarbons and ~17 aldehydes and ketones from ~28 commonly used fuel/stove combinations in China and emission factors of hydrocarbons from 28 fuel/stove combinations commonly used in India in the early 1990s (Smith et al., 2000; Zhang et al., 2000). In contrast, several hundred individual compounds have been detected in smoke samples of residential wood combustion, wildfire and prescribed burns (Rogge et al., 1998; McDonald et al., 2000; Oros & Simoneit, 2001; Schauer et al., 2001; Fine et al., 2002). Although less well characterized, many of the same chemicals were reported in smoke emissions from other types of biomass, including grasses, rice straw, sugar cane and ferns (Simoneit et al., 1993, 1999; Rinehart et al., 2002). Selected chemicals that are associated with carcinogenicity are discussed below.
Table 1.5. Constituents of biomass smoke and coal smoke, by chemical class
Compound Wood smoke Coal smoke
Species References Species References
Carbon monoxide McDonald et al. (2006)
Carbon monoxide
Sulfur dioxide Sulfur dioxide
Inorganic
compounds
Nitric oxide Ammonia
Nitric oxide

58 IARC MONOGRAPHS VOLUME 95
Table 1.5. (contd)
Compound Wood smoke Coal smoke
Species References Species References
Hydrocarbons
Alkanes C1–C7 Rogge et al. (1998); McDonald et al. (2000); Schauer et al. (2001); Fine et al. (2002); McDonald et
al. (2006)
C2–C10 Yan et al. (2002); Tsai et al. (2003)
Alkenes C2–C7 (including 1,3-butadiene)
Rogge et al. (1998); McDonald et al. (2000); Fine et al. (2002); McDonald et
al. (2006)
C2–C10 (including 1,3-butadiene)
Yan et al. (2002); Tsai et al. (2003)
Aromatics Benzene Xylene Toluene Styrene
Tsai et al. (2003) McDonald et al. (2006)
Benzene Xylene Toluene Styrene
Tsai et al. (2003)
PAHs and substituted PAHs
Acenaphthene Anthracene Benz[a]anthracene Benzo[b+j+k]fluorene Benzo[ghi]perylene Benzo[a]pyrene Benzo[e]pyrene Biphenyl acenaphthylene Chrysene Coronene 1,7-Dimethylphenan-threne Fluoranthene Fluorene Indeno[123-cd]pyrene 1-Menaphthalene 2-Menaphthalene 1-Methylphenanthrene Naphthalene Phenanthrene Pyrene Retene
Chuang et al. (1992); Rogge et al. (1998); McDonald et al. (2000); Oros & Simoneit (2001); Schauer et al. (2001); Fine et al. (2002); McDonald et al. (2006)
Acenaphthene Acenaphthylene Acephenanthrylene Anthracene Benz[a]anthracene Benzanthrone Benzo[b]chrysene Benzo[a]coronene Benzo[b]fluoranthene Benzo[k]fluoranthene Benzo[b+j+k]fluorene Benzo[a]fluorine Benzo[b]naphtha[2,l-d]thiophene Benzo[pqr]naphtha[8,1,2-bcd]perylene Benzo[ghi]perylene Benzo[a]pyrene Benzo[e]pyrene Chrysene Coronene Cyclopenta[def]-chrysene-4-one
Chuang et al. (1992); Wornat et al. (2001); Ross et al. (2002); Yan et al. (2002); Chen et al. (2004, 2005); Lee et al. (2005)
HOUSEHOLD USE OF SOLID FUELS 59
Table 1.5. (contd)
Compound Wood smoke Coal smoke
Species References Species References
PAHs (contd) Cyclopent[hi]ace-phenanthrylene Cyclopenta[cd]ben-zo[ghi]perylene Cyclopenta[bc]co-ronene Cyclopenta[cd]fluo-ranthrene Cyclopenta[cd]pyrene
Dibenz[a,c]anthracene Dibenz[a,h]anthracene Dibenz[a,j]anthracene Dibenzo[b,k]fluo-ranthene Dibenzo[a,e]pyrene Dibenzo[e,l]pyrene Dicyclopenta[cd,mn]-pyrene Dicyclopenta[cd,jk]-pyrene Fluoranthene, Fluorene Indeno[123-cd]pyrene Naphtho[1,2-b]-fluoranthene Naphtho[2,1-a]pyrene 4-Oxa-benzo-[cd]pyrene-3,5-dione Phenanthrene Picene Pyrene Triphenylene Tribenzo[e,ghi,k]-perylene
Total non-methane hydrocarbon
McDonald et al. (2000); Schauer et al. (2001); McDonald et
al. (2006)
Tsai et al. (2003)
Unresolved complex mixture
Oros & Simoneit (2001); Fine et al. (2002)
60 IARC MONOGRAPHS VOLUME 95
Table 1.5. (contd)
Compound Wood smoke Coal smoke
Species References Species References
Oxygenated organics
Alkanols Methanol (+ methyl formate) Ethanol (+ acn + acrolein)
McDonald et al. (2000); Oros & Simoneit (2001); Fine et al. (2002); McDonald et al. (2006)
Carboxylic acids
Heptanoic acid Octanoic acid Nonanoic acid Decanoic acid Undecanoic acid Dodecanoic acid Tridecanoic acid
Rogge et al. (1998); Oros & Simoneit (2001); Schauer et al. (2001); Fine et al. (2002); McDonald et al. (2006)
Aldehydes and ketones
Formaldehyde Acetaldehyde Proponal Butanal Pentanal Octanal Nonanal (+ undecene) Glyoxal Acetone (+ propanal) 3-Buten-2-one Butanone 3-Methyl-3-buten-2-one
Rogge et al. (1998); McDonald et al. (2000); Schauer et al. (2001); Fine et al. (2002); McDonald et al. (2006)
Formaldehyde Acetaldehyde Acetone Acrolein Propionaldehyde Crotonaldehyde 2-Butanone Isobutyraldehyde Butyraldehyde Benzaldehyde Isovaleraldehyde Valeraldehyde ortho-Tolualdehyde meta,para-Tolualdehyde Hexaldehyde 2,4-Dimethylbenz-aldehyde
Miller et al. (1994); Zhang & Smith (1999)
Alkyl esters Nonyl dodecanoate Decyl dodecanoate Undecyl dodecanoate Dodecadienyl dodecanoate Tridecyl dodecanoate
Oros & Simoneit (2001)
Methoxylated phenolic compounds
Rogge et al. (1998); McDonald et al. (2000); Schauer et al. (2001); Fine et al. (2002); McDonald et al. (2006)
HOUSEHOLD USE OF SOLID FUELS 61
Table 1.5. (contd)
Compound Wood smoke Coal smoke
Species References Species References
Other organic compounds
Other substituted aromatic compounds
n-9-Octadecenoic acid n-9,12-Octadecadienoic acid PCDDs PCDFs PCBs
Rogge et al. (1998); McDonald et al. (2000); Oros & Simoneit (2001); Schauer et al. (2001); Fine et al. (2002); Gullett et al. (2003); McDonald et al. (2006)
Sugar derivatives
1,4:3,6-Dianhydro-R-D-Glucopyranose Galactosan Mannosan Levoglucosan Monomethylinosito
Oros & Simoneit (2001); Fine et al. (2002); McDonald et al. (2006)
Coumarins and flavonoids
Coumarin tetramethoxyiso-flavone
Fine et al. (2002)
Phytosteroids Stigmasterol â-Sitosterol Stigmastan-3-ol Stigmastan-3-one
Rogge et al. (1998); Fine et al. (2002)
Resin acids and terpenoids
Pimaric acid Isopimaric acid Abietic acid Levopimaric acid Neoabietic acid
Rogge et al. (1998); McDonald et al. (2000); Oros & Simoneit (2001); Fine et al. (2002)
Unresolved compounds
McDonald et al. (2000); Schauer et al. (2001); Fine et al. (2002)
PAH, polycyclic aromatic hydrocarbon; PCB, polychlorinated biphenyl; PCDD, polychlorinated dibenzo-para-dioxin; PCDF, polychlorinated dibenzofuran
Table 1.6. Elemental constituents of wood smoke and coal smoke
Wood smoke (particle phase) Coal smoke (particle phase)
Element Reference Element Reference
Carbon, including elemental carbon and organic carbon
McDonald et al. (2000); Watson et
al. (2001); Hays et al. (2002)
Carbon, including elemental carbon and organic carbon
Watson et al. (2001) ; Ge et al. (2004)
62 IARC MONOGRAPHS VOLUME 95
Table 1.6. (contd)
Wood smoke (particle phase) Coal smoke (particle phase)
Element Reference Element Reference
Metals Na, Mg, Al, K, Ca, Ti, V, Cr, Mn, Fe, Co, Ni, Cu, Zn, Ga, As, Se, Br, Rb, Sr, Yt, Zr, Mo, Pd, Ag, In, Sn, Sb, Ba, La, Au, Hg, Tl, Pb
Kleeman et al. (1999); Watson et
al. (2001)
Na, Mg, Al, K, Ca, Ti, V, Cr, Mn, Fe, Co, Ni, Cu, Zn, Ga, As, Se, Br, Rb, Sr, Yt, Zr, Mo, Pd, Ag, In, Sn, Sb, Ba, La, Au, Hg, Tl, Pb
Kauppinen & Pakkanen (1990); Watson et al. (2001) ; Ross et
al. (2002); Ge et
al. (2004)
Non-metals S, P, Si, Cl, Br Watson et al. (2001); Kleeman et al. (1999)
S, P, Si, Cl, Br Watson et al. (2001); Ge et al. (2004)
1.2.1 Particles as a whole versus particle components
Particles emitted from biomass and coal combustion are fine and ultrafine in size (<1 µm in diameter) (Kleeman et al., 1999; Hays et al., 2002). Fresh coal or biomass smoke contains a large number of ultrafine particles, <1 µm in diameter, which condense rapidly as they cool and age. The smoke may contain some larger particles resulting from suspension of ash and solid fuel debris. Because combustion-generated particles and ash/debris particles have different chemical compositions and because particle size determines how deep the particles can travel within and beyond the respiratory tract, ascertaining size distribution plays an important role in the assessment of health impacts (see Section 4). For this reason, there has been a switch in recent studies to the measurement of inhalable (<10 µm, referred to as PM10) or respirable (<2.5 µm, referred to as PM2.5) particles rather than of total suspended particles (TSP) as in earlier studies.
A large number of chemical species are contained in combustion particles and many chemical species are not stable (Rogge et al., 1998). Although it is impractical to cover a large number of individual compounds in a single study, a component of a specific physicochemical property may be targeted. For example, total carbon content of particles is a measure of the carbonaceous aerosol. Total carbon may be further segregated into elemental carbon and organic carbon. Although approximately 5–20% of wood smoke particulate mass consists of elemental carbon, the composition of the organic carbon fraction varies considerably with the specific fuel being burned and with the combustion conditions. Elemental carbon has a characteristic carbon core onto which many metals and organic compounds can be readily absorbed or adsorbed.
Earlier studies also focused on different solvent extracts of particles (soot) emitted from biomass or coal combustion. For example, in Xuan Wei County, China, particles released from smoky coal combustion contained the highest amount of organic compounds extractable with dichloromethane, followed by particles released from wood
HOUSEHOLD USE OF SOLID FUELS 63
combustion and then by those released from anthracite (smokeless) coal combustion (Mumford et al., 1987). Some combustion emission particles carry stabilized free radicals. Very limited data have shown that free radicals of the semi-quinone type are present in wood smoke particles as well as diesel smoke and cigarette smoke, but not in coal smoke which may contain or carry free radicals of graphite carbon type (Tian, 2005).
Analytical techniques such as ion chromatography can measure chemicals in the extracts of combustion particles in their dissociated form (ions). Commonly identified ions are shown in Table 1.7. These are the most abundant ions in smoke particles.
Table 1.7. Ionic constituents of wood smoke and coal smoke
Ion Wood smoke (particle phase) Coal smoke (particle phase)
Species References Species References
SO42- SO4
2-
Cl- Cl-
Anions
NO3-
Watson et al. (2001); Hays et al. (2002); Kleeman et al. (1999)
NO3-
Watson et al. (2001)
NH4+ NH4
+
K+
Watson et al. (2001); Hays et al. (2002); Kleeman et al. (1999)
K+
Watson et al. (2001) Cations
Ca2+ Hays et al. (2002)
Table 1.8. IARC evaluationsa of compounds present in emissions from the
combustion of wood or coal
IARC Monographs evaluation of carcinogenicity
Agent
In animals In humans IARC Group
Monographs volume, year
Polynuclear aromatic
hydrocarbons
Benz[a]anthracene Sufficient Inadequate 2B 92, 2010
Benzo[b]fluoranthene Sufficient Inadequate 2B 92, 2010 Benzo[k]fluoranthene Sufficient Inadequate 2B 92, 2010 Benzo[a]pyrene Sufficient Inadequate 1 92, 2010 Dibenz[a,h]anthracene Sufficient Inadequate 2A 92, 2010 Chrysene Sufficient Inadequate 2B 92, 2010
Cyclopenta[cd]pyrene Sufficient Inadequate 2A 92, 2010 Indeno[1,2,3-cd]pyrene Sufficient Inadequate 2B 92, 2010 Naphthalene Sufficient Inadequate 2B 82, 2002
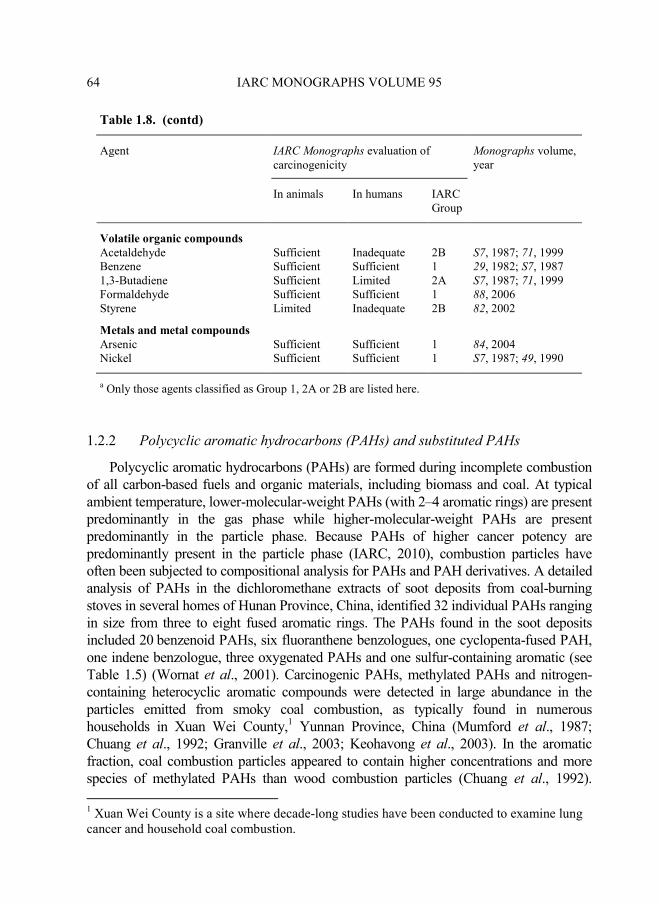
64 IARC MONOGRAPHS VOLUME 95
Table 1.8. (contd)
IARC Monographs evaluation of carcinogenicity
Agent
In animals In humans IARC Group
Monographs volume, year
Volatile organic compounds Acetaldehyde Sufficient Inadequate 2B S7, 1987; 71, 1999 Benzene Sufficient Sufficient 1 29, 1982; S7, 1987 1,3-Butadiene Sufficient Limited 2A S7, 1987; 71, 1999 Formaldehyde Sufficient Sufficient 1 88, 2006
Styrene Limited Inadequate 2B 82, 2002
Metals and metal compounds Arsenic Sufficient Sufficient 1 84, 2004 Nickel Sufficient Sufficient 1 S7, 1987; 49, 1990
a Only those agents classified as Group 1, 2A or 2B are listed here.
1.2.2 Polycyclic aromatic hydrocarbons (PAHs) and substituted PAHs
Polycyclic aromatic hydrocarbons (PAHs) are formed during incomplete combustion of all carbon-based fuels and organic materials, including biomass and coal. At typical ambient temperature, lower-molecular-weight PAHs (with 2–4 aromatic rings) are present predominantly in the gas phase while higher-molecular-weight PAHs are present predominantly in the particle phase. Because PAHs of higher cancer potency are predominantly present in the particle phase (IARC, 2010), combustion particles have often been subjected to compositional analysis for PAHs and PAH derivatives. A detailed analysis of PAHs in the dichloromethane extracts of soot deposits from coal-burning stoves in several homes of Hunan Province, China, identified 32 individual PAHs ranging in size from three to eight fused aromatic rings. The PAHs found in the soot deposits included 20 benzenoid PAHs, six fluoranthene benzologues, one cyclopenta-fused PAH, one indene benzologue, three oxygenated PAHs and one sulfur-containing aromatic (see Table 1.5) (Wornat et al., 2001). Carcinogenic PAHs, methylated PAHs and nitrogen-containing heterocyclic aromatic compounds were detected in large abundance in the particles emitted from smoky coal combustion, as typically found in numerous households in Xuan Wei County,1 Yunnan Province, China (Mumford et al., 1987; Chuang et al., 1992; Granville et al., 2003; Keohavong et al., 2003). In the aromatic fraction, coal combustion particles appeared to contain higher concentrations and more species of methylated PAHs than wood combustion particles (Chuang et al., 1992). 1 Xuan Wei County is a site where decade-long studies have been conducted to examine lung cancer and household coal combustion.
HOUSEHOLD USE OF SOLID FUELS 65
However, profiles of specific PAHs and their abundance vary largely depending on the fuel types and combustion conditions. Between biomass smoke or coal smoke, it is difficult to discern which has the higher PAH content (Tian, 2005).
1.2.3 Hydrocarbons and partially oxidized organic compounds
Hydrocarbons identified to date include: in wood smoke—alkanes with 1–7 carbons, and alkenes with 2–7 carbons (including 1,3-butadiene); in coal smoke—alkanes with 1–10 carbons and alkenes with 2–10 carbons (including 1,3-butadiene); in both wood and coal smoke—aromatic compounds (e.g. benzene, xylenes, toluene, styrene) (see Table 1.5). Partially oxidized organic compounds identified in wood and/or coal smoke include alkanols, aldehydes and ketones (carbonyls), carboxylic acids, alkyl esters and methoxylated phenolic compounds. In addition, partially oxidized aromatic compounds and substituted aromatic compounds (e.g. aromatic organic acids, polychlorinated dibenzodioxins, polychlorinated dibenzofurans, polychlorinated biphenyls), sugar derivatives, coumarins and flavonoids, resin acids and terpenoids have been identified in wood smoke (see Table 1.5). Both biomass smoke and coal smoke contain gas-phase carcinogens (e.g. benzene, 1,3-butadiene, formaldehyde) in addition to particle-phase PAHs that have carcinogenic potential. A detailed analysis of organic wood smoke aerosol found nearly 200 distinct organic compounds, many of which are derivatives of wood polymers and resins (see Table 1.5; Rogge et al., 1998).
1.2.4 Metals and other toxic substances
Some carcinogenic substances in coal were found to be released into the air during the combustion of lignites used in Shenyang City of northern China and smoky coals used in Xuan Wei County, China. It was reported that lignites from a local Shenyang coal field had very high concentrations of nickel (75 ppm) and chromium (79 ppm) (Ren et al., 1999, 2004) when compared with the levels reported elsewhere in the world (0.5–50 ppm for nickel and 0.5–60 ppm for chromium) (Swaine, 1990). Microfibrous quartz has been found in some smoky coals from Xuan Wei County and the resulting coal smoke but not in wood smoke (Tian, 2005). Particles emitted from burning coals contaminated with toxic elements (e.g. fluorine, arsenic, mercury) in Guizhou Province of China and other areas have been reported to contain high levels of the corresponding elements (Gu et al., 1990; Yan, 1990; Shraim et al., 2003). As shown in Table 1.6, metal and non-metal elements have also been found in wood smoke particles, which reflects the intake of these elements from the soil by trees.
1.2.5 Emission factors of some carcinogens
The emission factor of a particular chemical species can be measured as the mass of the species emitted per unit mass of fuel combusted or the mass of the species emitted per unit energy produced or delivered through combustion. A very small number of studies

66 IARC MONOGRAPHS VOLUME 95
have been conducted to date to quantify emission factors of common pollutants for household stoves used in developing countries.
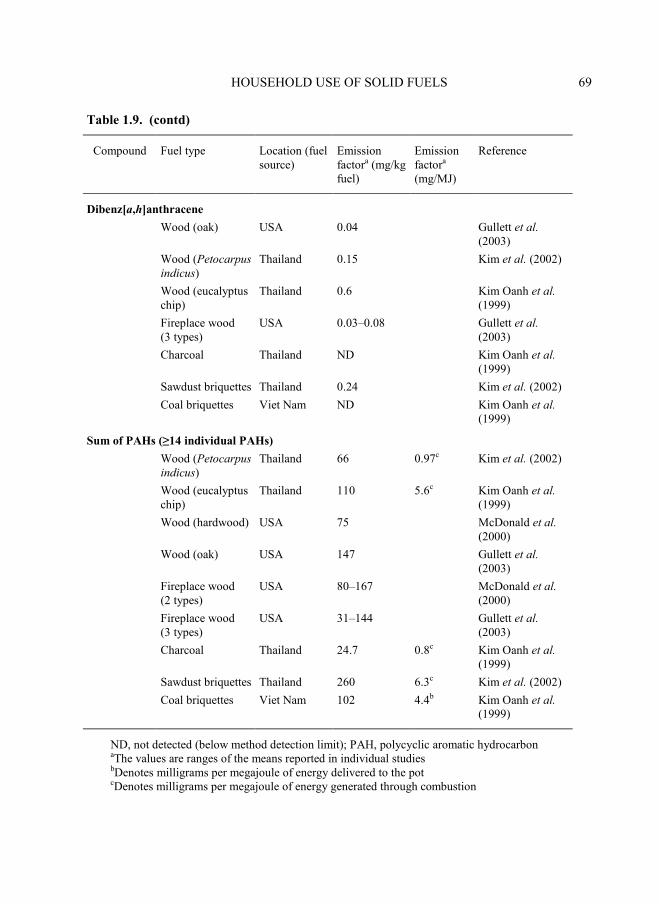
The available data for selected human carcinogens or probable carcinogens (benzene, 1,3-butadiene, formaldehyde and benzo[a]pyrene) are summarized in Table 1.9. The sum of PAHs, when ≥14 individual PAHs were measured, is also shown in Table 1.9. The cited studies measured PAHs most commonly reported in the literature: acenaphthene, acenaphthylene, anthracene, benz[a]anthracene, benzo[b]fluoranthene, benzo[a]-pyrene, benzo[ghi]perylene, benzo[k]fluoranthene, chrysene, dibenz[ah]anthracene, fluoranthene, fluorene, indeno[1,2,3-cd]pyrene, naphthalene, phenanthrene and pyrene.
Table 1.9. Emission factors of carcinogenic compounds in the smoke of solid fuel combustion in household stoves (and fireplaces)
Compound Fuel type Location (fuel source)
Emission factora (mg/kg fuel)
Emission factora (mg/MJ)
Reference
Benzene
Wood (1 type) China 264–629 159–161b Tsai et al. (2003)
Wood (hardwood) USA 1190 McDonald et al. (2000)
Fireplace wood (2 types)
USA 225–312 McDonald et al. (2000)
Coal (4 types) China 2.71–1050 0.9–390b Tsai et al. (2003)
1,3-Butadiene
Wood (1 type) China 0.8–1.0 0.2–0.6b Tsai et al. (2003)
Wood (hardwood) USA 197 McDonald et al. (2000)
Fireplace wood (2 types)
USA 63–95 McDonald et al. (2000)
Coal (4 types) China ND–21.3 ND–7.9b Tsai et al. (2003)
Styrene
Wood (1 type) China ND ND Tsai et al. (2003)
Wood (hardwood) USA 117 McDonald et al. (2000)
Fireplace wood (2 types)
USA 35–40 McDonald et al. (2000)
Coal (4 types) China ND ND Tsai et al. (2003)
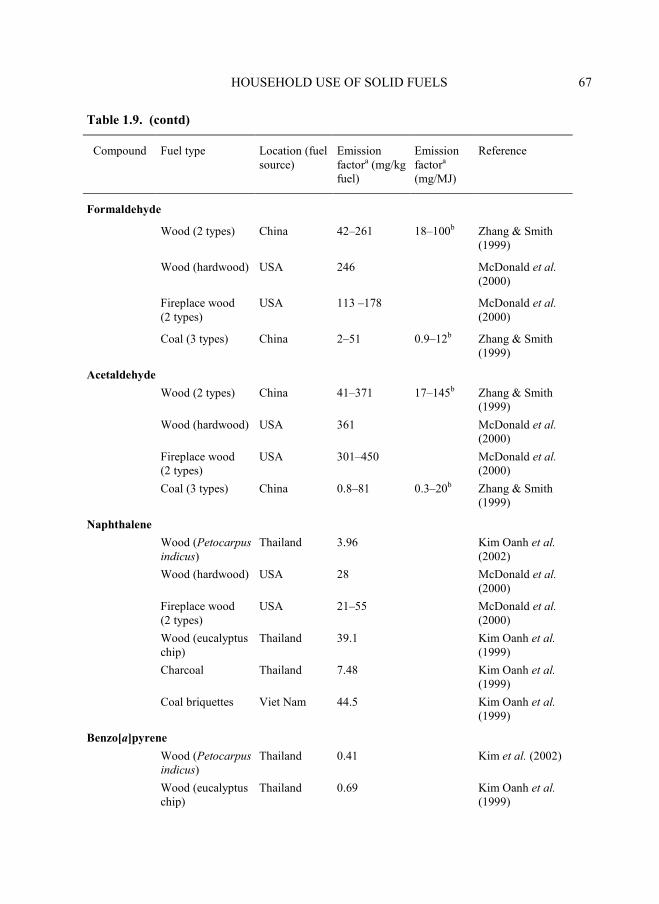
HOUSEHOLD USE OF SOLID FUELS 67
Table 1.9. (contd)
Compound Fuel type Location (fuel source)
Emission factora (mg/kg fuel)
Emission factora (mg/MJ)
Reference
Formaldehyde
Wood (2 types) China 42–261 18–100b Zhang & Smith (1999)
Wood (hardwood) USA 246 McDonald et al. (2000)
Fireplace wood (2 types)
USA 113 –178 McDonald et al. (2000)
Coal (3 types) China 2–51 0.9–12b Zhang & Smith (1999)
Acetaldehyde
Wood (2 types) China 41–371 17–145b Zhang & Smith (1999)
Wood (hardwood) USA 361 McDonald et al. (2000)
Fireplace wood (2 types)
USA 301–450 McDonald et al. (2000)
Coal (3 types) China 0.8–81 0.3–20b Zhang & Smith (1999)
Naphthalene
Wood (Petocarpus
indicus) Thailand 3.96 Kim Oanh et al.
(2002)
Wood (hardwood) USA 28 McDonald et al. (2000)
Fireplace wood (2 types)
USA 21–55 McDonald et al. (2000)
Wood (eucalyptus chip)
Thailand 39.1 Kim Oanh et al. (1999)
Charcoal Thailand 7.48 Kim Oanh et al. (1999)
Coal briquettes Viet Nam 44.5 Kim Oanh et al. (1999)
Benzo[a]pyrene
Wood (Petocarpus
indicus) Thailand 0.41 Kim et al. (2002)
Wood (eucalyptus chip)
Thailand 0.69 Kim Oanh et al. (1999)
68 IARC MONOGRAPHS VOLUME 95
Table 1.9. (contd)
Compound Fuel type Location (fuel source)
Emission factora (mg/kg fuel)
Emission factora (mg/MJ)
Reference
Benzo[a]pyrene (contd)
Wood (hardwood) USA 0.20 McDonald et al. (2000)
Wood (oak) USA 0.56 Gullett et al. (2003)
Fireplace wood (2 types)
USA 0.15–0.34 McDonald et al. (2000)
Fireplace wood (3 types)
USA 0.31–0.58 Gullett et al. (2003)
Charcoal (two types)
Kenya 0.01–0.12 Gachanja & Worsforld (1993)
Charcoal Thailand 0.17 Kim Oanh et al. (1999)
Sawdust briquettes Thailand 0.53 Kim et al. (2002)
Coal briquettes Viet Nam 0.30 Kim Oanh et al. (1999)
Benz[a]anthracene
Wood (hardwood) USA 0.56 McDonald et al. (2000)
Wood (Petocarpus
indicus) Thailand 0.62 Kim et al. (2002)
Wood (eucalyptus chip)
Thailand 0.82 Kim Oanh et al. (1999)
Wood (oak) USA 0.73 Gullett et al. (2003)
Fireplace wood (3 types)
USA 0.34–0.79 Gullett et al. (2003)
Fireplace wood (2 types)
USA 0.31–0.45 McDonald et al. (2000)
Charcoal Thailand 0.06 Kim Oanh et al. (1999)
Sawdust briquettes Thailand 1.04 Kim et al. (2002)
Coal briquettes Viet Nam 0.11 Kim Oanh et al. (1999)
HOUSEHOLD USE OF SOLID FUELS 69
Table 1.9. (contd)
Compound Fuel type Location (fuel source)
Emission factora (mg/kg fuel)
Emission factora (mg/MJ)
Reference
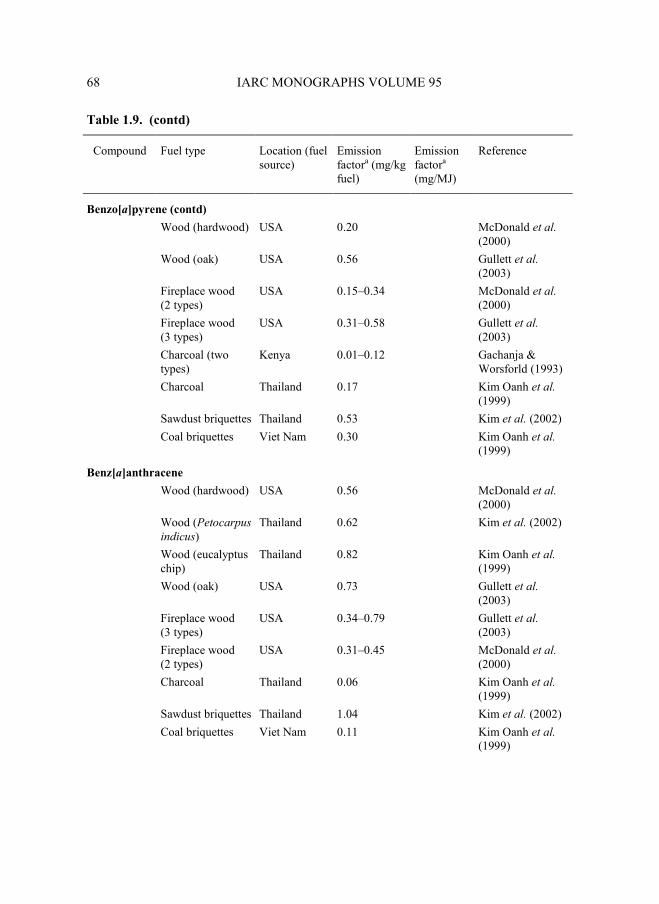
Dibenz[a,h]anthracene
Wood (oak) USA 0.04 Gullett et al. (2003)
Wood (Petocarpus
indicus) Thailand 0.15 Kim et al. (2002)
Wood (eucalyptus chip)
Thailand 0.6 Kim Oanh et al. (1999)
Fireplace wood (3 types)
USA 0.03–0.08 Gullett et al. (2003)
Charcoal Thailand ND Kim Oanh et al. (1999)
Sawdust briquettes Thailand 0.24 Kim et al. (2002)
Coal briquettes Viet Nam ND Kim Oanh et al. (1999)
Sum of PAHs (≥14 individual PAHs)
Wood (Petocarpus
indicus) Thailand 66 0.97c Kim et al. (2002)
Wood (eucalyptus chip)
Thailand 110 5.6c Kim Oanh et al. (1999)
Wood (hardwood) USA 75 McDonald et al. (2000)
Wood (oak) USA 147 Gullett et al. (2003)
Fireplace wood (2 types)
USA 80–167 McDonald et al. (2000)
Fireplace wood (3 types)
USA 31–144 Gullett et al. (2003)
Charcoal Thailand 24.7 0.8c Kim Oanh et al. (1999)
Sawdust briquettes Thailand 260 6.3c Kim et al. (2002)
Coal briquettes Viet Nam 102 4.4b Kim Oanh et al. (1999)
ND, not detected (below method detection limit); PAH, polycyclic aromatic hydrocarbon aThe values are ranges of the means reported in individual studies bDenotes milligrams per megajoule of energy delivered to the pot cDenotes milligrams per megajoule of energy generated through combustion
70 IARC MONOGRAPHS VOLUME 95
Fuelwood combustion in two different Chinese cooking stoves generated 264 and 629 mg benzene for every kilogram of wood burned. Burning four types of household coal fuels (honeycomb coal briquette, coal briquette, coal powder and water-washed coal powder) in three different coal stoves generated a very wide range of benzene emissions (2.71–1050 mg/kg fuel) (Tsai et al., 2003). When the wood emission factors of benzene have been ‘translated’ into indoor concentrations for a typical village kitchen, benzene concentrations are expressed in parts per million (Zhang & Smith, 1996). As was the case for benzene, 1,3-butadiene emission factors had a wider range for coal combustion (see Table 1.9). However, wood combustion produced a higher formaldehyde emission factor than that obtained with coal combustion. Using the formaldehyde emission factors, Zhang and Smith (1999) predicted that a wood stove could produce sub-part-per-million and part-per-million peak formaldehyde concentrations in a typical village kitchen, depending on kitchen size and ventilation rate. Emission factors of benzo[a]pyrene for wood stoves appeared to be consistent across studies conducted in different countries, depending on fuel species (see Table 1.9). Interestingly, benzo[a]pyrene emission factors for fireplaces appeared to be similar to those for wood stoves and to depend on the wood species used. The benzo[a]pyrene emission factor for sawdust briquette was within the range of wood stove emission factors. In contrast, benzo[a]pyrene emission factors for coal and charcoal appeared to be lower. PAHs combined had the highest emission factor for sawdust briquette and the lowest for charcoal. Wood fuels/stoves (including fireplaces) and coal briquettes had overlaps in emission factor ranges for the PAHs combined. These emission factor patterns (wood versus coal) were, in general, consistent with indoor air concentration patterns measured in households that used coal and wood stoves (see Section 1.3).
1.3 Use and exposure
1.3.1 General considerations on exposure to solid fuels
(a) Determinants of exposure to indoor air pollution
Exposure to indoor air pollution resulting from the combustion of solid fuels is influenced by multiple factors. Individual exposure may be most directly influenced by the interaction of these factors with the source and the surrounding environment. However, many factors can contribute to this interaction indirectly. For example, the type of fuel and room dimensions may directly determine personal exposures but income, climatic conditions, cooking habits and family size may indirectly influence the type of fuel/stove (source) or the dimensions of the living space (surroundings). Determinants of exposure could therefore be described by classifying them broadly into ‘proximal’ (or ‘microenvironmental’) determinants that are directly in the exposure pathway and ‘distal’ (or ‘macroenvironmental’) determinants that contribute to differences in exposure through their effects on the systems that each of the proximal determinants may represent. Among the studies conducted in developing countries, there is a great deal of similarity in the
HOUSEHOLD USE OF SOLID FUELS 71
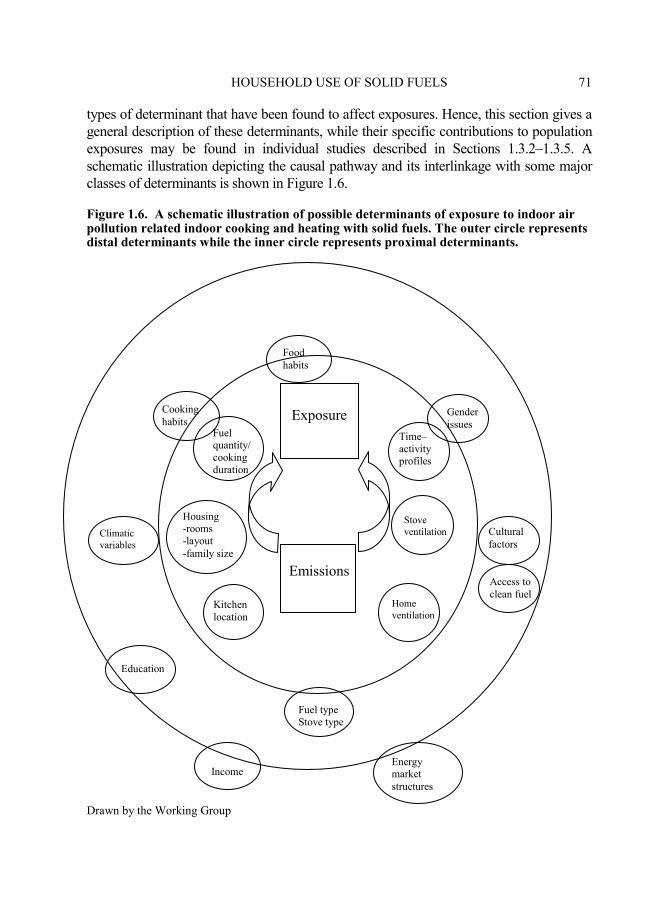
types of determinant that have been found to affect exposures. Hence, this section gives a general description of these determinants, while their specific contributions to population exposures may be found in individual studies described in Sections 1.3.2–1.3.5. A schematic illustration depicting the causal pathway and its interlinkage with some major classes of determinants is shown in Figure 1.6.
Figure 1.6. A schematic illustration of possible determinants of exposure to indoor air pollution related indoor cooking and heating with solid fuels. The outer circle represents distal determinants while the inner circle represents proximal determinants.
Drawn by the Working Group
Emissions
Exposure
Time–activity profiles
Fuel quantity/ cooking duration
Housing -rooms -layout -family size
Stove ventilation
Access to clean fuel
Energy market structures
Climatic variables
Cooking habits
Income
Fuel type Stove type
Gender issues
Cultural factors
Education
Food habits
Kitchen location
Home ventilation
72 IARC MONOGRAPHS VOLUME 95
(i) Macroenvironmental (distal) determinants
Socioeconomic (and demographic) determinants
These determinants operate largely through their influence on choice of fuel (one of the biggest contributors to indoor emissions and exposures, as described in Section 1.1). Income and education can also be expected to affect family size and type of housing that in turn affect fuel quantities or the number of rooms and/or location of the kitchen. Access to cleaner fuels may also be independently influenced by the prevalent national and regional energy market structures, which in turn would be linked to the gross domestic product of individual countries. Countries with a low gross domestic product per capita may experience greater gender inequities in terms of income, education, access to health care, social position and sociocultural preferences, all of which could potentially influence the exposures of vulnerable groups, such as women and children.
Geographic determinants
Although exposures result from indoor sources, external ecological variables can have a significant effect on the intensity and duration of pollution. Extreme temperature differentials between seasons, rainfall, altitude and even meteorological factors such as wind speed, wind direction and relative humidity, for example, could determine whether solid fuels are used for both cooking and heating and also affect aerosol dispersion and/or deposition. Patterns of vegetation (e.g. tropical rain forest versus scrub) could contribute to household decisions to seek alternative energy sources. Conditions of temperature and/or altitude that favour low dispersion (as may be commonly encountered in hilly/cold areas) may also favour higher ambient levels of pollution (resulting from indoor sources) which in turn contribute to increased exposure of the population.
(ii) Microenvironmental determinants
While the socioeconomic variables usually influence exposures indirectly through their effect on choice of fuel, several determinants directly influence spatial and temporal patterns of exposure within the household. Use and maintenance of improved stoves, household layout (including the location of kitchen), household ventilation, time–activity profiles of individual household members and behavioural practices (such as location of children while cooking) have been shown to influence pollution levels and individual exposures to them. Cultural habits may influence cooking practices which in turn may affect duration of cooking or the quantity of fuel used. While the available literature does not allow a detailed attribution of exposures to each of these variables, they can be expected to make varying contributions and must be considered when creating local or regional profiles of the exposure situation.
(b) Methods used to assess exposures
Exposures to indoor air pollutants that result from the combustion of solid fuels occur in the homes of millions of people on a daily basis. Multiple determinants affect these exposures directly or indirectly. While it would be impossible to create exposure profiles

HOUSEHOLD USE OF SOLID FUELS 73
by routine sampling of thousands of households, systematic assessments that use a combination of qualitative and quantitative methods have been necessary to identify the extent, levels and nature of exposures as well as to understand the relative contributions of specific determinants. An exposure pyramid that illustrates commonly applied approaches used in studies in developing countries is shown in Figure 1.7. As can be seen in the figure in general, as the geographic scale decreases, specificity increases, the availability of pre-existing or routinely collected data decreases and the cost of original data collection increases.
Figure 1.7. A schematic illustration of exposure assessment methods (tiers) used in
studies in developing countries (adapted from Mehta & Smith, 2002; Balakrishnan et al.,
2004)
At the top of the pyramid are secondary data sources (tier No. 1). Some qualitative data on exposures, e.g. by primary fuel type, are routinely collected in national surveys such as the census and serve as readily available low-cost exposure indicators, but they often lack precision for estimating exposures at the household level. The influence of multiple household-level variables such as the type of fuel, type and location of kitchen and type of stove on actual household level concentrations/exposures is poorly understood in such assessments. However, this information has been very useful in estimating the proportions of people at risk for these exposures across multiple regions of the world and
1 Regional/national fuel use
2 Sub-national household fuel use
3 Household fuel use, housing characteristics
4 Household indoor air concentrations
5 Individual exposure
6 Biomarkers
Categorical/qualitative data
Continuous data
Geo
grap
hic
scal
e
74 IARC MONOGRAPHS VOLUME 95
also in tracking changes in the prevalence of some key determinants such as fuel and stove use in response to policy measures. More accurate (but more expensive) ways to measure exposures are actual household sample surveys of fuel use (tier No. 2). Indeed, this measure has been often used as the indicator of exposure in many epidemiological studies. Even better (but yet more expensive) methods include surveys not only of fuel use, but also of household characteristics such as type of construction material, stove type, number of rooms and windows and room ventilation (tier No. 3). The next stage, which is higher still in cost but more accurate, involves air pollution studies that use stationary air sampling devices set in one or more locations of the household over various lengths of time (tier No. 4). Some studies have been conducted in which people actually wore devices to measure their (personal) exposures to pollution, or in which exposures were reconstructed using concentration data and detailed time–activity–location records of individual household members (tier No. 5). Biological fluid or tissue biomarkers (tier No. 6) have not been applied in field settings, although some laboratory exposure chamber studies have been carried out. Finally, some methods that use a combination of qualitative information on a large number of households together with quantitative and qualitative information on a smaller subset of households have allowed the construction of models that predict levels of household exposure on the basis of qualitative information on selected determinants.
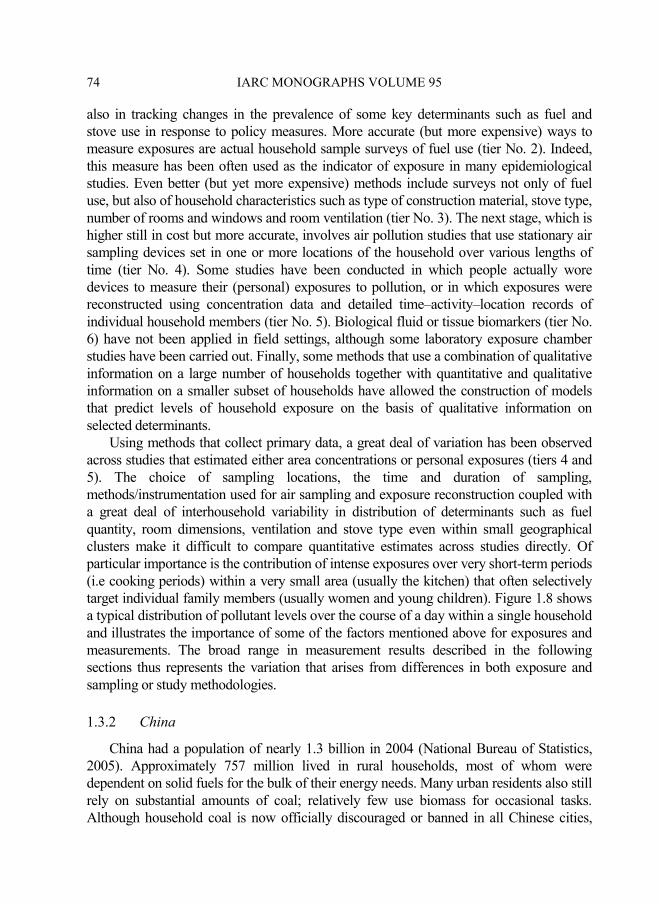
Using methods that collect primary data, a great deal of variation has been observed across studies that estimated either area concentrations or personal exposures (tiers 4 and 5). The choice of sampling locations, the time and duration of sampling, methods/instrumentation used for air sampling and exposure reconstruction coupled with a great deal of interhousehold variability in distribution of determinants such as fuel quantity, room dimensions, ventilation and stove type even within small geographical clusters make it difficult to compare quantitative estimates across studies directly. Of particular importance is the contribution of intense exposures over very short-term periods (i.e cooking periods) within a very small area (usually the kitchen) that often selectively target individual family members (usually women and young children). Figure 1.8 shows a typical distribution of pollutant levels over the course of a day within a single household and illustrates the importance of some of the factors mentioned above for exposures and measurements. The broad range in measurement results described in the following sections thus represents the variation that arises from differences in both exposure and sampling or study methodologies.
1.3.2 China
China had a population of nearly 1.3 billion in 2004 (National Bureau of Statistics, 2005). Approximately 757 million lived in rural households, most of whom were dependent on solid fuels for the bulk of their energy needs. Many urban residents also still rely on substantial amounts of coal; relatively few use biomass for occasional tasks. Although household coal is now officially discouraged or banned in all Chinese cities,
HOUSEHOLD USE OF SOLID FUELS 75
there is still significant but declining use in many, i.e. 5–10% of households, and a much larger proportion of usage in past decades. Thus, despite rapid urbanization and spread of the use of gas and electricity for cooking and heating, the majority of China’s population depends mainly on solid fuels for household energy and is frequently exposed to the products of their combustion. A broad spectrum of information is available on population numbers that use different fuels under various conditions and their resulting pollutant levels (see for instance Impact Carbon (formerly CEIHD) at http://impactcarbon.org/). This information is not complete nor are all sources concordant with each other, but sufficient data exist to enable estimation of ranges of population exposures to a variety of pollutants.
Figure 1.8. Typical variations in PM10 level observed during the course of the day relative to
daily means
From Mehta & Smith (2002)
(a) Use and determinants of use of solid fuels
(i) Types and amounts of fuel
The energy yearbooks published by the National Bureau of Statistics (Table 1.10) include some data from the Ministry of Agriculture on household use of biofuels (crop wastes, wood and biogas) by province, but the estimates of fossil fuel consumption in the National Bureau of Statistics’ national and provincial balances (which estimate both urban and rural household energy use) differ substantially from those in the relatively rare publications from the Ministry of Agriculture that report the use of fossil fuels in rural households (Table 1.11). National Bureau of Statistics sources report the level of fossil fuel use for rural households to be only about 40% of that cited by the Ministry of Agriculture, possibly due to differences in allocating fuel use to agricultural and household purposes. While the levels of biofuel use are necessarily the same in both sources,

76 IARC MONOGRAPHS VOLUME 95
Table 1.10. Household energy use in China, 2004
Category Original measurements Conversion into PJ
Unit Urban Rural Urban Rural
Raw coal Mt 17.33 45.65 409 1077
Washed coal Mt 3.43 5.55 53 86
Briquettes Mt 5.39 4.36 96 78
Coke Mt 0.55 0.51 16 14
Coal gas Bcm 13.70 0.11 155 1
Gasoline Mt 2.24 0.63 96 27
Kerosene Mt 0.02 0.25 1 11
Diesel Mt 0.84 0.30 36 13
LPG Mt 11.27 2.24 566 113
Natural gas Bcm 6.69 0.03 261 1
Delivered heat PJ 413.95 – 414 –
Electricity TWh 148.33 98.10 534 353
Crop wastes Mt – 339.86 – 4273
Wood Mt – 210.92 – 3530
Biogas Bcm – 5.59 – 117
Total 2636 9694
Population Millions 542.83 757.05 Household size Persons 2.98 4.08
From National Bureau of Statistics (2005, 2006) Mt, million tonnes; Bcm, billion cubic metres; LPG, liquefied petroleum gas; PJ, petajoules; TWh, terawatt–hours N.B. Biofuel use published in National Bureau of Statistics (2006) is attributed to the Ministry of Agriculture. Data in the same categories as in this table are available from the same sources for nearly all of China’s provinces and provincial-level municipalities.
Table 1.11. Rural household energy use in China, 1998
Category Units Conversion in PJ
Coal 163.45 Mt 3421
LPG 1.95 Mt 98
Oil products 4.51 Mt 189
Electricity 74.54 TWh 269
Crop wastes 286.24 Mt 3599
Wood 147.13 Mt 2462
Biogas 1.67 Bcm 35
Total 10 074
From EBCREY (1999) Mt, million tonnes; Bcm, billion cubic metres; LPG, liquefied petroleum gas; PJ, petajoules; TWh, terawatt-hours
HOUSEHOLD USE OF SOLID FUELS 77
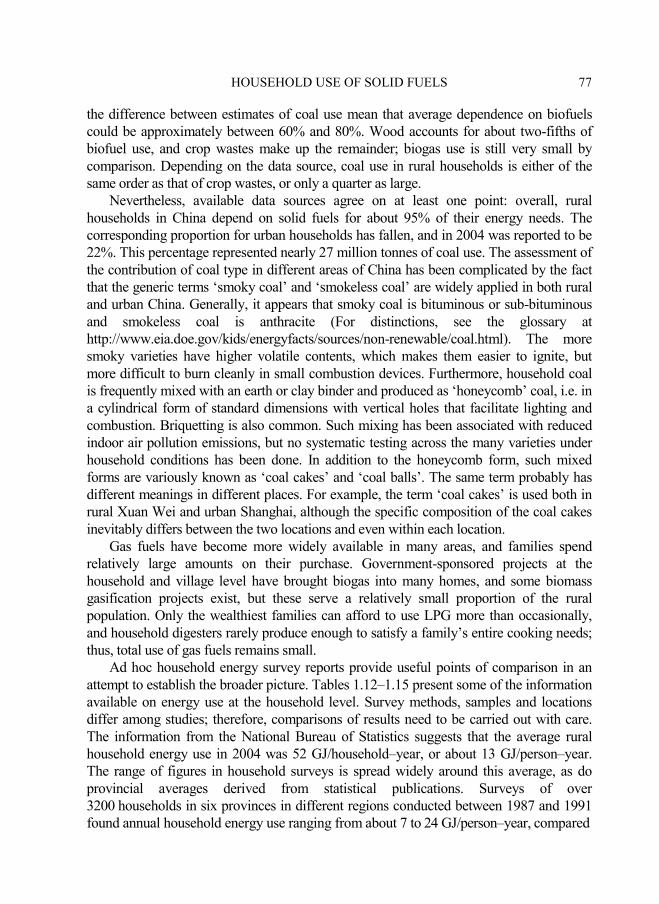
the difference between estimates of coal use mean that average dependence on biofuels could be approximately between 60% and 80%. Wood accounts for about two-fifths of biofuel use, and crop wastes make up the remainder; biogas use is still very small by comparison. Depending on the data source, coal use in rural households is either of the same order as that of crop wastes, or only a quarter as large.
Nevertheless, available data sources agree on at least one point: overall, rural households in China depend on solid fuels for about 95% of their energy needs. The corresponding proportion for urban households has fallen, and in 2004 was reported to be 22%. This percentage represented nearly 27 million tonnes of coal use. The assessment of the contribution of coal type in different areas of China has been complicated by the fact that the generic terms ‘smoky coal’ and ‘smokeless coal’ are widely applied in both rural and urban China. Generally, it appears that smoky coal is bituminous or sub-bituminous and smokeless coal is anthracite (For distinctions, see the glossary at http://www.eia.doe.gov/kids/energyfacts/sources/non-renewable/coal.html). The more smoky varieties have higher volatile contents, which makes them easier to ignite, but more difficult to burn cleanly in small combustion devices. Furthermore, household coal is frequently mixed with an earth or clay binder and produced as ‘honeycomb’ coal, i.e. in a cylindrical form of standard dimensions with vertical holes that facilitate lighting and combustion. Briquetting is also common. Such mixing has been associated with reduced indoor air pollution emissions, but no systematic testing across the many varieties under household conditions has been done. In addition to the honeycomb form, such mixed forms are variously known as ‘coal cakes’ and ‘coal balls’. The same term probably has different meanings in different places. For example, the term ‘coal cakes’ is used both in rural Xuan Wei and urban Shanghai, although the specific composition of the coal cakes inevitably differs between the two locations and even within each location.
Gas fuels have become more widely available in many areas, and families spend relatively large amounts on their purchase. Government-sponsored projects at the household and village level have brought biogas into many homes, and some biomass gasification projects exist, but these serve a relatively small proportion of the rural population. Only the wealthiest families can afford to use LPG more than occasionally, and household digesters rarely produce enough to satisfy a family’s entire cooking needs; thus, total use of gas fuels remains small.
Ad hoc household energy survey reports provide useful points of comparison in an attempt to establish the broader picture. Tables 1.12–1.15 present some of the information available on energy use at the household level. Survey methods, samples and locations differ among studies; therefore, comparisons of results need to be carried out with care. The information from the National Bureau of Statistics suggests that the average rural household energy use in 2004 was 52 GJ/household–year, or about 13 GJ/person–year. The range of figures in household surveys is spread widely around this average, as do provincial averages derived from statistical publications. Surveys of over 3200 households in six provinces in different regions conducted between 1987 and 1991 found annual household energy use ranging from about 7 to 24 GJ/person–year, compared
78 IA
RC
MO
NO
GR
AP
HS
VO
LU
ME
95
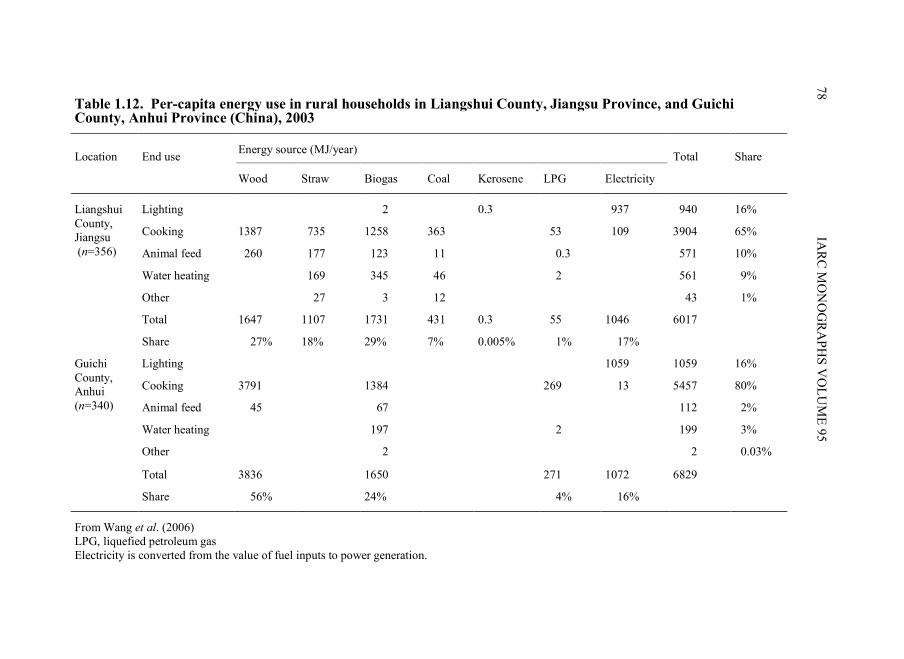
Table 1.12. Per-capita energy use in rural households in Liangshui County, Jiangsu Province, and Guichi County, Anhui Province (China), 2003
Location End use Energy source (MJ/year)
Total Share
Wood Straw Biogas Coal Kerosene LPG Electricity
Lighting 2 0.3 937 940 16%
Cooking 1387 735 1258 363 53 109 3904 65%
Animal feed 260 177 123 11 0.3 571 10%
Liangshui County, Jiangsu
(n=356)
Water heating 169 345 46 2 561 9%
Other 27 3 12 43 1%
Total 1647 1107 1731 431 0.3 55 1046 6017
Share 27% 18% 29% 7% 0.005% 1% 17%
Lighting 1059 1059 16%
Cooking 3791 1384 269 13 5457 80%
Animal feed 45 67 112 2%
Guichi County, Anhui (n=340)
Water heating 197 2 199 3%
Other 2 2 0.03%
Total 3836 1650 271 1072 6829
Share 56% 24% 4% 16%
From Wang et al. (2006) LPG, liquefied petroleum gas Electricity is converted from the value of fuel inputs to power generation.
HOUSEHOLD USE OF SOLID FUELS 79
with the average rural household energy use in 1990 of 11 GJ/person–year (Wang & Feng, 1996; Sinton et al., 2004b).
Wang and Feng (1997a,b, 2001) and Wang et al. (1999, 2002) have reported a large series of rural energy surveys in eastern China. In a detailed 2003 survey of nearly 700 rural homes in Anhui and Jiangsu in villages where rates of biogas use are very high (24% and 29%, respectively), Wang et al. (2006) showed that the level of use of commercial energy remains low (Table 1.12). Including biogas, biofuels accounted for 75–80% of average household energy. Observed energy use per capita in these villages which enjoy the mild climate of the central seaboard provinces was about half the national average for rural households. Unlike most surveys, this study also provided a breakdown by end-use which showed that, in these households where no space heating was recorded, cooking tasks far outweighed all others, even when families used large amounts of fuel for the preparation of pig feed. Households without biogas digesters used about 70% more energy—mainly solid fuels—than those with biogas digesters, which provides a basis for estimating the change in exposure resulting from adding gas to the household fuel mix. Notably, LPG use in households with biogas remained significant. An earlier study in Liangshui showed a similar result (Wang & Li, 2005).
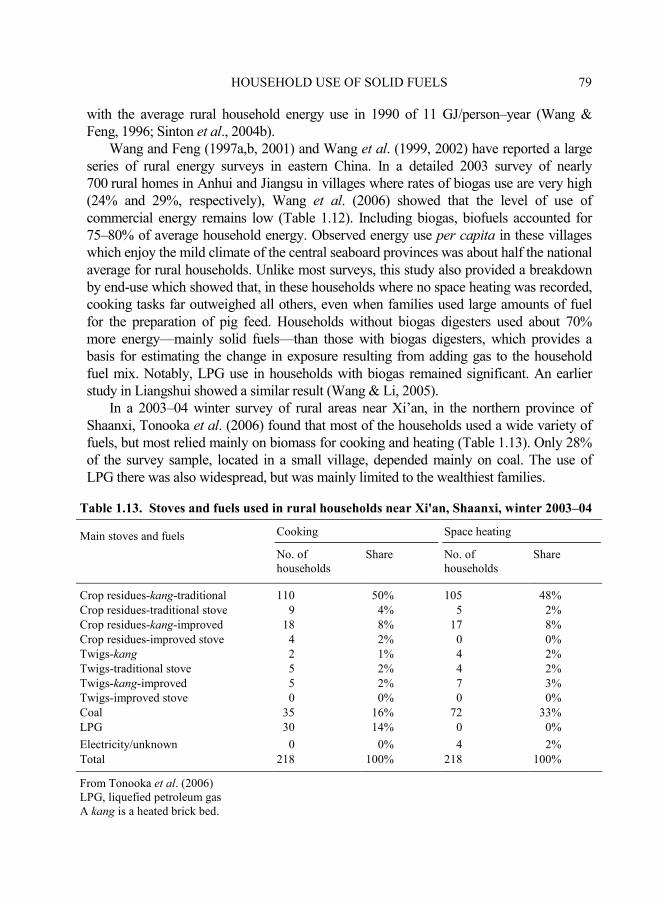
In a 2003–04 winter survey of rural areas near Xi’an, in the northern province of Shaanxi, Tonooka et al. (2006) found that most of the households used a wide variety of fuels, but most relied mainly on biomass for cooking and heating (Table 1.13). Only 28% of the survey sample, located in a small village, depended mainly on coal. The use of LPG there was also widespread, but was mainly limited to the wealthiest families.
Table 1.13. Stoves and fuels used in rural households near Xi'an, Shaanxi, winter 2003–04
Main stoves and fuels Cooking Space heating
No. of households
Share No. of households
Share
Crop residues-kang-traditional 110 50% 105 48% Crop residues-traditional stove 9 4% 5 2% Crop residues-kang-improved 18 8% 17 8% Crop residues-improved stove 4 2% 0 0% Twigs-kang 2 1% 4 2% Twigs-traditional stove 5 2% 4 2% Twigs-kang-improved 5 2% 7 3% Twigs-improved stove 0 0% 0 0% Coal 35 16% 72 33% LPG 30 14% 0 0%
Electricity/unknown 0 0% 4 2% Total 218 100% 218 100%
From Tonooka et al. (2006) LPG, liquefied petroleum gas A kang is a heated brick bed.

80 IARC MONOGRAPHS VOLUME 95
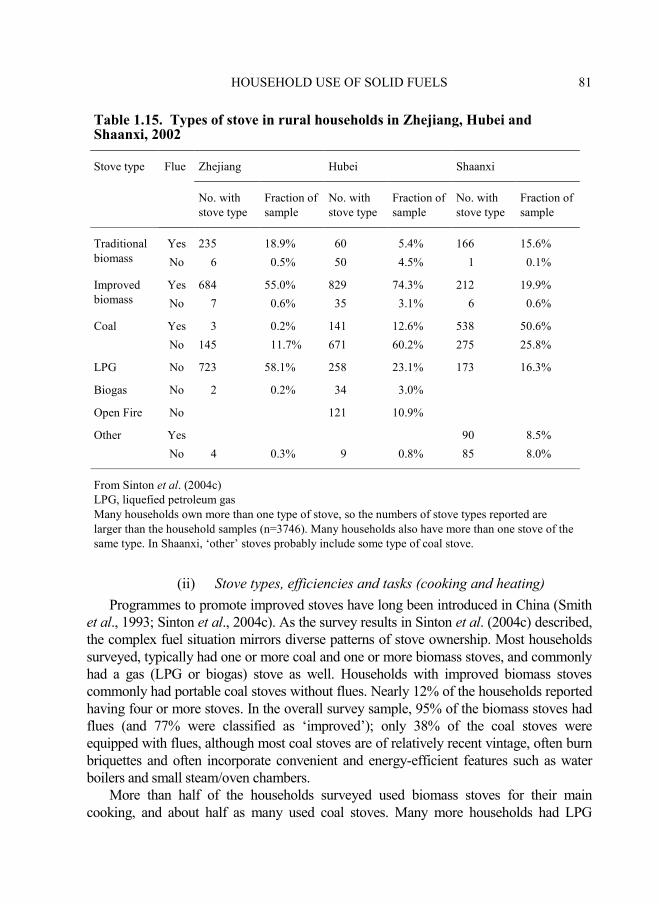
A 2002 survey of nearly 35 000 households in Shaanxi, Zhejiang and Hubei—a 10% subsample of which was monitored for indoor air quality (Sinton et al., 2004a,c)—documented the highly diverse fuel and stove use patterns that are typical throughout the country (Tables 1.14 and 1.15). For instance, in the database of households where indoor air quality was measured, 28 different fuel combinations were used in kitchens in winter and 34 different fuel combinations were used in summer (Sinton et al. 2004c). In the larger sample of the study, the survey results were generally in line with those arising from national statistics. In some areas, availability of LPG had made improved solid-fuel stoves obsolete, and some households had advanced from traditional solid-fuel stoves directly to LPG. In most cases, however, households used both gas and solid fuels for cooking. Most households in Shaanxi reported that they heated with coal in winter. In Zhejiang and Hubei, where nearly half of the surveyed households did not heat at all in winter, a surprisingly large fraction cooked with charcoal—which is illegal to produce and sell in many areas.
Table 1.14. Main cooking and heating fuels, rural households in Zhejiang, Hubei and Shaanxi, China, 2002
Fuel Zhejiang Hubei Shaanxi
Main cooking fuel (number of households) Wood 807 65.3% 490 43.9% 75 7.0% Crop residues 300 24.3% 220 19.7% 276 25.9% Coal 3 0.2% 318 28.5% 686 64.4% LPG 109 8.8% 69 6.2% 25 2.3% Electricity 11 0.9% 8 0.7% Biogas 6 0.5% 1 0.1% Charcoal 1 0.1% 1 0.1% Missing 6 0.5% 3 0.3% 1 0.1%
Total 1236 1115 1065
Main heating fuel (number of households) Wood 231 18.7% 222 19.9% 49 4.6% Crop residues 5 0.4% 8 0.7% 205 19.2% Coal 19 1.5% 66 5.9% 750 70.4% Charcoal 347 28.1% 324 29.1% 1 0.1% Electricity 59 4.8% 2 0.2% 24 2.3% LPG and kerosene 5 0.4% 2 0.2% 0.0% No space heating/missing 570 46.1% 491 44.0% 36 3.4%
Total 1236 1115 1065
From Sinton et al. (2004a) LPG, liquefied petroleum gas Wood includes logs, twigs and other woody biomass. Crop residues include other non-woody biomass and dung.
HOUSEHOLD USE OF SOLID FUELS 81
Table 1.15. Types of stove in rural households in Zhejiang, Hubei and Shaanxi, 2002
Stove type Flue Zhejiang Hubei Shaanxi
No. with stove type
Fraction of sample
No. with stove type
Fraction of sample
No. with stove type
Fraction of sample
Yes 235 18.9% 60 5.4% 166 15.6% Traditional biomass No 6 0.5% 50 4.5% 1 0.1%
Yes 684 55.0% 829 74.3% 212 19.9% Improved biomass No 7 0.6% 35 3.1% 6 0.6%
Yes 3 0.2% 141 12.6% 538 50.6% Coal
No 145 11.7% 671 60.2% 275 25.8%
LPG No 723 58.1% 258 23.1% 173 16.3%
Biogas No 2 0.2% 34 3.0%
Open Fire No 121 10.9%
Yes 90 8.5% Other
No 4 0.3% 9 0.8% 85 8.0%
From Sinton et al. (2004c) LPG, liquefied petroleum gas Many households own more than one type of stove, so the numbers of stove types reported are larger than the household samples (n=3746). Many households also have more than one stove of the same type. In Shaanxi, ‘other’ stoves probably include some type of coal stove.
(ii) Stove types, efficiencies and tasks (cooking and heating)
Programmes to promote improved stoves have long been introduced in China (Smith et al., 1993; Sinton et al., 2004c). As the survey results in Sinton et al. (2004c) described, the complex fuel situation mirrors diverse patterns of stove ownership. Most households surveyed, typically had one or more coal and one or more biomass stoves, and commonly had a gas (LPG or biogas) stove as well. Households with improved biomass stoves commonly had portable coal stoves without flues. Nearly 12% of the households reported having four or more stoves. In the overall survey sample, 95% of the biomass stoves had flues (and 77% were classified as ‘improved’); only 38% of the coal stoves were equipped with flues, although most coal stoves are of relatively recent vintage, often burn briquettes and often incorporate convenient and energy-efficient features such as water boilers and small steam/oven chambers.
More than half of the households surveyed used biomass stoves for their main cooking, and about half as many used coal stoves. Many more households had LPG

82 IARC MONOGRAPHS VOLUME 95
stoves than used them for their main cooking; many use the stoves only occasionally because of the cost of LPG and the ready availability of biofuels in many seasons. Although coal and biomass were commonly used for heating, many households in the sample (especially in Hubei) also used charcoal for heating. It is sometimes difficult to distinguish cooking from heating because cookstoves may be started earlier in the day and left to burn longer in the evening to provide some space heating. Moreover, air pollution and fuel-use surveys in China show a complicated situation in which several fuels and stoves are often in use in different parts of the house in different seasons. In addition to cookstoves and space-heating stoves, for example, the use of kangs, which are bed platforms heated from underneath by coal or biomass combustion, is common in different configurations: connected to a cookstove, with a special kang combustion chamber fueled from outside, or arranged such that a portable coal stove used during the day for heating and/or cooking is moved under the platform at night. In either case, kangs are connected to chimneys, but smoke can nevertheless leak into the bedroom. Most surveyed households—71% in Zhejiang, 80% in Hubei and 81% in Shaanxi—possessed an improved stove of some type. These proportions differed somewhat from the official figures of the Ministry of Agriculture on the wider adoption of improved stoves, but the latter are still indicative of the current predominance of improved stoves. Many small portable coal stoves still do not have chimneys, but are often ignited outside so that their smokiest stage of combustion does not occur indoors. There is also no assurance that the coal types in use today are the same as those used many decades ago in any particular area.
Improvements to biomass stoves have tended to focus on combustion efficiency and the venting of emissions outdoors. However, improved stoves can have higher emissions of pollutants per unit of delivered energy (Zhang et al., 2000). Improved coal stoves in China have been shown to increase exposure to pollutants dramatically since many are unvented (Sinton et al., 2004c).
(iii) Regional and socioeconomic variation
Region is highly correlated with socioeconomic status; per-capita income in eastern coastal provinces is typically two to three times higher than that in central and western provinces, for both rural and urban areas (National Bureau of Statistics, 2005). Provincial and national statistical data show that different patterns of fuel use are associated with different socioeconomic and geographical conditions (see Section 1.1). In wealthier provinces, use of electricity and LPG is highest. Where coal resources are richest—generally in the north—coal use is highest. In regions where coal is less readily available and incomes are low, biomass use is highest. In examining Ministry of Agriculture data for rural energy use by province, Wang and Feng (2005) found that, while electricity use was correlated with income, the fraction of total per-capita energy use from biomass was not correlated with income. The use of biofuels was higher in the Anhui households that had incomes more than double those of the Jiangsu households (Wang et al., 2006).

HOUSEHOLD USE OF SOLID FUELS 83
Recent survey results also showed patterns that suggest that solid fuel use does not necessarily decline with rising income, although the use of improved energy forms is positively correlated with income (Sinton et al., 2004c). In all three provinces, ownership of improved stoves was associated with lower incomes and, in Hubei and Shaanxi, they were significantly associated with lower levels of education. Fuels followed a similar pattern; the use of commercial fuels (coal, LPG and electricity) was generally associated with higher incomes.
(iv) Variations between rural and urban locations
No statistics have been published on biofuel use in urban areas, although a brief assessment of large coastal cities showed that a certain amount of biofuel continues to be used. Relatively large amounts of charcoal are used for cooking and winter heating in some areas according to anecdotal evidence. In terms of the total proportion of urban household energy use, however, the use of charcoal is probably small.
While studies generally reflect the fact that wealthier rural households use more gas and electricity than others and usually only the poorest burn solid fuels in pit stoves, there is a widespread lack of correlation between socioeconomic status and type of solid fuel used and type of stove (traditional or improved) used in rural areas. Tonooka et al. (2006) found this in Shaanxi, as did Sinton et al. (2004a,c). Wang and Feng (2003) found that, despite higher rates of LPG and electricity use, rural households in wealthy areas still depended on biomass for 50% or more of their energy, and sometimes up to 80%, i.e. to the same extent as households in poorer areas.
(b) Pollutant levels and exposures
Since the 1980s, many studies of indoor air quality in China have been published. The focus in the 1980s and early 1990s was on combustion-related pollutants (Sinton et al., 1995). Table 1.16 shows the range of values for particulates (TSP and PM10), benzo[a]pyrene, sulfur dioxide, nitrogen oxide and carbon monoxide. For households that use solid fuels, average levels were often in excess of–sometimes several times over–levels set for ambient air quality standards.
In recent years, some attention has returned to combustion products as a result of projects with international participation. Some of these recent studies and a few from the early 1990s are summarized in Saksena et al. (2003).
The measured range of levels of particulates is quite wide; means start in the tens of micrograms per cubic metre, but more typically reach into the hundreds of micrograms per cubic metre, or even well into the thousands, as shown in Table 1.17—a sample of the many monitoring studies carried out. Most monitoring has focused on TSP, although PM10 is much more common now, and a few studies have examined PM4 and smaller fractions. Studies of PM10 levels in kitchens during meal preparation indicate that cooks are exposed daily to levels of 600 µg/m3 or even three times that much. A recent study examined winter levels of PM4 in households in Guizhou and Shaanxi, in areas where

84 IARC MONOGRAPHS VOLUME 95
coal is contaminated with fluorine, and found that average levels in kitchen and living areas were from about 200 µg/m3 to 2000 µg/m3 (He et al., 2005).
Table 1.16. Indoor air pollution in Chinese residences: ranges of pollutant levels in research articles (1982–94) (arithmetic means)
Pollutant Fuel Urban
(mg/m3)
Rural
(mg/m3)
Standardsa
(Class II, mg/m3)
TSP Coal 0.21–2.8 0.01–20 Daily average 0.3
Gas 0.15–0.51 0.19 Max. at any time 1
Biomass 0.17–2.6
PM10 Coal 0.16–2.7 0.12–26 Daily average 0.15
Gas 0.14–0.45 – Max. at any time 0.5
Biomass 0.83–22
CO Coal 0.58–97 0.70–87 Daily average 4
Gas 0.22–36 2.4 Max. at any time 10
Biomass 0.5–16
SO2 Coal 0.01–5.8 0.01–23 Annual average 0.06
Gas 0.01–1.3 0.02–0.07 Daily average 0.15
Biomass 0.01–9.1 Max. at any time 0.5
NOx Coal 0.01–1.8 0.01–1.7 Daily average 0.1
Gas 0.01–0.88 0.03–0.05 Max. at any time 0.15
Biomass 0.01–.32
BaP Coal 0.3–190 5.3–19 000
(ng/m3) Gas 4.7–93 – Biomass 3.7–3100
From Sinton et al. (1995) BaP, benzo[a]pyrene; CO, carbon monoxide; Max., maximum; NOx, nitrogen oxide; PM, particulate matter; SO2, sulfur dioxide; TSP, total suspended particles a Class II air quality standards are intended to protect human health and apply to residential areas.
Particulate levels are typically lower in summer, sometimes by an order of magnitude, but this is not the case universally. While differences in indoor pollutant levels between similar households that use solid fuels and gas fuels are clear, the differences between solid fuels are not always evident. Studies in Inner Mongolia and Gansu have shown that dung fuels lead to both higher and lower levels of PM10 than coal in similar households (Jin et al., 2005). Furthermore, as can be seen in Figure 1.9, coal use in rural areas can apparently be cleaner than use of biomass. This alone could account for the large difference in the range of concentrations found between urban and rural households that
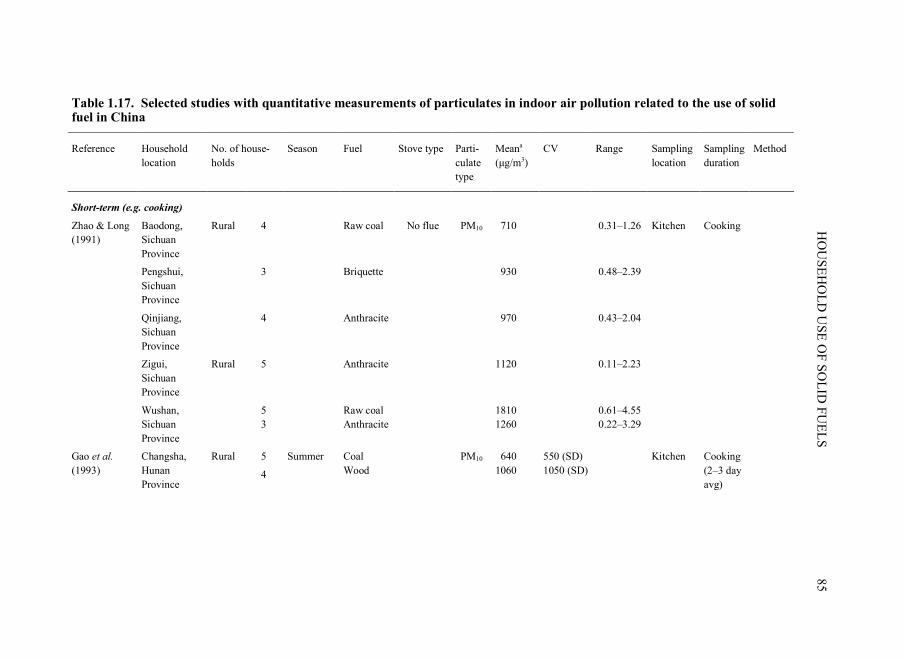
H
OU
SE
HO
LD
US
E O
F S
OL
ID F
UE
LS
85
Table 1.17. Selected studies with quantitative measurements of particulates in indoor air pollution related to the use of solid fuel in China
Reference Household location
No. of house-holds
Season Fuel Stove type Parti-culate type
Meana (µg/m3)
CV Range Sampling location
Sampling duration
Method
Short-term (e.g. cooking)
Zhao & Long (1991)
Baodong, Sichuan Province
Rural 4 Raw coal No flue PM10 710 0.31–1.26 Kitchen Cooking
Pengshui, Sichuan Province
3 Briquette 930 0.48–2.39
Qinjiang, Sichuan Province
4 Anthracite 970 0.43–2.04
Zigui, Sichuan Province
Rural 5 Anthracite 1120 0.11–2.23
5 Raw coal 1810 0.61–4.55
Wushan, Sichuan Province
3 Anthracite 1260 0.22–3.29
Gao et al. (1993)
Changsha, Hunan Province
Rural
5
4
Summer
Coal Wood
PM10
640 1060
550 (SD) 1050 (SD)
Kitchen
Cooking (2–3 day avg)
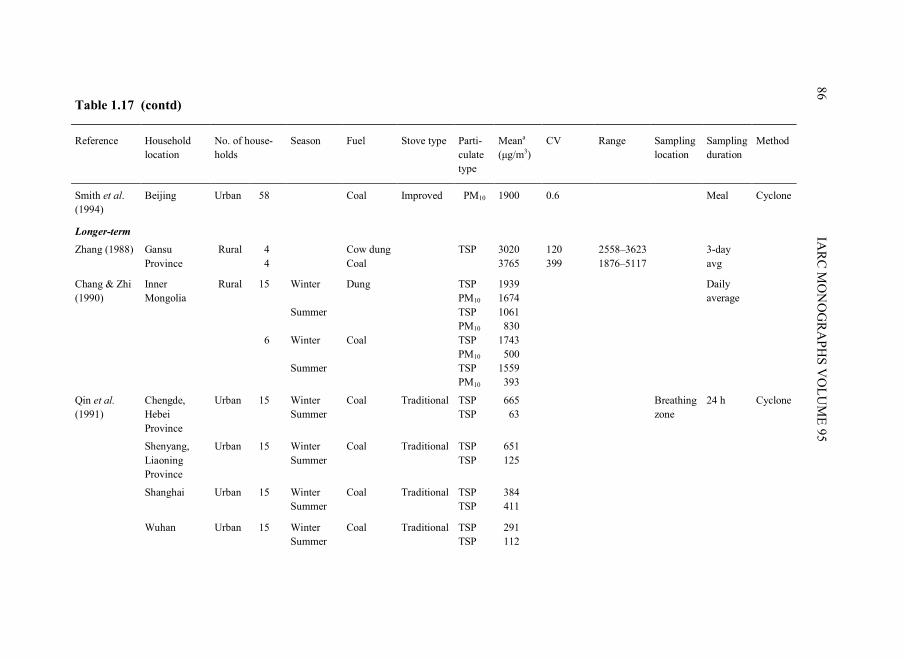
86 IA
RC
MO
NO
GR
AP
HS
VO
LU
ME
95
Table 1.17 (contd)
Reference Household location
No. of house-holds
Season Fuel Stove type Parti-culate type
Meana (µg/m3)
CV Range Sampling location
Sampling duration
Method
Smith et al. (1994)
Beijing Urban 58 Coal Improved PM10 1900 0.6 Meal Cyclone
Longer-term
Zhang (1988) Gansu Province
Rural 4 4
Cow dung Coal
TSP
3020 3765
120 399
2558–3623 1876–5117
3-day avg
Rural 15 Winter Dung TSP 1939 Chang & Zhi (1990)
Inner Mongolia PM10 1674
Daily average
Summer TSP 1061 PM10 830 6 Winter Coal TSP 1743 PM10 500 Summer TSP 1559 PM10 393
Qin et al. (1991)
Chengde, Hebei Province
Urban 15
Winter Summer
Coal
Traditional
TSP TSP
665 63
Breathing zone
24 h Cyclone
Winter Coal Traditional TSP 651 Shenyang, Liaoning Province
Urban
15
Summer TSP 125
Shanghai Urban 15 Winter Coal Traditional TSP 384 Summer TSP 411
Wuhan Urban 15 Winter Coal Traditional TSP 291 Summer TSP 112
H
OU
SE
HO
LD
US
E O
F S
OL
ID F
UE
LS
87
Table 1.17 (contd)
Reference Household location
No. of house-holds
Season Fuel Stove type Parti-culate type
Meana (µg/m3)
CV Range Sampling location
Sampling duration
Method
Xu & Wang (1993)
Haidian, Beijing
Urban 31 Summer Coal Traditional TSP 41 139 Bedroom 8 h Gravi-metric
Dongcheng, Beijing
Urban 8 Summer Coal Traditional TSP 90 110 Bedroom 8 h
Shijingshan, Beijing
Urban 10 Summer Coal Traditional TSP 152 137 Bedroom 8 h
Venners et al. (2001)
Anqing, Anhui Province
Rural 165 Summer Wood PM10 248 Kitchen and bedroom
Gravi-metric
Lan et al. (2002)
Xuanwei, Yunnan Province
Rural 15 Coal traditional (n=2); improved (n=13)
PM10 2080 1.2 m 24 h/day, 5 conse-cutive days
Gravi-metric
a Data are arithmetic means. avg, average; CV, coefficient of variation; PM, particulate matter; SD, standard deviation; TSP, total suspended particulates
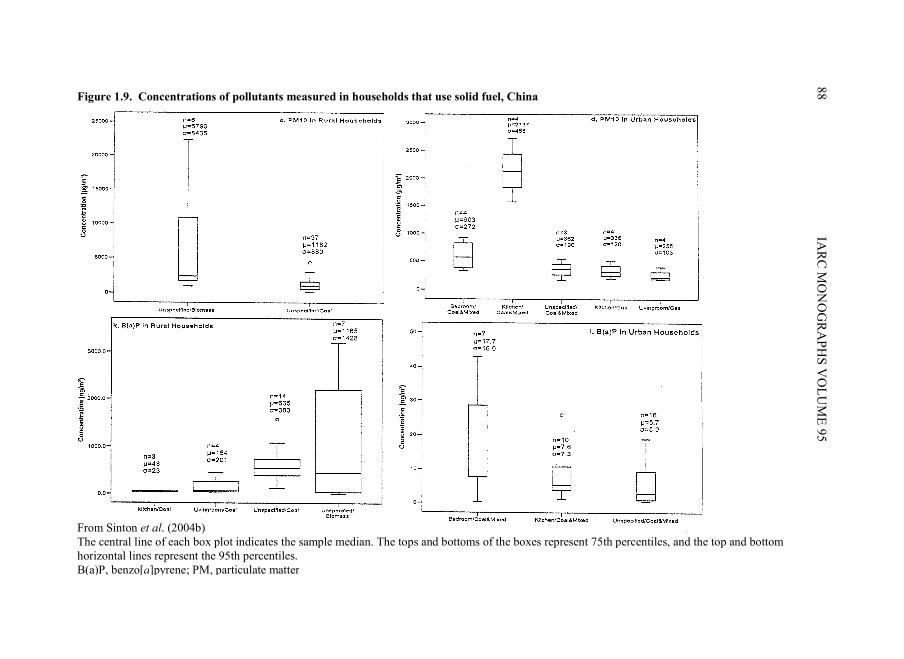
88 IA
RC
MO
NO
GR
AP
HS
VO
LU
ME
95
Figure 1.9. Concentrations of pollutants measured in households that use solid fuel, China
From Sinton et al. (2004b) The central line of each box plot indicates the sample median. The tops and bottoms of the boxes represent 75th percentiles, and the top and bottom horizontal lines represent the 95th percentiles. B(a)P, benzo[a]pyrene; PM, particulate matter
HOUSEHOLD USE OF SOLID FUELS 89
use solid fuels. The former are exposed to much lower levels of PM10, but the levels are still significantly higher in general than recognized ambient and/or indoor standards.
The impact on indoor air quality of improved stoves is similarly dependent on particular circumstances. For instance, improved stoves do not always have lower emissions factors (Zhang & Smith, 1999). Confounding factors such as differences in fuel combinations, shifting patterns of tasks and fuel use over time and use of multiple stoves may all influence exposure levels. The three-province survey (Sinton et al., 2004a) found that, taking smoking into account, in summer when stove use was dominantly for cooking, households that used coal experienced higher particulate (PM4) levels than those that used biomass combinations, and traditional stoves emitted higher particulate levels than improved stoves (Table 1.18). Such differences disappeared during the winter heating season, however, when many households used unvented stoves; tobacco smoke was a confounding factor throughout. Even in summer and in households with no smokers, average PM4 levels were in the range of 180–450 µg/m3.
The same study (Sinton et al., 2004a) found that, in some cases, kitchens were not the sites with the highest average particulate levels. Those households that used coal or a combination of coal and biomass, unlike those that used biomass or a combination of biomass and gas, had higher particulate levels in living rooms than in kitchens. In living rooms, heating, smoking and perhaps other factors can result in levels over time that are higher than those in kitchens, despite the peaks associated with cooking. Among all the fuel combinations, average winter levels ranged from just under 100 to over 300 µg/m3.
A recent survey of indoor air in households that used coal and biomass fuels in four provinces (Jin et al., 2005) showed that a variety of stove and fuel combinations in different seasons leads to average PM4 levels in the hundreds of micrograms per cubic metre (Table 1.19). Differences between rooms with and without stoves were small.
A large number of studies that monitored benzo[a]pyrene were restricted to households in Xuan Wei County, Yunnan Province, but many others have reported assays performed elsewhere (Table 1.19). Measured indoor levels of benzo[a]pyrene were in a range spanning four orders of magnitude, from single digits (1.16 ng/m3) to over 10 000 ng/m3 in some of the studies in Xuan Wei County, in which bituminous coal led to much higher indoor levels than anthracite. In studies performed in other parts of the country, household averages rarely exceeded 40 ng/m3. The relative preponderance in the literature of the Xuan Wei County studies may account in part for the difference observed in a comparison of the results of monitoring studies in urban and rural households that used solid fuels (Figure 1.9).
The combustion of wood fuels (using traditional stoves) emits levels of benzo[a]pyrene that fall within the range found in households that use coal (in improved stoves), and, in fact, have an upper range that far exceeds that found in the studies of coal. In the households in Xuan Wei County that used wood fuels (using traditional stoves), levels were often much higher than those in households that used coal (in improved stoves) in other parts of the country, which highlights the role played by stove type.

90 IA
RC
MO
NO
GR
AP
HS
VO
LU
ME
95
Table 1.18. Indoor air pollution levels in rural households in Hubei and Shaanxi, summer 2002
Room Fuel Smoking PM4 (µ/m3)
HOBO CO (mean ppm)
CO Dosimeter tube (ppm)
Living room Wood twigs, agricultural residues, coal
Yes No
N Mean N Mean
15 316 8 235
5 1 2 0
5 38 2 23
Agricultural residues, coal Yes No
N Mean N Mean
130 341 58 222
13 17 4 1
14 130 6 20
Coal products Yes No
N Mean N Mean
79 301 51 284
15 11 8 17
16 85 8 73
Kruskal Wallis test Asymp. Sig. 0.36 0.09 0.00

H
OU
SE
HO
LD
US
E O
F S
OL
ID F
UE
LS
91
Table 1.18 (contd)
Room Fuel Smoking PM4 (µ/m3)
HOBO CO (mean ppm)
CO Dosimeter tube (ppm)
Kitchen Wood twigs, agricultural residues, coal
Yes No
N Mean N Mean
15 478 8 191
4 4 1 0
5 38 2 23
Agricultural residues, coal Yes No
N Mean N Mean
37 418 16 188
5 11 1 3
6 147 2 25
Coal products Yes No
N Mean N Mean
29 263 15 451
3 8 2 35
4 125 2 125
Kruskal Wallis test Asymp. sig. 0.29 0.06 0.00
From Sinton et al. (2004a) Asymp. sig., asymptote significance; co, carbon monoxide; N, number; PM, particulate matter N.B. Most households that use agricultural residues and wood also used some coal.
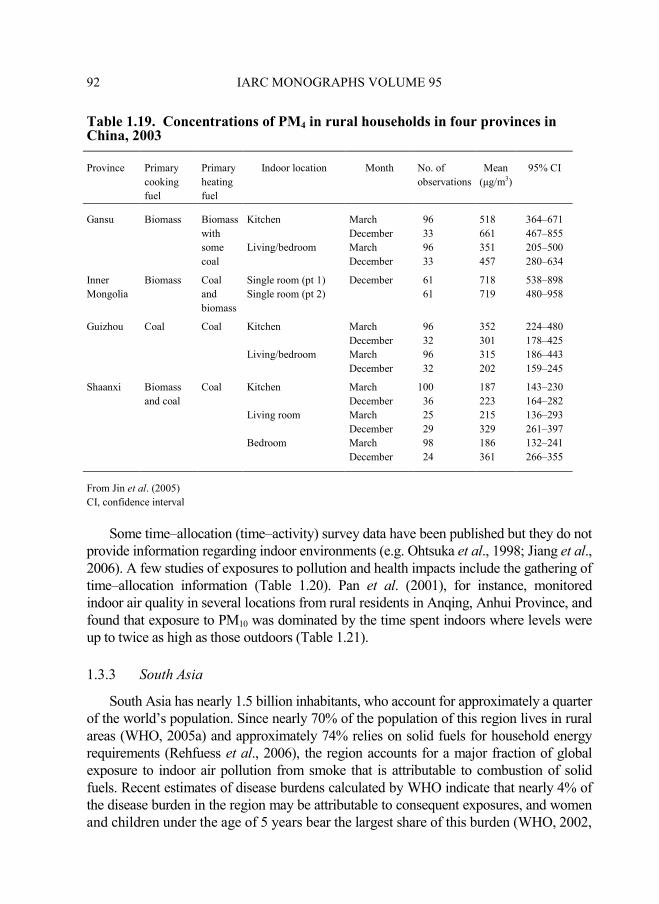
92 IARC MONOGRAPHS VOLUME 95
Table 1.19. Concentrations of PM4 in rural households in four provinces in China, 2003
Province Primary cooking fuel
Primary heating fuel
Indoor location Month No. of observations
Mean (µg/m3)
95% CI
Gansu Biomass Biomass with some coal
Kitchen Living/bedroom
March December March December
96 33 96 33
518 661 351 457
364–671 467–855 205–500 280–634
Inner Mongolia
Biomass Coal and biomass
Single room (pt 1) Single room (pt 2)
December 61 61
718 719
538–898 480–958
Guizhou Coal Coal Kitchen Living/bedroom
March December March December
96 32 96 32
352 301 315 202
224–480 178–425 186–443 159–245
Shaanxi Biomass and coal
Coal
Kitchen Living room Bedroom
March December March December March December
100 36 25 29 98 24
187 223 215 329 186 361
143–230 164–282 136–293 261–397 132–241 266–355
From Jin et al. (2005) CI, confidence interval
Some time–allocation (time–activity) survey data have been published but they do not provide information regarding indoor environments (e.g. Ohtsuka et al., 1998; Jiang et al., 2006). A few studies of exposures to pollution and health impacts include the gathering of time–allocation information (Table 1.20). Pan et al. (2001), for instance, monitored indoor air quality in several locations from rural residents in Anqing, Anhui Province, and found that exposure to PM10 was dominated by the time spent indoors where levels were up to twice as high as those outdoors (Table 1.21).
1.3.3 South Asia
South Asia has nearly 1.5 billion inhabitants, who account for approximately a quarter of the world’s population. Since nearly 70% of the population of this region lives in rural areas (WHO, 2005a) and approximately 74% relies on solid fuels for household energy requirements (Rehfuess et al., 2006), the region accounts for a major fraction of global exposure to indoor air pollution from smoke that is attributable to combustion of solid fuels. Recent estimates of disease burdens calculated by WHO indicate that nearly 4% of the disease burden in the region may be attributable to consequent exposures, and women and children under the age of 5 years bear the largest share of this burden (WHO, 2002,

H
OU
SE
HO
LD
US
E O
F S
OL
ID F
UE
LS
93
Table 1.20. Selected studies with quantitative measurements of benzo[a]pyrene in indoor air pollution related to the use of solid fuel in China
Reference Household location
No. of house-holds
Season Fuel Stove type Meana (ng/m3)
CV Range Sampling location
Sampling duration
Method
Short-term (e.g. cooking)
6 1977 Bituminous coal
Kang 453.2 18.3–5992.4 Living room
Yunnan Province Health Station (1984)
Xuanwei, Yunnan Province
Rural
6 Anthracite Kang 69.1 17.7–191.7 Living
room
Meal preparation
Fluorescence spectrometry
Rural 1 Wood 67.5 2 h Yang et al. (1988)
Xuanwei, Yunnan Province
1 Bituminous coal
399.1 Fluorescence spectrometry
1 295.5 1 Anthracite 8.5 1 25.5
Longer-term
3 Autumn Coal briquette
1.2 Kitchen Guo & Tang (1985)
Nanning, Guangxi Province
Urban
2 4.1
2-day averages
3 1.4
8 Autumn Coal Improved 13.4 4–21 1.5 m 12 h GC/MS Rural 4 Autumn Wood 3100 0.323
Mumford et
al. (1987) Xuanwei, Yunnan Province
4 Bituminous coal
14 700 0.204
1 Anthracite 600
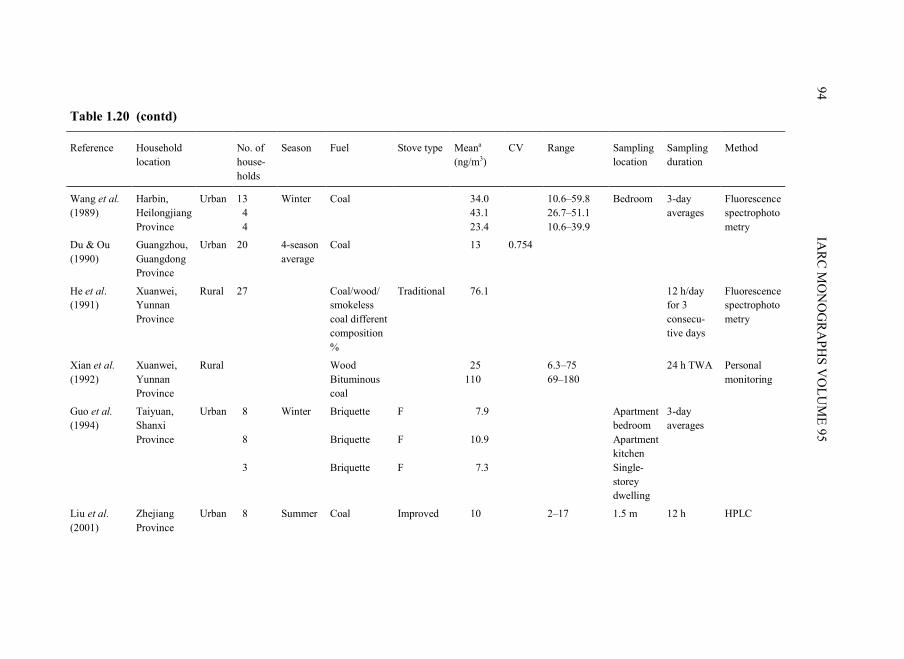
94 IA
RC
MO
NO
GR
AP
HS
VO
LU
ME
95
Table 1.20 (contd)
Reference Household location
No. of house-holds
Season Fuel Stove type Meana (ng/m3)
CV Range Sampling location
Sampling duration
Method
13 Winter Coal 34.0 10.6–59.8 Bedroom 4 43.1 26.7–51.1
Wang et al. (1989)
Harbin, Heilongjiang Province
Urban
4 23.4 10.6–39.9
3-day averages
Fluorescence spectrophotometry
Du & Ou (1990)
Guangzhou, Guangdong Province
Urban 20 4-season average
Coal 13 0.754
He et al. (1991)
Xuanwei, Yunnan Province
Rural 27 Coal/wood/ smokeless coal different composition %
Traditional 76.1 12 h/day for 3 consecu-tive days
Fluorescence spectrophotometry
Rural Wood 25 6.3–75 24 h TWA Xian et al. (1992)
Xuanwei, Yunnan Province
Bituminous coal
110 69–180 Personal monitoring
Guo et al. (1994)
Urban 8 Winter Briquette F 7.9 Apartment bedroom
3-day averages
Taiyuan, Shanxi Province 8 Briquette F 10.9 Apartment
kitchen
3 Briquette F 7.3 Single-storey dwelling
Liu et al. (2001)
Zhejiang Province
Urban 8 Summer Coal Improved 10 2–17 1.5 m 12 h HPLC
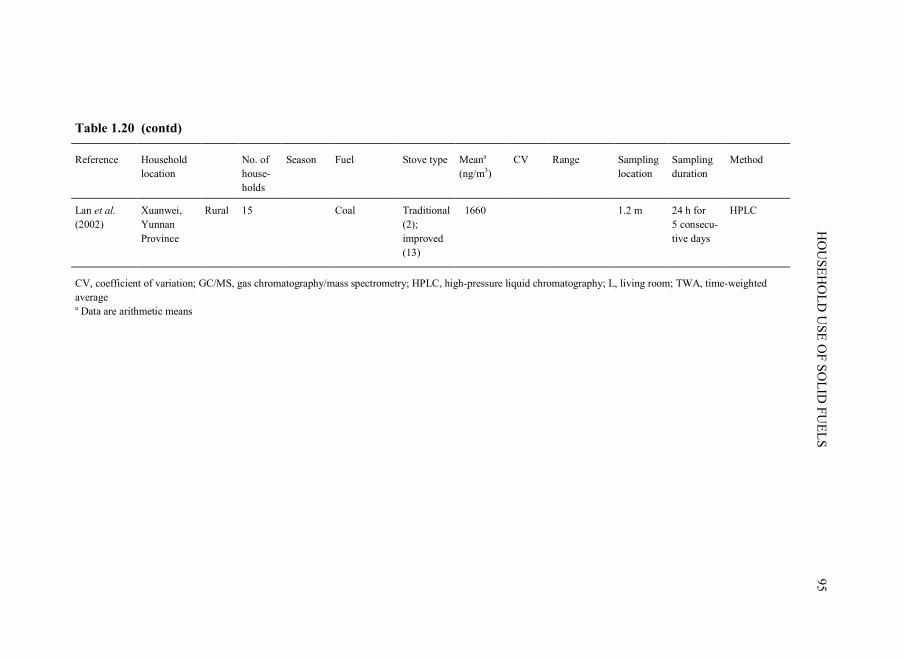
H
OU
SE
HO
LD
US
E O
F S
OL
ID F
UE
LS
95
Table 1.20 (contd)
Reference Household location
No. of house-holds
Season Fuel Stove type Meana (ng/m3)
CV Range Sampling location
Sampling duration
Method
Lan et al. (2002)
Xuanwei, Yunnan Province
Rural 15 Coal Traditional (2); improved (13)
1660 1.2 m 24 h for 5 consecu-tive days
HPLC
CV, coefficient of variation; GC/MS, gas chromatography/mass spectrometry; HPLC, high-pressure liquid chromatography; L, living room; TWA, time-weighted average
a Data are arithmetic means
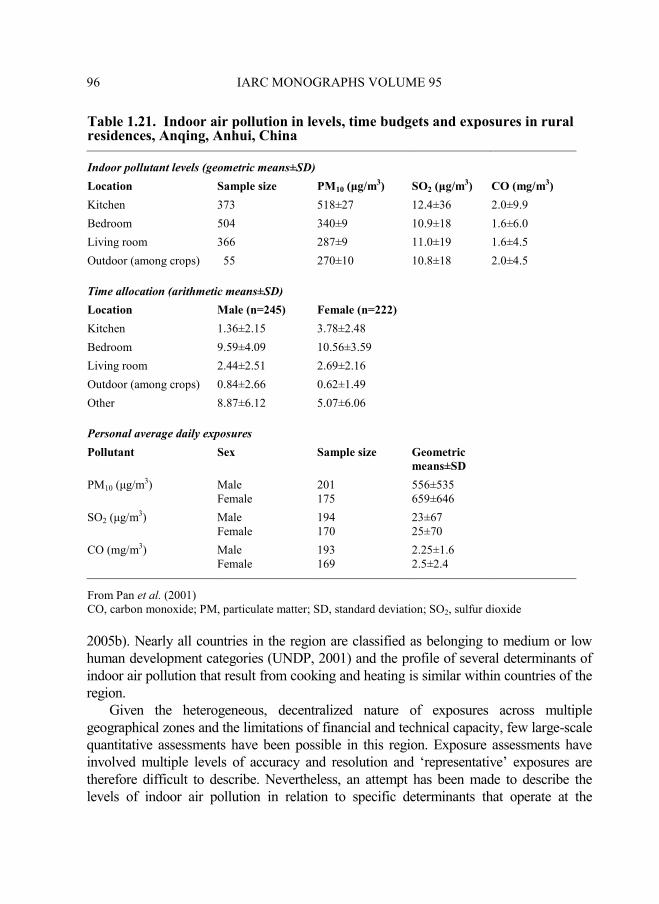
96 IARC MONOGRAPHS VOLUME 95
Table 1.21. Indoor air pollution in levels, time budgets and exposures in rural residences, Anqing, Anhui, China
Indoor pollutant levels (geometric means±SD)
Location Sample size PM10 (µg/m3) SO2 (µg/m3) CO (mg/m3)
Kitchen 373 518±27 12.4±36 2.0±9.9
Bedroom 504 340±9 10.9±18 1.6±6.0
Living room 366 287±9 11.0±19 1.6±4.5
Outdoor (among crops) 55 270±10 10.8±18 2.0±4.5
Time allocation (arithmetic means±SD)
Location Male (n=245) Female (n=222)
Kitchen 1.36±2.15 3.78±2.48
Bedroom 9.59±4.09 10.56±3.59
Living room 2.44±2.51 2.69±2.16
Outdoor (among crops) 0.84±2.66 0.62±1.49
Other 8.87±6.12 5.07±6.06
Personal average daily exposures
Pollutant
Sex
Sample size
Geometric
means±SD
PM10 (µg/m3)
Male Female
201 175
556±535 659±646
SO2 (µg/m3)
Male Female
194 170
23±67 25±70
CO (mg/m3)
Male Female
193 169
2.25±1.6 2.5±2.4
From Pan et al. (2001) CO, carbon monoxide; PM, particulate matter; SD, standard deviation; SO2, sulfur dioxide
2005b). Nearly all countries in the region are classified as belonging to medium or low human development categories (UNDP, 2001) and the profile of several determinants of indoor air pollution that result from cooking and heating is similar within countries of the region.
Given the heterogeneous, decentralized nature of exposures across multiple geographical zones and the limitations of financial and technical capacity, few large-scale quantitative assessments have been possible in this region. Exposure assessments have involved multiple levels of accuracy and resolution and ‘representative’ exposures are therefore difficult to describe. Nevertheless, an attempt has been made to describe the levels of indoor air pollution in relation to specific determinants that operate at the
HOUSEHOLD USE OF SOLID FUELS 97
household (microenvironmental), socioeconomic and geographical (macroenvironmental) levels.
(a) Exposure data
Since they are currently outside the regulatory purview in most countries of the region, methods for the measurement of indoor air pollution have followed considerations of research as opposed to uniform protocols in adherence to national or international standards. Field logistics, contributions from multiple determinants and resource limitations have further contributed to additional challenges in making such measurements. Exposure assessments/estimations have thus been made on different scales with various levels of accuracy and resolution, in large part by individual research groups. As described earlier (Figure 1.9), the methods used in the region have ranged from fuel surveys to quantitative assessments of one or more pollutants under multiple exposure configurations. A few studies have also developed models to estimate exposure potentials. Accordingly, the results of exposure studies in the region are described below, by broadly classifying them as qualitative or quantitative assessments.
(i) Qualitative studies of exposure
Methods that rely on categorical qualitative variables collected from large populations can be expected to be less accurate and representative than those based on direct measurements of household or individual levels. However, as described below, every single quantitative measurement in this region unequivocally points to overwhelming pollution loads in homes that use solid fuel, which are often an order of magnitude higher than those in homes that do not use such fuels and several fold higher than commonly available exposure guidelines for specific pollutants. This has allowed ‘reported solid fuel use’ to be used quite reliably as a proxy for exposure in many epidemiological studies. Furthermore, the inclusion of information on the use of fuel in routinely administered population-based surveys, including national census surveys in many countries of this region, has allowed the generation of regional, national and sub-national estimates for percentages of total population at risk of such exposures to indoor air pollution. Exposure estimates recently generated by WHO (2002) for the purposes of assessing attributable (region-specific/global) disease burdens are an example of such an exercise. Results from selected recent studies that provided estimates of country levels are summarized in Table 1.22.
Information on several determinants (described in the previous section) other than the use of fuel has been collected in some national and many regional surveys. Many of these determinants are not independently associated with exposures to indoor air pollution and their contributions may be significant, but remain secondary to the type of fuel used. Many of these have, however, been found to be useful for extrapolation in models in which either data on fuel use have not been available (e.g. using data on income, education, energy market structures) or for further stratification of exposures on the basis
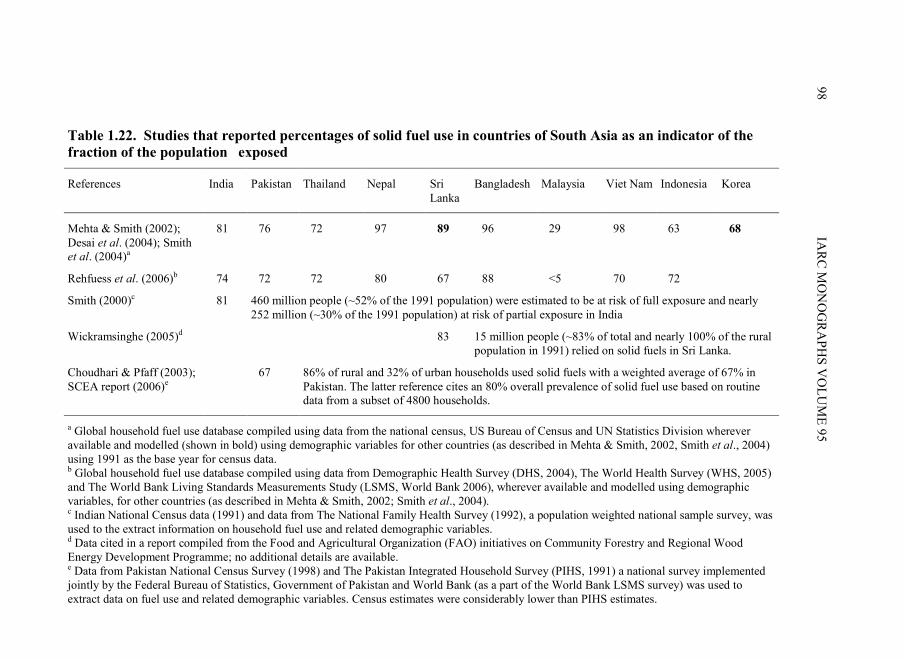
98 IA
RC
MO
NO
GR
AP
HS
VO
LU
ME
95
Table 1.22. Studies that reported percentages of solid fuel use in countries of South Asia as an indicator of the
fraction of the population exposed
References India Pakistan Thailand Nepal Sri Lanka
Bangladesh Malaysia Viet Nam Indonesia Korea
Mehta & Smith (2002); Desai et al. (2004); Smith et al. (2004)a
81 76 72 97 89 96 29 98 63 68
Rehfuess et al. (2006)b 74 72 72 80 67 88 <5 70 72
Smith (2000)c 81 460 million people (~52% of the 1991 population) were estimated to be at risk of full exposure and nearly 252 million (~30% of the 1991 population) at risk of partial exposure in India
Wickramsinghe (2005)d 83 15 million people (~83% of total and nearly 100% of the rural population in 1991) relied on solid fuels in Sri Lanka.
Choudhari & Pfaff (2003); SCEA report (2006)e
67 86% of rural and 32% of urban households used solid fuels with a weighted average of 67% in Pakistan. The latter reference cites an 80% overall prevalence of solid fuel use based on routine data from a subset of 4800 households.
a Global household fuel use database compiled using data from the national census, US Bureau of Census and UN Statistics Division wherever available and modelled (shown in bold) using demographic variables for other countries (as described in Mehta & Smith, 2002, Smith et al., 2004) using 1991 as the base year for census data. b Global household fuel use database compiled using data from Demographic Health Survey (DHS, 2004), The World Health Survey (WHS, 2005) and The World Bank Living Standards Measurements Study (LSMS, World Bank 2006), wherever available and modelled using demographic variables, for other countries (as described in Mehta & Smith, 2002; Smith et al., 2004). c Indian National Census data (1991) and data from The National Family Health Survey (1992), a population weighted national sample survey, was used to the extract information on household fuel use and related demographic variables. d Data cited in a report compiled from the Food and Agricultural Organization (FAO) initiatives on Community Forestry and Regional Wood Energy Development Programme; no additional details are available. e Data from Pakistan National Census Survey (1998) and The Pakistan Integrated Household Survey (PIHS, 1991) a national survey implemented jointly by the Federal Bureau of Statistics, Government of Pakistan and World Bank (as a part of the World Bank LSMS survey) was used to extract data on fuel use and related demographic variables. Census estimates were considerably lower than PIHS estimates.

HOUSEHOLD USE OF SOLID FUELS 99
of other quantitative studies (e.g. using data on stove type, ventilation, kitchen location, age, gender). Results from a selection of such studies are provided in Table 1.23.
Table 1.23. Studies that reported household survey/modelled data for potential exposures related to the use of solid fuel in South Asia
Country Description of study results Reference
Bangladesh Quantitative measurement (of PM10) results and determinant information from a stratified sample of 236 homes were extrapolated using regression models to predict air pollution levels in six regions within Bangladesh. Predicted levels in poorest, least educated households were found to be twice as high as those in the richest and most educated with significant geographical variations reflecting differences in distribution of fuel use and house construction materials. Exposures for young children and poorly educated women were found to be fourfold higher than those for men in higher income households with educated women (range of 24-h average levels measured, ~133–638 µg/m3 PM10)
Dasgupta et al. (2004a,b)
India Systematic laboratory measurements of particulates and greenhouse gas emissions from 26 fuel/stove combinations used in conjunction with a rural fuel use database and information on stove use from the relevant Government Ministry to generate state-level information on biofuel use, stove use, extent of improved stoves and emissions from solid fuel use. The emissions inventory shows major contributions to greenhouse gas and health-damaging pollutants from biomass-burning stoves. (Although several determinants intervene between emission and exposure, total emissions are largely driven by fuel type similar to concentrations and exposures across states making secondary data on total emissions a useful proxy for population exposure).
Smith et al. (2000)
India Quantitative measurement (of respirable particulate matter) results from a stratified sample of 420 households and determinant information from 1032 households identified fuel type, kitchen configuration, ventilation, age and gender to be the most important determinants of exposures in three districts of the southern state of Andhra Pradesh. Evaluation of the national improved stove programme across six states found little evidence of sustained use and maintenance following distribution. Reported stove use currently remains a poor proxy for potential exposure reductions (range of 24-h average levels measured, ~73–732 µg/m3 PM4).
World Bank (2002a, 2004a)
100 IARC MONOGRAPHS VOLUME 95
Table 1.23. (contd)
Country Description of study results Reference
India Quantitative data from ESMAP study above used to generate district level concentration and exposure profiles based on distribution of fuel use, kitchen configuration, age and sex distribution for the state of Andhra Pradesh. District level distributions largely driven by differences in fuel use. Differences were relatively modest compared with the high average exposures estimated for each district (range of modelled 24-h weighted average estimates for the district, ~350–450 µg/m3 PM4).
Balakrishnan et al. (2004)
India Information on quantities of biofuel used compiled from food consumption statistics and specific energy requirements for food cooking for all major states and regions of India. Total biofuel consumption was estimated (with significantly lower uncertainties than that previously estimated using energy surveys) at 379 Tg/year with a national average biofuel mix of 74:16:10 for fuel-wood, dung and crop residues respectively. North and eastern regions of the country show higher biofuel consumption together with high per-capita food consumption and higher prevalence of dung and crop residue use. (Since consumption is linked to emissions and emissions to exposures, this represents a new measure to judge exposure potential related to cooking with biomass).
Habib et al. (2004)
Sri Lanka Questionnaire survey of 1720 households from three villages in Sri Lanka used to prepare a profile of gender and poverty dimensions of energy access. Approximately 96% of surveyed households used biomass with 42% using some form of improved stoves and 67% of all stoves having chimneys. About 79% had attached kitchens and ~20% had kitchens well separated from the main house.
Wickramsinghe (2005)
(ii) Quantitative studies of exposure
While domestic combustion of solid fuel generates a mixture of pollutants, because of limited technical feasibilities and difficult field logistics, most studies in the region have restricted themselves to cross-sectional measurements of single pollutants (most often PM and/or carbon monoxide). However, a few large-scale studies (that mostly measured fractions of PM) carried out in India, Nepal and Bangladesh across multiple exposure configurations have provided considerable understanding of spatial, temporal and other determinants of population exposure related to solid fuel use in the region. A few have

HOUSEHOLD USE OF SOLID FUELS 101
also assessed levels of other gaseous pollutants including sulfur dioxide, nitrogen dioxide and select air toxics including PAHs and formaldehyde. Limited evidence is currently available to indicate (i) whether PM and carbon monoxide are representative indicator pollutants, (ii) whether the two are themselves consistently correlated under a wide range of exposure circumstances and (iii) how levels and proportions of other toxic constituents may vary with alternative distributions of determinants (most importantly with fuel type).
The following sections describe selected studies conducted within the region that measured levels of indoor air pollution to illustrate the scale and extent of exposures associated with the use of solid fuels for cooking and heating indoors. Several smaller studies have also been conducted, and, while an exhaustive listing of all studies conducted could not be compiled, Table 1.24 lists the major studies available in the published literature as well as in reports of projects available in the public domain. The global database of indoor air pollution studies maintained by the Department of Environmental Health Sciences, University of California Berkeley, USA (Saksena et al., 2003; WHO, 2005a), the bibliography of indoor air pollution studies maintained by The Energy Research Institute, New Delhi, India, and independent articles retrieved through internet search engines served as the basis for this compilation.
(iii) Measurement studies in India
Quantitative measurement studies have been conducted in India since the early 1980s. Many of the earlier studies only measured TSP matter during short cooking periods. One of the earliest large-scale studies of exposure assessment was conducted in the households of Garhwal, Himalayas (Saksena et al., 1992), and involved nearly 122 households in three villages across three seasons. Daily integrated exposure to TSP matter and carbon monoxide was assessed by personal and stationary sampling of air in six microenvironments. Concentrations of pollutants measured at the time of cooking were found to be very high (5.6 mg/m3 and 21 ppm for TSP matter and carbon monoxide, respectively) but comparable with those measured in the Indian plains. The mean concentration in the kitchen while cooking often exceeded the concentration in other microenvironments, including the living rooms, and outdoors by an order of magnitude or more. Combining area measurements with individual time–activity records, the daily exposure of adult women to TSP matter and carbon monoxide was estimated to be 37 mg•h/m3 and 110 µg•h/m3, respectively.
More recently, two large-scale exposure assessment exercises for respirable particulates have been completed in India in the southern states of Tamil Nadu and Andhra Pradesh, respectively. In Tamil Nadu (Balakrishnan et al., 2002), a total of 436 rural households across four districts were monitored for respirable particulates (median aerodynamic diameter, 4 µm). Concentrations were determined during several cooking and non-cooking sessions in households and 24-h exposures were calculated on the basis of these concentrations in conjunction with time–activity records of household members. Concentrations of respirable particulate matter ranged from 500 to 2000 µg/m3 during cooking in households that used biomass (geometric mean [GM], 1043–1346 µg/m3)
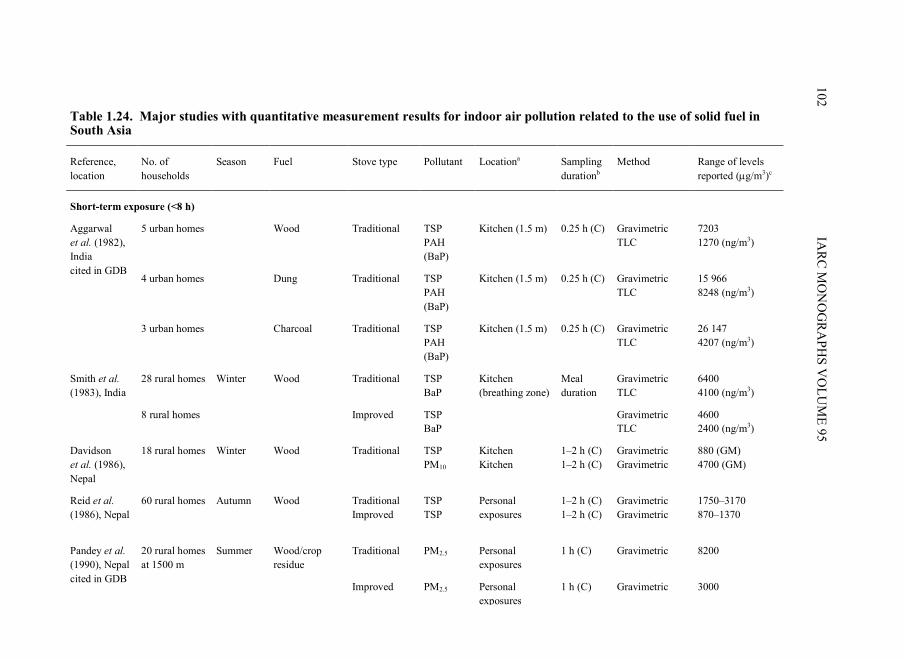
102 IA
RC
MO
NO
GR
AP
HS
VO
LU
ME
95
Table 1.24. Major studies with quantitative measurement results for indoor air pollution related to the use of solid fuel in South Asia
Reference, location
No. of households
Season Fuel Stove type Pollutant Locationa Sampling durationb
Method Range of levels reported (µg/m3)c
Short-term exposure (<8 h)
5 urban homes Wood Traditional TSP PAH (BaP)
Kitchen (1.5 m) 0.25 h (C) Gravimetric TLC
7203 1270 (ng/m3)
Aggarwal et al. (1982), India cited in GDB
4 urban homes Dung Traditional TSP PAH (BaP)
Kitchen (1.5 m) 0.25 h (C) Gravimetric TLC
15 966 8248 (ng/m3)
3 urban homes Charcoal Traditional TSP PAH (BaP)
Kitchen (1.5 m) 0.25 h (C) Gravimetric TLC
26 147 4207 (ng/m3)
Smith et al. (1983), India
28 rural homes Winter Wood Traditional TSP BaP
Meal duration
Gravimetric TLC
6400 4100 (ng/m3)
8 rural homes Improved TSP BaP
Kitchen (breathing zone)
Gravimetric TLC
4600 2400 (ng/m3)
Davidson et al. (1986), Nepal
18 rural homes Winter Wood Traditional TSP PM10
Kitchen Kitchen
1–2 h (C) 1–2 h (C)
Gravimetric Gravimetric
880 (GM) 4700 (GM)
Reid et al. (1986), Nepal
60 rural homes Autumn Wood Traditional Improved
TSP TSP
Personal exposures
1–2 h (C) 1–2 h (C)
Gravimetric Gravimetric
1750–3170 870–1370
Traditional PM2.5
Personal exposures
1 h (C)
Gravimetric
8200
Pandey et al. (1990), Nepal cited in GDB
20 rural homes at 1500 m
Summer Wood/crop residue
Improved PM2.5
Personal exposures
1 h (C)
Gravimetric
3000
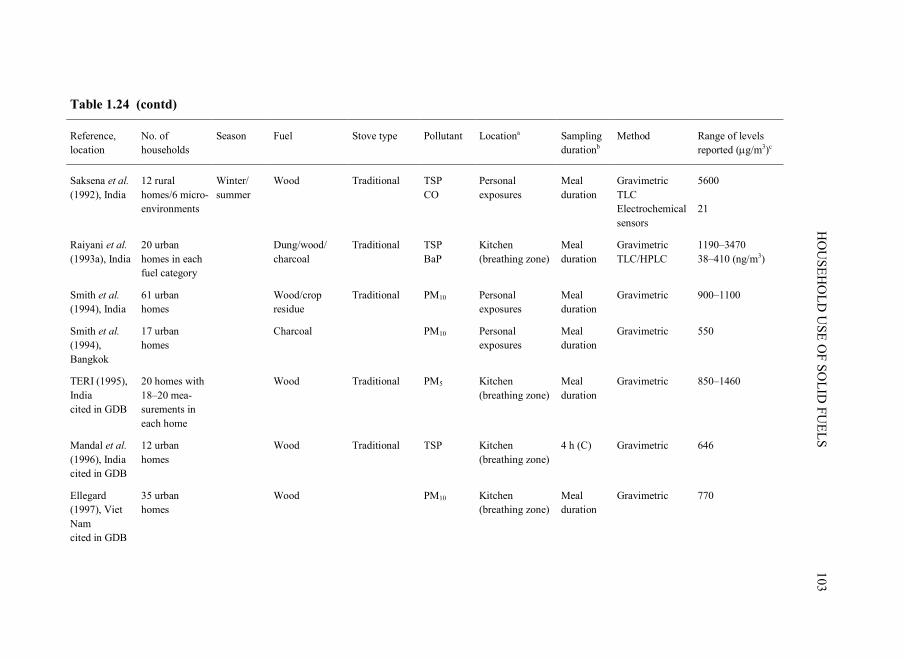
H
OU
SE
HO
LD
US
E O
F S
OL
ID F
UE
LS
103
Table 1.24 (contd)
Reference, location
No. of households
Season Fuel Stove type Pollutant Locationa Sampling durationb
Method Range of levels reported (µg/m3)c
Saksena et al. (1992), India
12 rural homes/6 micro-environments
Winter/ summer
Wood Traditional TSP CO
Personal exposures
Meal duration
Gravimetric TLC Electrochemical sensors
5600 21
Raiyani et al. (1993a), India
20 urban homes in each fuel category
Dung/wood/ charcoal
Traditional TSP BaP
Kitchen (breathing zone)
Meal duration
Gravimetric TLC/HPLC
1190–3470 38–410 (ng/m3)
Smith et al. (1994), India
61 urban homes
Wood/crop residue
Traditional PM10
Personal exposures
Meal duration
Gravimetric
900–1100
Smith et al. (1994), Bangkok
17 urban homes
Charcoal PM10
Personal exposures
Meal duration
Gravimetric
550
TERI (1995), India cited in GDB
20 homes with 18–20 mea-surements in each home
Wood Traditional PM5 Kitchen (breathing zone)
Meal duration
Gravimetric 850–1460
Mandal et al. (1996), India cited in GDB
12 urban homes
Wood Traditional TSP Kitchen (breathing zone)
4 h (C) Gravimetric 646
Ellegard (1997), Viet Nam cited in GDB
35 urban homes
Wood PM10 Kitchen (breathing zone)
Meal duration
Gravimetric 770
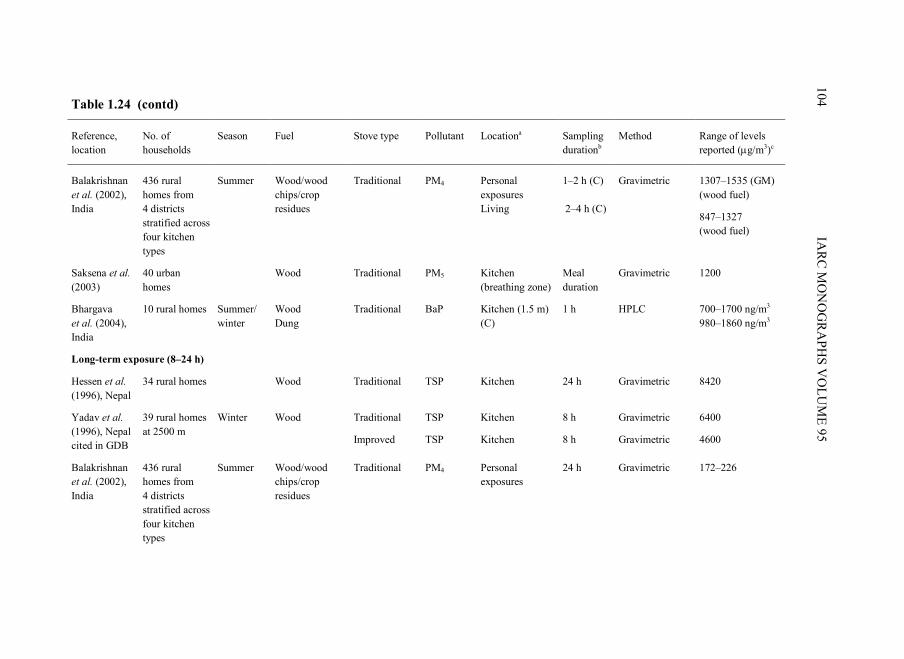
104 IA
RC
MO
NO
GR
AP
HS
VO
LU
ME
95
Table 1.24 (contd)
Reference, location
No. of households
Season Fuel Stove type Pollutant Locationa Sampling durationb
Method Range of levels reported (µg/m3)c
Balakrishnan et al. (2002), India
436 rural homes from 4 districts stratified across four kitchen types
Summer Wood/wood chips/crop residues
Traditional PM4 Personal exposures Living
1–2 h (C) 2–4 h (C)
Gravimetric 1307–1535 (GM) (wood fuel)
847–1327 (wood fuel)
Saksena et al. (2003)
40 urban homes
Wood
Traditional PM5 Kitchen (breathing zone)
Meal duration
Gravimetric
1200
Bhargava et al. (2004), India
10 rural homes Summer/ winter
Wood Dung
Traditional BaP Kitchen (1.5 m) (C)
1 h HPLC 700–1700 ng/m3 980–1860 ng/m3
Long-term exposure (8–24 h)
Hessen et al. (1996), Nepal
34 rural homes Wood Traditional TSP Kitchen 24 h Gravimetric 8420
Wood Traditional TSP Kitchen 8 h Gravimetric 6400 Yadav et al. (1996), Nepal cited in GDB
39 rural homes at 2500 m
Winter
Improved TSP Kitchen 8 h Gravimetric 4600
Balakrishnan et al. (2002), India
436 rural homes from 4 districts stratified across four kitchen types
Summer Wood/wood chips/crop residues
Traditional PM4 Personal exposures
24 h
Gravimetric 172–226

H
OU
SE
HO
LD
US
E O
F S
OL
ID F
UE
LS
105
Table 1.24 (contd)
Reference, location
No. of households
Season Fuel Stove type Pollutant Locationa Sampling durationb
Method Range of levels reported (µg/m3)c
Balakrishnan et al. (2004), India
412 rural homes from 3 districts stratified across four kitchen types
Summer Wood/dung/ crop residues
Traditional PM4 Personal exposures Kitchen Living
22–24 h Gravimetric and direct read out
431–467 297–666 215–357
Dasgupta et al. (2004a,b), Bangladesh
236 rural homes
Summer Wood, dung, crop residues
Traditional PM10 Personal exposures Kitchen/living
22–24 h Gravimetric and direct read out
196–264 60–1165
BaP, benzo[a]pyrene; CO, carbon monoxide; GM, geometric mean; HPLC, high-pressure liquid chromatography; PAH, polycyclic aromatic hydrocarbons; PM2.5, particulate matter <2.5 µm; PM4, particulate matter of 4 µm; PM5, particulate matter of 5 µm; PM10, particulate matter <10 µm; TLC, thin-layer chromatography; TSP, total suspended particulate matter a Personal exposures usually refer to exposures of cooks. b C denotes sampling during cooking. Meal duration refers to the sampling duration that covers the cooking period and typically ranges from 1 to 2 h. c Most studies report arithmetic means unless otherwise specified. Distributions of levels have been found to be skewed in many studies but few report geometric means.
106 IARC MONOGRAPHS VOLUME 95
and average 24-h exposures ranged from 90±21 µg/m3 for those not involved in cooking to 231±109 µg/m3 for those who cooked; 24-h exposures were around 82±39 µg/m3 in households that used clean fuels (with similar exposures across household subgroups).
The study in Andhra Pradesh (World Bank, 2002b; Balakrishnan et al., 2004) quantified daily average concentrations of respirable particulates (median aerodynamic diameter, 4 µm) in 412 rural homes from three of its districts and recorded time–activity data from 1400 household members. Mean 24-h average concentrations ranged from 73 to 732 µg/m3 (GM, 61–470 µg/m3) in households that used gas versus solid fuel, respectively. Concentrations were significantly correlated with fuel/kitchen type and quantity of fuel. Mean 24-h average exposures ranged from 80 µg/m3 to 573 µg/m3 among users of solid fuel. Mean 24-h average exposures were the highest for women cooks (GM, 317 µg/m3) and were significantly different from those for men (GM, 170 µg/m3) and children (GM, 184 µg/m3). Among women, exposures were highest between the ages of 15 and 40 years (most likely to be involved in cooking or helping to cook), while among men, exposures were highest between the ages of 65 and 80 years (most likely to be indoors). The exposures were also characterized by dramatic temporal differences between cooking and non-cooking periods. Large peaks in concentrations during cooking accounted for most of the exposure potentials. Fuel type, type and location of the kitchen and the time spent near the kitchen while cooking were thus the most important determinants of exposure across these households in southern India among the other parameters examined that included stove type, cooking duration and smoke from neighbourhood cooking.
A few measurements of particulate size fractions have also been made in households that use biomass and coal (Aggarwal et al., 1982; Raiyani et al., 1993a). In these studies, which were carried out in households of peri-urban Gujarat (in western India) and measured TSPs (using a cascade impactor) during cooking, the proportion of particles less than 9 µm in aerodynamic diameter was estimated to be 96% (dung), 86% (wood) and 92% (coal). Dung use also gave the highest proportion of particles less than 2 µm in aerodynamic diameter (80%), followed by coal (70%) and wood (47%).
Finally, a few studies have measured emissions, area concentrations and size distributions of volatile and semi-volatile particle-bound PAHs released during solid fuel combustion. Personal exposure concentrations of benzo[a]pyrene measured over 15–30-min average sampling periods (in 15 urban households in western India) during wood and dung-cake combustion ranged from 1.30 to 9.30 µg/m3 (Aggarwal et al., 1982). In another study in northern India (Bhargava et al., 2004), personal exposure and area measurements for PAHs were made during the cooking period in 20 households over two seasons. Concentrations of total PAHs in the respirable particulate fraction ranged from 4.5 to 33.5 µg/m3. Personal exposure concentrations for cooks who used biofuels were significantly higher than corresponding area concentrations. Personal exposure concentrations during cooking were nearly an order of magnitude higher than those during other periods. Both concentrations were also higher in winter than in summer.
HOUSEHOLD USE OF SOLID FUELS 107
Area concentrations of 16 particulate PAHs measured over a cooking period of 45–60 min (five for each category of fuel; in households from a peri-urban cluster in western India) were 2.01, 3.46 and 3.56 µg/m3, respectively, from wood, wood/dung-cake and dung-cake combustion (Raiyani et al., 1993b). Particulate PAH size distributions measured in these same indoor environments showed that houses that used cattle dung, wood and coal had 96%, 80% and 76% of the PAH mass, respectively, contained in particulates of ~ <2 µm aerodynamic diameter (Raiyani et al., 1993a). There was a predominance of benzo[a]pyrene (20%) and dibenz[a,h]anthracene (25%) and of chrysene (10%) and benzo[a]pyrene (13%), respectively, in particles from wood and dung-cake combustion. Laboratory emission studies for PAHs (Venkataraman et al., 2002) that used wood, dung cakes and biofuel briquettes in traditional and improved stoves have shown that dung-cake and briquette fuels are significantly more polluting than wood in terms of total emissions. The PAH profiles showed a predominance of fluoranthene, pyrene and benz[a]anthracene from all biofuels. The PAH size distributions from all stove–fuel systems were unimodal with mass median aerodynamic diameters in the 0.40–1.01 µm range for both semivolatile and nonvolatile PAHs.
(iv) Measurement studies in Nepal
While most studies within the region have been conducted in India and give a reasonably representative picture of pollution levels experienced in the area, a few studies conducted in Nepal illustrate the exposure situation in cold, hilly regions where solid fuels are used for cooking as well as heating. Ecological and climatic conditions play a central role in fuel choices and quantities, with associated implications for exposure. Earlier studies conducted in the 1980s (Davidson et al., 1986) reported stove use for cooking and heating in Nepali households to average 11.6 h per day, with additional use of a fireplace or nearly all-day operation of stoves for heating in many instances (in comparison, the average duration of stove use in the region without heating needs is estimated at 2.9 h per day). Correspondingly, fuel quantities used and time spent for fuel collection were higher (8.2 kg per day at high elevations and 2.8 kg per day in the lower elevations for 7.7 h per day, compared with an average of 1.9 kg per day for 0.5 h per day in Indian households at lower elevations during the same period). Levels of TSPs were in the range of 3–42 mg/m3, with respirable suspended particles in the range 1–14 mg/m3 in the houses sampled. Concentrations of potassium and methyl chloride (indicators for biomass sources) in outdoor air indicated significant contributions from indoor sources to outdoor air pollution in the area as well.
More recently, results from measurements of TSP matter, PM2.5 and carbon monoxide have been reported (Reid et al., 1986; Pandey et al., 1990) in homes that used solid fuels in traditional and improved stoves. Use of improved stoves resulted in a two- to threefold reduction in cooking period concentrations of total TSP matter, PM2.5 and carbon monoxide. Values for TSP matter in traditional stoves ranged from 1750 to 3170 µg/m3 compared with 870 to 1370 µg/m3 for improved stoves; mean values for PM2.5 were 8200 µg/m3 compared with 3000 µg/m3 for improved stoves; and mean values for carbon
108 IARC MONOGRAPHS VOLUME 95
monoxide ranged from 64 to 310 µg/m3 compared with 41 to 80 µg/m3 for improved stoves. This finding is similar to that reported in other regions with improved stoves (e.g. in Guatemala, Kenya), where, despite being substantially lowered, the concentrations remain considerably higher than levels in households that used gaseous fuels as well as common health-based guideline values.
(v) Measurements in Bangladesh
Until recently, few measurement results had been reported from Bangladesh. A recent study conducted by the World Bank (Dasgupta et al., 2004a,b) now provides a substantial amount of information on the levels and distribution of pollutants across a very large number of exposure configurations. Using methods similar in nature to recent large-scale assessments in southern India, a stratified sample of 236 households was monitored using direct read-out and traditional gravimetric methods for particulates for periods of 22–24 h. Households were stratified on the basis of fuel, kitchen location and housing materials. Across households, 24-h average PM10 concentrations varied from 84 to 1165 µg/m3 for firewood, 60 to 755 µg/m3 for dung and 72 to 727 µg/m3 for jute. Many houses reported fairly low levels during parts of the night and afternoon, when indoor readings resembled ambient readings. However, differences in cooking practices, structural arrangements and ventilation made a significant impact on overall concentrations. While most houses that used biomass reported high PM10 levels, a few were similar to households that used cleaner fuels such as LPG or natural gas, which suggests that ventilation is an important factor in reducing pollution levels. Improved stove use was found to be minimal which is similar to the situation found in the Indian studies. Exposure reconstructions using time–activity records in conjunction with area measurements confirmed observations from other studies of the region. Women in all age groups and children under the age of 5 years of both sexes in homes that used biomass faced the highest exposures compared with men in the working age group (24-h exposure concentrations of PM10 for women ranged from 209 to 264 µg/m3 and for children from 156 to 209 µg/m3 compared with 118 µg/m3 for men in the age group of 20–60 years). Time spent outdoors was a major contributor to reduced exposures, as reflected by much lower exposures for adult men who spend a considerable fraction of the day outdoors. The study developed regression models that used the measurement results in conjunction with survey information on household level determinants and socioeconomic variables to create a basis for extrapolation to six regions within the country. Significant geographical differences were found, based: directly—on differential distribution of determinants including fuel choice, household ventilation and materials used for construction; and indirectly—on income, education and demographic variables through their effects on choice of fuel and prevalent household conditions.
(b) Conclusions and recommendations for further research
Exposure to indoor air pollutants associated with the combustion of solid fuels for cooking and heating is extensive in South Asia. Multiple determinants affect individual

HOUSEHOLD USE OF SOLID FUELS 109
exposures but it is clear that all users of solid fuel experience very high air pollution leading to exposure to a mixture of pollutants for extended periods during their lifetime.
Exposures are widespread and prevalent in half to three-quarters of the population in most countries of the region. Although evidence of extreme exposures has been available in the published literature for the last three decades, only recently have countries in the region undertaken efforts to collect information systematically on the extent of solid fuel use and estimated exposures. Despite limitations of being outside regulatory purviews and hence not being within a framework for consistent and routine data collection, the region has a robust series of research studies to document evidence of exposures. While quantitative assessments have been performed in many countries, a great majority focused on a few pollutants (such as PM and carbon monoxide) and showed limited evidence of their correlation to other toxic emissions; it would therefore be important for future research studies to undertake measurements of multiple pollutants. Additional measurements of carcinogenic compounds in biomass smoke are especially needed as very little is currently available in the region. Models that validate the choice of indicator pollutants and monitoring schemes that adequately describe the temporal and spatial variations are also urgently needed. Since most countries in the region have not yet developed specific standards, such models would facilitate guidance on what, when, where and how to monitor issues that duly take into account the technical and financial feasibilities of individual countries.
Women and children probably bear the largest burden of health risks from these exposures. Poverty, income and education are likely to aggravate further exposure potentials for vulnerable groups. Within the context of the Millennium Development Goals, it would be pertinent and almost necessary to identify and include indoor air pollution issues as an integral part of addressing the health problems of women and children in all countries. Indeed, if the region is to progress towards achieving even moderate human development indices within the next decades, indoor air pollution will probably be an important category of environmental risk factors in need of solutions.
1.3.4 Latin America
(a) Use of fuels
In Latin America, biomass fuels are mostly used in rural areas. Nearly 25% of the population of Latin America lives in rural areas where biomass fuels are most frequently used for cooking and heating. This rural population represents nearly 127 million people who are potentially exposed to biomass-related air pollution (Cordeu & Cerda, 2000). The percentage of the rural population varies from country to country and can be as high as 60%, for example in Guatemala. In Mexico, nearly 25 million people use biomass, particularly wood, as a primary source of energy for daily cooking. This number will probably remain similar or increase in the near future, since most rural families do not have the possibility of using a fuel that would be higher in the ‘energy ladder’ such as gas or electricity. A study conducted in Central America that included Guatemala, Honduras

110 IARC MONOGRAPHS VOLUME 95
and El Salvador concluded that 95% of the rural households used wood burning as a source of energy for cooking (Organización Latinoamerica de Energía, 2000). Using data from local estimates, surveys and some demographic and development indicators, Smith et al. (2004) built a model to predict the national use of solid fuels. For Latin America, those estimates were 24.6% (18.8–30.8%) for Mexico and Brazil and 52.9% (42.6–63.2%) for Ecuador.
In general, there is an inverse correlation between the size of the locality and the use of biomass; the smaller and most disperse communities are those that use biomass fuel most extensively (Riojas, 2003). In rural communities in Mexico, it has been estimated that the mean quantity of wood used per person per day is approximately 3 kg. For a typical family, consumption per year is equivalent to 4 tonnes of wood (Riojas, 2003).
(b) Exposure data
Several factors affect the concentration of pollutants within the household during the burning of open fires, in particular the volume and ventilation of the room, and the intensity of the fire. Climatic conditions are major determinants of exposure and are particularly important in some Latin American countries (e.g. Bolivia, Ecuador or Peru) where a large proportion of the rural population lives at high altitude. In addition, the type of cooking will also have an impact on exposure. Data from Mexico show that women can spend nearly 6–7 h per day close to biomass open-fire cooking (Brauer et al., 1996).
Most of the studies that measured pollutant concentrations were conducted in rural settings and attempted to characterize the distribution of levels in the kitchen. Cooking times for meals varied from study to study and ranged from 30 min to 3 h. However, time spent close to a burning fire can reach up to 12 h. The highest exposure occurs among women and their young children; however, other members of the households are also exposed because, in many cases, the kitchen is not a separate room or meals are eaten near the stove (Naeher et al., 2005).
(i) Qualitative data
In a study conducted in Guatemala, PM10 levels close to 1000 µg/m3 or higher were observed in homes that used open fires and those of carbon monoxide were about 5–10 ppm and reached 25–50 ppm during use of the fire (Boy et al., 2002).
(ii) Quantitative studies
Table 1.25 presents results from studies conducted in Latin America, mostly in Guatemala and Mexico, on pollutant concentrations in households that use biomass fuel.
Studies in Guatemala
Several studies have compared different types of indoor cookstove conditions to determine the potential impact of intervention. Naeher et al. (2000a,b) determined particulate and carbon monoxide concentrations in highland Guatemala and compared different cookstove conditions: background (no stove use), traditional open stove, improved stove (plancha) and bottled gas (LPG) stove. Measurements were taken for
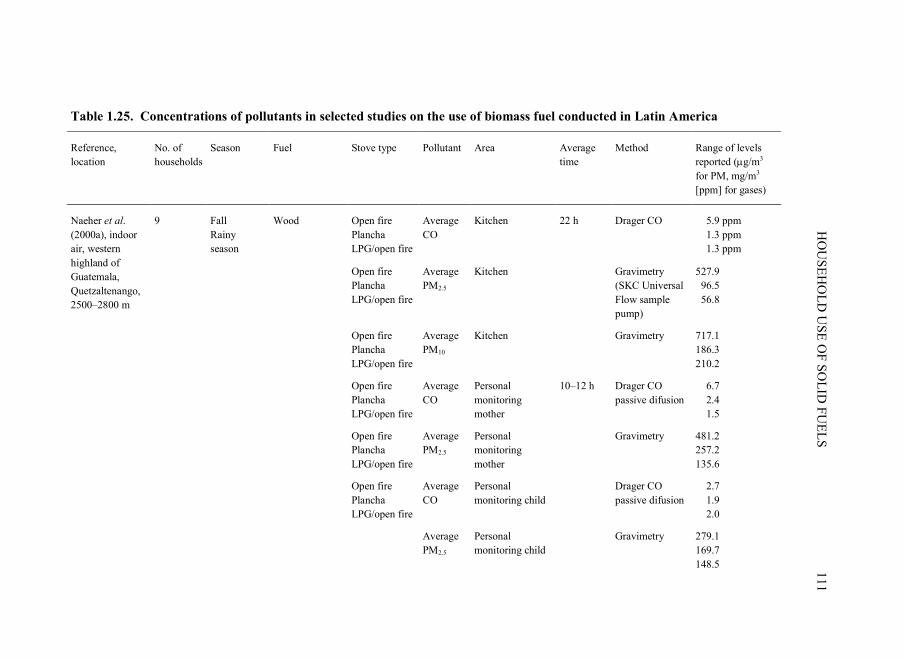
H
OU
SE
HO
LD
US
E O
F S
OL
ID F
UE
LS
111
Table 1.25. Concentrations of pollutants in selected studies on the use of biomass fuel conducted in Latin America
Reference, location
No. of households
Season Fuel Stove type Pollutant Area Average time
Method Range of levels reported (µg/m3 for PM, mg/m3 [ppm] for gases)
Open fire Plancha LPG/open fire
Average CO
Kitchen
22 h Drager CO 5.9 ppm 1.3 ppm 1.3 ppm
Open fire Plancha LPG/open fire
Average PM2.5
Kitchen Gravimetry (SKC Universal Flow sample pump)
527.9 96.5 56.8
Open fire Plancha LPG/open fire
Average PM10
Kitchen Gravimetry 717.1 186.3 210.2
Open fire Plancha LPG/open fire
Average CO
Personal monitoring mother
10–12 h Drager CO passive difusion
6.7 2.4 1.5
Open fire Plancha LPG/open fire
Average PM2.5
Personal monitoring mother
Gravimetry 481.2 257.2 135.6
Naeher et al. (2000a), indoor air, western highland of Guatemala, Quetzaltenango, 2500–2800 m
9 Fall Rainy season
Wood
Open fire Plancha LPG/open fire
Average CO
Personal monitoring child
Drager CO passive difusion
2.7 1.9 2.0
Average PM2.5
Personal monitoring child
Gravimetry 279.1 169.7 148.5

112 IA
RC
MO
NO
GR
AP
HS
VO
LU
ME
95
Table 1.25 (contd)
Reference, location
No. of households
Season Fuel Stove type Pollutant Area Average time
Method Range of levels reported (µg/m3 for PM, mg/m3 [ppm] for gases)
Albalak et al. (2001), western highland of Guatemala, La Victoria rural community in San Juan Ostuncalco, 2000–2300 m
30 Dry season Part of rainy season
Wood Open fire Plancha LPG/open fire
PM3.5 Kitchen
24 h average (women spent 5 h/day )
SKC Aircheck samplers Gravimetry
1560 (GM) 280 (GM) 850 (GM)
Wood Open fire Plancha
CO Kitchen
24 h Stain tube 4.0–22.7 0.0–7.1
Naeher et al. (2001), western highland of Guatemala, Quetzaltenango, 2500–2800 ma
15 open fire 25 improved stove
Summer (rainy season)
Open fire Plancha
PM2.5 Kitchen 24-h Gravimetric 324–2198 33–409
Bruce et al. (2004), Guatemala, western highland, La Victoria
29 Dry winter season
50% open fire 30% chimney stoves (plancha) 20% combination gas/open fires Wood, agricultural residues
Open fire Plancha Open fire (11) Plancha (5) Gas/other (8)
CO PM3.5
Kitchen 24-h Gas diffusion tubes Gravimetry
12.4 (10.2–14.5) 3.09 (1.87–4.30) 1019 (SD, 547) 351 (SD, 333) 579 (SD, 205)

H
OU
SE
HO
LD
US
E O
F S
OL
ID F
UE
LS
113
Table 1.25 (contd)
Reference, location
No. of households
Season Fuel Stove type Pollutant Area Average time
Method Range of levels reported (µg/m3 for PM, mg/m3 [ppm] for gases)
Brauer et al. (1996), Mexico, San Jose Solis, 2450 m
22 homes April–May Dry season
Biomass (corn stalks and husks) Wood and LPG
Open fire LPG
Average PM2.5
PM10
Kitchen Biomass Biomass+LPG LPG Biomass Biomass+LPG LPG
9 h Gravimetry 554.7 (SD,492.9) 203.6 (SD, 180.6) 69.4 (SD, 54.2) 767.9 (SD, 540.5) 311.2 (SD, 247.8) 225.5 (SD, 260.8)
Riojas-Rodriguez et al. (2001), Mexico
38 Dry season Wood Ceta stove and open fire
Average PM10
Kitchen Cooking area Stove Open fire Children area Stove Open fire
16 h Gravimetry 230 265 233 202
Rainy season
Cooking area Stove Open fire Children area Stove Open fire
206 287 158 305
Regalado et al. (2006), Mexico
n=778 samples
Biomass cooking fuel
Wood stove 12% with chimney
PM10 PM2.5
Kitchen while cooking
1 h during cooking
Nephelometer 690 average 1390 peak 490 average 1040 peak
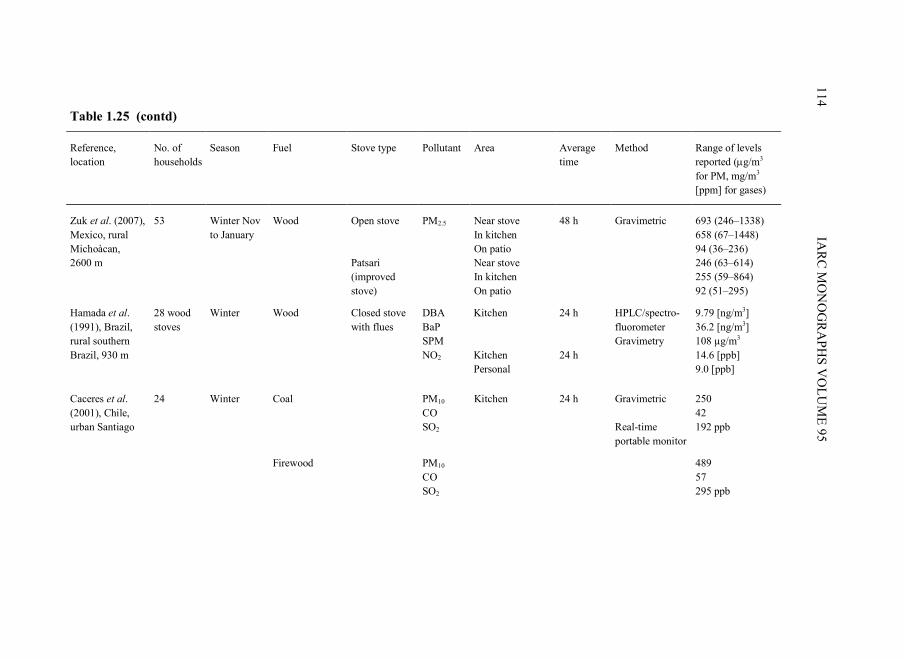
114 IA
RC
MO
NO
GR
AP
HS
VO
LU
ME
95
Table 1.25 (contd)
Reference, location
No. of households
Season Fuel Stove type Pollutant Area Average time
Method Range of levels reported (µg/m3 for PM, mg/m3 [ppm] for gases)
Zuk et al. (2007), Mexico, rural Michoàcan, 2600 m
53 Winter Nov to January
Wood Open stove Patsari (improved stove)
PM2.5
Near stove In kitchen On patio Near stove In kitchen On patio
48 h Gravimetric 693 (246–1338) 658 (67–1448) 94 (36–236) 246 (63–614) 255 (59–864) 92 (51–295)
Hamada et al. (1991), Brazil, rural southern Brazil, 930 m
28 wood stoves
Winter Wood Closed stove with flues
DBA BaP SPM NO2
Kitchen Kitchen Personal
24 h 24 h
HPLC/spectro-fluorometer Gravimetry
9.79 [ng/m3] 36.2 [ng/m3] 108 µg/m3 14.6 [ppb] 9.0 [ppb]
Coal PM10
CO
SO2
Kitchen 24 h Gravimetric Real-time portable monitor
250 42 192 ppb
Caceres et al. (2001), Chile, urban Santiago
24 Winter
Firewood
PM10
CO
SO2
489 57 295 ppb
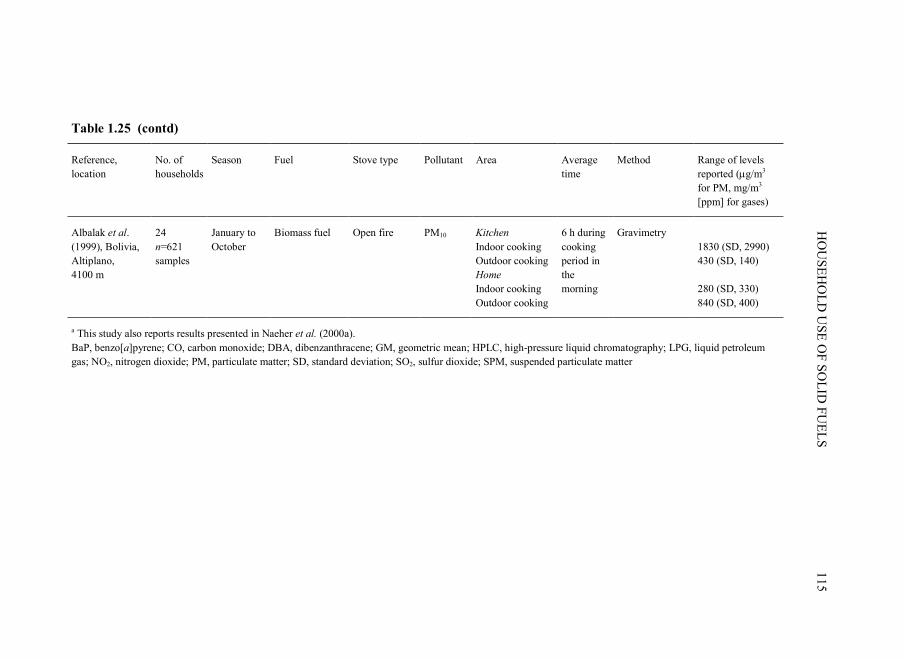
H
OU
SE
HO
LD
US
E O
F S
OL
ID F
UE
LS
115
Table 1.25 (contd)
Reference, location
No. of households
Season Fuel Stove type Pollutant Area Average time
Method Range of levels reported (µg/m3 for PM, mg/m3 [ppm] for gases)
Albalak et al. (1999), Bolivia, Altiplano, 4100 m
24 n=621 samples
January to October
Biomass fuel Open fire PM10 Kitchen Indoor cooking Outdoor cooking Home Indoor cooking Outdoor cooking
6 h during cooking period in the morning
Gravimetry 1830 (SD, 2990) 430 (SD, 140) 280 (SD, 330) 840 (SD, 400)
a This study also reports results presented in Naeher et al. (2000a). BaP, benzo[a]pyrene; CO, carbon monoxide; DBA, dibenzanthracene; GM, geometric mean; HPLC, high-pressure liquid chromatography; LPG, liquid petroleum gas; NO2, nitrogen dioxide; PM, particulate matter; SD, standard deviation; SO2, sulfur dioxide; SPM, suspended particulate matter

116 IARC MONOGRAPHS VOLUME 95
22 hour during the rainy season in nine houses. Background kitchen PM2.5 levels were 56 µg/m3; levels were 528 µg/m3 for open fires, 97 µg/m3 for planchas and 57 µg/m3 for gas stoves. Similar trends were observed for personal exposures of mothers and children. However, the authors mentioned that improved stoves (planchas) deteriorate over time and that maintenance is important to control indoor pollutant levels. In a similar study, the same authors collected samples from 15 homes that used open fires and 25 homes that had improved stoves and reported concentrations similar to those of the first study (Naeher et al., 2001). In another study conducted in the western highlands of Guatemala, 24-h PM3.5 concentrations were monitored over 8 months for three fuel/cookstove combinations (10 in each category): a traditional open-fire cookstove, an improved cookstove called ‘plancha mejorada’ and LPG stove/open-fire combination for which mean levels were reported to be 1560 µg/m3, 280 µg/m3 and 850 µg/m3, respectively (Albalak et al., 2001). Similar orders of magnitude of PM3.5 levels were observed in the study of Bruce et al. (2004).
Studies in Mexico
A follow-up study in two rural communities of the state of Chiapas, Mexico, compared families who used an improved stove for cooking with those who used traditional open fires. Measurements (16-h) of PM10 showed that the concentration of particles was significantly lower in the kitchen area (158 µg/m3 versus 233 µg/m3) during the rainy season compared with the dry season (Riojas-Rodríguez et al., 2001). Two studies conducted in Mexico evaluated the impact of the use of biomass on the respiratory health of women. In a case–control study, 127 cases with chronic bronchitis or chronic airway obstruction and 280 controls were recruited at the National Institute of Respiratory Disease in Mexico (Pérez-Padilla et al., 1996). Cases reported a mean of 3 h of cooking with a wood stove per day and a range from none to 12 h. The mean duration of cooking with a wood stove was 28 years and ranged from none to 71 years. It was calculated that the h•year value of exposure (years of exposure multiplied by the average number of hours of exposure per day) was 80 (mean) and values ranged from 0 to 552 h•years. No objective measurement of particle levels was carried out; however, measurements taken in rural Mexico showed average levels of PM2.5 of 555 µg/m3 (range, 30–1492 µg/m3) when biomass was burned in open fires (Brauer et al., 1996). Using an integrated nephelometer during 1 h of cooking time, levels of exposure to PM2.5 measured in homes with stoves with (and without) a chimney averaged 490 (SD, 610) µg/m3 with a peak of 1040 (SD, 1010) µg/m3 (Regalado et al., 2006).
As part of a large health intervention study, Zuk et al. (2007) evaluated the impact of improved wood burning stoves on indoor air pollution in 52 homes in the rural town of Michoacan, Mexico, and monitored levels before and after the improved wood-burning stoves were received. Mean PM2.5 concentrations (48-h) in homes that burned wood in open fires were 693 µg/m3 near the stove and 658 µg/m3 in the kitchen away from the stove. Paired measurements taken before and after installation of the patsari (improved

HOUSEHOLD USE OF SOLID FUELS 117
stove) indicated a median 71% reduction in PM2.5 concentrations near the stove and a 58% reduction in the kitchen concentration.
Studies in other Latin American countries
In a study conducted in a rural community of southern Brazil during the winter, concentrations of PAHs and suspended particulate matter were assessed in homes that used wood and gas stoves. Higher levels of PAHs and suspended particulate matter were observed in homes that used wood stoves (Hamada et al., 1991).
Indoor air pollution was also measured in 24 houses in an area of low socioeconomic status in Santiago, Chile. The highest concentrations of PM10, carbon monoxide and sulfur dioxide were measured during the time of heating with higher levels observed for firewood burning than coal. Coal, firewood and cigarette smoke were all sources of carcinogenic PAHs (Cáceres et al., 2001).
In a study conducted in a rural village of the Bolivian altiplano located at 4100 m above sea level, PM10 levels were measured in a total of 621 samples. In homes in which cooking was carried out indoors, the mean PM10 concentration in kitchens was 1830 µg/m3 and ranged from 580 to 15 040 µg/m3 over a 6-h cooking period. Daily exposure for women involved in indoor cooking was 11 280 µg•h/m3 during the working season (harvesting and planting season) and 15 120 µg•h/m3 during the non-work season (Albalak et al., 1999).
(iii) Intervention studies
Several intervention studies have shown the impact of improved stoves or installation of hoods or chimneys on exposure levels. Studies conducted in Guatemala showed that, compared with open fires alone, the LPG/open fire combination showed a 45% reduction in PM3.5 (p<0.07) while the plancha mejorada showed a 85% reduction in PM3.5 concentration compared with open fires (p<0.0001). Season did not affect pollutant concentration and the reduction of PM3.5 was maintained throughout the 8 months of the study (Albalak et al., 2001). Bruce et al. (2004) reported an almost 65% reduction in indoor PM3.5 levels with improved stoves. Similarly, a study conducted in Mexico showed that improved stoves could provide a median 71% reduction in PM2.5 concentration near the stove and a 58% reduction in the kitchen (Zuk et al., 2007).
1.3.5 Africa (Table 1.26)
(a) Indoor air and personal exposure data
The percentage of households that use solid fuel in African has been estimated to be approximately 73% (68–78%) in Saharan Africa and 86% (81–89%) in sub-Saharan Africa (Smith et al., 2004). Studies from Africa have mainly been carried out in Kenya, The Gambia and South Africa. Daily measurements of PM10 usually exceeded 1500 µg/m3 (Saksena & Smith, 2003). Recent data from Zimbabwe showed that women spend on average 5 h per day in the kitchen area and that the levels of PM10 were in the

118 IA
RC
MO
NO
GR
AP
HS
VO
LU
ME
95
Table 1.26. Concentrations of pollutants in selected studies on the use of biomass fuel conducted in Africa
Reference, location
No. of households
Season Fuel Stove type Pollutant Area Average time
Method Range of levels reported (µg/m3 for PM, mg/m3 [ppm] for gases)
Cleary & Blackburn (1968), New Guinea
9 Not reported
Wood Not reported Smoke density, aldehydes, CO CO
Native huts, new Guinea highlands
Different times for each hut described
Brass filter holder, hand pumps
666 (average) 1.08 ppm (average) 3.8 ppm (peak) 21.3 ppm (average) 150 ppm (peak)
WHO/UNEP (1988), The Gambia
Dry and rainy seasons
Wood 24-h SPM 14 h 2000 (GM) dry 2100 (GM) rainy
Boleij et al. (1989), Kenya
36 randomly selected from 250 in area
Rainy season (April, May)
Mostly wood sometimes biomass fuels (agricultural waste)
Traditional 3-stone open fire within house (58%), or in separate kitchen (42%)
Respirable particles NO2
Rural area of Maragua, Kenya; kitchens
7 h/day (fire burning) Measure-ments 24 h average
Pump (Dupont P2500) and PAS-6 filter holder with glass fibre filters
1400 (mean) 180 (mean)
Collings et al. (1990), Zimbabwe
40 Spring Wood, paraffin, gas, electricity
Mostly open fires in thatched huts.
PM Kitchen 2 h Casella 3131 TT personal sampler with Whatman 42 filter paper. EEL Densitometer No. 19
546 and 1998
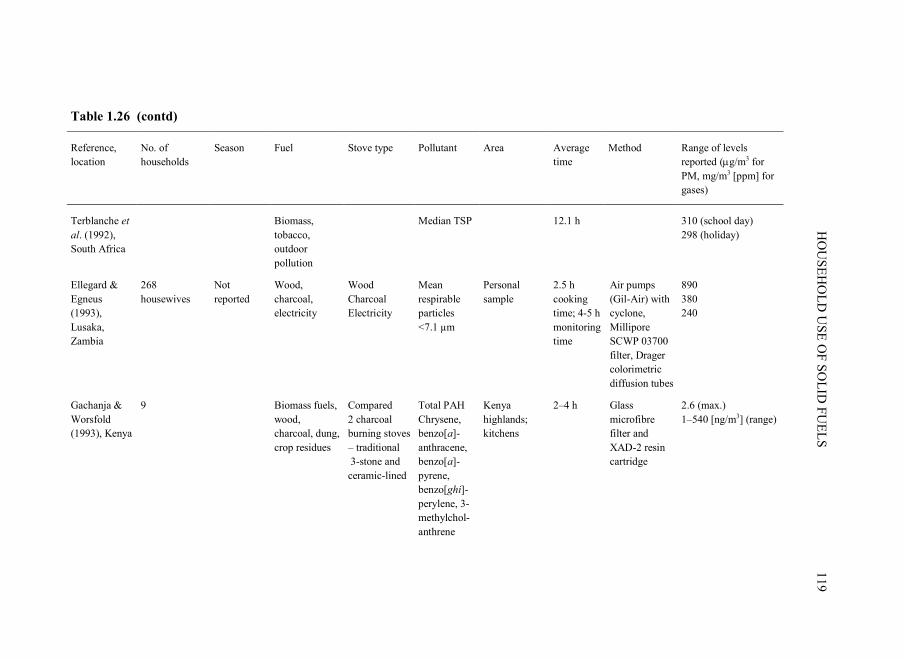
H
OU
SE
HO
LD
US
E O
F S
OL
ID F
UE
LS
119
Table 1.26 (contd)
Reference, location
No. of households
Season Fuel Stove type Pollutant Area Average time
Method Range of levels reported (µg/m3 for PM, mg/m3 [ppm] for gases)
Terblanche et
al. (1992), South Africa
Biomass, tobacco, outdoor pollution
Median TSP 12.1 h 310 (school day) 298 (holiday)
Ellegard & Egneus (1993), Lusaka, Zambia
268 housewives
Not reported
Wood, charcoal, electricity
Wood Charcoal Electricity
Mean respirable particles <7.1 µm
Personal sample
2.5 h cooking time; 4-5 h monitoring time
Air pumps (Gil-Air) with cyclone, Millipore SCWP 03700 filter, Drager colorimetric diffusion tubes
890 380 240
Gachanja & Worsfold (1993), Kenya
9 Biomass fuels, wood, charcoal, dung, crop residues
Compared 2 charcoal burning stoves – traditional 3-stone and ceramic-lined
Total PAH Chrysene, benzo[a]-anthracene, benzo[a]-pyrene, benzo[ghi]-perylene, 3-methylchol-anthrene
Kenya highlands; kitchens
2–4 h Glass microfibre filter and XAD-2 resin cartridge
2.6 (max.) 1–540 [ng/m3] (range)

120 IA
RC
MO
NO
GR
AP
HS
VO
LU
ME
95
Table 1.26 (contd)
Reference, location
No. of households
Season Fuel Stove type Pollutant Area Average time
Method Range of levels reported (µg/m3 for PM, mg/m3 [ppm] for gases)
Ellegard (1994), Zambia
Not reported March Wood, charcoal, electricity
Wood Charcoal Electricity Charcoal producer
Mean TSP (respirable suspended particulates)
Kamaila, Chisamba, Zambia
4.7 h 4.8 h 4.5 h 2.3 h
Air pumps (Gil-Air SC) fitted with filter & cyclone
890 380 240 1400
Campbell (1997), The Gambia
18 (6 in each of 3 villages)
Over 12 months, dry and wet season
Biomass fuels (wood, dung, crop residues)
Not reported TSP Benzo[ghi]-perylene Pyrene Benzo[a]-anthracene (particulates, NO2, PAH)
2 Mandika villages, 1 Fula hamlet; kitchens
24 h Boleij et al. (1988a,b)
2000 (mean) 246 [µg/g] (AM) 160 [µg/g] (AM) 147 [µg/g] (AM)
Ellegard (1997), Maputo
1000 Not reported
Mainly wood and charcoal; less common: electricity, LPG, kerosene, coal
Wood Charcoal Electricity LPG Kerosene Coal
Mean respirable particulates
10 suburban bairros around Maputo; cooking place varied.
2.84 h per day; monitoring period equal to actual cooking time (av 1.5h)
Air pumps (Gil-Air SC) with cyclone. Diffusion tube (Drager 6733191)
1200 540 380 200 760 940

H
OU
SE
HO
LD
US
E O
F S
OL
ID F
UE
LS
121
Table 1.26 (contd)
Reference, location
No. of households
Season Fuel Stove type Pollutant Area Average time
Method Range of levels reported (µg/m3 for PM, mg/m3 [ppm] for gases)
Bailie et al. (1999)
75 Winter Paraffin and electricity most common; gas and wood less common
Not reported TSP Poor urban environment
Includes peak fuel use periods
Electrochemical Exotox Model 75 continous monitors, Gil-Air model 224-XR pumps
7.15–432 continuous daily monitoring
Ezzati et al. (2000), Kenya
55 – Wood, dung, charcoal
Wood Charcoal
Average daily PM10
14 h/day, >200 days
Personal data RAM nephelometer
2795–4898
Sanyal & Madunaa (2000), South Africa
115 3 times: June-Sept, Oct-Dec, Mar-May
Wood, dung, coal
Very low income Low income Middle income
CO Residential area of Victoria East; cooking and living areas
6 h (morning and afternoon)
EXOTOX Model 75 continuous gas monitors
180 118 67
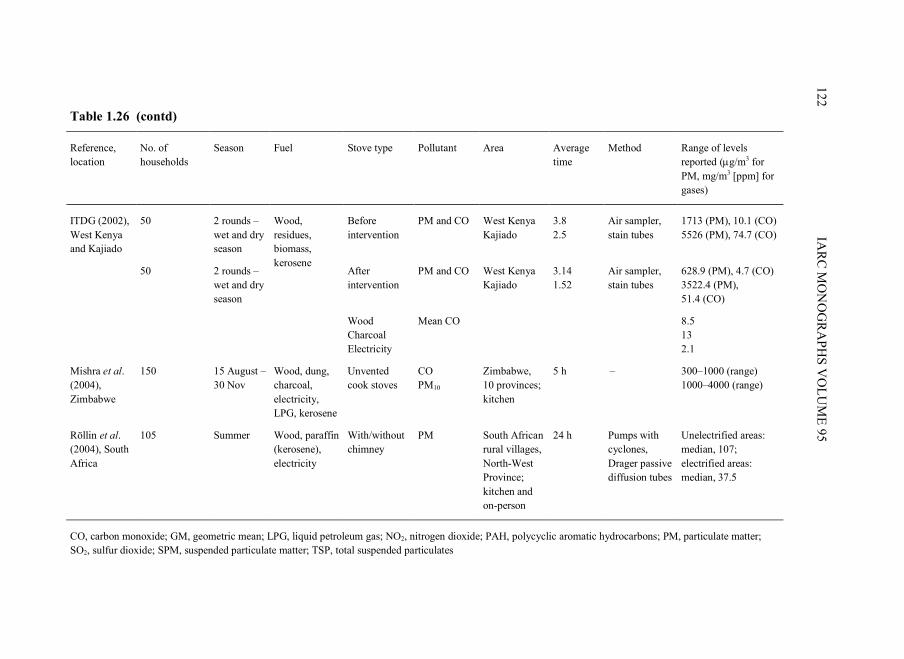
122 IA
RC
MO
NO
GR
AP
HS
VO
LU
ME
95
Table 1.26 (contd)
Reference, location
No. of households
Season Fuel Stove type Pollutant Area Average time
Method Range of levels reported (µg/m3 for PM, mg/m3 [ppm] for gases)
50 2 rounds – wet and dry season
Before intervention
PM and CO West Kenya Kajiado
3.8 2.5
Air sampler, stain tubes
1713 (PM), 10.1 (CO) 5526 (PM), 74.7 (CO)
ITDG (2002), West Kenya and Kajiado
50 2 rounds – wet and dry season
Wood, residues, biomass, kerosene
After intervention
PM and CO West Kenya Kajiado
3.14 1.52
Air sampler, stain tubes
628.9 (PM), 4.7 (CO) 3522.4 (PM), 51.4 (CO)
Wood Charcoal Electricity
Mean CO 8.5 13 2.1
Mishra et al. (2004), Zimbabwe
150 15 August – 30 Nov
Wood, dung, charcoal, electricity, LPG, kerosene
Unvented cook stoves
CO PM10
Zimbabwe, 10 provinces; kitchen
5 h – 300–1000 (range) 1000–4000 (range)
Röllin et al. (2004), South Africa
105 Summer Wood, paraffin (kerosene), electricity
With/without chimney
PM South African rural villages, North-West Province; kitchen and on-person
24 h Pumps with cyclones, Drager passive diffusion tubes
Unelectrified areas: median, 107; electrified areas: median, 37.5
CO, carbon monoxide; GM, geometric mean; LPG, liquid petroleum gas; NO2, nitrogen dioxide; PAH, polycyclic aromatic hydrocarbons; PM, particulate matter; SO2, sulfur dioxide; SPM, suspended particulate matter; TSP, total suspended particulates
HOUSEHOLD USE OF SOLID FUELS 123
range of 1000–4000 µg/m3 and those of carbon monoxide were in the range of 300–1000 ppm (Mishra et al., 2004).
A study conducted in The Gambia, where combustion of biofuels is predominantly related to cooking fires, reported a mean level of suspended particulate matter (24-h average) of 2000 µg/m3 with a range of 675–3444 µg/m3. High concentrations of PAHs were also seen, with a mean level of benzo[a]pyrene of 102 ng/m3 that ranged from 69 to 351 ng/m3 and a mean level of dibenzo[a,h]anthracene of 149 ng/m3 that ranged from 101 to 513 ng/m3 (Campbell, 1997). Data from Kenya also reported high particulate levels during home cooking on three traditional stone open fires (using mostly wood). Fires were burning for almost 7 h per day. Average levels of suspended particulate (24-h) were approximately 1400 µg/m3 (SD, 1000). PAHs were also measured; average levels of benzo[a]pyrene on filters were 60 µg/m3 (SD, 50) and those of dibenz[a,h]anthracene were 100 µg/m3 (SD, 90) (Boleij et al., 1989).
Indoor concentrations of 12 PAHs were measured in Burundi in 16 rural houses that used traditional wood stoves. In addition, 32 residents of these homes provided data on urinary excretion of 1-hydroxypyrene. Mean airborne concentrations of four volatile PAHs (naphthalene, fluorene, phenanthrene and acenaphthene) exceeded 1 µg/m3 and that of benzo[a]pyrene was 0.07 µg/m3. Naphthalene was the main PAH contaminant. Mean urinary 1-hydroxypyrene excretion of residents of traditional houses was 1.50 µmol/mol creatinine (range, 0.26–15.62 µmol/mol), a value that was 30 times higher than that of people who lived in the capital city of Burundi (Viau et al., 2000).
In a study conducted in Kenya, personal exposure from biomass burning in a rural population was determined using data on type of activity, emission concentrations, time spent in different microenvironments and proximity to the fire during the burning period. Because exposure to biomass burning varies from day to day (depending on the moisture content or density of the fuel, the type of food cooked, the choice of stove and fuel) and from season to season (different activity pattern, ventilation of the home), a detailed exposure measurement was made over several days (200 days) and seasons. Exposure was higher for women than men, but was similar in children of either sex under 5 years of age. The highest exposure was observed in women aged 15–49 years and reached 4.9 mg/m3 per day (Ezzati & Kammen, 2001).
In a study conducted in Zambia, personal exposure to respirable particles (<7.1 µm) was measured in housewives exposed to different types of fuel during cooking time. Women exposed to emissions from wood burning had the highest level (890 µg/m3) compared with those who used charcoal (380 µg/m3) or electricity (240 µg/m3) (Ellegard & Egneus, 1993).
(b) Impact of intervention studies
Using data from a study conducted in Kenya, Ezzati and Kammen (2002) estimated that various energy- or behaviour-based interventions can result in a 35–95% reduction in exposure to PM10. It is clear that acceptance of the intervention is a crucial component for

124 IARC MONOGRAPHS VOLUME 95
its success and that, in each case, social, economic and environmental components need to be considered.
1.3.6 Exposure in developed countries
The previous sections have dealt with exposure from solid fuel combustion in developing countries; this section provides comparable figures on exposure from solid fuel combustion in developed countries. The two main sources of exposure to particles from biomass burning are wildfires and residential wood burning.
[Exposures due to agricultural burning also exist in developed countries but are localized in both space and time and do not affect a significant portion of the population. For example, in the early 1990s, agricultural burning in California contributed about 3.5 million tonnes per year to atmospheric particles, but that corresponded to only 1% of all emissions (Jenkins et al., 1992). As an indication of the maximum PM concentrations that might be achieved, agricultural burning in Brazil is now carried out on a huge industrial scale, but is limited to 2 weeks per year; a 1-week monitoring programme during the burning season showed PM3.5
levels of 191 µg/m3, but this would correspond to a contribution to annual average concentrations of only 8 µg/m3 (Reinhardt et al., 2001). Exposures elsewhere would in general be much smaller and therefore are not discussed further here.]
Wildfires are not dealt with here as they relate to outdoor exposure.
(a) Indoor air pollution
A study on a Navajo reservation in Arizona showed higher levels of respirable particles in homes that used wood for heating or cooking than in homes that used electricity or gas (Robin et al., 1996).
(b) Residential wood burning
All of the following studies relate to ambient (outdoor) air pollution due to wood burning for heating or to recreational use of fireplaces.
Source apportionment studies indicate that wood smoke is a major source of ambient PM during the winter months in several parts of the USA and Canada, particularly the western areas (Table 1.27). For example, 42% of the PM10 during winter months in San Jose, CA, was attributed to wood burning (Fairley, 1990). Chemical mass balance receptor-modelling of fine particles in Fresno and Bakersfield (CA) during wintertime identified both hardwood and softwood as sources of PM and organic compounds (Schauer & Cass, 2000), which were probably due to residential wood burning.
Outdoor PM levels in Seattle (WA) are also heavily influenced by residential woodstoves. Data from 3 years of sampling in Seattle were analysed for sources using positive matrix factorization (Maykut et al., 2003). The analysis found that vegetative burning contributed 34% to the total sources of PM in Seattle over 3 years.
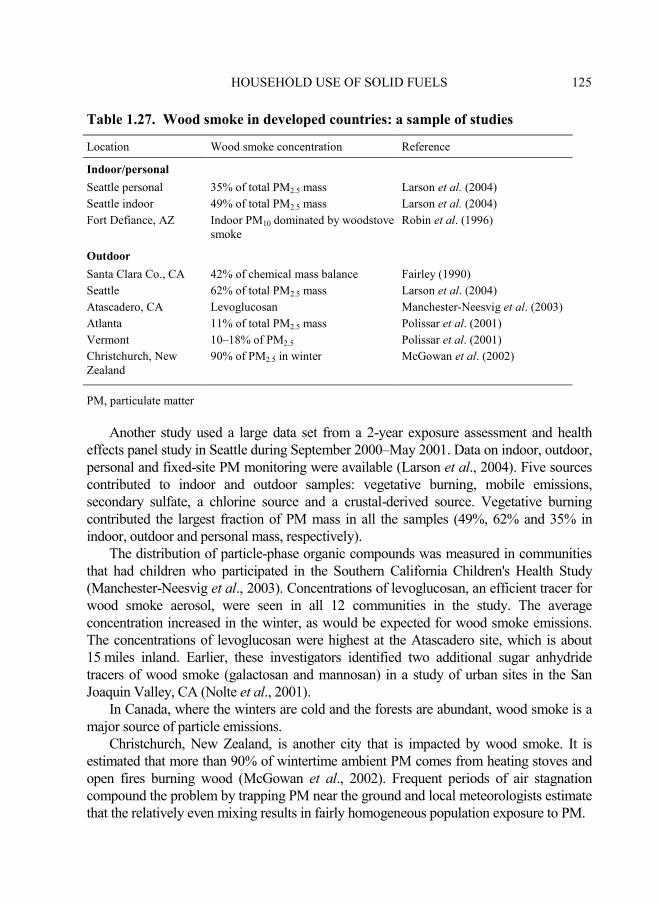
HOUSEHOLD USE OF SOLID FUELS 125
Table 1.27. Wood smoke in developed countries: a sample of studies
Location Wood smoke concentration Reference
Indoor/personal
Seattle personal 35% of total PM2.5 mass Larson et al. (2004)
Seattle indoor 49% of total PM2.5 mass Larson et al. (2004)
Fort Defiance, AZ Indoor PM10 dominated by woodstove smoke
Robin et al. (1996)
Outdoor
Santa Clara Co., CA 42% of chemical mass balance Fairley (1990)
Seattle 62% of total PM2.5 mass Larson et al. (2004)
Atascadero, CA Levoglucosan Manchester-Neesvig et al. (2003)
Atlanta 11% of total PM2.5 mass Polissar et al. (2001)
Vermont 10–18% of PM2.5 Polissar et al. (2001) Christchurch, New Zealand
90% of PM2.5 in winter McGowan et al. (2002)
PM, particulate matter
Another study used a large data set from a 2-year exposure assessment and health effects panel study in Seattle during September 2000–May 2001. Data on indoor, outdoor, personal and fixed-site PM monitoring were available (Larson et al., 2004). Five sources contributed to indoor and outdoor samples: vegetative burning, mobile emissions, secondary sulfate, a chlorine source and a crustal-derived source. Vegetative burning contributed the largest fraction of PM mass in all the samples (49%, 62% and 35% in indoor, outdoor and personal mass, respectively).
The distribution of particle-phase organic compounds was measured in communities that had children who participated in the Southern California Children's Health Study (Manchester-Neesvig et al., 2003). Concentrations of levoglucosan, an efficient tracer for wood smoke aerosol, were seen in all 12 communities in the study. The average concentration increased in the winter, as would be expected for wood smoke emissions. The concentrations of levoglucosan were highest at the Atascadero site, which is about 15 miles inland. Earlier, these investigators identified two additional sugar anhydride tracers of wood smoke (galactosan and mannosan) in a study of urban sites in the San Joaquin Valley, CA (Nolte et al., 2001).
In Canada, where the winters are cold and the forests are abundant, wood smoke is a major source of particle emissions.
Christchurch, New Zealand, is another city that is impacted by wood smoke. It is estimated that more than 90% of wintertime ambient PM comes from heating stoves and open fires burning wood (McGowan et al., 2002). Frequent periods of air stagnation compound the problem by trapping PM near the ground and local meteorologists estimate that the relatively even mixing results in fairly homogeneous population exposure to PM.

126 IARC MONOGRAPHS VOLUME 95
Emissions inventories in Launceston, Australia, indicated that household wood burning accounted for 85% of annual PM10 emissions in 2000 (Jordan & Seen, 2005).
Source apportionment studies in Denmark showed that household wood burning was responsible for 47% of national PM2.5 emissions in 2002 (Naeher et al., 2007). In addition, household wood burning increased by about 50% during the 1990s, compared with only a 7% increase for total energy use.
Earlier studies of the contribution of wood smoke to ambient PM were summarized by Larson and Koenig (1994). Eighteen studies in 40 locations in the Pacific Northwest (Alaska, Washington, Oregon, Idaho, Montana) were included. The ranges of concentrations for PM2.5
and PM10 were 12–68 µg/m3 and 7–205 µg/m3, respectively. The interquartile range for the fractional contributions of wood smoke to these concentrations was about 20–70% with a median value of 54%.
1.4 Interventions and policies to reduce exposure
(a) Encouragement of the adoption of efficient biomass stoves
One major solution that could provide a bridge between biomass energy and the switch to commercial fuels but is unfortunately overlooked is the improvement of stoves that burn biomass. This is generally less expensive for households that are dependent on biomass and these stoves are often designed with chimneys to vent smoke out of the home. It is generally accepted that improved biomass stoves reduce smoke in households that use them, but the reduction is not as significant as that for households that switch completely to LPG.
International programmes for improved stoves can provide some insights into both the successes and problems that are involved in the promotion of efficient biomass stoves (Sinton et al., 2004a,c; Barnes et al., 2007). In addition, energy efficiency and increasingly improved health are recognized to be important selling points for improved stoves.
During the last 30–40 years, diverse programmes have been initiated on household energy, from small-scale initiatives led by non-governmental organizations and communities to very ambitious national programmes, the largest of which has seen the installation of some 200 million improved stoves in rural China. Although few have been subjected to rigorous evaluation, the Indian national programme of improved cookstoves (Table 1.28), the Chinese national improved stoves programme (Table 1.29) (Smith et al., 1993; Sinton et al., 2004a) and the promotion of LPG (UNDP, 2004) have been assessed. Several smaller initiatives have also been reported: for example, the ceramic and metal stoves in East Africa which have proved popular and provided local employment (Njenga, 2001) and improved stove interventions in Guatemala (UNDP/ESMAP, 2003). Current projects also include the evaluation of several household energy programmes in India, Mexico and Guatemala, which seek to promote effective and sustainable markets for improved biomass stoves.
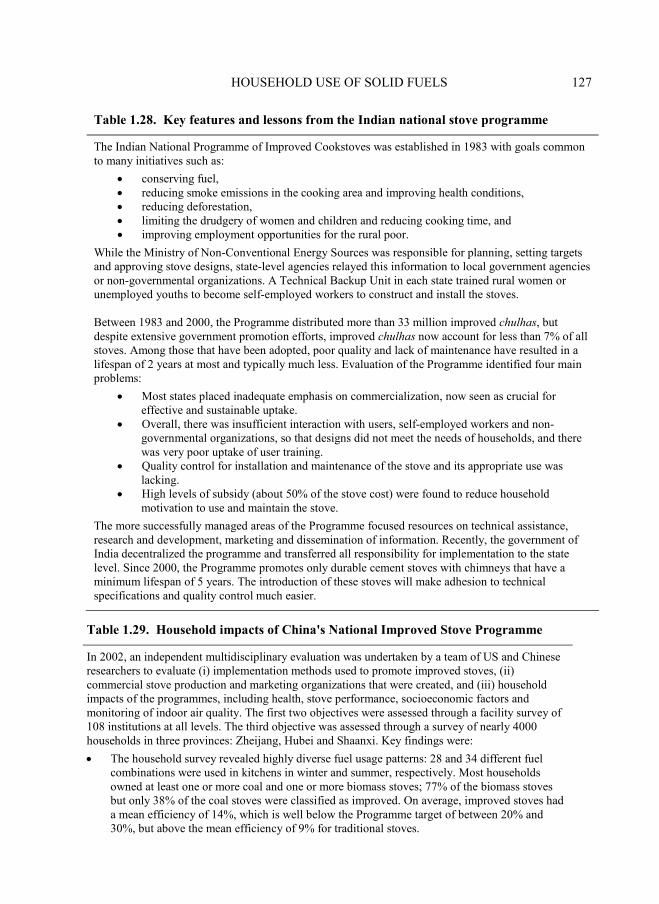
HOUSEHOLD USE OF SOLID FUELS 127
Table 1.28. Key features and lessons from the Indian national stove programme
The Indian National Programme of Improved Cookstoves was established in 1983 with goals common to many initiatives such as:
• conserving fuel, • reducing smoke emissions in the cooking area and improving health conditions, • reducing deforestation, • limiting the drudgery of women and children and reducing cooking time, and
• improving employment opportunities for the rural poor.
While the Ministry of Non-Conventional Energy Sources was responsible for planning, setting targets and approving stove designs, state-level agencies relayed this information to local government agencies or non-governmental organizations. A Technical Backup Unit in each state trained rural women or unemployed youths to become self-employed workers to construct and install the stoves.
Between 1983 and 2000, the Programme distributed more than 33 million improved chulhas, but despite extensive government promotion efforts, improved chulhas now account for less than 7% of all stoves. Among those that have been adopted, poor quality and lack of maintenance have resulted in a lifespan of 2 years at most and typically much less. Evaluation of the Programme identified four main problems:
• Most states placed inadequate emphasis on commercialization, now seen as crucial for effective and sustainable uptake.
• Overall, there was insufficient interaction with users, self-employed workers and non-governmental organizations, so that designs did not meet the needs of households, and there was very poor uptake of user training.
• Quality control for installation and maintenance of the stove and its appropriate use was lacking.
• High levels of subsidy (about 50% of the stove cost) were found to reduce household motivation to use and maintain the stove.
The more successfully managed areas of the Programme focused resources on technical assistance, research and development, marketing and dissemination of information. Recently, the government of India decentralized the programme and transferred all responsibility for implementation to the state level. Since 2000, the Programme promotes only durable cement stoves with chimneys that have a minimum lifespan of 5 years. The introduction of these stoves will make adhesion to technical specifications and quality control much easier.
Table 1.29. Household impacts of China's National Improved Stove Programme
In 2002, an independent multidisciplinary evaluation was undertaken by a team of US and Chinese researchers to evaluate (i) implementation methods used to promote improved stoves, (ii) commercial stove production and marketing organizations that were created, and (iii) household impacts of the programmes, including health, stove performance, socioeconomic factors and monitoring of indoor air quality. The first two objectives were assessed through a facility survey of 108 institutions at all levels. The third objective was assessed through a survey of nearly 4000 households in three provinces: Zheijang, Hubei and Shaanxi. Key findings were:
• The household survey revealed highly diverse fuel usage patterns: 28 and 34 different fuel combinations were used in kitchens in winter and summer, respectively. Most households owned at least one or more coal and one or more biomass stoves; 77% of the biomass stoves but only 38% of the coal stoves were classified as improved. On average, improved stoves had a mean efficiency of 14%, which is well below the Programme target of between 20% and 30%, but above the mean efficiency of 9% for traditional stoves.

128 IARC MONOGRAPHS VOLUME 95
Table 1.29. (contd)
• With respect to air quality (measured by PM4, the ‘thoracic fraction’ of particulate matter and carbon dioxide, coal stoves showed significantly higher concentrations than biomass stoves during the summer but not during the winter. Among households that used biomass fuels (but not among those that used combinations of fuels that included coal or LPG), improved stoves showed significantly lower PM4 and carbon dioxide concentrations than traditional stoves.
• In both children and adults, coal use was associated with higher levels of exposure as measured by carbon dioxide in exhaled breath, and improved biomass stoves had lower levels. Reported childhood asthma and adult respiratory disease were negatively associated with use of improved stoves and good stove maintenance. These results should, however, be treated as indicative due to the limited sample size.
Overall, several important conclusions emerge with relevance to future improved stove programmes:
• A wide range of combinations of different fuel and stove types may limit the impact of an improved stoves programme.
• Given the importance of space heating, providing an improved biomass stove for cooking may not be a sufficient strategy to reduce indoor air pollution. There is a need to promote improved coal stoves among rural Chinese households.
• Even among households that used improved stoves, PM4 and carbon dioxide levels were higher than Chinese national indoor air standards, implying that a large fraction of China’s rural population is still chronically exposed to pollution levels substantially above those determined by the Chinese government to harm human health.
Implementation of the Chinese national programme differed substantially from that in India, and offers an interesting comparison. Although the rural populations concerned are poor, they have greater effective purchasing power than those in many developing countries, which allowed the development of a programme in which the majority of consumers purchased the stoves at almost full price (Smith et al., 1993). Among the key features of the Chinese programme that are reported to have contributed to its success are decentralization of administration, a commercialization strategy that provided subsidies for the development of rural energy enterprises and quality control through the central production of critical components, such as parts of the combustion chamber, and engaging local technical institutions to modify national stove designs to meet local needs. National-level stove competitions generated contests among counties for contracts, to ensure local interest and allow the best-placed counties to proceed first; financial payments were only provided to counties after completion of an independent review of their achievements. No large flow of funds came from central government (in contrast, for example, with India, Table 1.30) and the major financial contributions were provided by local governments. As a result, delays and other problems associated with transferring large amounts of money were avoided. The Chinese programme succeeded in shifting norms: most biomass stoves now available on the market have flues and other technical features that classify them as improved.

HOUSEHOLD USE OF SOLID FUELS 129
Table 1.30. Characteristics of the national programme on improved chulhas in India compared with international experience
International practices in stove dissemination
Practices of the national programme on improved chulhas
Focus on need-based users Targeted approach, stress on number of villages to be covered rather than households; demand for stoves not taken into consideration
Minimal subsidy for the stove from government or donors
Subsidy on stove accounted for the largest share (50%) of government support. Users in periurban areas were willing to pay greater amounts subject to guarantee on stove quality.
Maximum support for research and development, production and distribution of stoves, credit, capacity building and public awareness
Programme funded technical back-up units, but inadequate support given for research and development, with no such support extended to non-governmental organizations. Support for capacity and awareness generation not adequate
Close interaction among the designers, producers and users of stoves
Adequate interaction between producer and user, but interaction negligible between designer, and producer and user
Dependence on centralized production of stove and stove parts to enable availability to larger number of people due to lower cost of supply
For fixed stoves, there was no scope for centralized production as these are built at user’s homes. Mass production of stove parts (chimney, cowl) undertaken by private manufacturer. No mass production of the firebox.
Onus on producers and designers to meet needs of consumers
Consumer needs met by self-employed workers/non-governmental organizations through changes in stove design with low inputs from designers.
Long-term funding Long-term target-based funding by government routed through nodal agencies and disbursed through non-governmental organizations for implementation.
The lessons from international programmes have been compared with a programme in India that was recently cancelled due to poor performance. The most successful international programmes target subsidies for the commercialization of the stoves rather than providing the user with extensive subsidies. The idea is to stimulate entrepreneurs to build the stoves and to create a real market for them. The role of subsidies in India’s programme is mixed. In the successful programmes, subsidies have encouraged possible stove owners to purchase them. However, once purchased, there are no follow-up subsidies for spare parts or maintenance. Subsidies can be used to support the development of the technical back-up units, quality control facilities for testing stoves, monitoring surveys to discern stove functionality and the opinions of users on the stoves, and training or education regarding subjects such as stove design, indoor air pollution and

130 IARC MONOGRAPHS VOLUME 95
energy efficiency. However, this should be done in a way that integrates the design, construction and convenience of the stoves for users.
The best international programmes have developed stove programmes in the regions that have the greatest needs to conserve energy, such as those that have significant biomass shortages and emerging markets in the sale of fuelwood. The lack of availability of components and component parts appears to be a weakness in most of the programmes. Both producers and users complained about their availability and quality.
(b) Importance of electrification and other fuels
Electrification has an important role in development (International Energy Agency, 2002). There is some evidence from South Africa that communities with grid access experience lower pollutant exposure (Röllin et al., 2004). Electricity is not expected to bring about large reductions in exposure to indoor air pollution in most low-income countries, however, since most poor households can only afford to use it for lighting and entertainment appliances but not for the much more energy-intensive and polluting requirements of cooking and space heating. The International Energy Agency (2002) has recently carried out a detailed review of electrification, including the issues involved in supply and cost recovery among poor (and especially rural) communities.
Experience in the promotion of LPG has also been reported, for example from the Indian Deepam Scheme (UNDP/ESMAP, 2002; World Bank, 2004b), and from the LPG rural energy challenge (UNDP, 2004). This latter initiative, developed by UNDP and the World LPG Association in 2002, promotes the development of new, viable markets for LPG in developing countries. Key elements include the development of partnerships in countries, enabling regulatory environments which facilitate LPG business development and product delivery, taking steps that reduce barriers to adoption: for example, the introduction of smaller (more affordable) gas bottles, and greater government and consumer awareness of costs and benefits. McDade (2004) has recently identified several key lessons that emerged from experience with the promotion of LPG markets.
(c) Key lessons
Too often, intervention technologies have been developed without adequate reference to users’ needs, and as a result have been poorly used and maintained, or abandoned. Consequently, it is important to involve users, particularly women, in assessing needs and developing suitable interventions. Sustainable uptake should also be promoted through greater availability of a choice of appropriately priced interventions in local markets.
A wide variety of interventions are already available, and new technologies and approaches are emerging. However, the greatest challenge is in securing widespread uptake of effective interventions among those most at risk (in effect, the rural and urban poor), in ways that are sustainable. Enabling policy across sectors, and at different levels in societies, is required.
HOUSEHOLD USE OF SOLID FUELS 131
Although levels of indoor air pollution associated with biomass and other solid fuel use can be reduced substantially, particularly by stoves with flues, experience shows that exposure levels are not reduced as much due to the fact that emissions remain high and people are exposed in the vicinity of their homes and from neighbours’ homes. Biomass stoves using secondary combustion may offer advantages due to much reduced emissions.
Cleaner fuels, in particular LPG and natural gas, offer the largest reductions in indoor air pollution and exposure, but cost and practical issues—in particular whether these fuels meet the needs of poor households—may result in lesser reductions being achieved in practice. Electricity is important for development, but is unlikely to contribute to substantial reductions in exposure to indoor air pollution as it is rarely used for cooking (and space heating where needed) in poor communities due to the high cost of supply infrastructure and use. Finally, behavioural changes can complement technical interventions, but appear to have limited potential alone.
1.5 References
Aggarwal AL, Raiyani CV, Patel PD et al. (1982). Assessment ofexposure to benzo(a)pyrene in air for various population groups in Ahmedabad. Atmos Environ, 16:867–870 doi:10.1016/0004-6981(82)90405-X.
Albalak R, Bruce N, McCracken JP et al. (2001). Indoor respirable particulate matter concentrations from an open fire, improved cookstove, and LPG/open fire combination in a rural Guatemalan community. Environ Sci Technol, 35:2650–2655 doi:10.1021/es001940m. PMID:11452588
Albalak R, Keeler GJ, Frisancho AR, Haber M (1999). Assessment of PM10 Concentrations from Domestic Biomass Fuel Combustion in Two Rural Bolivian Highland Villages. Environ Sci
Technol, 33:2505–2509 doi:10.1021/es981242q. Asaduzzaman M, Latif A (2005) Energy for Rural Households: Towards a Rural Energy
Strategy in Bangladesh. Bangladesh Institute of Development Studies, Dhaka. Bailie RS, Pilotto LS, Ehrlich RI et al. (1999). Poor urban environments: use of paraffin and other
fuels as sources of indoor air pollution. J Epidemiol Community Health, 53:585–586 doi:10.1136/jech.53.9.585. PMID:10562887
Balakrishnan K, Sambandam S, Ramaswamy P et al. (2004). Exposure assessment for respirable particulates associated with household fuel use in rural districts of Andhra Pradesh, India. J
Expo Anal Environ Epidemiol, 14 Suppl 1;S14–S25 doi:10.1038/sj.jea.7500354. PMID:15118741
Balakrishnan K, Sankar S, Parikh J et al. (2002). Daily average exposures to respirable particulate matter from combustion of biomass fuels in rural households of southern India. Environ
Health Perspect, 110:1069–1075. PMID:12417476 Barnes D, Krutilla K, Hyde W (2005) The Urban Household Energy Transition: Energy,
Poverty, and the Environment in the Developing World, Washington DC, Resources for the Future Press
Barnes D, Kumar P, Opershaw K, Agarwal S (2007) Traditional Hearths and Polluted Homes, New Delhi, World Bank.
132 IARC MONOGRAPHS VOLUME 95
Bhargava A, Khanna RN, Bhargava SK, Kumar S (2004). Exposure risk to carcinogenic PAHs in indoor-air during biomass combustion whilst cooking in rural India. Atmos Environ, 38:4761–4767 doi:10.1016/j.atmosenv.2004.05.012.
Boberg J (1993). Competition in Tanzania woodfuels market. Energy Policy, 21:474–490 doi:10.1016/0301-4215(93)90036-F.
Boleij J, Campbell H, Wafula E et al. (1988a) Biomass fuel combustion and indoor air quality in developing countries. In: Proceedings of the Indoor and Ambient Air Quality
Symposium. Perry R, Kirk PW, eds. London: Selper, 24–29. Boleij J, Campbell H, Greenwood BM (1988b) HEAL Project. Indoor Air Quality in the Basse
area, The Gambia. WHO/PEP/88.3, WHO/RSD/87.34. Geneva: WHO. Boleij JSM, Ruigewaard P, Hoek F et al. (1989). Domestic air pollution from biomass burning in
Kenya. Atmos Environ, 23:1677–1681 doi:10.1016/0004-6981(89)90052-8. Boy E, Bruce N, Delgado H (2002). Birth weight and exposure to kitchen wood smoke during
pregnancy in rural Guatemala. Environ Health Perspect, 110:109–114. PMID:11781172 Brauer M, Bartlett K, Regalado-Pineda J, Perez-Padilla R (1996). Assessmentof particulate
concentrations from domestic biomass combustion in rural Mexico. Environ Sci Technol, 30:104–109 doi:10.1021/es9501272.
Bruce NG, McCracken JP, Albalak R et al. (2004). Impact of improved stoves, house construction and child location on levels of indoor air pollution exposure in young Guatemalan children. J
Expo Anal Environ Epidemiol, 14 Suppl 1;S26–S33 doi:10.1038/sj.jea.7500355. PMID:15118742
Cáceres D, Adonis M, Retamal C et al. (2001). [Indoor air pollution in a zone of extreme poverty of La Pintana, Santiago-Chile]. Rev Med Chil, 129:33–42. PMID:11265203
Campbell H (1997). Indoor air pollution and acute lower respiratory infections in young Gambian children. Health Bull (Edinb), 55:20–31. PMID:9090175
Chang Y, Zhi B (1990) The effect on human health of indoor combustion of cow and sheep dung. Hunajing yu Jiankang Zazhi, 7:8–9.
Chen YJ, Bi XH, Mai BX et al. (2004). Emission characterization of particulate/gaseous phases and size association for polycyclic aromatic hydrocarbons from residential coal combustion. Fuel, 83:781–790 doi:10.1016/j.fuel.2003.11.003.
Chen YJ, Sheng GY, Bi XH et al. (2005). Emission factors for carbonaceous particles and polycyclic aromatic hydrocarbons from residential coal combustion in China. Environ Sci
Technol, 39:1861–1867 doi:10.1021/es0493650. PMID:15819248 Choudhari S, Pfaff A (2003). Fuel-choice and Indoor Air Quality: A Household-level
Perspective on Economic Growth and the Environment. Mimeo, Columbia University Chuang JC, Cao SR, Xian Y et al. (1992). Chemical characterization of indoor air of homes from
communes in Xuan-Wei, China, with high lung-cancer mortality rate. Atmos Environ, A26:2193–2201.
Cleary GJ, Blackburn RB (1968). Air pollution in native huts in the highlands of New Guinea. Arch Environ Health, 17:785–794. PMID:5698496
Collings DA, Sithole SD, Martin KS (1990). Indoor woodsmoke pollution causing lower respiratory disease in children. Trop Doct, 20:151–155. PMID:2284665
Cordeu JL, Cerda A (2000) El papel de los productos básicos agrícolas en América Latina y el Caribe. In: Congreso de Economía Agraria, November 2000
HOUSEHOLD USE OF SOLID FUELS 133
Dasgupta S, Huq M, Khaliquzzaman M et al. (2004a) Indoor Air Quality for Poor Families:
New Evidence from Bangladesh (World Bank Policy Research Working Paper 3393), World Bank.
Dasgupta S, Huq M, Khaliquzzaman M et al. (2004b) Who Suffers From Indoor Air Quality for
Poor Families: Evidence from Bangladesh (World Bank Policy Research Working Paper 3428), World Bank.
Davidson CI, Lin SF, Osborn JF et al. (1986). Indoor and outdoor air pollution in the Himalayas. Environ Sci Technol, 20:561–567 doi:10.1021/es00148a003. PMID:19994951
Desai MA, Mehta S, Smith KR (2004) Indoor Smoke from Solid Fuels: Assessing the
Environmental Burden of Disease at National and local levels (WHO Environmental Burden of Disease Series, No. 4), Geneva, World Health Organization.
Du YX, Ou XL (1990) Indoor air pollution and woman lung cancer. In: Proceedings of the
Fifth International Conference on Indoor Air Quality and Climate, Toronto, Vol. 1, pp. 59–64
EBCREY (Editorial Board of the China Rural Energy Yearbook) (1999) Zhongguo Nongcun
Nengyuan Nianjian 1998–1999 [China Rural Energy Yearbook 1998–1999], Beijing, Zhongguo Nongye Chubanshe (in Chinese)
Ellegard A (1994) Health Effects of Charcoal Production from Earth Kilns in Chisamba Area,
Zambia, Stockholm, Stockholm Environment Institute. Ellegard, A. (1997) Household Energy Health Issues in Maputo (EE&D Series No. 42) Ellegard A, Egneus H (1993). Urban energy: Exposure to biomass fuel pollution in Lusaka.
Bioresour Technol, 43:7–12. Ezzati M, Kammen DM (2001). Quantifying the effects of exposure to indoor air pollution from
biomass combustion on acute respiratory infections in developing countries. Environ Health
Perspect, 109:481–488 doi:10.2307/3454706. PMID:11401759 Ezzati M, Kammen DM (2002). The health impacts of exposure to indoor air pollution from solid
fuels in developing countries: knowledge, gaps, and data needs. Environ Health Perspect, 110:1057–1068. PMID:12417475
Ezzati M, Saleh H, Kammen DM (2000). The contributions of emissions and spatial microenvironments to exposure to indoor air pollution from biomass combustion in Kenya. Environ Health Perspect, 108:833–839 doi:10.2307/3434990. PMID:11017887
Fairley D (1990). The relationship of daily mortality to suspended particulates in Santa Clara County, 1980–1986. Environ Health Perspect, 89:159–168 doi:10.2307/3430912. PMID:2088743
Fine PM, Cass GR, Simoneit BR (2002). Chemical characterzation of fine particle emissions from the fireplace combustion of woods grown in the Southern United States. Environ Sci Technol, 36:1442–1451 doi:10.1021/es0108988. PMID:11999049
Gachanja AN, Worsfold PJ (1993). Monitoring of polycyclic aromatic hydrocarbon emissions from biomass combustion in Kenya using liquid chromatography with fluorescence detection. Sci Total Environ, 138:77–89 doi:10.1016/0048-9697(93)90406-V.
Gao Z, Tang M, Yi Y et al. (1993). Research into the effect of burning LPG, coal, and firewood on indoor air pollution and human health. Zhongguo Gonggong Weisheng, 9:13–14.
Ge S, Xu X, Chow JC et al. (2004). Emissions of air pollutants from household stoves: honeycomb coal versus coal cake. Environ Sci Technol, 38:4612–4618 doi:10.1021/es049942k. PMID:15461170
134 IARC MONOGRAPHS VOLUME 95
Granville CA, Hanley NM, Mumford JL, DeMarini DM (2003). Mutation spectra of smoky coal combustion emissions in Salmonella reflect the TP53 and KRAS mutations in lung tumors from smoky coal-exposed individuals. Mutat Res, 525:77–83. PMID:12650907
Gu SL, Ji RD, Cao SR (1990). The physical and chemical characteristics of particles in indoor air where high fluoride coal burning takes place. Biomed Environ Sci, 3:384–390. PMID:2096842
Gullett BK, Touati A, Hays MD (2003). PCDD/F, PCB, HxCBz, PAH, and PM emission factors for fireplace and woodstove combustion in the San Francisco Bay region. Environ Sci Technol, 37:1758–1765 doi:10.1021/es026373c. PMID:12775046
Guo L, Shi YZ, Xi XP et al. (1994). [Changes in air quality before and after residential use of coal gas.]. J Environ Health, 11:65–66.
Guo LF, Tang L (1985). [An investigation of air pollution in different residences in Nanning City.]. Chin. J. Environ. Health, 2:32–33.
Habib G, Venkataraman C, Shrivastava M et al. (2004). New methodology for estimating biofuel consumption for cooking: Atmospheric emissions of black carbon and sulfur dioxide from India. Global Biogeochem Cycles, 18:GB3007 doi:10.1029/2003GB002157.
Hamada GS, Kowalski LP, Murata Y et al. (1991). Wood stove effects on indoor air quality in Brazilian homes: Carcinogens, suspended particulate matter, and nitrogen dioxide analysis. Tokai J Exp Clin Med, 17:145–153.
Hays MD, Geron CD, Linna KJ et al. (2002). Speciation of gas-phase and fine particle emissions from burning of foliar fuels. Environ Sci Technol, 36:2281–2295 doi:10.1021/es0111683. PMID:12075778
He GL, Ying B, Liu J et al. (2005). Patterns of household concentrations of multiple indoor air pollutants in China. Environ Sci Technol, 39:991–998 doi:10.1021/es049731f. PMID:15773470
He XZ, Chen W, Liu ZY, Chapman RS; Case-Control Study on Lung Cancer and Cooking Fuel (1991). An epidemiological study of lung cancer in Xuan Wei County, China: current progress. Case-control study on lung cancer and cooking fuel. Environ Health Perspect, 94:9–13 doi:10.2307/3431286. PMID:1954946
Hessen JO, Schei M, Pandey MR (1996) Attitudes and behavioural aspects relating to implementation of improved stoves in rural Nepal. Proceedings of the 7th International Conference on Indoor Air Quality and Climate Vol. 1, pp. 1049, July 1996, Japan.
IARC (1982). Some industrial chemicals and dyestuffs. IARC Monogr Eval Carcinog Risk Chem
Hum, 29:1–398. PMID:6957379 IARC (1987). Overall evaluations of carcinogenicity: an updating of IARC Monographs volumes 1
to 42. IARC Monogr Eval Carcinog Risks Hum Suppl, 7:1–440. PMID:3482203 IARC (1990). Chromium, nickel and welding. IARC Monogr Eval Carcinog Risks Hum, 49:1–
648. PMID:2232124 IARC (1999). Re-evaluation of some organic chemicals, hydrazine and hydrogen peroxide.
Proceedings of the IARC Working Group on the Evaluation of Carcinogenic Risks to Humans. Lyon, France, 17–24 February 1998. IARC Monogr Eval Carcinog Risks Hum, 71:1–315. PMID:10507919
IARC (2002). Some traditional herbal medicines, some mycotoxins, naphthalene and styrene. IARC Monogr Eval Carcinog Risks Hum, 82:1–556. PMID:12687954
IARC (2004). Some drinking-water disinfectants and contaminants, including arsenic. IARC
Monogr Eval Carcinog Risks Hum, 84:1–477. PMID:15645577

HOUSEHOLD USE OF SOLID FUELS 135
IARC (2006). Formaldehyde, 2-butoxyethanol and 1-tert-butoxypropan-2-ol. IARC Monogr Eval
Carcinog Risks Hum, 88:1–478. PMID:17366697 IARC (2010). Some Non-heterocyclic Polycyclic Aromatic Hydrocarbons and Some Related
Exposures. IARC Monogr Eval Carcinog Risks Hum, 92:1–853 International Energy Agency (2002) World Energy Outlook, Chapter 13, Energy and Poverty ITDG (2002) Reducing Indoor Air Pollution in Rural Households in Kenya: Working With
Communities to Find Solutions (ITDG Project 1998–2001) Jenkins BM, Turn SQ, Williams RB (1992). Atmospheric emissions from agricultural burning in
California: Determination of burn fractions, distribution factors, and crop-specific contributions. Agric Ecosyst Environ, 38:313–330 doi:10.1016/0167-8809(92)90153-3.
Jiang HW, Umezaki M, Ohtsuka R (2006). Inter-household variation in adoption of cash cropping and its effects on labor and dietary patterns: A study in a Li hamlet in Hainan island, China. Anthropol Sci, 114:165–173 doi:10.1537/ase.050810.
Jin Y, Zhou Z, He G et al. (2005). Geographical, spatial, and temporal distributions of multiple indoor air pollutants in four Chinese provinces. Environ Sci Technol, 39:9431–9439 doi:10.1021/es0507517. PMID:16475318
Jordan TB, Seen AJ (2005). Effect of airflow setting on the organic composition of woodheater emissions. Environ Sci Technol, 39:3601–3610 doi:10.1021/es0487628. PMID:15952364
Kauppinen EI, Pakkanen TA (1990). Coal combustion aerosols — A field study. Environ Sci
Technol, 24:1811–1818 doi:10.1021/es00082a004. Keohavong P, Lan Q, Gao WM et al. (2003). K-ras mutations in lung carcinomas from
nonsmoking women exposed to unvented coal smoke in China. Lung Cancer, 41:21–27 doi:10.1016/S0169-5002(03)00125-9. PMID:12826308
Kim O, Nghiem H, Phyu YL (2002). Emission of polycyclic aromatic hydrocarbons, toxicity, and mutagenicity from domestic cooking using sawdust briquettes, wood, and kerosene. Environ
Sci Technol, 36:833–839 doi:10.1021/es011060n. PMID:11918004 Kim Oanh NT, Reutergardh LB, Dung NT (1999). Emission of polycyclic aromatic hydrocarbons
and particulate matter from domestic combustion of selected fuels. Environ Sci Technol, 33:2703–2709 doi:10.1021/es980853f.
Kleeman MJ, Schauer JJ, Cass GR (1999). Size and composition distribution of fine particulate matter emitted from wood burning, meat charbroiling and cigarettes. Environ Sci Technol, 33:3516–3523 doi:10.1021/es981277q.
Lan Q, Chapman RS, Schreinemachers DM et al. (2002). Household stove improvement and risk of lung cancer in Xuanwei, China. J Natl Cancer Inst, 94:826–835. PMID:12048270
Larson T, Gould T, Simpson C et al. (2004). Source apportionment of indoor, outdoor, and personal PM2.5 in Seattle, Washington, using positive matrix factorization. J Air Waste
Manag Assoc, 54:1175–1187. PMID:15468670 Larson TV, Koenig JQ (1994). Wood smoke: emissions and noncancer respiratory effects. Annu
Rev Public Health, 15:133–156 doi:10.1146/annurev.pu.15.050194.001025. PMID:8054078 Leach G (1987) Household Energy in South Asia, London, Elsevier. Leach G, Mearns R (1988) Biod\energy Issues and Options in Africa. Report for the Royal
Norwegian Ministry of Development Cooperation, London, International Institute for Environment and Development.

136 IARC MONOGRAPHS VOLUME 95
Lee RGM, Coleman P, Jones JL et al. (2005). Emission factors and importance of PCDD/Fs, PCBs, PCNs, PAHs and PM10 from the domestic burning of coal and wood in the U.K. Environ Sci Technol, 39:1436–1447 doi:10.1021/es048745i. PMID:15819195
Liu Y, Zhu L, Shen X (2001). Polycyclic aromatic hydrocarbons (PAHs) in indoor and outdoor air of Hangzhou, China. Environ Sci Technol, 35:840–844 doi:10.1021/es001354t. PMID:11351525
Manchester-Neesvig JB, Schauer JJ, Cass GR (2003). The distribution of particle-phase organic compounds in the atmosphere and their use for source apportionment during the Southern California Children’s Health Study. J Air Waste Manag Assoc, 53:1065–1079. PMID:13678364
Mandal AK, Kishore J, Rangesamy S et al. (1996) PAH concentration in Indian kitchen and its relation to breast carcinoma. In: Proceedings of the 7th International Conference on
Indoor Air Quality and Climate, Nagoya, Japan, Vol. 2, p. 34. Maykut NN, Lewtas J, Kim E, Larson TV (2003). Source apportionment of PM2.5 at an urban
IMPROVE site in Seattle, Washington. Environ Sci Technol, 37:5135–5142 doi:10.1021/es030370y. PMID:14655699
McDade S (2004). Fueling development: The role of LPG in poverty reduction and growth. Energy Sustain Dev, 8:74–81.
McDonald JD, White RK, Barr EB et al. (2006). Generation and characterization of hardwood smoke inhalation exposure atmospheres. Aerosol Sci Technol, 40:573–584 doi:10.1080/02786820600724378.
McDonald JD, Zielinska B, Fujita EM et al. (2000). Fine particle and gaseous emission rates from residential wood combustion. Environ Sci Technol, 34:2080–2091 doi:10.1021/es9909632.
McGowan JA, Hider RN, Chacko E, Town GI (2002). Particulate air pollution and hospital admissions in Christchurch, New Zealand. Aust N Z J Public Health, 26:23–29 doi:10.1111/j.1467-842X.2002.tb00266.x. PMID:11895020
Mehta S, Smith KR (2002) Exposure Atlas for Household Energy and Indoor Air Pollution Modeling Component: Predicting Household Pollution Levels. World Bank Energy Sector Management Assistance Programme (ESMAP), Washington DC.
Miller CA, Srivastava RK, Ryan JV (1994). Emissions of organic hazardous air-pollutants from the combustion of pulverized coal in a small-scale combustor. Environ Sci Technol, 28:1150–1158 doi:10.1021/es00055a028.
Mishra V, Dai X, Smith KR, Mika L (2004). Maternal exposure to biomass smoke and reduced birth weight in Zimbabwe. Ann Epidemiol, 14:740–747 doi:10.1016/j.annepidem.2004.01.009. PMID:15519895
Mumford JL, He XZ, Chapman RS et al. (1987). Lung cancer and indoor air pollution in Xuan Wei, China. Science, 235:217–220 doi:10.1126/science.3798109. PMID:3798109
Naeher LP, Brauer M, Lipsett M et al. (2007). Woodsmoke health effects: a review. Inhal Toxicol, 19:67–106 doi:10.1080/08958370600985875. PMID:17127644
Naeher LP, Leaderer BP, Smith KR (2000a). Particulate matter and carbon monoxide in highland Guatemala: indoor and outdoor levels from traditional and improved wood stoves and gas stoves. Indoor Air, 10:200–205. PMID:10979201 doi:10.1034/j.1600-0668.2000.010003200.x
Naeher LP, Smith KR, Leaderer BP et al. (2000b). Indoor and outdoor PM2.5 and CO in high- and low-density Guatemalan villages. J Expo Anal Environ Epidemiol, 10:544–551 doi:10.1038/sj.jea.7500113. PMID:11140438

HOUSEHOLD USE OF SOLID FUELS 137
Naeher LP, Smith KR, Brauer M et al., editors (2005) Critical Review of the Health Effects of
Woodsmoke, Ottawa, Health Canada, Air Health Effects Division. Naeher LP, Smith KR, Leaderer BP et al. (2001). Carbon monoxide as a tracer for assessing
exposures to particulate matter in wood and gas cookstove households of highland Guatemala. Environ Sci Technol, 35:575–581 doi:10.1021/es991225g. PMID:11351731
National Bureau of Statistics (2005) China Energy Statistical Yearbook 2005, Beijing, China Statistics Press.
National Bureau of Statistics (2006) China Statistical Yearbook 2006, Beijing, China Statistics Press.
Njenga BK (2001) Rural stoves project. In: Karlsson, G.V. & Misana, S., eds, Generating
Opportunities: Case Studies on Energy and Women, Washington DC, United Nations Development Programme, pp. 45–51.
Nolte CG, Schauer JJ, Cass GR, Simoneit BR (2001). Highly polar organic compounds present in wood smoke and in the ambient atmosphere. Environ Sci Technol, 35:1912–1919 doi:10.1021/es001420r. PMID:11393968
Ohtsuka R, Abe T, Umezaki M (1998) Environmentally Sound Agricultural Development in
Rural Societies: A Comparative View from Papua New Guinea and South China. South-
South Co-operation Program on Environmentally Sound Socio-Economic Development in
the Humid Tropics (Working Paper No. 27), Paris, UNESCO. Organización Latinoamerica de Energía (2000) El Desarrollo del Sector Energético de América
Latina y el Caribe Oros DR, Simoneit BRT (2001). Identification and emission factors of molecular tracers in organic
aerosols from biomass burning. Part 1. Temperate climate conifers. Appl Geochem, 16:1513–1544 doi:10.1016/S0883-2927(01)00021-X.
Pakistan Integrated Household Survey (1991) Pakistan National Census Survey (1998) Pan XQ, Dong ZJ, Jin XB et al. (2001). [Study on assessment for exposure to air pollution in rural
areas.]. J Environ Health, 18:323–325. Pandey MR, Neupane RP, Gautam A, Shrestha IB (1990). The effectiveness of smokeless stoves
in reducing indoor air pollution in a rural hill region of Nepal. Mt Res Dev, 10:313–320 doi:10.2307/3673493.
Pérez-Padilla R, Regalado J, Vedal S et al. (1996). Exposure to biomass smoke and chronic airway disease in Mexican women. A case-control study. Am J Respir Crit Care Med, 154:701–706. PMID:8810608
Polissar AV, Hopke PK, Poirot RL (2001). Atmospheric aerosol over Vermont: chemical composition and sources. Environ Sci Technol, 35:4604–4621 doi:10.1021/es0105865. PMID:11770762
Qin YH, Zhang XM, Jin HZJ et al. (1991). Indoor air pollution in four cities in China. Biomed
Environ Sci, 4:366–372. PMID:1781931 Raiyani CV, Shah SH, Desai NM et al. (1993a). Characterisation and problems of indoor air
pollution due to cooking stove smoke. Atmos Environ, 27A:1643–1655. Raiyani CV, Jani JP, Desai NM et al. (1993b). Assessment of indoor exposure to polycyclic
aromatic hydrocarbons from urban poor using various types of cooking fuels. Environ Contam
Toxicol, 50:757–763.
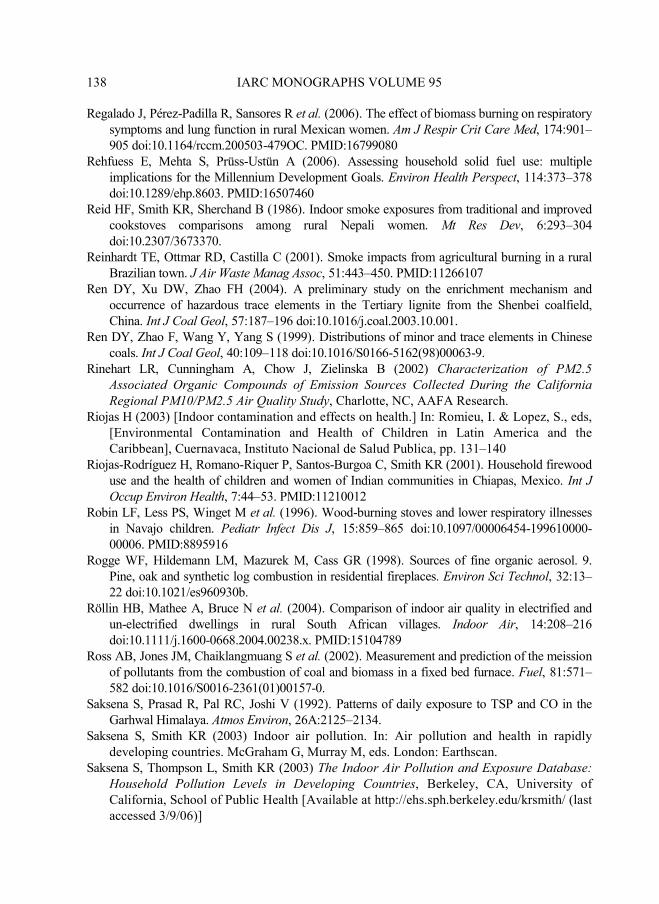
138 IARC MONOGRAPHS VOLUME 95
Regalado J, Pérez-Padilla R, Sansores R et al. (2006). The effect of biomass burning on respiratory symptoms and lung function in rural Mexican women. Am J Respir Crit Care Med, 174:901–905 doi:10.1164/rccm.200503-479OC. PMID:16799080
Rehfuess E, Mehta S, Prüss-Ustün A (2006). Assessing household solid fuel use: multiple implications for the Millennium Development Goals. Environ Health Perspect, 114:373–378 doi:10.1289/ehp.8603. PMID:16507460
Reid HF, Smith KR, Sherchand B (1986). Indoor smoke exposures from traditional and improved cookstoves comparisons among rural Nepali women. Mt Res Dev, 6:293–304 doi:10.2307/3673370.
Reinhardt TE, Ottmar RD, Castilla C (2001). Smoke impacts from agricultural burning in a rural Brazilian town. J Air Waste Manag Assoc, 51:443–450. PMID:11266107
Ren DY, Xu DW, Zhao FH (2004). A preliminary study on the enrichment mechanism and occurrence of hazardous trace elements in the Tertiary lignite from the Shenbei coalfield, China. Int J Coal Geol, 57:187–196 doi:10.1016/j.coal.2003.10.001.
Ren DY, Zhao F, Wang Y, Yang S (1999). Distributions of minor and trace elements in Chinese coals. Int J Coal Geol, 40:109–118 doi:10.1016/S0166-5162(98)00063-9.
Rinehart LR, Cunningham A, Chow J, Zielinska B (2002) Characterization of PM2.5
Associated Organic Compounds of Emission Sources Collected During the California
Regional PM10/PM2.5 Air Quality Study, Charlotte, NC, AAFA Research. Riojas H (2003) [Indoor contamination and effects on health.] In: Romieu, I. & Lopez, S., eds,
[Environmental Contamination and Health of Children in Latin America and the Caribbean], Cuernavaca, Instituto Nacional de Salud Publica, pp. 131–140
Riojas-Rodríguez H, Romano-Riquer P, Santos-Burgoa C, Smith KR (2001). Household firewood use and the health of children and women of Indian communities in Chiapas, Mexico. Int J
Occup Environ Health, 7:44–53. PMID:11210012 Robin LF, Less PS, Winget M et al. (1996). Wood-burning stoves and lower respiratory illnesses
in Navajo children. Pediatr Infect Dis J, 15:859–865 doi:10.1097/00006454-199610000-00006. PMID:8895916
Rogge WF, Hildemann LM, Mazurek M, Cass GR (1998). Sources of fine organic aerosol. 9. Pine, oak and synthetic log combustion in residential fireplaces. Environ Sci Technol, 32:13–22 doi:10.1021/es960930b.
Röllin HB, Mathee A, Bruce N et al. (2004). Comparison of indoor air quality in electrified and un-electrified dwellings in rural South African villages. Indoor Air, 14:208–216 doi:10.1111/j.1600-0668.2004.00238.x. PMID:15104789
Ross AB, Jones JM, Chaiklangmuang S et al. (2002). Measurement and prediction of the meission of pollutants from the combustion of coal and biomass in a fixed bed furnace. Fuel, 81:571–582 doi:10.1016/S0016-2361(01)00157-0.
Saksena S, Prasad R, Pal RC, Joshi V (1992). Patterns of daily exposure to TSP and CO in the Garhwal Himalaya. Atmos Environ, 26A:2125–2134.
Saksena S, Smith KR (2003) Indoor air pollution. In: Air pollution and health in rapidly developing countries. McGraham G, Murray M, eds. London: Earthscan.
Saksena S, Thompson L, Smith KR (2003) The Indoor Air Pollution and Exposure Database:
Household Pollution Levels in Developing Countries, Berkeley, CA, University of California, School of Public Health [Available at http://ehs.sph.berkeley.edu/krsmith/ (last accessed 3/9/06)]
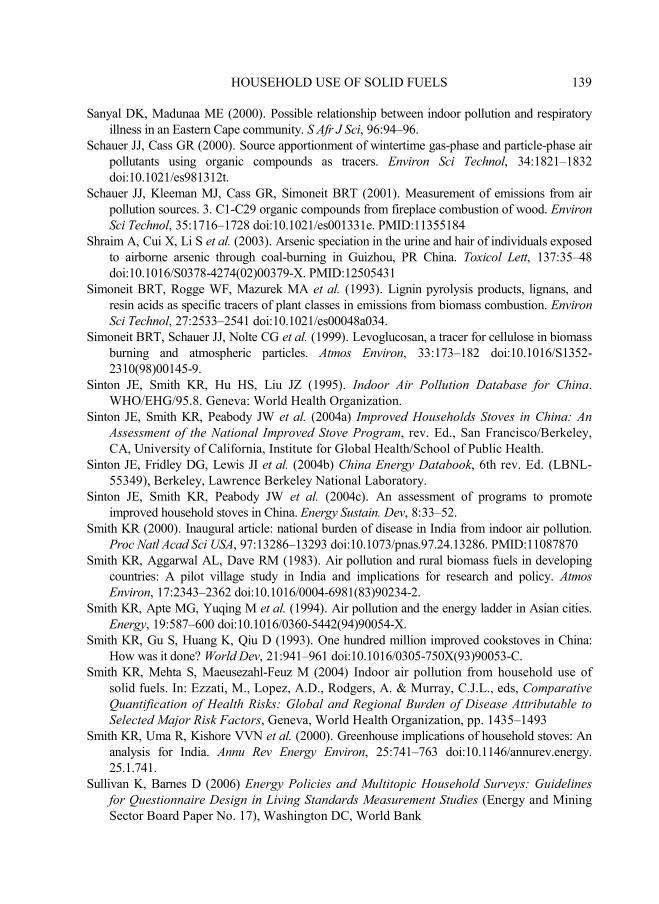
HOUSEHOLD USE OF SOLID FUELS 139
Sanyal DK, Madunaa ME (2000). Possible relationship between indoor pollution and respiratory illness in an Eastern Cape community. S Afr J Sci, 96:94–96.
Schauer JJ, Cass GR (2000). Source apportionment of wintertime gas-phase and particle-phase air pollutants using organic compounds as tracers. Environ Sci Technol, 34:1821–1832 doi:10.1021/es981312t.
Schauer JJ, Kleeman MJ, Cass GR, Simoneit BRT (2001). Measurement of emissions from air pollution sources. 3. C1-C29 organic compounds from fireplace combustion of wood. Environ
Sci Technol, 35:1716–1728 doi:10.1021/es001331e. PMID:11355184 Shraim A, Cui X, Li S et al. (2003). Arsenic speciation in the urine and hair of individuals exposed
to airborne arsenic through coal-burning in Guizhou, PR China. Toxicol Lett, 137:35–48 doi:10.1016/S0378-4274(02)00379-X. PMID:12505431
Simoneit BRT, Rogge WF, Mazurek MA et al. (1993). Lignin pyrolysis products, lignans, and resin acids as specific tracers of plant classes in emissions from biomass combustion. Environ
Sci Technol, 27:2533–2541 doi:10.1021/es00048a034. Simoneit BRT, Schauer JJ, Nolte CG et al. (1999). Levoglucosan, a tracer for cellulose in biomass
burning and atmospheric particles. Atmos Environ, 33:173–182 doi:10.1016/S1352-2310(98)00145-9.
Sinton JE, Smith KR, Hu HS, Liu JZ (1995). Indoor Air Pollution Database for China. WHO/EHG/95.8. Geneva: World Health Organization.
Sinton JE, Smith KR, Peabody JW et al. (2004a) Improved Households Stoves in China: An
Assessment of the National Improved Stove Program, rev. Ed., San Francisco/Berkeley, CA, University of California, Institute for Global Health/School of Public Health.
Sinton JE, Fridley DG, Lewis JI et al. (2004b) China Energy Databook, 6th rev. Ed. (LBNL-55349), Berkeley, Lawrence Berkeley National Laboratory.
Sinton JE, Smith KR, Peabody JW et al. (2004c). An assessment of programs to promote improved household stoves in China. Energy Sustain. Dev, 8:33–52.
Smith KR (2000). Inaugural article: national burden of disease in India from indoor air pollution. Proc Natl Acad Sci USA, 97:13286–13293 doi:10.1073/pnas.97.24.13286. PMID:11087870
Smith KR, Aggarwal AL, Dave RM (1983). Air pollution and rural biomass fuels in developing countries: A pilot village study in India and implications for research and policy. Atmos
Environ, 17:2343–2362 doi:10.1016/0004-6981(83)90234-2. Smith KR, Apte MG, Yuqing M et al. (1994). Air pollution and the energy ladder in Asian cities.
Energy, 19:587–600 doi:10.1016/0360-5442(94)90054-X. Smith KR, Gu S, Huang K, Qiu D (1993). One hundred million improved cookstoves in China:
How was it done? World Dev, 21:941–961 doi:10.1016/0305-750X(93)90053-C. Smith KR, Mehta S, Maeusezahl-Feuz M (2004) Indoor air pollution from household use of
solid fuels. In: Ezzati, M., Lopez, A.D., Rodgers, A. & Murray, C.J.L., eds, Comparative
Quantification of Health Risks: Global and Regional Burden of Disease Attributable to
Selected Major Risk Factors, Geneva, World Health Organization, pp. 1435–1493 Smith KR, Uma R, Kishore VVN et al. (2000). Greenhouse implications of household stoves: An
analysis for India. Annu Rev Energy Environ, 25:741–763 doi:10.1146/annurev.energy. 25.1.741.
Sullivan K, Barnes D (2006) Energy Policies and Multitopic Household Surveys: Guidelines
for Questionnaire Design in Living Standards Measurement Studies (Energy and Mining Sector Board Paper No. 17), Washington DC, World Bank
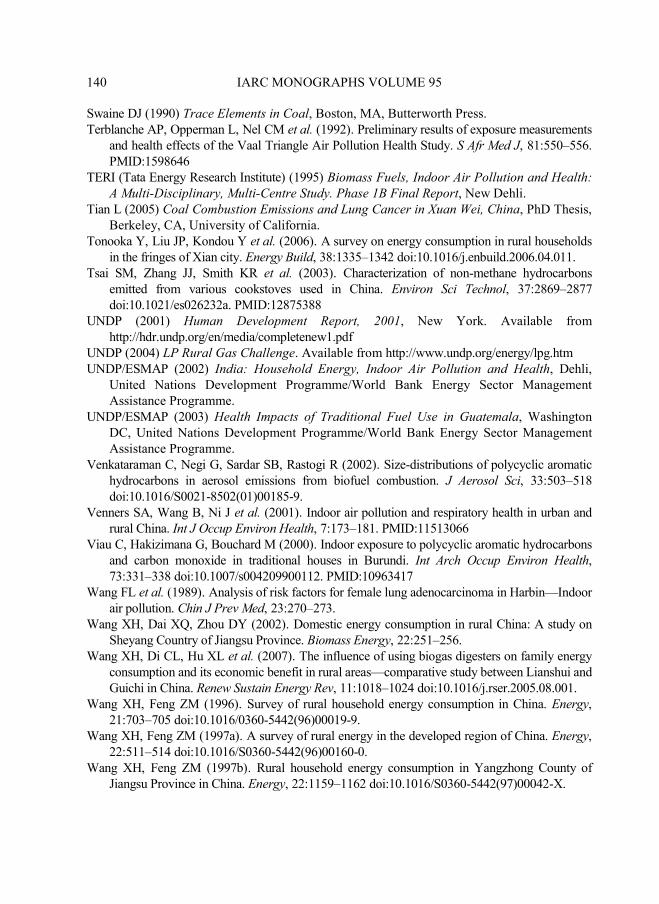
140 IARC MONOGRAPHS VOLUME 95
Swaine DJ (1990) Trace Elements in Coal, Boston, MA, Butterworth Press. Terblanche AP, Opperman L, Nel CM et al. (1992). Preliminary results of exposure measurements
and health effects of the Vaal Triangle Air Pollution Health Study. S Afr Med J, 81:550–556. PMID:1598646
TERI (Tata Energy Research Institute) (1995) Biomass Fuels, Indoor Air Pollution and Health:
A Multi-Disciplinary, Multi-Centre Study. Phase 1B Final Report, New Dehli. Tian L (2005) Coal Combustion Emissions and Lung Cancer in Xuan Wei, China, PhD Thesis,
Berkeley, CA, University of California. Tonooka Y, Liu JP, Kondou Y et al. (2006). A survey on energy consumption in rural households
in the fringes of Xian city. Energy Build, 38:1335–1342 doi:10.1016/j.enbuild.2006.04.011. Tsai SM, Zhang JJ, Smith KR et al. (2003). Characterization of non-methane hydrocarbons
emitted from various cookstoves used in China. Environ Sci Technol, 37:2869–2877 doi:10.1021/es026232a. PMID:12875388
UNDP (2001) Human Development Report, 2001, New York. Available from http://hdr.undp.org/en/media/completenew1.pdf
UNDP (2004) LP Rural Gas Challenge. Available from http://www.undp.org/energy/lpg.htm UNDP/ESMAP (2002) India: Household Energy, Indoor Air Pollution and Health, Dehli,
United Nations Development Programme/World Bank Energy Sector Management Assistance Programme.
UNDP/ESMAP (2003) Health Impacts of Traditional Fuel Use in Guatemala, Washington DC, United Nations Development Programme/World Bank Energy Sector Management Assistance Programme.
Venkataraman C, Negi G, Sardar SB, Rastogi R (2002). Size-distributions of polycyclic aromatic hydrocarbons in aerosol emissions from biofuel combustion. J Aerosol Sci, 33:503–518 doi:10.1016/S0021-8502(01)00185-9.
Venners SA, Wang B, Ni J et al. (2001). Indoor air pollution and respiratory health in urban and rural China. Int J Occup Environ Health, 7:173–181. PMID:11513066
Viau C, Hakizimana G, Bouchard M (2000). Indoor exposure to polycyclic aromatic hydrocarbons and carbon monoxide in traditional houses in Burundi. Int Arch Occup Environ Health, 73:331–338 doi:10.1007/s004209900112. PMID:10963417
Wang FL et al. (1989). Analysis of risk factors for female lung adenocarcinoma in Harbin—Indoor air pollution. Chin J Prev Med, 23:270–273.
Wang XH, Dai XQ, Zhou DY (2002). Domestic energy consumption in rural China: A study on Sheyang Country of Jiangsu Province. Biomass Energy, 22:251–256.
Wang XH, Di CL, Hu XL et al. (2007). The influence of using biogas digesters on family energy consumption and its economic benefit in rural areas—comparative study between Lianshui and Guichi in China. Renew Sustain Energy Rev, 11:1018–1024 doi:10.1016/j.rser.2005.08.001.
Wang XH, Feng ZM (1996). Survey of rural household energy consumption in China. Energy, 21:703–705 doi:10.1016/0360-5442(96)00019-9.
Wang XH, Feng ZM (1997a). A survey of rural energy in the developed region of China. Energy, 22:511–514 doi:10.1016/S0360-5442(96)00160-0.
Wang XH, Feng ZM (1997b). Rural household energy consumption in Yangzhong County of Jiangsu Province in China. Energy, 22:1159–1162 doi:10.1016/S0360-5442(97)00042-X.
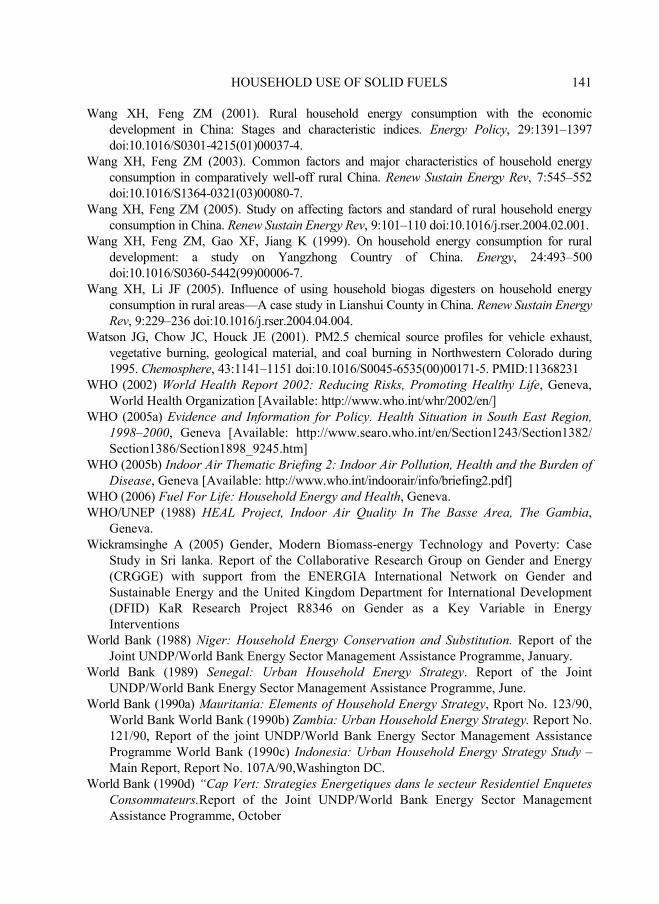
HOUSEHOLD USE OF SOLID FUELS 141
Wang XH, Feng ZM (2001). Rural household energy consumption with the economic development in China: Stages and characteristic indices. Energy Policy, 29:1391–1397 doi:10.1016/S0301-4215(01)00037-4.
Wang XH, Feng ZM (2003). Common factors and major characteristics of household energy consumption in comparatively well-off rural China. Renew Sustain Energy Rev, 7:545–552 doi:10.1016/S1364-0321(03)00080-7.
Wang XH, Feng ZM (2005). Study on affecting factors and standard of rural household energy consumption in China. Renew Sustain Energy Rev, 9:101–110 doi:10.1016/j.rser.2004.02.001.
Wang XH, Feng ZM, Gao XF, Jiang K (1999). On household energy consumption for rural development: a study on Yangzhong Country of China. Energy, 24:493–500 doi:10.1016/S0360-5442(99)00006-7.
Wang XH, Li JF (2005). Influence of using household biogas digesters on household energy consumption in rural areas—A case study in Lianshui County in China. Renew Sustain Energy
Rev, 9:229–236 doi:10.1016/j.rser.2004.04.004. Watson JG, Chow JC, Houck JE (2001). PM2.5 chemical source profiles for vehicle exhaust,
vegetative burning, geological material, and coal burning in Northwestern Colorado during 1995. Chemosphere, 43:1141–1151 doi:10.1016/S0045-6535(00)00171-5. PMID:11368231
WHO (2002) World Health Report 2002: Reducing Risks, Promoting Healthy Life, Geneva, World Health Organization [Available: http://www.who.int/whr/2002/en/]
WHO (2005a) Evidence and Information for Policy. Health Situation in South East Region,
1998–2000, Geneva [Available: http://www.searo.who.int/en/Section1243/Section1382/ Section1386/Section1898_9245.htm]
WHO (2005b) Indoor Air Thematic Briefing 2: Indoor Air Pollution, Health and the Burden of
Disease, Geneva [Available: http://www.who.int/indoorair/info/briefing2.pdf] WHO (2006) Fuel For Life: Household Energy and Health, Geneva. WHO/UNEP (1988) HEAL Project, Indoor Air Quality In The Basse Area, The Gambia,
Geneva. Wickramsinghe A (2005) Gender, Modern Biomass-energy Technology and Poverty: Case
Study in Sri lanka. Report of the Collaborative Research Group on Gender and Energy (CRGGE) with support from the ENERGIA International Network on Gender and Sustainable Energy and the United Kingdom Department for International Development (DFID) KaR Research Project R8346 on Gender as a Key Variable in Energy Interventions
World Bank (1988) Niger: Household Energy Conservation and Substitution. Report of the Joint UNDP/World Bank Energy Sector Management Assistance Programme, January.
World Bank (1989) Senegal: Urban Household Energy Strategy. Report of the Joint UNDP/World Bank Energy Sector Management Assistance Programme, June.
World Bank (1990a) Mauritania: Elements of Household Energy Strategy, Rport No. 123/90, World Bank World Bank (1990b) Zambia: Urban Household Energy Strategy. Report No. 121/90, Report of the joint UNDP/World Bank Energy Sector Management Assistance Programme World Bank (1990c) Indonesia: Urban Household Energy Strategy Study – Main Report, Report No. 107A/90,Washington DC.
World Bank (1990d) “Cap Vert: Strategies Energetiques dans le secteur Residentiel Enquetes
Consommateurs.Report of the Joint UNDP/World Bank Energy Sector Management Assistance Programme, October
142 IARC MONOGRAPHS VOLUME 95
World Bank (1991a) Haiti: Household Energy Strategy (ESMAP Report 143/91), Washington DC.
World Bank (1991b) Burkina Faso: Urban Household Energy Strategy, Report No. 134/91, Washington DC.
World Bank (1992) Republic of Mali: Household Energy Strategy,Washington DC. World Bank (1993) Lao PDR: Urban Energy Demand Assessment. Joint UNDP/ESMAP
Report 154/93, Washington DC. World Bank (1996a) China: Energy for Rural Development in China: An Assessment Based on
a Joint Chinese/ESMAP Study of Six Countries. Joint UNDP/ESMAP Report 183/96, Washington DC.
World Bank (1996b) Rural Energy and Development. Improving Energy Supplies for 2 Billion
People: Development in Practice Series. Washington DC. World Bank (1999) India: Household Energy Strategies for Urban India: The Case of
Hyderabad (Joint UNDP/ESMAP Report 214/99), Washington DC. World Bank (2002a) Energy Strategies for Rural India: Evidence from Six States (ESMAP
Report No. 258/02), Washington DC. World Bank (2002b) India, Household Energy, Indoor Air Pollution and Health
(UNDP/ESMAP Report), Washington DC. World Bank (2003) Household Energy Use in Developing Countries: A Multi-country Study
(ESMAP Report), Washington DC. World Bank (2004a) Clean Household Energy for India: Reducing the Risks to Health, Delhi. World Bank (2004b) The Impact of Energy on Women’s Lives in Rural India (Joint
UNDP/ESMAP Report), Washington DC. World Bank (2006) Rural Energy Strategy for Bangladesh, Washington DC. Wornat MJ, Ledesma EB, Sandrowitz AK et al. (2001). Polycyclic aromatic hydrocarbons
identified in soot extracts from domestic coal-burning stoves of Henan Province, China. Environ Sci Technol, 35:1943–1952 doi:10.1021/es001664b. PMID:11393972
Xian LY, Harris DB, Mumford JL et al. (1992). [Identification and personal exposure concentration of indoor air pollutants in Xuanwei.] Chin J Publ Health, 11:23–26.
Xu X, Wang L (1993). Association of indoor and outdoor particulate level with chronic respiratory illness. Am Rev Respir Dis, 148:1516–1522. PMID:8256893
Yadav B, Hessen JO, Schei M et al. (1996). Effects on indoor air pollution level from introducing improved stoves in rural Nepal. Proceedings of the 7th International
Conference on Indoor Air Quality and Climate, Nagoya, Japan, 2:11. Yan L (1990). [Epidemiological survey of endemic fluorosis in Xiou Shan and Bao Jing areas].
Zhonghua Liu Xing Bing Xue Za Zhi, 11:302–306. PMID:2261621 Yan R, Zhu HJ, Zheng CG, Xu MH (2002). Emissions of organic hazardous air pollutants during
Chinese coal combustion. Energy, 27:485–503 doi:10.1016/S0360-5442(02)00003-8. Yang RD, Jiang WZ, Wang CX (1988). [Characteristics of indoor air pollution in districts of high
lung adenocarcinoma incidence, Xuanwei.] J Environ Health, 5:16–18. Yunnan Province Health Station (1984). [Indoor Air Pollution Monitoring in High and Low
Lung-Cancer Incidence Regions in Xuanwei County.] Huanjing yu Jiankang Zazhi (Journal of Environment and Health), 1:14–15, 20.
Zhang J, Smith KR (1996). Hydrocarbon emissions and health risks from cookstoves in developing countries. J Expo Anal Environ Epidemiol, 6:147–161. PMID:8792294

HOUSEHOLD USE OF SOLID FUELS 143
Zhang J, Smith KR (1999). Emissions of carbonyl compounds from various cookstoves in China. Environ Sci Technol, 33:2311–2320 doi:10.1021/es9812406.
Zhang J, Smith KR, Ma Y et al. (2000). Greenhouse gases and other airborne pollutants from household stoves in China: A database for emission factors. Atmos Environ, 34:4537–4549 doi:10.1016/S1352-2310(99)00450-1.
Zhang SP (1988). [A study of indoor air pollution from cow dung among the Tibetan nationality in Gansu.] J Environ Health, 6:40–41.
Zhao B, Long L (1991). Analysis of the indoor air pollution situation in areas with fluorosis from coal smoke. Weisheng Yanjiu, 20:16–19.
Zuk M, Rojas L, Blanco S et al. (2007). The impact of improved wood-burning stoves on fine particulate matter concentrations in rural Mexican homes. J Expo Sci Environ Epidemiol, 17:224–232 doi:10.1038/sj.jes.7500499. PMID:16721411