household participation, resource dependency, and...
TRANSCRIPT
HOUSEHOLD PARTICIPATION, RESOURCE DEPENDENCY, AND DIVERSIFICATION: A LIVELIHOODS ASSESSMENT IN THE KANCHENJUNGA
CONSERVATION AREA, NEPAL
By
PETE PARKER
A DISSERTATION PRESENTED TO THE GRADUATE SCHOOL OF THE UNIVERSITY OF FLORIDA IN PARTIAL FULFILLMENT
OF THE REQUIREMENTS FOR THE DEGREE OF DOCTOR OF PHILOSOPHY
UNIVERSITY OF FLORIDA
2009
1

© 2009 Pete Parker
2

To my father for providing the needed inspiration
3

ACKNOWLEDGMENTS
This dissertation would not have been possible without the assistance and
encouragement of several people. I thank my parents for their encouragement. I
gratefully acknowledge my advisor, Brijesh Thapa, for being both a friend and a mentor
(and for knowing which role was needed at the appropriate time throughout the
process). The other members of my committee also have my sincere thanks for all their
input and assistance: Dr. Stephen Holland, Dr. Taylor V. Stein, and Dr. Madan Oli.
I would also like to thank the department of Tourism, Recreation & Sport
Management the for the graduate assistantship that allowed me to complete my
program. Within my department, I would also like to thank Nancy Gullic for her
friendship and administrative support.
My time spent in Nepal would not have been as fruitful nor as enjoyable without
the assistance of several individuals. Specifically, I extend my gratitude to Megh
Bahadur Pandey for his assistance at the Department of National Parks and Wildlife
Conservation, Praveen Bisht for his logistical support, and Dan Putnam for providing a
home away from home.
My friends also deserve my sincerest appreciation for their encouragement. In
particular, I would like to thank Caroline, Lyle, Amy, John, Dave, and Phil. I would also
like to thank the Top for providing the venue for several organizational meetings, both
scheduled and impromptu.
4
TABLE OF CONTENTS
page
ACKNOWLEDGMENTS.................................................................................................. 4
LIST OF TABLES............................................................................................................ 8
LIST OF FIGURES.......................................................................................................... 9
LIST OF ABBREVIATIONS........................................................................................... 10
ABSTRACT ................................................................................................................... 11
CHAPTER
1 INTRODUCTION .................................................................................................... 13
Defining the Problem .............................................................................................. 13 Sustainable Livelihoods Framework ....................................................................... 18 Statement of Problem ............................................................................................. 23 Purpose of Study .................................................................................................... 26 Project Significance ................................................................................................ 27 Dissertation Format ................................................................................................ 29
2 PARTICIPATION ROLES AND BENEFITS IN SPONSORED PROGRAMS AMONG HOUSEHOLDS WITHIN KANCHENJUNGA CONSERVATION AREA, NEPAL.................................................................................................................... 39
Introduction ............................................................................................................. 39 Literature Review.................................................................................................... 41
Decentralized Conservation Participation......................................................... 41 Decentralized Conservation Costs and Benefits .............................................. 43
Kanchenjunga Conservation Area Project, Nepal................................................... 45 Programs and Management ............................................................................. 46 Conservation Issues......................................................................................... 48 Study Site ......................................................................................................... 49
Methods .................................................................................................................. 50 Data Collection ................................................................................................. 51 Selection of Participants ................................................................................... 52 Instrumentation................................................................................................. 53 Operationalization and Data Analysis............................................................... 54
Research question 1: What factors affect household participation roles in sponsored programs? ......................................................................... 54
Research question 2: Do participation roles in sponsored programs impact the distribution of benefits among households? .......................... 56
Results.................................................................................................................... 56 Profile of Household Respondents ................................................................... 56
5

Research Question 1: Household Participation Roles in Sponsored Programs....................................................................................................... 60
Research Question 2: Household Participation Roles and Distribution of Benefits ......................................................................................................... 62
Discussion .............................................................................................................. 64
3 USE PATTERNS AND FACTORS AFFECTING HOUSEHOLD NATURAL RESOURCE DEPENDENCY WITHIN KANCHENJUNGA CONSERVATION AREA, NEPAL ........................................................................................................ 69
Introduction ............................................................................................................. 69 Literature Review.................................................................................................... 71 Kanchenjunga Conservation Area Project .............................................................. 75 Methods .................................................................................................................. 80
Data Collection ................................................................................................. 80 Selection of Participants ................................................................................... 81 Instrumentation................................................................................................. 82 Operationalization and Data Analysis............................................................... 82
Research question 1: What are the existing levels of natural resource dependencies among households? ........................................................ 83
Research question 2: What factors affect natural resource dependencies among households? ........................................................ 83
Results.................................................................................................................... 84 Profile of Household Respondents ................................................................... 84 Research Question 1: Levels of Natural Resources Dependency................... 85 Research Question 2: Factors Associated With Natural Resources
Dependency .................................................................................................. 86 Discussion .............................................................................................................. 87 Conclusion .............................................................................................................. 90
4 LIVELIHOOD STRATEGIES AND DIVERSIFICATION FACTORS AMONG HOUSEHOLDS WITHIN KANCHENJUNGA CONSERVATION AREA, NEPAL .... 92
Introduction ............................................................................................................. 92 Literature Review.................................................................................................... 95
Sustainable Livelihoods Framework................................................................. 95 Factors that Affect Livelihood Diversification .................................................... 99
Kanchenjunga Conservation Area Project ............................................................ 102 Enhancing Local Livelihoods .......................................................................... 104 Livelihood Challenges .................................................................................... 105
Methods ................................................................................................................ 107 Data Collection ............................................................................................... 107 Selection of Participants ................................................................................. 108 Instrumentation............................................................................................... 109 Operationalization and Data Analysis............................................................. 109
Research question 1: What is the household level of livelihood strategy diversification? ...................................................................................... 109
6
Research question 2: What are the factors associated with dominant livelihood strategy adoption? ................................................................ 111
Results.................................................................................................................. 111 Profile of Respondents ................................................................................... 111 Research Question 1: Diversification of Livelihood Strategies ...................... 113 Research Question 2: Factors Associated With Dominant Livelihood
Strategy Adoption........................................................................................ 117 Discussion ............................................................................................................ 120
5 CONCLUSION...................................................................................................... 125
Participation Roles................................................................................................ 125 Natural Resources Dependency ........................................................................... 127 Livelihood Diversification ...................................................................................... 128 Recommendations to Enhance KCAP Management ............................................ 130 Research Limitations ............................................................................................ 131 Future Research ................................................................................................... 132
APPENDIX
A HOUSEHOLD SURVEY QUESTIONAIRRE......................................................... 134
B HOUSEHOLD SURVEY QUESTIONAIRRE (Translated into Nepali)................... 141
C INSTITUTIONAL REVIEW BOARD APPROVAL.................................................. 148
LIST OF REFERENCES ............................................................................................. 149
BIOGRAPHICAL SKETCH.......................................................................................... 157
7
LIST OF TABLES
Table page 2-1 Operationalization of variables ........................................................................... 55
2-2 Profile of respondents......................................................................................... 57
2-3 Cross-tabulation of age by years of education.................................................... 58
2-4 Descriptive statistics for participation role analysis variables ............................. 59
2-5 Households participation roles in sponsored programs ...................................... 61
2-6 Chi-squared percentage of participation roles and benefits received ................. 62
2-7 Perceived household community benefits from KCAP ....................................... 63
2-8 Parameter estimates for benefits received based on participation role .............. 64
3-1 Household characteristics .................................................................................. 84
3-2 Sources of household income and dependency on natural resources access ... 86
3-3 Logistic regression of household natural resources dependency ....................... 86
4-1 Livelihood activities by elevation....................................................................... 113
4-2 Cluster analysis of activities within each livelihood strategy ............................. 115
4-3 Factors of livelihood strategy adoption ............................................................. 119
8
LIST OF FIGURES
Figure page 1-1 Sustainable livelihoods framework ..................................................................... 21
1-2 Conceptual model............................................................................................... 27
1-3 Village of Taplechok ........................................................................................... 31
1-4 Village of Olanchan Gola.................................................................................... 31
1-5 Conceptual model............................................................................................... 32
1-6 Conceptual model............................................................................................... 32
1-7 Prayer wheels in Olanchan Gola ........................................................................ 33
1-8 Yak train in Olanchan Gola................................................................................. 33
1-9 Lelep Village....................................................................................................... 34
1-10 Typical house in Lelep Village ............................................................................ 34
1-11 KCAP headquarters office in Lelep Village......................................................... 35
1-12 Village of Phere .................................................................................................. 35
1-13 Village of Ghunsa ............................................................................................... 36
1-14 Tent camp in Ghunsa Village.............................................................................. 36
1-15 Typical Ghunsa Village kitchen........................................................................... 37
1-16 Close-up of cooking area.................................................................................... 37
1-17 Local resident ..................................................................................................... 38
2-1 Map of KCAP...................................................................................................... 50
3-1 Map of KCAP...................................................................................................... 77
4-1 Sustainable livelihoods framework ..................................................................... 97
4-2 Map of KCAP.................................................................................................... 103
9
LIST OF ABBREVIATIONS
ACAP Annapurna Conservation Area Project
CAMC Conservation Area Management Committees
CAMR Conservation Area Management Regulation
CBC Community-Based Conservation
CBD Convention on Biological Diversity
CBNRM Community Based Natural Resources Management
DFID United Kingdom Department for International Development
DNPWC Department of National Parks and Wildlife Conservation
FAO Food and Agriculture Organization
HDI Human Development Index
ICDP Integrated Conservation and Development Project
ICIMOD Integrated Centre for Integrated Mountain Development
KCAP Kanchenjunga Conservation Area Project
MBCAP Makulu-Barun Conservation Area Project
NTFP Non-timber forest products
PRA Participatory rural appraisal
UNDP United Nations Development Program
USAID United States Agency for International Development
VDC Village Development Committee
WHO World Health Organization
WWF World Wildlife Fund for Nature
10
Abstract of Dissertation Presented to the Graduate School of the University of Florida in Partial Fulfillment of the Requirements for the Degree of Doctor of Philosophy
HOUSEHOLD PARTICIPATION, RESOURCE DEPENDENCY, AND
DIVERSIFICATION: A LIVELIHOODS ASSESSMENT IN THE KANCHENJUNGA CONSERVATION AREA, NEPAL
By
Pete Parker
December 2009
Chair: Brijesh Thapa Major: Health and Human Performance
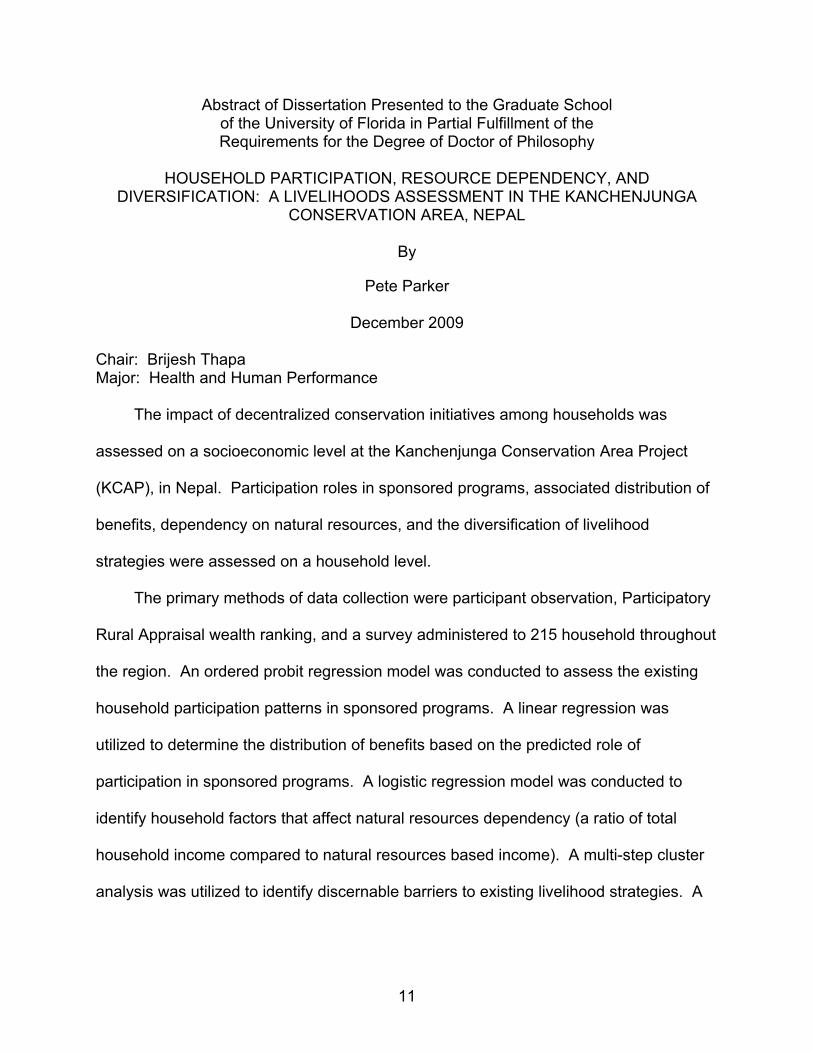
The impact of decentralized conservation initiatives among households was
assessed on a socioeconomic level at the Kanchenjunga Conservation Area Project
(KCAP), in Nepal. Participation roles in sponsored programs, associated distribution of
benefits, dependency on natural resources, and the diversification of livelihood
strategies were assessed on a household level.
The primary methods of data collection were participant observation, Participatory
Rural Appraisal wealth ranking, and a survey administered to 215 household throughout
the region. An ordered probit regression model was conducted to assess the existing
household participation patterns in sponsored programs. A linear regression was
utilized to determine the distribution of benefits based on the predicted role of
participation in sponsored programs. A logistic regression model was conducted to
identify household factors that affect natural resources dependency (a ratio of total
household income compared to natural resources based income). A multi-step cluster
analysis was utilized to identify discernable barriers to existing livelihood strategies. A
11

12
multinomial logistic regression model was then applied to examine the existing correlate
of access or barriers to graduate to more effective livelihood strategies.
Factors that were significantly related to household participation roles in
sponsored programs included the education and age of household head, education of
household adults, size of household, household distance to KCAP office, household
visitation to KCAP offices, and household visitation by KCAP staff. Greater roles of
participation in sponsored programs were significantly related to increased access to
benefits including financial credit, lower interest rates, and training programs.
Natural resources dependent activities made up 64% of the average household’s
total income. Higher elevation households were more dependent than lower elevation
households. Significant predictors of dependency on natural resources included
remittances, household size, and the number of dependents.
Ten of the most prevalent livelihood activities found throughout the region were
identified and analyzed. Five discernable livelihood strategies were identified with
varying levels of remuneration. Significant predictors of specific livelihood strategies
included landholdings, dependents, livestock, remittance, ethnicity, and participation
roles in sponsored programs.
The results of these analyses were used to suggest community management
strategies to encourage and promote maximum participation by the communities to
enhance their sustainable livelihood strategies.
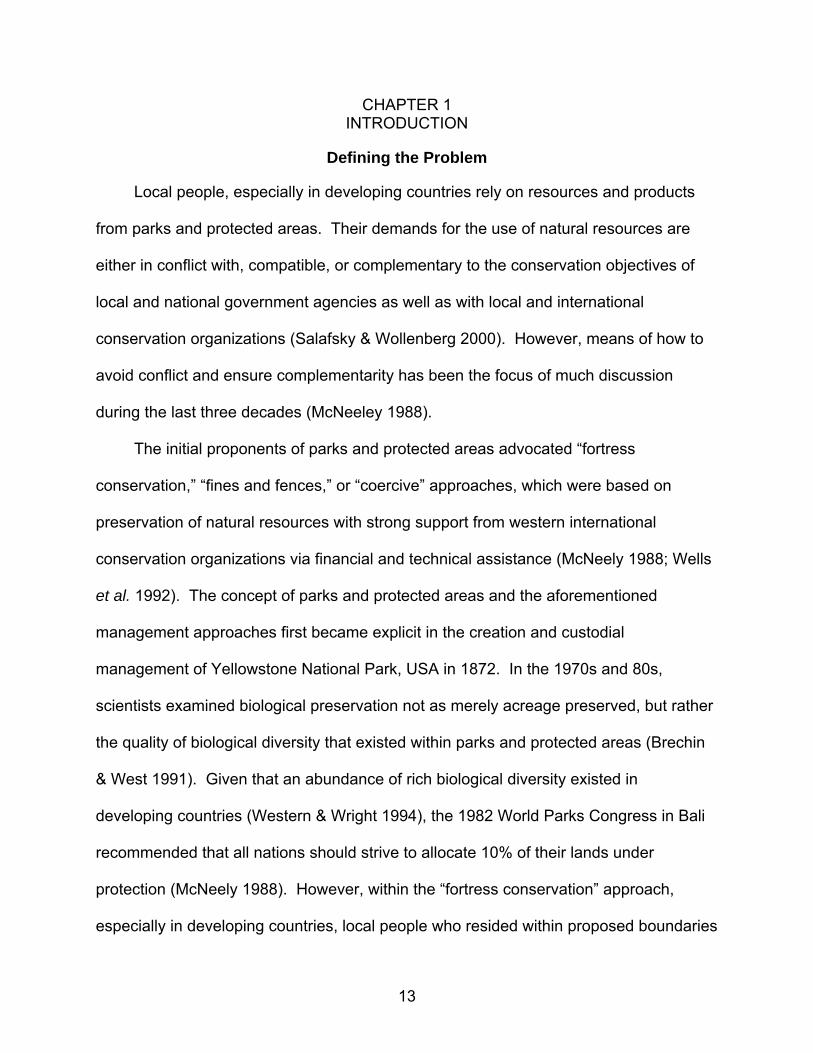
CHAPTER 1 INTRODUCTION
Defining the Problem
Local people, especially in developing countries rely on resources and products
from parks and protected areas. Their demands for the use of natural resources are
either in conflict with, compatible, or complementary to the conservation objectives of
local and national government agencies as well as with local and international
conservation organizations (Salafsky & Wollenberg 2000). However, means of how to
avoid conflict and ensure complementarity has been the focus of much discussion
during the last three decades (McNeeley 1988).
The initial proponents of parks and protected areas advocated “fortress
conservation,” “fines and fences,” or “coercive” approaches, which were based on
preservation of natural resources with strong support from western international
conservation organizations via financial and technical assistance (McNeely 1988; Wells
et al. 1992). The concept of parks and protected areas and the aforementioned
management approaches first became explicit in the creation and custodial
management of Yellowstone National Park, USA in 1872. In the 1970s and 80s,
scientists examined biological preservation not as merely acreage preserved, but rather
the quality of biological diversity that existed within parks and protected areas (Brechin
& West 1991). Given that an abundance of rich biological diversity existed in
developing countries (Western & Wright 1994), the 1982 World Parks Congress in Bali
recommended that all nations should strive to allocate 10% of their lands under
protection (McNeely 1988). However, within the “fortress conservation” approach,
especially in developing countries, local people who resided within proposed boundaries
13

were relocated with little or no compensation (Western & Wright 1994). Those people
who lived outside protected areas were denied access to those natural resources
located within the park boundaries. In most cases, their livelihoods depended on the
natural resources (Manning 1994), and local residents participated in behaviors that
undermined the whole conservation initiative (Brechin & West 1991).
In the 1990s, it was acknowledged that successful parks and protected area
management depended on integration and participatory conservation by the local
population (Brandon & Wells 1992). In 1992, delegates from 179 countries signed the
landmark United Nations Convention on Biological Diversity (CBD) which pledged to
create a system of protected areas based on three primary objectives: 1) conservation
of biological diversity, 2) sustainable use of the components of biological diversity, and
3) fair and equitable sharing of the benefits arising out of the utilization of genetic
resources (CBD 1992). Therefore, parks and protected areas are now charged with
missions beyond biodiversity conservation; they must also improve social welfare, guard
local security, and provide economic benefits across multiple sectors, objectives
traditionally relegated to the development sector (Naughton-Treves et al. 2005).
Based on the aforementioned objectives, the “Integrated Conservation and
Development Project” (ICDP) framework has been promoted in developing countries as
a means of maximizing benefits for local people while minimizing the costs endured due
to biodiversity conservation measures (Brandon & Wells 1992, p. 557). Since its
advocacy, ICDPs have proliferated throughout developing countries and have garnered
major support for conservation (McShane & Wells 2004). ICDPs are based upon the
idea that if programs improve the livelihoods of local people, then they would consume
14

fewer natural resources, and thus minimize pressures within protected areas (Brandon
& Wells 1992; Brandon et al. 1998). Additionally, ICDPs are based on the paradigm
that projects need to be centered on providing for the locals and positively respond to
changes in their livelihoods (Berkes et al. 2007). The inclusion of local participation in
ICDP management and decision making helps to ensure an equitable distribution of
benefits that compensate for costs borne through environmental conservation practices
(Brandon 1997). By devolving management to the local people, it saves time and
money from the central governing body and provides immediate benefits and
empowerment to the local people while utilizing existing traditional knowledge (Ribot
1995).
ICDP terminology has been used interchangeably in the literature along with
Community Based Natural Resources Management (CBNRM), and Community-Based
Conservation (CBC). However the focus of ICDPs is primarily relegated to parks and
protected areas (Naughton-Treves et al. 2005), while CBC and CBNRM operate within
a community level at a smaller scale (Horwich & Lyon 2007). Although, all three
concepts share the same major components of conservation through maximized local
participation, and management via decentralization of institutional power (Murphee
1994; Agrawal & Gibson 1999; Salafsky & Wollenberg 2000; Stem et al. 2003; Child
2004; Berkes 2007). In order to protect the environment and provide for an improved
and sustained quality of life for local people, programs need to be based on local
initiatives, with training assistance provided by non-government organizations (NGO’s),
in accordance with local public institutions (Ribot 1998).
15

However, results from existing ICDPs have shown varied results and have led to a
debate arguing both for and against them (Wells et al. 1992; Brandon 1997; Oates
1999; McShane & Wells 2004). Naughton-Treves et al. (2005, p. 240) note that most
ICDP failures reported in the literature are primarily caused by the erroneous labeling of
any conservation project that incorporates local people as an ICDP, the terminology has
“become all things to all people.”
A fundamental flaw with ICDPs relates to the creation and formation of the project
plan (Berkes et al. 2007). Most ICDPs are created by western-based international
organizations with large amounts of funding and little site-specific knowledge of culture
and institutions (Oates 1999; McShane & Wells 2004). Neuman (1997) states that
ICDPs do not invite true participation, but rather serve as coercive forms of conservation
that resemble “ill fated colonial efforts to convert shifting cultivators into progressive
farmers” (p. 564). Although ICDPs are designed to ensure an equitable distribution of
benefits from conservation measures, evidence suggests that this rarely occurs,
especially among the most disadvantaged of households (Berkes et al. 2007). It is not
enough for project designers to simply assume that community leaders will assure that
benefits accrue equally to all individuals. McShane & Wells (2004) state that one of the
main shortcomings of ICDPs is the lack of trade-offs between the interests and claims of
multiple stakeholders. Accountability is improved if whole communities, including
disadvantaged members such as women and minorities are involved in decision-making
processes. Success of ICDPs is heavily correlated to existing levels and roles of
participation (Strusaker et al. 2005), and there needs to be a complete devolution of
16

authority to local communities over biological resources so that they have a vested
interest (Neuman 1997; Ribot 2003).
Critics of ICDPs argue against the existence of an economic threshold that if met
will lead residents to cease use of natural resources extraction (Stem et al. 2003). For
example, if $1000 dollars is deemed minimal to survival without natural resources
extraction, proponents of ICDPs denote that residents will stop extracting and/or
committing illegal activities, once they receive $1000 dollars worth of alternatively
generated funds. Conversely, those in opposition indicate that residents will still
continue to consume and generally want to maximize consumption, at least until
complete absorption of labor into new activities (Brandon 1997).
Another argument against ICDPs occurs in the debate between social scientists
and natural scientists with respect to the primary objectives of an ICDP (Brechin et al.
2002). Natural scientists emphasize a conservation dominated focus while social
scientists advocate for community development related initiatives. Conservation and
development are ultimately incongruent goals (Oates 1999), as ICDPs have
demonstrated to be problematic when equal emphases are implemented in practice
(Wells et al. 2004; Berkes et al. 2007). However, local perspectives need to be
recognized, as user groups within ICDPs are not necessarily homogenous with respect
to conservation or development. For example, Baral et al. (2008) found that the longer
established user groups (>9 years) within an ICDP (Annapurna Conservation Area
Project) were focused on conservation; medium length established user groups (5-9
years) emphasized institutional capacity building while more recently established
usergroups (<5 years) were focused on economic development.
17

Conservation programs “are only valid and sustainable when they have the dual
objective of protecting and improving local livelihoods and ecological conditions”
(Ghimire & Pimbert 1997, p. 8). Creation of valid and sustainable conservation
programs depends on decentralized management and the incorporation of local
participation. This will ensure an equitable distribution of benefits while simultaneously
diversifying income generating activities thus, reducing dependency on natural
resources (Chapin 2004; McShane & Wells 2004). Within an assessment of ICDPs
worldwide, the UK Department for International Development (2007) identified three
major shortcomings: 1) local development is usually assessed in terms of generation of
cash, increased production or jobs, while wider social issues and livelihoods concerns
are often ignored, 2) project assessments usually focus on the numeration of outputs
achieved and often create unintended consequences for people’s livelihoods, and 3)
assessments usually focus on generation of local incomes instead of the promotion of
commercial viability. Given these issues, the use of the sustainable livelihoods
framework for project assessments in order to overcome these major shortcomings has
been advocated (DFID 2007).
Sustainable Livelihoods Framework
The primary objective of ICDPs is to provide for diversified sustainable livelihood
strategies while emphasizing sustainable development that ensures biological
conservation (Scoones 1998). In 1987, the World Commission on Environment and
Development first advanced the term “sustainable livelihoods” in relation to alleviation of
poverty and protection of the environment through the promotion of participation and
sustainable development (WCED 1987). Subsequently, the 1992 UN Conference on
Environment and Development promoted sustainable livelihoods as a means of linking
18

socioeconomic and environmental concerns. These two international forums were
critical to the formation of the sustainable livelihoods framework (Scoones 1998).
The sustainable livelihoods framework has been championed in the community
development and environmental management disciplines, including ICDPs, with the
shift in paradigm toward a more people-centered approach within a community (Ashley
& Carney 1999). It emphasizes that communities have existing assets that should be
promoted rather than the focus on community needs. The sustainable livelihoods
framework has been heavily utilized to assess regions and projects with the emphasis
on people living within a given place or situation (Chambers & Conway 1992; Scoones
1998; Ashley & Carney 1999; Carney et al. 1999; Ellis 2000; DFID 2007). The
sustainable livelihoods framework is currently used by international development
agencies such as, the United Nations Development Program (UNDP), the Food and
Agriculture Organization (FAO), the United States Agency for International Development
(USAID), CARE-International, Oxfam, and the United Kingdoms Department for
International Development (DFID) (Frankenberger et al. 2000).
Chambers & Conway (1992: p. 7) first defined a livelihood as “comprised of the
capabilities, assets (stores, resources, claims and access) and activities required for a
means of living. A livelihood is sustainable when it can cope with and recover from
stresses and shocks and maintain or enhance its capabilities and assets both now and
in the future, while not undermining the natural resource base.” Ellis (2000) adapted
this definition with more emphasis on access in relation to social institutions that might
impact an individual from capacity to fulfill its consumption requirements based on social
inequalities such as, caste, race, gender, ethnicity, beliefs, etc. His definition is “a
19

livelihood comprises assets (natural, physical, human, financial and social capital),
activities, and access to assets (mediated by institutions and social relations) that
collectively determine the living gained by an individual or household” (p. 10).
The sustainable livelihoods framework deviates from purely economic
measurements such as primary income, gross domestic product, and consumption
metrics in poor regions, and levies emphasis on breaking accessibility barriers to
improve the quality of life via institutions, policies, and processes (Scoones 1998).
However, Ellis (2000) delineates the importance of a lack of emphasis on temporal
changes in access to assets. Individuals are continually changing their livelihood
strategies concurrently with the social institutions that govern access, especially in
developing countries (Ellis 2000).
The sustainable livelihoods framework essentially has four main components
(Figure 1-1). First a population lives within a vulnerability context in which they are
exposed to risk in the forms of sudden shock, trends over time, and seasonal change.
Examples of risk include drought, tourism seasonality, or labor migration. Second,
people utilize assets to meet their livelihoods. These assets include social (networks,
norms, trust, institutions), human (skills, knowledge, and labor), natural (natural
resources), physical (infrastructure including transportation, water, and energy), and
financial capital (savings, income, and credit). Third, these assets are utilized by
residents through livelihood strategies in order to create their livelihood outcomes.
Lastly, transforming structures and processes shape and influence the ability of
individuals to access livelihood assets as a means to overcome risks within the
vulnerability context. It is within these transforming structures that programs can impact
20

the linkage between policies, institutions, and livelihood activities (DFID 2007). Figure
1-1 depicts the accessibility of resources, controlled by institutions and norms that are
used within livelihood strategies to create an outcome that enhances pre-existing assets
to overcome vulnerability to risks and shocks.
Figure 1-1. Sustainable livelihoods framework (Source: DFID 2007)
The emphasis on diversification of livelihood strategies within the sustainable
livelihood framework has been the catalyst for numerous international development
agencies to utilize the framework (Brocklesby & Fisher 2003). It promotes the creation
of livelihood enhancement beyond just employment. Projects that have used the
framework have realized that one source of income is not sufficient to truly aid in
poverty alleviation and environmental management in developing regions (Ashley &
Carney 1999). For example, tourism promotion as a pro-poor strategy in developing
regions has been unsuccessful due to the primary emphasis levied on one single
strategy (Tao & Wall 2009). Tourism seldom occurs in isolation as it competes for the
21

use of scarce resources; therefore, tourism development projects need to be initiated as
a complement to existing activities (Ashley 2000). A comprehensive understanding of
the link between tourism and other sectors requires an analysis of the whole context in
which tourism exists (Tao & Wall 2009). Based on the first study of the relationship
between tourism and the sustainable livelihoods framework, Tao & Wall (2009) state
that a sustainable livelihoods approach is more practical, especially in common
situations in which communities and individuals sustain themselves by multiple activities
rather than discrete jobs. Tourism is not a panacea for all problems faced in developing
countries, and is not a reliable source of income in many marginal economies, but it
may supplement incomes derived in other ways and help disperse vulnerabilities to risk
(Tao & Wall 2009). Therefore, advocates of sustainable development should “explore
how tourism might fit into a suite of livelihood strategies, contributing to the achievement
of sustainable livelihood outcomes” (Tao & Wall 2009, p. 8).
From a sustainable community development perspective, the sustainable
livelihoods approach analyzes a community’s assets, beyond needs and determines
ways to promote the means to meet those needs while simultaneously increasing their
capacity to combat shocks and threats (Carney et al. 1998; Scoones 1998; Ellis 2000).
Projects that utilize the sustainable livelihoods framework also emphasize resident
empowerment and capacity building to effectively enhance access to available
resources that allows them to choose livelihood strategies to negotiate vulnerabilities,
and incrementally improve their livelihood assets (Ellis 2000). If an individual retains a
useful skill, it should lead to empowerment and thus may lead to further levels and roles
of participation (Agrawal & Gupta 2004).
22

According to local, regional, and national level institutions and norms, access to
necessary livelihood assets is often available disproportionately (Ellis 2000; Agrawal
2001; Blaikie, & Springate-Baginski, 2003). Associated access is often correlated to the
role of participation in project planning, management, and capacity building programs
which is based on preexisting power structures that is linked to socio-economic
characteristics (Rew & Rew 2003; Agrawal & Gupta 2004). Poorer households are
usually more dependent on natural resources for their livelihoods but have less access
to them (Adhikari et al. 2004). Without access to resources, poorer households are
more likely to have less diversified livelihood strategies, and thus are more dependent
on natural resources in protected areas (Barret et al. 2001; Bhandari & Grant 2007).
Households are better suited to cope with vulnerability to shocks such as drought and
seasonality in markets through a more diverse livelihood strategy (Ellis 2000).
However, disadvantaged households more often bear an unequal share of the costs
associated with conservation. Furthermore, high levels of resource dependency and
the lack of participation roles in community management limits them from opportunities
to either enhance their livelihood strategies or to graduate to higher order strategies
(Scoones 1999; Ellis 2000). Given that disadvantaged households are held to mere
subservient roles in decision making and only allowed minimal access, if at all, to
regional social, physical, financial, and environmental assets; the ability to achieve a
diverse livelihood strategy is severely impacted (Agrawal 2001; Agrawal & Gupta 2005).
Statement of Problem
Nepal is considered a leader among least developed nations with respect to
environmental policy and conservation programs. Nepal has designated over 18% of
the country as protected (26,695 km2) in 17 different protected areas. More importantly,
23

Nepal has been a pioneer in decentralized conservation programs in parks and
protected area management. Such programs highlight the link between conservation
and socio-economic development among residents within protected areas. In 1986, the
Annapurna Conservation Area Project (ACAP) became the first Integrated Conservation
and Development Project (ICDP) implemented by a local non-government organization
in collaboration with the World Wildlife Fund for Nature (WWF). The concept behind the
project was economically self-sustainable conservation with development that
emphasized popular local participation via a decentralized form of conservation
management (Sherpa et al.1986). ACAP has been utilized as a successful case study
within the discourse of ICDPs because it has provided increased development,
improved distribution of benefits, empowered local residents, and enhanced biological
conservation (Nyaupane et al. 2006). However, equal distribution of benefits and
influence has been illusive in ACAP (Nyaupane & Thapa 2004; Bajracharya et al. 2005;
2006). Disadvantaged community members, including the poor, lower caste, and
females are excluded from decision-making roles within conservation management and
community development issues (Baral et al. 2008). Participatory exclusion has led to
an inequitable distribution of benefits, greater burden of conservation related costs, and
higher levels of dependency on natural resources (Bajracharya et al. 2006).
Furthermore, the regulatory and financial structure is still largely top-down as the
ultimate authority still remains with the Department of National Parks and Wildlife
Conservation (DNPWC) (Heinen & Mehta 1999).
The most recently created conservation area in Nepal is the Kanchenjunga
Conservation Area Project (KCAP) that was established in 1997. The government
24

officially handed the management authority to the local population on September 22,
2006, although WWF still provides technical and financial assistance. It is the first
protected area solely managed via local authority in Nepal, and possibly Asia (WWF
2006). Nepal’s DNPWC and WWF jointly managed KCAP for the previous ten years of
existence. During the past 10 years, enormous positive strides have been achieved
with respect to the management of KCAP. KCAP functions as an ICDP with major
international donors including the World Wide Fund for Nature, the MacArthur
Foundation, the Kadoorie Agricultural Aid Association, and the Darwin Initiative. KCAP,
named after the third highest mountain in the world (Mt. Kanchenjunga, 28,169 ft), is a
sparsely populated region comprised primarily of poor ethnic minorities who are heavily
dependent on the natural resources for their subsistence. Primary livelihood activities
include agriculture, livestock, non-timber forest products, and tourism (Muller-Boker &
Kollmair 2000). WWF has utilized the sustainable livelihoods framework in their
management and evaluation of project objectives (WWF 2006). Successful
management of KCAP is not only a priority for Nepal, but also for the international
conservation community. KCAP is a vital component for the eventual creation of an
international Kanchenjunga mountain complex conservation area that includes the
Khangchendzonga Biospere Reserve in Sikkim, India and the Qomolangma Nature
Preserve in Tibet, China.
In KCAP, a hierarchy of management has been instituted which advocates for
equitable access to decision-making roles and benefits distribution for all residents.
There has been several capacity building initiatives formulated while numerous
community development projects have been successfully implemented (WWF 2006).
25

However, major conflicting issues especially among local residents are still evident.
Residents have complained about spatial disparities, in that higher elevation villages
receive less access to community development programs and capacity building
initiatives despite residing in less productive lands (Muller-Boker & Kollmair 2000; Ikeda
2005). Without alternatives, these villages continue to practice slash and burn
agriculture, overgraze pastures, and over harvest non-timber forest products (WWF
2006). Equitable distribution of benefits has also been identified as being disparate
along socio-demographic lines, and possibly highly correlated with levels and roles of
participation in community development and decision-making in management (Muller-
Boker & Kollmair 2000; WWF 2006). The unequal distribution of benefits has been
especially taxing for poorer households who are now inter-dependent on access to
community natural resources (WWF 2006). Therefore, programs need to be able to
identify and target those households most reliant on resources access and extraction
activities, and subsequently, provide a means for creating sustainable livelihood
strategies that will allow them the opportunity to overcome and persist while pressures
on the natural resources are alleviated (Ellis 2000).
Purpose of Study
The purpose of this study was to examine the role of participation in sponsored
programs1, levels of natural resources dependency, and the existing levels of livelihood
strategy diversification among households in the Kanchenjunga Conservation Area
Project. Specifically, the following three major research questions were examined
(Figure 1-2):
1 Sponsored programs include community based user groups that provide households with financial or technical assistance in decision-making, both individual and communal.
26

1. What factors affect participation roles in sponsored programs by households within KCAP? Do participation roles in sponsored programs impact the distribution of benefits among households?
2. What are the levels of natural resources dependency for households within KCAP? What factors affect a household’s level of natural resources dependency?
3. What is the household level of livelihood strategy diversification within KCAP? What are the factors associated with dominant livelihood strategy adoption?
Figure 1-2. Conceptual model
Project Significance
This study examined the factors that affect household roles of participation in
sponsored programs, the associated distribution of benefits based on participation roles,
the factors that affect household levels of natural resources dependency, and the
potential factors or barriers associated with household adoption of more diversified and
PPaarrttiicciippaattiioonn RRoolleess
DDiivveerrssiittyy ooff LLiivveelliihhoooodd SSttrraatteeggiieess
NNaattuurraall RReessoouurrccee
DDeeppeennddeennccyy
IInnccoommee,, EEdduuccaattiioonn,, CCaassttee//EEtthhnniicciittyy,, HHoouusseehhoolldd SSiizzee,, DDiissttaannccee ttoo PPrrooggrraamm OOffffiicceess,, LLaannddhhoollddiinnggss,, aanndd LLiivveessttoocckk
Research Question 2
Research Question 3
Research Question 1
27

remunerative livelihood strategies in the Kanchenjunga Conservation Area Project. This
research was conducted in a mountainous protected area within a completely
decentralized community based management structure in Nepal, if not Asia (WWF
2006). This research is important for program designers and evaluators in both KCAP
and beyond as it contributes to the discourse for a need of a robust quantitative method
to operationalize diversified livelihood strategies.
Results of this study demonstrate the importance of targeting and empowering
disadvantaged households within decentralized conservation programs. Education
programs that emphasize community participation are better able to reach these
disadvantaged households and provide for a more equitable distribution of benefits.
Findings also aid conservation management by providing a methodology that enhances
project abilities to identify households who lack access to the assets necessary to
graduate to an improved livelihood strategy. Since these households are most heavily
dependent on natural resources, and therefore are most susceptible to management
actions or policy changes. Findings also aid policy makers by enhancing their ability to
identify environmental pressures that are most contingent on further policy applications,
while simultaneously illuminating those strategies that are most critical to the
communities’ livelihood. This research incorporated previous findings of WWF and
intends to further enhance WWF’s and other (I)NGO’s ability to balance the needs of
both nature preservation and community development. The framework utilized in this
research has been used by USAID, Oxfam, DFID, UNEP, and Care International.
This research also further enhances the field implementation of conservation and
development programs in the Kanchenjunga Conservation Area. Research results will
28

be shared with local community based decision makers, WWF staff, and the
Department of National Parks and Wildlife Conservation. Recommendations based on
this research will augment their abilities to design management strategies that alleviate
detrimental environmental pressures while concurrently promoting more sustainable
community development via capacity building programs. Figures 1-3 through 1-17 are
provided for visual contextualization.
Dissertation Format
The dissertation is segmented into five chapters via three thematic areas based
on each research question. The three research questions build upon each other with
assessments of household participation roles in sponsored activities, household
resource dependency, and household levels of livelihood diversification.
Chapter 2 addressed household role of participation in sponsored activities within
KCAP. More specifically, socio-cultural factors were identified that influenced
decentralized conservation participation and determined if participation roles affected
the distribution of benefits. The factors that affect participation roles were analyzed
using an ordered probit to assess the influence of these factors on participation roles
from members, discussion leaders, suggestion makers, and decision-makers. A two
stage linear model was utilized to determine benefits received from participation based
on their role of participation. Results determined if those who were more heavily
involved in decision-making processes within the decentralized conservation framework
accrued more benefits than costs.
Chapter 3 addressed natural resource use patterns of the local communities within
KCAP. Natural resources dependency was estimated and converted to a binary scale
which divided the population into high and low dependency households. A logistic
29

regression assessed the affect varying economic, social, and access variables had on
high or low dependency by the households in the community.
Chapter 4 utilized cluster analysis to identify discernable differences between
existing livelihood strategies, and employed a multinomial logistic regression to identify
existing correlates of access to graduate to more effective livelihood strategies. Results
indicated how a household distributes its access to available capital to activities chosen
livelihood strategies.
Chapter 5 provided an overall summary of how the research questions utilized
within chapters 2, 3, and 4 build upon each other and resultant utility provided. This
chapter presented summaries of how participation in decentralized conservation
strategies in a mountainous protected area in Nepal have impacted household
dependencies on natural resources and the associated effect on the household level of
livelihood strategy diversification.
30

Figure 1-3. Village of Taplechok (Source: Author 2008)
Figure 1-4. Village of Olanchan Gola (Source: Author 2008)
31

Figure 1-5. Mountainside (Source: Author 2008)
Figure 1-6. Typical valley floor (Source: Author 2008)
32

Figure 1-7. Prayer wheels in Olanchan Gola (Source: Author 2008)
Figure 1-8. Yak train in Olanchan Gola (Source: Author 2008)
33

Figure 1-9. Lelep village (Source: Author 2008)
Figure 1-10. Typical house in Lelep village (Source: Author 2008)
34

Figure 1-11. KCAP headquarters office in Lelep village (Source: Author 2008)
Figure 1-12. Village of Phele (Source: Author 2008)
35

Figure 1-13. Village of Ghunsa (Source: Author 2008)
Figure 1-14. Tent camp in Ghunsa village (Source: Author 2008)
36

Figure 1-15. Typical Ghunsa village kitchen (Source: Author 2008)
Figure 1-16. Close-up of cooking area (Source: Author 2008)
37

Figure 1-17. Local resident (Source: Author 2008)
38

CHAPTER 2 PARTICIPATION ROLES AND BENEFITS IN SPONSORED PROGRAMS AMONG
HOUSEHOLDS WITHIN KANCHENJUNGA CONSERVATION AREA, NEPAL
Introduction
Nepal formally embarked on decentralized participatory conservation programs in
1990. However, the policies that endorse decentralization and participation to achieve
conservation goals are a debatable and contentious issue, especially in parks and
protected areas. Some authors have vehemently advocated for additional regulations
and management that potentially excludes local participation and cohesion (Robinson
1993; Brandon et al. 1998; Terborgh et al. 2002), while others support further devolution
of power within parks and protected areas in Nepal (Brandon & Wells 1992; Gibson &
Marks 1995; Ribot 2003; Baral & Heinen 2007). Nevertheless, the need for effective
integration of conservation and development in protected areas should not be viewed as
islands of conservation divorced from the social and economic context within which they
are located (IUCN 2003). Participatory management strategies that emphasize the
need for local communities to share in protected area benefits and decision-making
should be promoted and achieved. Additionally, decentralization and resident
participation in conservation programs should provide a balance between social and
conservation goals (IUCN 2003).
Advocation for decentralized conservation management is based on the
assumption that lower-level decision makers, who are otherwise generally excluded are
now more likely to have enhanced access to technical and financial assistance,
minimized organizational costs, and wider participation within an increasingly creative
and enriched economic sector (Ribot 2002; Agrawal & Gupta 2005). Protected area
managers need to identify the potential positives and negatives that should be targeted
39
and simultaneously avoided while conservation and livelihood issues are addressed
(Baral & Heinen 2007).
In Nepal, participation in decentralized conservation management determines the
quantity and types of benefits and costs received (Maskey et al. 2006), which are based
on socio-economic variables, including household income, education, and race/caste/
ethnicity (Agrawal 2000; Allendorf 2007; Baral & Heinen 2007), and higher levels of
forest dependency (Jumbe & Angelsen 2007). The most significant benefits are
consumptive (e.g., firewood, timber, food, herbs, medicines, construction materials,
etc.), and the ability to earn income from recreation and tourism (Wells 1992).
However, associated costs include loss of crops and livestock due to wildlife, injury and
death, loss of access rights, and time and resources spent guarding against wildlife
encroachment (Baral & Heinen 2007). Overall, there is a paucity of empirical research
that examines the distribution of costs and benefits of decentralized participatory
conservation at the household level (Baral & Heinen 2007).
Kanchenjunga Conservation Area Project (KCAP), with its complete devolution of
management authority to the local population provides an exceptional opportunity to
assess integrated decentralized participatory conservation programs in protected area
management in Nepal. This research seeks to assess if socio-cultural factors influence
decentralized conservation participation, and to determine if participation roles in
sponsored programs affect the distribution of benefits at the household level. Results
will determine if those households who are more heavily involved in decision-making
processes within the decentralized conservation framework accrue more benefits than
costs. Specifically, this study will examine two questions: 1) What factors affect
40
participation roles in sponsored programs by households in KCAP; and 2) Do
participation roles in sponsored programs2 impact the distribution of benefits among
households? Results of this study will demonstrate the importance of targeting and
empowering disadvantaged households, while educating them about the significance of
participation in order to have a more equitable distribution of benefits within
decentralized conservation programs to enhance their sustainable livelihoods.
Literature Review
Decentralized Conservation Participation
Participation in decentralized conservation management programs in Nepal is
highly correlated with demographic variables such as income, education, spatial
location, caste/race/ethnicity and gender (Metha & Kellert 1998; Sharma 2000; Blaikie &
Springate-Baginski 2003; Dev et al. 2003; Neupane 2003; Smith et al. 2003; Adhikari et
al. 2004; Maskey et al. 2006; Allendorf 2007).
Income is a statistically significant predictor of participation in sponsored and
decentralized programs. Households with greater landholdings have a higher degree of
participation (Maskey et al. 2006), while poorer households participate less than
wealthier and politically-connected households (Agrawal 2000; Baral & Heinen 2007;
Dev et al. 2003; Smith et al. 2003; Adhikari et al. 2004; Maskey et al. 2006; Allendorf
2007). Additionally, poorer households are not necessarily interested in participation as
they have higher associated costs since it takes time away from more productive
employment opportunities (Agrawal 2000; Timinsa 2003).
2 Sponsored programs include community based user groups that provide households with financial or technical assistance in decision-making, both individual and communal.
41

Education can have both positive (Lise 2000) and negative (Agrawal & Gupta
2005) affects on participation. Residents with higher levels of education are more likely
to understand the importance of forest conservation, and are thus more likely to
participate (Jumbe & Angelsen 2007). However, higher education levels might also
lead to a greater involvement in alternative income generating activities, and
subsequently create less interest in decentralized conservation participation (Jumbe &
Angelsen 2007).
Older individuals from wealthier and higher caste/race/ethnicity households are
more likely to participate and to be involved in decision-making from a leadership
position especially within community forest groups (Maskey et al. 2006). Mehta &
Kellert (1998) found that women and low-caste people were highly underrepresented in
executive committees responsible for the management of local resources. Given the
social system in Nepal, community based natural resources programs need to ensure
equal participation of all associated interest groups to reduce to the risk of exclusion
(Baral & Heinen 2007).
Agrawal & Gupta (2005) assessed the major factors that influenced participation in
the United Nations Development Program sponsored Parks-People-Program in four
protected areas buffer zones in Nepal. Results identified that supplementary income,
landholdings, caste, firewood consumption, household size, and the frequency of
household visits to program offices were statistically significant positive predictors of
participation. However, education level was a statistically significant negative predictor
of participation. Higher levels of education led to more lucrative wages and less
dependency on natural resources, and therefore decreased interest in sponsored
42

management programs. Overall, frequency of visits to program offices and benefits
received from participation had the greatest impact on participation. The authors
argued for strategic management in favor of marginalized and poorer households in
order to improve accessibility to government offices and respective officials (Agrawal &
Gupta 2005).
Additionally, Lachapelle et al. (2004) identified three broad hindrances to popular
participation in decentralized conservation management as: 1) vulnerability (lacking
private resources), 2) inferiority (based on discrimination due to caste, gender, and
education), and 3) the potential for corruption, especially related to lack of financial
transparency.
Decentralized Conservation Costs and Benefits
In Nepal, poorer households are more reliant on natural resources, but the
absence of participation among disadvantaged households in sponsored programs has
excluded them from decision-making processes in product distribution, and hence they
receive fewer benefits (Agrawal 2000; Baral & Heinen 2007; Dev et al. 2003; Smith et
al. 2003; Adhikari et al. 2004; Maskey et al. 2006; Allendorf 2007). Within decentralized
conservation programs, it is often the wealthier households that dominate decision-
making, and push for higher income timber production which takes a longer time for
maturity, thus creating greater costs for poorer households (Adhikari et al. 2004).
Primarily, people who are wealthy and politically-connected receive the most benefits
derived from participation and from community development projects (Adhikari et al.
2004; Agrawal & Gupta 2005). Domination of decision-making by the wealthy elite can
also influence community development projects that exclude disadvantaged households
(Timinsa 2003). Thompson-Slayter & Bhatt (1994) found the richest seventeen families
43
within one village in Nepal were the recipients of project aid targeted toward the
disenfranchised. However, food-insecure households (poor households) have also
been found to participate more often to ensure access to resources (Jumbe & Angelsen
2007).
Spatial location of households and agency offices shares a significant affect on
participation roles and accrual of benefits. Mehta & Kellert (1998) found that residents
living in remote areas of the Annapurna Conservation Area Project (ACAP) and the
Makalu-Barun Conservation Area Project received substantially less community
development related benefits, including drinking water systems, bridges, and health
clinics, than their counterparts who lived in closer proximity to project offices.
Maskey et al. (2006) found that socio-economic factors affected the level of
participation in decentralized conservation, and the role of participation was based on
the benefits received in the middle hills of Nepal. Lack of participation excluded
disadvantaged households from decision-making in product distribution; therefore they
received fewer benefits from the community forest. Community forest members who
held a decision-making role within user groups received a higher quantity of forest
benefits that included fuel wood, fodder, and timber compared to those members who
merely attended meetings. The authors call for empowerment of people with lower
socio-economic standing to understand the importance of participation in order to
enhance an equal distribution of accrued benefits (Maskey et al. 2006).
Baral & Heinen (2007) assessed residents who had participated in community-
based conservation programs and the associated distribution of benefits accrued in two
western protected areas in the terai lowlands of Nepal: Shuklaphanta Wildlife Reserve
44

and Bardia National Park. Gender, education, household affluence, and conservation
attitudes were significant predictors of participation, while family size, ethnicity, and
resource dependency lacked predictive validity. Respondents noted that more benefits
than costs were associated with participation in conservation programs. Overall, the
sustainability of conservation programs depended on the continued devolution of power
to local communities to sustain achievements, and to provide a means for a more
equitable distribution of benefits (Baral & Heinen 2007).
Kanchenjunga Conservation Area Project, Nepal
KCAP is one of the most remote and sparsely populated protected areas in Nepal
and is named after the third highest mountain in the world (Mt. Kanchenjunga, 8586 m).
In April 1997, the government declared the region with its unique biological
characteristics, high density of glaciers, high biodiversity indices, and endangered
wildlife as a “Gift to the Earth” in support of the World Wide Fund for Nature’s (WWF)
Living Planet Campaign (Heinen & Mehta 1999). The conservation area was officially
created in July 1997 and contains 2,035 km2 of area primarily comprised of high
mountain landscapes of glaciers and rocks, with only a small amount of arable land (2%
of the total). KCAP boasts 16% of Nepal’s total floral species and seven mammals with
conservation significance including the red panda, snow leopard, grey wolf, Himalayan
black bear, Himalayan tahr, blue sheep, and musk deer (WWF 2006).
The aim of KCAP is “to safeguard the biodiversity of the area, and improve the
living conditions of the local residents by strengthening the capacity of the local
institutions responsible for decision making, which will effect the long-term biodiversity
conservation and economic development of the area” (WWF 2006, p 2). The project’s
45

primary focus is to strengthen the capacity of local communities to manage their natural
resources while concurrently improving their livelihood opportunities.
KCAP functions as an Integrated Conservation and Development Project (ICDP)
with major donor agencies that include WWF, the MacArthur Foundation, the Kadoorie
Agricultural Aid Association, and the Darwin Initiative. The project was established with
financial and technical assistance provided by WWF. WWF has invested over US $1.5
million and has pledged continued support for another five years through the Sacred
Himalayan Landscape project via a partnership with the Integrated Centre for Integrated
Mountain Development (ICIMOD) (WWF 2007).
Programs and Management
WWF and the government have created a democratically elected hierarchy of
management at KCAP based on local involvement and empowerment to achieve self-
sustainability. The project has been implementing programs in partnership with local
community-based organizations (collectively referred to as sponsored programs),
namely the Kanchenjunga Conservation Area Management Council, seven User
Committees, forty-four User Groups, and thirty-two Mother Groups3. The government
recently transferred management of the area to the Kanchenjunga Conservation Area
Management Committee on September 22, 2006 which established KCAP as the first
community-managed conservation area in Nepal, if not in Asia (WWF 2006).
Several achievements have been garnered by KCAP since its existence in regards
to accomplishment of stated objectives (WWF 2006). KCAP further reassigned
management responsibilities of 47,772 ha to sixteen Community Forest User Groups
3 Mother Groups are sponsored user groups exclusively comprised of female members.
46
that represents over 891 households and includes one Mother’s Group. In addition to
providing a system for integrated local management, 32 women’s savings and credit
groups, 25 revolving funds, a NRs 1,000,0004 fund for Non-Timber Forest Products
(NTFPs) enterprises, and a NRs 100,000 livestock insurance program were created.
Community development projects have included the delivery of metal prayer flagpoles
to replace the traditional custom of annual harvesting of trees, improved cooking stoves
to decrease pressures on forest use, and a micro-hydro scheme in Ghunsa and Gola.
Additional projects include a child day care center, drinking water systems, 1,200
meters of new trails, suspension bridges, toilets, a health post, an irrigation canal, and
green houses.
Although various WWF projects have been in operation since its establishment,
only five percent of the residents knew that WWF was the main operational
organization. Also, only a quarter of respondents were aware of conservation related
objectives, while over half knew of economic development related objectives (Muller-
Boker & Kollmair 2000). WWF (2007) also found that very few residents knew about
the objectives of KCAP or the main organization that managed it. Local resident
expectations were grossly unrealistic as the most often cited perceived objectives were
large infrastructure construction. Local residents did maintain positive attitudes towards
capacity building programs and perceived the project had increased wildlife populations
(Muller-Boker & Kollmair 2000). However, an increase in wildlife has led to increased
frequencies of predation and crop damage. Residents also expressed negative
attitudes towards social stratification of the area and the inequitable distribution of
4 At the time of research (October 1st, 2008) 1 USD = 75 Nepali Rupees (NRs).
47

benefits based on differences between ethnic minorities, proximity to project offices, and
the Maoist insurgency5 (Muller-Boker & Kollmair 2000).
Conservation Issues
There have been five major environmental pressures exerted by local residents
identified at KCAP (WWF 2006). Explanations and reasons for the pressures are a mix
of unclear ownership or tenure rights, lack of policy and enforcement, use of poorer
households for labor, low agricultural productivity levels of existing lands, food security,
low levels of land ownership, a lack of cash crop market linkages, and external market
demands for traditional medicines. Access to natural resources is limited to local
residents and regulated by local institutions, however outsiders can buy access permits
(Ikeda 2005). Traditional local institutions of communal natural resources management
have existed without much government intervention due to the remoteness of the area
(Muller-Boker & Kollmair 2000). First, over 170 households practice slash and burn
techniques for agricultural purposes at high elevation (above 3,000 m) forests in the
northwestern part of the conservation area. Second, alpine meadows are being
destroyed due to overgrazing, fuel needs, and housing construction. Third, there is a
large amount of timber being over-harvested for purposes related to residential cooking,
heating, and construction, especially by residents who are heavily dependent on those
resources for their livelihoods. Higher elevation villages are more heavily dependent on
natural resources access for their livelihoods (Muller-Boker & Kollmair 2000). Fourth,
an over-harvesting of NTFPs exists that includes sea buckthorn, cardamom, and
5 The Maoist insurgency was the decade long civil war between communist rebel group and the democratic national government. The insurgency has ended with the rebel group integrated into the mainstream politics. See Thapa (2004), Battarai et al. (2005), and Baral & Heinen (2006).
48

medicinal plants (WWF 2006). Lastly, poaching and retaliatory killings of wildlife, that
includes snow leopards6, are also evident (Ikeda 2005; WWF 2006).
Study Site
KCAP is located in the northern portion of the district of Taplejung (see Figure 2-
1). According to the 2001 National Census, of the 134,698 people in the district,
42.35% of women and 62.5% of men were literate. The average annual population
growth rate from 1991 to 2001 was 1.21%. The district of Taplejung has a Human
Development Index score of 0.328, which is 6th from the bottom in Nepal (out of 75
districts). There are 33,675 people per doctor and 8,980 people per hospital bed. Only
47.5% of the district population has access to toilet facilities, and 61% have access to
improved water supplies (Central Bureau of Statistics 2001). There is only 37 km of
roads that are also unpaved in the entire mountainous district.
Around 4,570 people in approximately 860 households reside in the four Village
Development Committees (VDC’s) that comprise KCAP. The four VDC’s are
Olangchung, Lelep, Yamfudin, and Tapethok (WWF 2006). Many ethnic minorities that
include Sherpa (Bhote), Limbu, Rai, Gurung, Magar, Thakali, Tamang, Tibetan, and
Jirel reside in the area. Over 48% of the population is Limbu, while another 25% is
Sherpa (WWF 2006). The main sources of income include subsistence agriculture and
animal husbandry. Additional sources of livelihood activities include cottage industries,
tourism, employment in the military, trade with Tibet, and seasonal labor out-migration
(Muller-Boker & Kollmair 2000). The average food sufficiency in KCAP is 5.5 months
6 The Ghunsa Valley contains forty percent of the available snow leopard habitat in KCAP and is also an important part of the regional tourist trekking route.
49

and less than 10% of households produce enough food for subsistence consumption
(WWF 2006).
Figure 2-1. Map of KCAP (Source: WWF 2006)
The existing conditions in KCAP are quite different than those found at the well-
known and highly successful model of the Annapurna Conservation Area Project
(ACAP) in central Nepal. While ACAP has received over 75,000 tourist arrivals
annually, KCAP has only been open for trekking since 1988 and tourist arrivals peaked
at 800 in 2001, and then decreased to 175 in 2006 (WWF 2007). Lack of transportation
infrastructure, tourist facilities, and the Maoist domestic insurgency are the primary
reasons for the decline in tourist arrivals (WWF 2007).
Methods
This study utilized a mix of both qualitative and quantitative approaches. The
combination of qualitative and quantitative methodology has been gaining credibility and
50

relevance in the development literature (Booth et al. 1998; Kanbur 2001; White 2002;
Ellis & Freeman 2004). This study utilized a triangulation method to improve the validity
of the data. Triangulation is described as collecting information from multiple sources
and methods of inquiry. This process reduces the chance of researcher bias and
improves research validity (Denzin & Lincoln 2000).
Data Collection
Data collection was conducted over three months (October through December
2008) and employed four methods. First, project reports were reviewed from the World
Wildlife Fund-Nepal office, the Department of National Parks and Wildlife Conservation,
and KCAP offices in the capital Kathmandu and the research site. Information on past
and current projects, policies, programs, and other management issues were examined.
Second, participant observation methods were conducted to develop a better visual
context of the community’s perspective and behavior. Participant observation was
focused on resident livelihood strategies, non-verbal cues during participation in
sponsored programs, and sentiments toward the possible presence of equitable social
inclusion within the decentralized conservation program. Third, a Participatory Rural
Appraisal (PRA) wealth ranking (World Bank 2007) was conducted at each village. The
PRA wealth ranking allowed each community to familiarize themselves with the
presence of the researcher and voice their views before individual households were
selected. PRA wealth ranking techniques are commonly used in conjunction with
quantitative surveys as a means to categorize populations for stratified sampling
procedures or for categorical analysis post data collection (Grandin 1988; Ellis &
Freeman 2004; World Bank 2007). Fourth, a detailed interview survey was conducted
among a random selection of households throughout the sampling area. The
51
combination of methods was adapted from the UK Department for International
Development (DFID) sponsored LADDER7 project (Ellis & Freeman 2004).
The primary researcher previously lived in Nepal for 27 months and is proficient in
the national Nepali language; however, a local person from the research area aided the
interviewer in the field and provided assistance for rapport building (Nyaupane & Thapa
2004). Hiring a local research assistant also minimized cross-cultural bias and non-
sampling error (Walpole & Goodwin 2002). The interviews lasted up to half an hour in
duration and was dependent on the respondent. Survey questions were spoken in
Nepali or other local dialects when required by the assistant. In translation, local words
were used wherever possible and technical jargon avoided. A professor at Tribhuvan
University, Kathmandu, Nepal, assessed and verified survey translation accuracy from
English to Nepali, and then back to English.
Selection of Participants
Based on a recent census by WWF (2006), the sample population constituted the
entire population that resided within KCAP borders and comprised of 4,570 people in
860 households. The population was spatially distributed over four Village
Development Committees (VDC’s) that included Lelep (47%), Tapetok (31.3%),
Yamphudin (15.1%), and Olachan Gola (6.8%). A systematic sampling method was
used to select respondents. Households were targeted, visited and the head of
household was requested to participate. A comprehensive list of village households
was created for each village during the PRA wealth ranking process. From the
comprehensive list, every fourth house was surveyed after a random start for a total
7 LADDER stands for Livelihoods and Diversification Directions Explored by Research.
52
population of 215 (response rate = 100%), which was representative of 25% of the total
households in KCAP8.
The head of the household (>18 years of age) was personally interviewed at their
respective residence. Attempts were made to contact the head of the household, but in
cases of unavailability, the most knowledgeable adult member was requested to
participate. If members of the household were unavailable, the next house was
selected. Since local residents are not familiar with survey procedures, and more
importantly, due to the high rate of illiteracy, questions were verbally read to participants
while the interviewer recorded the responses (see Nyaupane & Thapa 2004).
Instrumentation
The questionnaire consisted of nine sections. The first section examined basic
household data including education, occupation, and race/caste/ethnicity. The second
section assessed household levels of participation in sponsored programs including
forest and conservation user groups. Section three measured income related to
agriculture. Section four assessed income generated from livestock, privately owned
natural resources and community based natural resources, that included NTFPs.
Section five measured non-farm related sources of income such as remittances9 and
household responses to unforeseen crises. A pilot test was conducted among project
and government agency staff in the district headquarters of Taplejung, and questions
were slightly altered or removed as deemed necessary.
8 A sample size of 205 within a population of 860 households is sufficient for categorical data analysis with the assumption of 0.05 alpha level and a 0.05 margin of error (Cochran 1977; Bartlett et al. 2001). 9 Remittance is considered payments to friends and family in a migrant’s home of residence, practiced by over 190 million migrants totaling US $433 billion in 2008, of which US $328 billion went to developing countries (World Bank 2009).
53
Operationalization and Data Analysis
This study assessed two research questions.
Research question 1: What factors affect household participation roles in sponsored programs?
An ordered probit regression model assessed the existing household participation
patterns in sponsored programs (see Greene 2000; Agrawal & Gupta 2005; Maskey et
al. 2006). Dependent variables within ordered probit models are represented by an
arbitrary ranking of numbers while normality is assumed (Maskey et al. 2006). Table 2-
1 presents the twelve independent variables utilized to assess participation levels within
economic, social, and access variable themes. The dependent variable measured
household roles of participation in sponsored programs and was operationalized as:
1=attendance, 2=suggestion, 3=discussion, 4=decision making (see Maskey et al.
2006). However, due to a low distribution of frequencies among the varying categories,
the participation variable was recoded as: 0=non-membership, 1=general member, and
2=leading member. The role of participation in the first model is a function of income,
age, education, remittances, caste, household size, dependents, livestock, land
holdings, distance to nearest program office, office visits, and staff visits. The ordered
probit model utilized for research question 1 is as follows:
Pi = β1 Income + β2 Highest education + β3 Age of head of household + β4 Education of head of household + β5 Remittances + β6 Caste + β7 Household size + β8 Dependents + β9 Livestock + β10 Landholdings + β11 Distance to program office + β12 Office visits + β13 Staff visits + e
54

Table 2-1. Operationalization of variables Name of variable Operationalization Participationa Household participation role in sponsored groups, 1=attendance,
2=suggestion maker, 3=discussion leader, and 4=decision-making. Recoded due to low frequency as 0=non-member, 1=general member, and 2=group leader.
Economic Variables Remittanceb A yes or no dichotomy based on the presence of remittance. Incomeb A yes or no dichotomy based on the presence of income in
addition to agriculturally derived income including government salaries, tourism, pensions, or other entrepreneurial activities.
Landholdingsb,c Land under the control of the household in ropani (19.65 ropani = 1 hectare).
Livestockb,d Collected in absolute value and converted to livestock units for analysis (1 Livestock unit = 1.2 yaks, 1.2 cows, 1.2 buffalo, 5 sheep, 4 goats, 2 calves, 5 pigs, 100 chickens).
Social Variables Education of head
of householdc Highest level of education attained by the head of household.
Highest education Highest level of education attained by any adult individual (18 years of age or older) living within the household.
Sizeb The number of people residing within the household. Dependentsa The number of dependents (<18 years old) residing within the
household. Age of head of
householda Age of the head of household.
Caste/Ethncitya,b A categorical variable measured as 5=Brahmin, 4=Chettri, 3=Sherpa, 2=Limbu, and 1=Rai. This variable was recoded as 1=Sherpa and 0=other due to low frequency distributions in other categories.
Access Variables Office visitsb A yes or no dichotomy based on the presence of household
members visits to KCAP offices over the past year (1=yes, 0=no). Staff visitsb A yes or no dichotomy based on the presence of KCAP staff
visiting the household over the past year (1=yes, 0=no). Distance of house to
officec Duration of time to walk to a KCAP office from house.
Benefits Loans borrowed Value of loans borrowed from sponsored programs by household. Community-
development projects
Number of community development projects perceived to be accrued by household.
Trainings Number of trainings household members have participated in the past year.
a Adapted from Maskey et al. (2006) b Adapted from Agrawal & Gupta (2005) c Adapted from Jumbe & Angelsen (2007) d Adapted from FAO (2003)
55

Research question 2: Do participation roles in sponsored programs impact the distribution of benefits among households?
A linear regression was utilized to determine the distribution of benefits (see Table
2-1) based on the predicted role of participation in sponsored programs identified within
the ordered probit from research question 1 (Maskey et al. 2006). A two-stage linear
model for benefits as a function of participation was constructed. Participation roles
were then utilized as dummy variables with the value of 1 if the role was present and 0 if
there was an absence of any participation among the three predicted roles. Model
estimation used ordinary least squares regression and dropped the intercept to avoid
perfect collinearity. The benefit model utilized to answer research question 2 are as
follows:
Loans borrowed = f(no participation, general member, leadership position).
Community development projects = f(no participation, general member, leadership position).
Trainings = f(no participation, general member, leadership position).
Results
Profile of Household Respondents
A total of 215 surveys were completed and 205 were usable. Males constituted
the majority (86%) of household heads10. Sherpa and Limbu were the dominant
ethnicities within the region. The average household was headed by an individual who
was 51 years old with no education, comprised of 5.9 members, of which 2.2 were
under 18 years of age (see Table 2-2). The lower elevation (≈1,800 m) VDC of Lelep
(59%) was the most surveyed of the four, followed by Tapetok (17%), Yamphudin
(17%), and the higher elevation (≈3,500 m) VDC of Olachan Gola (7%).
10 Households in Nepal are generally male dominated. In addition, sons generally reside at their parents’ home with their wives after marriage. Generally, nuclear families are commonly in existence.
56

Table 2-2. Profile of respondents Socio-demographic Characteristics Frequency Percentage (%) Gender Male 177 86 Female 28 14 Age 18 – 29 8 4 30 – 39 20 10 40 – 49 58 28 50 – 59 44 22 60 or older 75 36 Caste / Race / Ethnicity Sherpa 109 53 Limbu 84 41 Rai 8 4 Gurung 4 2 Highest Education Level of Household Head No education 180 88 1 – 5 years 13 6 6 – 10 years 12 6 More than 10 years 0 0 Highest Level of Education No education 68 33 1 – 5 years 21 10 6 – 10 years 100 49 More than 10 years 16 8
The education system within the KCAP region has been established relatively
recently. The average head of household only had 0.8 years of education; however, the
highest education of adults (18 or more years old) within the households ranged from 0
to 16 with a mean of 5.8 years. Over half (50.1%) of the residents within the sampled
households (n=1,180) and all residents over the age of 60 had never attended school.
Only 16% of household members who were over 30 years of age had attended school.
A cross-tabulation of age versus education level among all household members is
illustrated in Table 2-3. Results indicate that 56.7% of all residents who have attended
school were under 18 years of age; while 87.3% were under the age of 30. Additionally,
57
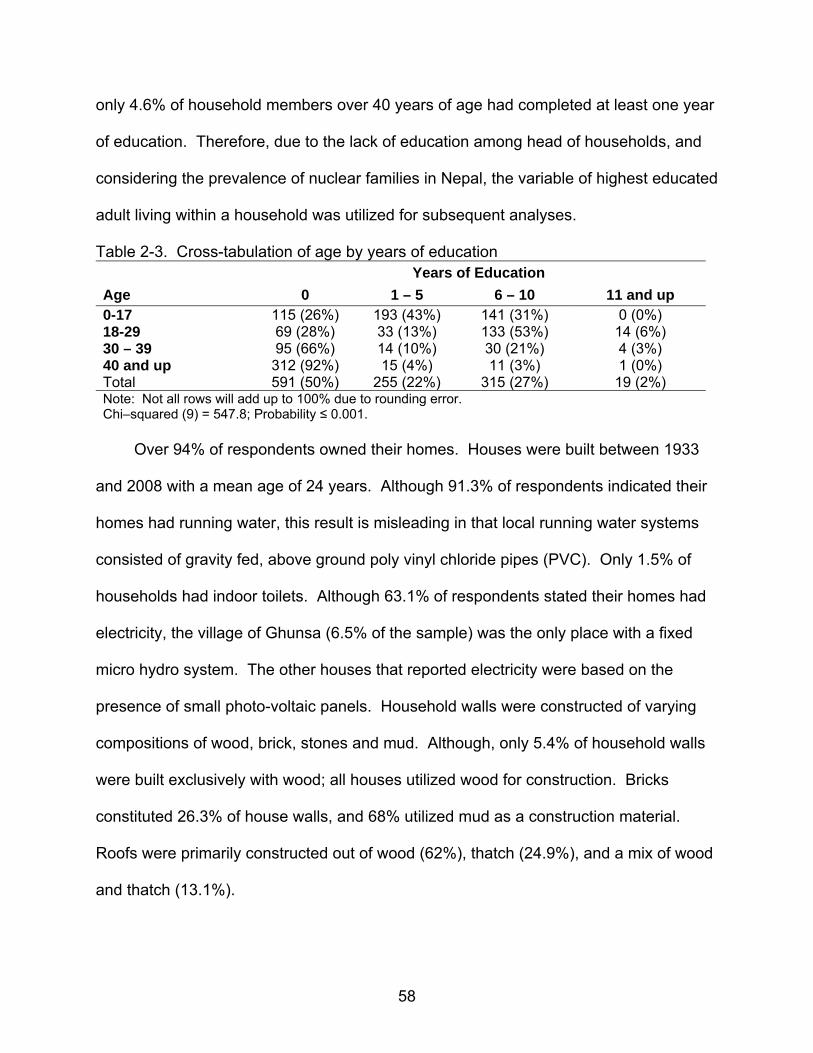
only 4.6% of household members over 40 years of age had completed at least one year
of education. Therefore, due to the lack of education among head of households, and
considering the prevalence of nuclear families in Nepal, the variable of highest educated
adult living within a household was utilized for subsequent analyses.
Table 2-3. Cross-tabulation of age by years of education Years of Education Age 0 1 – 5 6 – 10 11 and up 0-17 115 (26%) 193 (43%) 141 (31%) 0 (0%) 18-29 69 (28%) 33 (13%) 133 (53%) 14 (6%) 30 – 39 95 (66%) 14 (10%) 30 (21%) 4 (3%) 40 and up 312 (92%) 15 (4%) 11 (3%) 1 (0%) Total 591 (50%) 255 (22%) 315 (27%) 19 (2%) Note: Not all rows will add up to 100% due to rounding error. Chi–squared (9) = 547.8; Probability ≤ 0.001.
Over 94% of respondents owned their homes. Houses were built between 1933
and 2008 with a mean age of 24 years. Although 91.3% of respondents indicated their
homes had running water, this result is misleading in that local running water systems
consisted of gravity fed, above ground poly vinyl chloride pipes (PVC). Only 1.5% of
households had indoor toilets. Although 63.1% of respondents stated their homes had
electricity, the village of Ghunsa (6.5% of the sample) was the only place with a fixed
micro hydro system. The other houses that reported electricity were based on the
presence of small photo-voltaic panels. Household walls were constructed of varying
compositions of wood, brick, stones and mud. Although, only 5.4% of household walls
were built exclusively with wood; all houses utilized wood for construction. Bricks
constituted 26.3% of house walls, and 68% utilized mud as a construction material.
Roofs were primarily constructed out of wood (62%), thatch (24.9%), and a mix of wood
and thatch (13.1%).
58

The main KCAP office is located in the village of Lelep, while three other branch
offices are located in Gola, Ghunsa, and Yamphudin. The average time duration by foot
to reach one of the four KCAP offices is one hour and twenty minutes; however, times
ranged from a few minutes to five hours. For the past year, only 14.6% of households
stated a member had visited a KCAP office, and only 22% stated a KCAP staff person
had come to visit their household (Table 2-4).
Table 2-4. Descriptive statistics for participation role analysis variables Variable Mean Standard
deviation Minimum Maximum Observations
Participation 0.89 0.58 0 2 205 Remittance 0.31 0.46 0 1 205 Income (non-ag) 0.53 0.50 0 1 205 Land (ropani) 22.83 23.62 0 150 205 Livestock (units) 4.52 5.21 0 49 205 Education (years/head) 0.80 2.32 0 10 205 Highest education 5.81 4.63 0 16 205 Size (number of persons) 5.87 1.50 1 10 205 Dependents 2.22 1.37 0 6 205 Age of household head 51.56 13.17 25 94 205 Caste/ethnicity 0.53 0.50 0 1 205 Officer visit (n/y) 0.21 0.41 0 1 205 Member visit (n/y) 0.15 0.36 0 1 205 Household distance to office (minutes) 84 61 1 300 205
The financial wealth of households varied. Remittances11 were received by 29.3%
of households from both the district capital of Taplejung, and abroad that included
Qatar, Malaysia, Japan, and the United Kingdom. Annual values of remittances (in
Nepali Rupees (NRs); on October 1st 2008, 1 USD = 75 NRs) averaged NRs 96,320
and ranged from NRs 20,000 to NRs 400,000. Household land ownership averaged
23.5 ropani (1 ha = 19.65 ropani) and ranged from 0 to 150 ropani. Only 38% of
11 Nepal received US $1.2 billion in remittances which reflect 14.9% of total Gross Domestic Product in 2006 (World Bank 2008).
59

households owned more than one hectare. Household Tropical Livestock Unit (TLU)
values averaged at 4.56 and ranged from 0 to 49.
Over three-quarters of households participated in sponsored activities via user
groups, mother groups, father groups, and conservation groups. Mother groups had the
largest representation in participation (71.4% of all households), while only 8.3% of
households maintained memberships within other groups. Roles of participation within
these groups varied: 23.9% of households did not maintain a membership within any
group; 64.4% considered themselves to be general members; and 11.7% of households
maintained a leadership position within a group.
Research Question 1: Household Participation Roles in Sponsored Programs
Results of the ordered probit model utilized to assess factors that influence
household participation roles are presented in Table 2-5. The overall model was
statistically significant with seven independent variables that were statistically
significant. None of the economic variables were statistically significant; however, four
of the social variables, and all three of the access variables were statistically significant
predictors of participation in sponsored programs.
Four of six social variables were statistically significant. The level of education
completed by the head of household had a negative value and was statistically
significant. This indicates that higher levels of education acquired by household heads
resulted in a lower likelihood of household members participating in sponsored
programs. However, the highest level of education among adult household members
had a statistically positive association with participation. This positive association
indicated that as the highest education level within a household increased, so did the
likelihood of participation. The size of a household was a statistically significant
60

predictor of participation. Households with more members were more likely to
participate in sponsored programs. Age was the fourth statistically significant social
predictor of participation in sponsored programs, but had a negative relationship.
Households with older household heads were less likely to participate in sponsored
programs.
Table 2-5. Household participation roles in sponsored programs Variable Name Coefficient Standard error Economic Variables Remittance -0.005 0.254 Income 0.059 0.229 Land 0.001 0.004 Livestock 0.017 0.017 Social Variables Education of household head -0.087** 0.040 Highest education of household 0.038* 0.023 Size 0.205** 0.087 Dependents -0.098 0.100 Age of household head -0.015* 0.009 Caste/Race/Ethnicity 0.079 0.192 Access Variables Staff visit to household 0.369* 0.223 Household member visit to office 0.671*** 0.251 Household distance to office -0.004*** 0.001 Ancillary Parameters Cut 1 1.477** 0.592 Cut 2 0.730 0.585 Chi-Square (13) = 38.96; Prob (Chi-squared) ≤ 0.001; Psuedo-R-Squared = 0.210. Note: Results are based on an ordered probit equation where the dependent variable is ordered 0, 1, and 2. Statistical significance of each coefficient is denoted by *, **, and ***, that represents 10%, 5%, and 1% levels respectively. The ancillary parameters are used to calculate predicted possibilities of each participation role on the standardized normal distribution.
All three of the access variables were statistically significant predictors of
household participation roles in sponsored programs at KCAP. A visit by a KCAP
officer to a household within the past year was a statistically significant predictor of
increased likelihood of participation. Household members who visited a KCAP office
within the past year also had significantly increased likelihoods of participation in
61

programs. However, the farther the distance a house was located from a KCAP office
the greater the likelihood of significantly decreased participation in sponsored programs.
Research Question 2: Household Participation Roles and Distribution of Benefits
A linear regression was utilized to determine the distribution of benefits based on
the predicted participation role in sponsored programs identified within the ordered
probit. A two stage linear model for benefits as a function of participation was
constructed. Benefits associated with participation in sponsored programs are
represented in the form of an ability to access savings accounts, financial loans, and
capacity development trainings (see Table 2-6).
Table 2-6. Chi-squared percentage of participation roles and benefits received Savings Loans Training Value of Loans No. of Benefits Total Role No Yes No Yes No Yes <2k 2-4k 4k+ 2-3 4-5 6-7 Nonea 100 0 100 0 85 15 0 0 0 49 38 13 47 Generalb 13 87 2 98 87 13 41 43 16 49 49 2 134 Leaderc 13 87 13 87 67 33 19 38 43 46 50 4 24 Total 33 64 25 75 84 16 38 42 20 49 47 4 205 Chi Square
125.6 180.7 6.6 7.2 11.1
Df 2 2 2 2 4 p-value ≤0.001 ≤0.001 ≤0.05 ≤0.05 ≤0.05 a none refers to a lack of participation role in sponsored programs b general refers to a general member participation role c leader refers to a leadership role
The majority (97.4%) of households that participated in sponsored groups had
borrowed loans from their respective groups, and 92% had access to savings programs
within those groups. The amount of household loans borrowed varied from NRs 200 to
NRs 200,000 and averaged NRs 7,330. Almost a quarter (23.7%) of loans borrowed
exceeded NRs 6,000 in value, while 44.7% were for less than NRs 4,000. Households
with members that maintained community leadership positions were more frequently
able to access loans of greater value. Although interest rates on the borrowed loans
62

varied from 1.0% to 18%; most (83%) held interest rates less than 2.5%; the rest had
interest rates over 10% per annum. Respondents participated in training that included
animal husbandry, NTFP processing/harvesting, accounting, sewing, cooking, forestry,
and agriculture. About 16% of all households participated in training activities, with a
disproportionate percent of individuals from households that held leadership positions.
The number of different community development projects perceived to be initiated
within the communities averaged 3.71 (see Table 2-7). The most commonly perceived
projects included trail construction, bridge construction, and drinking water facilities
development. However, households with no membership in organized groups
perceived a higher number of accrued community development projects.
Table 2-7. Perceived household community benefits from KCAP Community Benefits Yes No Trail Construction 100 0.0 Bridge Construction 95.5 4.5 Drinking Water 93.1 6.9 Micro-Hydro 34.7 65.3 Improved Stove 32.5 67.5 Toilets 5.0 95.0 Healthcare Post 4.5 95.5 Day Care Center 3.0 97.0 Irrigation 1.5 98.5 Greenhouse 0.0 100.0 Mean household perception of community development projects received = 3.71.
The estimates for the second stage linear model for accrued benefits as a
function of participation are presented in Table 2-8. The model used accrued benefits
as a function of participation role, as the first model concluded that participation role is a
function of socio-economic factors. Non-members tended to be excluded and
leadership positions were rewarded, and thus benefits received were a function of
participation roles. The estimates for community development and amount of loans
63
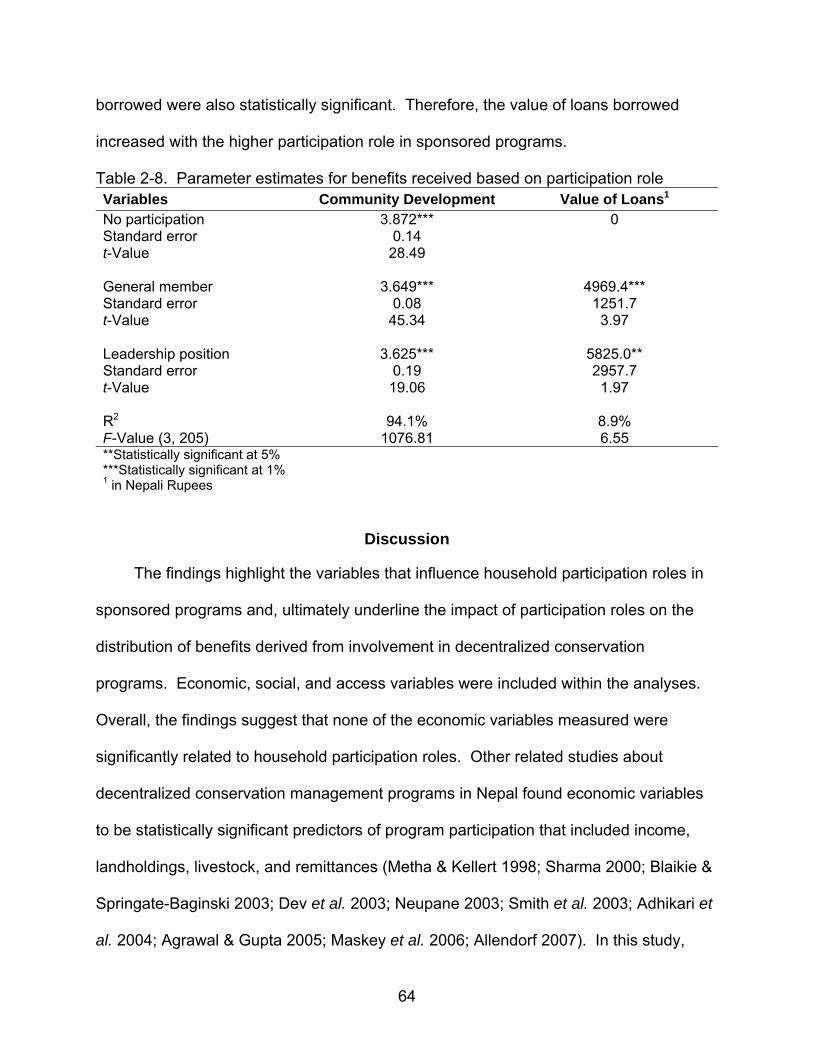
borrowed were also statistically significant. Therefore, the value of loans borrowed
increased with the higher participation role in sponsored programs.
Table 2-8. Parameter estimates for benefits received based on participation role Variables Community Development Value of Loans1
No participation 3.872*** 0 Standard error 0.14 t-Value 28.49 General member 3.649*** 4969.4*** Standard error 0.08 1251.7 t-Value 45.34 3.97 Leadership position 3.625*** 5825.0** Standard error 0.19 2957.7 t-Value 19.06 1.97 R2 94.1% 8.9% F-Value (3, 205) 1076.81 6.55 **Statistically significant at 5% ***Statistically significant at 1% 1 in Nepali Rupees
Discussion
The findings highlight the variables that influence household participation roles in
sponsored programs and, ultimately underline the impact of participation roles on the
distribution of benefits derived from involvement in decentralized conservation
programs. Economic, social, and access variables were included within the analyses.
Overall, the findings suggest that none of the economic variables measured were
significantly related to household participation roles. Other related studies about
decentralized conservation management programs in Nepal found economic variables
to be statistically significant predictors of program participation that included income,
landholdings, livestock, and remittances (Metha & Kellert 1998; Sharma 2000; Blaikie &
Springate-Baginski 2003; Dev et al. 2003; Neupane 2003; Smith et al. 2003; Adhikari et
al. 2004; Agrawal & Gupta 2005; Maskey et al. 2006; Allendorf 2007). In this study,
64

alternative forms of income, quantity of land owned, and number of livestock were all
non-significant variables. The lack of statistical significance among these economic
variables could be associated with the economic homogeneity of the population. There
were significant positive correlations between the four economic variables, which
indicated that if a household had one of the variables, it usually had all four variables.
Likewise, if a household was economically disadvantaged within one economic variable,
they were often disadvantaged in all four variables. However, overall the KCAP region
is rather homogeneous in economic terms; i.e., economically poor. Quantities of
livestock are highly correlated with altitude and inversely related to land ownership.
Households at higher elevations have larger herd sizes and less land compared to
lower elevation households. It is likely that the lack of variation within the economic
variables led to statistical insignificance and being poor predictors.
Social variables were significantly related to household participation roles and
included education levels of the head of household, highest education levels of
household adults, head of household age, and size of households. Findings were
similar to other research conducted in Nepal. Education levels have been found to be
both negatively (Agrawal & Gupta 2005) and positively related (Maskey et al. 2006) to
participation levels. Such incongruence in findings could be associated with
discrepancies in the variable’s operationalization. Agrawal & Gupta (2005)
operationalized education as the summed years of education of all household adults (15
years of age or older). In this study, education was measured by two variables which
included the total years of education completed by the head of household, and the
highest level of education completed by any household adult (18 years of age or older).
65

Findings identified the two education variables to have conflicting impacts on
participation roles. Head of household education levels was negatively related to
participation roles; while the highest education level of household adults was positively
related to participation roles. Although Maskey et al. (2006) found age to be positively
related to participation roles; this current research found a statistically significant
negative relationship. Caution needs to be exercised when making policy suggestions
based solely on education or age variables due to the unresolved association with
participation roles.
Although the number of dependents living within a household was not a significant
predictor of participation, total household size did play a role. Households within KCAP
are rather large with many extended family adults residing in one household. Family
size has been proven to have an impact on participation roles, but has been previously
measured as total number of individuals within the household (Agrawal & Gupta 2005),
and as the number of dependents (Maskey et al. 2006). Results in this study found that
overall household size was a better predictor of participation roles than number of
dependents. To ensure a more representative level of involvement within conservation
areas and between socio-economic categories, managers should seek participation
from smaller households.
Similar to Agrawal & Gupta (2005), all three access variables in this study were
significantly related to participation roles. An increase in interactions with KCAP offices
and staff was positively related to participation roles. These results highlight the
importance of program staff to conduct social mobilization activities that include social
capacity trainings and community development projects. A simple act of allowing the
66

community to interact with agency staff provides a major benefit. However, although
the access variables were significant predictors of participation roles, relatively few
households exhibited access variables. WWF and KCAP have increased effectiveness
by maintaining four field offices in proximity to the various minority populations, within a
one hour walking distance. The spatial distance of KCAP offices to individual
households did have a minor negative impact on participation roles. This finding is
similar to Mehta & Kellert (1998).
The results of this study are important in the context of mountain versus terai
(lowlands) research in the arena of community based natural resources management in
Nepal. The mountainous KCAP area lacks the presence of the socially dominant
groups found in other studies which include the Brahmin and Chettri castes found in
large numbers in the lowlands. This study site predominantly comprised of Sherpa and
Limbu ethnicities that were rather heterogeneous following topographical lines. Most
villages were dominated by one caste, and thus limited caste interactions. However,
the distribution of benefits within KCAP was found to be unequal.
Households with higher community participation roles benefited from enhanced
access to financial credit in terms of higher principles and lower interest rates. Higher
participation roles also provided for an increased level of involvement in capacity
development training offered via program offices. Within KCAP, if equal distribution is a
goal, then increased promotion of program participation is important.
Decentralized conservation programs have been heralded in the literature based
on their theoretical ability to: 1) decrease organization costs, 2) provide financial and
technical assistance opportunities to previously excluded stakeholders, and 3) create a
67

68
creatively enhanced and competitive economic sector (Ribot 2002, Agrawal & Gupta
2005). However, given the discrepancies of loan and interest rate distributions across
households, and the unequal distribution of capacity development training, further
research is needed to determine the level of financial and social inequalities and
possible financial corruption activities.
There are some limitations to this study. Although the primary researcher had
previously lived in Nepal for over two years and spoke the national language, cultural
differences were still present. Local research assistants were hired to alleviate
response or researcher bias; however, the availability of trained social researchers at
the site was minimal. Although the operationalization of variables within this study was
adapted from previous research conducted in decentralized conservation programs,
additional improvements could be made. Due to low participation role frequencies, this
study recoded participation into only three categories. A descriptive narrative of an
example of each participation role should accompany the questionnaire to ensure
complete comprehension of role categories. In addition, the economic variables of
remittance and non-farm income should be measured as absolute values to further
distinguish variation within the population.
Overall, this study has shown that although KCAP is the first completely
decentralized conservation program in Nepal, a disproportionate amount of the
available benefits provided by conservation are concentrated within a small proportion
of decision-making households. Though the ICDP literature calls for complete
devolution of decision-making responsibilities and equitable distributions of benefits for
sustainability, neither are currently occurring at KCAP.
CHAPTER 3 USE PATTERNS AND FACTORS AFFECTING HOUSEHOLD NATURAL RESOURCE
DEPENDENCY WITHIN KANCHENJUNGA CONSERVATION AREA, NEPAL
Introduction
Rural communities, particularly in developing countries often depend on natural
resources extraction, and make extensive use of environmental products and services
as integral components of their livelihood strategies (Ellis 2000). Natural resource
based activities tend to require little skill and monetary investments (Berkes 2007), for
products such as fuel wood, medicines, plants, food, grazing fodder, hunting animals,
and building materials (DeBoer & Baquete 1998). Over 60 million people globally are
heavily dependent on forest resources for their livelihood, which on average represents
22% of total household income in developing countries (Vedeld et al. 2004). However,
it is necessary to maintain heterogeneity in resource use patterns among local people
especially in regions with a diverse range and variety of available resources (Brandon
1997). These resources serve to maintain livelihoods, provide an opportunity to
graduate to a higher level of livelihood strategy, or provide the ability to overcome crises
(Scoones 1998). The magnitude and details of resource use and dependency likely has
consequences for conservation and strategies to make resources sustainable (Vedeld
et al. 2004). Nevertheless, an assessment to understand dependency and pressures
on local natural resources can assist restructuring of future Integrated Conservation and
Development Projects (ICDP) for effective management (Herrold-Menzies 2006).
ICDPs are based on the premise that development improves local livelihoods
while subsequently diminishing consumptive pressures exerted and dependencies on
natural resources. The ICDP framework has been championed since the 1992 United
Nations Convention on Biological Diversity which pledged to create a protected area
69

system based on three primary objectives including the conservation of biological
diversity, sustainable use of the biological diversity components, and providing for the
fair and equitable distribution of benefits (CBD 1992). Therefore, parks and protected
areas are now responsible for not only maintaining biological diversity, but also
improving local social welfare, guarding local security, and providing economic benefits
across multiple scales; objectives traditionally relegated to the development sector.
The Kanchenjunga Conservation Area Project (KCAP) is an ICDP established in
Nepal in 1997. Within KCAP, a community based hierarchy of management has been
instituted which advocates for equitable access to decision-making roles and benefits
distribution for all residents, that includes access to natural resources for livelihood
activities. Although several alternative livelihood capacity building initiatives have been
formulated to alleviate environmental pressures exerted via traditional extractive
livelihood strategies, major challenges are still evident (WWF 2006). For example,
higher elevation villages receive less access to community development programs and
capacity building initiatives despite residing in less productive lands (Muller-Boker &
Kollmair 2000; Ikeda 2005). Given the lack of alternatives sources of livelihood
activities, these villages continue to practice slash and burn agriculture, overgraze
pastures, and over harvest non-timber forest products (WWF 2006). The unequal
distribution of benefits has been especially taxing for poorer households who are now
heavily dependent on access to community natural resources (WWF 2006). Therefore,
conservation programs should identify and target those households most reliant on
resource access and extraction activities, and subsequently provide a means to create
70

sustainable livelihood strategies that will allow opportunities to overcome poverty while
alleviating natural resource pressures (Ellis 2000).
There is a need for conservation managers to more efficiently assess and identify
the characteristics and social aspects that are associated with varying levels of
community natural resource dependencies, especially at the household level, in order to
connect management with the local context. By identifying resource use patterns,
programs are able to direct strategies at those individuals (or groups) with a greater
success rate in terms of environmental sustainability (Vedeld et al. 2004). The
purposes of this research was twofold: 1) Assess levels of natural resource
dependencies for households within KCAP, and 2) Identify factors that affect levels of
natural resource dependencies among households.
Literature Review
Variability in natural resource dependencies within a community arise due to
fluctuations in socioeconomic conditions, values, beliefs, goals, and preferences
(Adhikari et al. 2004). This variability in dependency also changes between and among
individuals over time (Jumbe & Angelsen 2007), and is associated with affluence (Baral
& Heinen 2007). The wealth of a household does not necessarily lead to less utilization
of natural resources (Herrold-Menzies 2006), but will generally affect the level of
dependency on resources (Adhikari et al. 2004). An improved income might enable
households the opportunity to choose livelihood strategies that may be more dependent
on natural resources or cause detrimental environmental problems (e.g. timber
harvesting technology or the purchase of more livestock) (Herrold-Menzies 2006).
Also, households with higher incomes are often too busy with micro-enterprises
and lack time to participate in resource dependent activities (Herrold-Menzies 2006).
71

Households with higher incomes often have greater landholdings, which provide a
private source of natural resources to consume. Poorer households with less
landholdings rely more heavily on natural resource extraction and often own less
productive land (Vedeld et al. 2004). Although poorer households may be more
dependent on local natural resources (Reddy & Chakravarty 1999; Dev et al. 2003),
wealthier households often consume more resources (Agrawal & Gupta 2005). For
example, Adhikari et al. (2004) found that affluent families received three times more
forest benefits than poorer households in the middle hills of Nepal.
Besides income, other variables have been shown to have significant impacts on
household resource dependency in Nepal and elsewhere, which includes education,
age, gender, household size, occupation, landholdings, and spatial location of
household (Gunatilake 1998; Reddy & Chakravarty 1999; Ellis 2000; Adhikari et al.
2004; Vedeld et al. 2004; Maskey et al. 2006; Chandool 2007; Jumbe & Angelsen
2007). Education acts as a proxy for higher wages, and thus higher income allows for a
greater choice of economic activities that facilitates a lower level of resources
dependency (Gunatilake 1998; Ellis 2000). It has been demonstrated that education
has a negative effect on resource dependency (Gunatilake 1998; Adhikari et al. 2004).
Similarly, age has varying affects on dependency because older individuals might find it
easier to survive by collecting resources from the forest, instead of more laborious
agricultural work which might provide more income (Vedeld et al. 2004; Maskey et al.
2006). Also, the size of a household can affect resource dependency, both positively
and negatively. A greater availability of labor within a household can lead to a greater
availability in alternative income generating activities that do not rely on natural
72

resources. However, larger households also have a higher requirement levels to
survive and likely have higher resource dependencies (Gunatilake 1998; Maskey et al.
2006).
Furthermore, household spatial characteristics also affect resource dependency as
those households located closer to forests are more dependent (Gunatilake 1998;
Jumbe & Angelsen 2007), while households located near a market are less dependent
(Gunatilake 1998). Jumbe & Angelsen (2007) assessed natural resources dependency
levels among two different communities in Malawi. One of the villages was a
heterogeneous composition of varying migrant ethnicities located near a market
providing forest products. The other village had a primarily homogeneous population
located far from a forest products market. Members of the homogenous community
were less likely to be dependent on natural resources access and more likely to
participate in decentralized forest management practices. The heterogeneous
community was less willing to participate in community natural resources management
programs. The presence of higher forest product prices and access to a market also
increased local willingness to concentrate income strategies on forest related activities
(Jumbe & Angelsen 2007).
Adhikari et al. (2004) further analyzed the relationship between household
characteristics and common property resources used in order to assess whether poorer
households are able to gain greater access to community forests as a result of
institutional change. Findings revealed that land and livestock holdings, caste,
education, and household income strongly influenced benefits accrued from
decentralized conservation initiatives within forest user groups in the middle hills of
73

Nepal. The authors concluded that poorer households face more access restrictions
compared to wealthy households (Adhikari et al. 2004). Additionally, a participatory
rural appraisal (PRA) wealth ranking technique was applied to categorize residents into
three wealth groups of poor, middle wealth, and rich. Results indicated that wealthier
households harvested more community forest derived fuel wood, fodder, and leaf litter.
Also, households from a higher caste/race/ethnicity harvested more of all three forest
products, while households headed by a male consumed more resources. In addition,
wealthier households were more likely to perceive that they benefited from community
development activities funded through community forest initiatives revenue, included
drinking water, irrigation, schools, health posts, and temples (Adhikari et al. 2004).
Reddy & Chakravarty (1999) and Bahaguna (2000) assessed household
dependency on natural resources in the foothills of northern India. Both studies
identified households with less landholdings as more dependent, as were poorer
households. Dependency levels ranged from 37-76% and were measured as the
proportion of total household income derived from natural resources access. Income
activities dependent on natural resource access utilized within the study included wage
labor, fuel wood, fodder, NTFPs, and timber. Fuel wood and fodder collection
constituted approximately a third of the natural resources dependent income (Bahuguna
2000).
Baral and Heinen (2007) assessed how natural resources dependency affected
conservation attitudes among households located in two protected area buffer zones in
the western lowlands of Nepal. Resources dependency had a positive relationship with
conservation attitudes. The authors found that ethnic minorities and households with
74

more livestock were more dependent on natural resources (Baral and Heinen 2007).
Households with greater landholdings and affluence were less dependent on natural
resources. However, although the ethnic minorities were less affluent, they exhibited
higher natural resource dependencies, and were also less literate, but more aware of
forestry and wildlife management issues. Additionally, they held more positive
conservation attitudes. Household occupations and sizes lacked significant
relationships with natural resources dependency (Baral and Heinen 2007).
In Trinidad & Tobago, Chandool (2007) assessed household resource use
patterns and the factors that influenced levels of resource dependency. Eight variables
were examined and included: age, gender, education, landholdings, diversity of
occupations, household size, private agricultural land holdings, and length of residency.
However, only age and gender were significant predictors of resource dependency.
Younger and female-headed households were more dependent on community
resources. Chandool (2007) noted a lack of statistical relationships among other
associated variables due to the generally low level of natural resource dependency of
the communities at the research site.
Kanchenjunga Conservation Area Project
KCAP was created in April of 1997 as an Integrated Conservation Development
Project (ICDP) “to safeguard the biodiversity of the area, and improve the living
conditions of the local residents by strengthening the capacity of the local institutions
responsible for making decisions, which will effect the long-term biodiversity
conservation and economic development of the area” (WWF 2006, p. 2). KCAP was
originally created with financial and technical assistance provided by the World Wildlife
Fund for Nature (WWF); additional assistance was provided by the Integrated Centre for
75

Integrated Mountain Development (ICIMOD), the MacArthur Foundation, the Kadoorie
Agricultural Aid Association, and the Darwin Initiative. Management largely focuses on
enhancing local capacity to improve their livelihoods while simultaneously managing the
natural resources (WWF 2006).
KCAP is named after the third highest mountain (Mt. Kanchenjunga) in the world
(8,586 m), and also contains eleven additional Himalayan mountains with peak
elevations over 7,000 meters. The 2,035 km2 landscape is primarily comprised of high
elevation rocks and glaciers with only minimal arable land (2%). The area (see Figure
3-1) boasts very high biological diversity indices, and is home to several mammals of
conservation significance including the snow leopard and red panda (WWF 2006).
Although created following the model utilized during the creation of the successful
Annapurna Conservation Area Project (ACAP) in central Nepal, KCAP operates under
several extremely constricting conditions (Heinen & Mehta 1999). Tourism at ACAP
has been very successful with annual arrivals reaching over 75,000. The popularity of
ACAP as a tourism destination has been aided by the region’s close proximity to
primary population centers of Pokhara and Kathmandu, and the associated highly
developed tourism and transportation infrastructures (Nyaupane & Thapa 2004).
However, at KCAP annual tourist arrivals peaked at 800 and recently dipped to 175 due
to the lack of transportation infrastructure, tourism facilities, and the domestic Maoist
insurgency12 (WWF 2007).
12 The Maoist insurgency refers to the decade long civil war that recently ended with the rebel group integrated into mainstream politics. See Thapa (2004), Battarai et al. (2005), and Baral & Heinen (2006).
76

Figure 3-1. Map of KCAP (Source: WWF 2006)
many people that reside within the KCAP region are very poor with little access to
health and economic facilities. The conservation area is located in the northeastern
district of Taplejung. The district maintains one of Nepal’s lowest Human Development
scores13 (0.328). Less than half the population has access to toilet facilities, and there
is only one doctor for every 33,675 people (Central Bureau of Statistics 2001). The
entire mountainous region only has 37 km of unpaved roads. Primarily, livelihood
strategies have been subsistence agriculture and animal husbandry largely due to the
lack of external market linkages and lack of transportation infrastructures. Additional
livelihood activities include government employment, cottage industries, trade with
13 Human Development Index (HDI) scores are used to define well-being as a composite of education, life expectancy, and standard of living. In 2005, Nepal had an HDI Score of 0.534, and ranked 142 out of 177 countries (UNDP 2008).
77

neighboring Tibet, remittances14, and a low level of tourism activity (Muller-Boker &
Kollmair 2000).
Local livelihood strategies have exerted several pressures on the natural
resources of the region. More specifically, higher elevation households practice slash
and burn agricultural techniques due to unclear land ownership rights, poor soil
conditions, lack of arable land, and nonexistent market alternatives (WWF 2006). Also,
in higher elevations, meadows are negatively impacted by overgrazing, fuel needs, and
housing construction. Similarly, over harvesting of Non-Timber Forest Products
(NTFPs) is a prevalent environmental threat throughout the region. This has been
attributed to extremely high levels of household dependencies on these products for
their livelihoods, unclear landownership rights, and lack of external market linkages
(WWF 2006).
KCAP, aided by WWF, has employed several strategies to both alleviate
environmental pressures and enhance individual, community, and institutional
capacities for development and conservation. As of September 22, 2006, KCAP is the
first completely community-managed conservation area in Nepal, if not in Asia (WWF
2006). Management is achieved via a democratically elected hierarchy of management
comprised of user groups, mother groups15, and the leading authority of the
Kanchenjunga Conservation Area Management Council16. KCAP management has
14 Remittance is payments paid to friends and/or family members in a migrant’s home place of residence. The value of global remittances in 2008 was US $433 billion; US $328 billion was sent to developing countries (World Bank 2009). 15 Mother groups are a form of sponsored user groups intended to represent the interests of female residents. 16 The Management Council is the highest level KCAP management, comprised of locally elected individuals.
78
implemented several steps to aid local residents. For example, Community Forest User
Groups, representing 891 households, manage 47,772 hectares of forest lands, and a
rangeland management strategy has also been completed (WWF 2006). In addition, a
sustainable NTFP enterprises fund has been created to provide training on enhanced
collection and processing techniques. Several community development projects have
also been implemented and include savings and credit groups, toilet facilities, improved
drinking water systems, a health post, and female education funds (WWF 2006).
However, the effectiveness of these programs has been in question. Local
residents are unsure about KCAP goals and objectives. Muller-Boker & Kollmair (2000)
found that only 5% of residents were aware of the primary administrative organization.
Residents also held unrealistic expectations towards KCAP, in that while few could
identify conservation related objectives, most residents mentioned several objectives
that included large infrastructure developments. Furthermore, while most residents felt
KCAP made positive strides towards wildlife conservation, there has been an increase
in human-wildlife conflicts and associated retaliatory killings. Retaliatory killings of snow
leopards are common, especially within the Ghunsa Valley that contains over 40% of
the snow leopard’s habitat and is also the main tourist trekking route (Ikeda 2005; WWF
2006).
Overall, KCAP presented an excellent opportunity to assess the impact of
decentralized conservation efforts on natural resources dependency. The region lacks
infrastructure development and links to external markets (including tourism), which thus
restrains local economic activity to natural resources dependent sources. The purpose
of this study was to assess household levels of natural resource dependencies within
79

KCAP and subsequently identify the factors that lead to the associated dependencies.
The following research questions were formulated and empirically tested in this
research: 1) What are the levels of natural resource dependencies for households
within KCAP? 2) What factors affect a household’s level of natural resources
dependency?
Methods
A combination of qualitative and quantitative methods were utilized in this study.
The combination of both methods has been gaining credibility and relevance within the
development literature (Booth et al. 1998; Kanbur 2001; White 2002; Ellis & Freman
2004). A triangulation method was also utilized to both improve the data validity and
reduce the occurrence of researcher bias (Denzin & Lincoln 2000).
Data Collection
Data collection employed four methods and lasted for three months (October
through December 2008). First, project reports and publications were identified at
agency and government offices in the capital city of Kathmandu and in Taplejung.
Literature was targeted that reported on past and current programs that pertained to
policies and management issues with regards to natural resources access, use, and
dependencies. Second, participant observation techniques were employed to discern
household behaviors and patterns in order to develop a better understanding of
community context of how programs impact livelihood strategies on a daily basis.
Observation focused on access to and use of natural resources. Third, a Participatory
Rural Appraisal (PRA) wealth ranking (World Bank 2007) was conducted within each
village. PRA wealth rankings are used to create a comprehensive list of households,
and also to assimilate the researcher into the communities to facilitate data collection.
80

Fourth, a detailed household interview was conducted throughout the KCAP region.
The combination of data collection techniques were adapted from the United Kingdom
Department for International Development (DFID) sponsored LADDER project17 (Ellis &
Freeman 2004).
Two local research assistants were hired to help with the administration of the
household interview. Although the primary researcher previously lived in Nepal and
worked with communities in protected areas as well as being proficient in the national
Nepali language, local assistants aided in rapport building and minimized both cross-
cultural bias and non-sampling error. Technical words were avoided, and a professor at
Tribhuvan University, Kathmandu, Nepal assessed the accuracy of survey translation
from English to Nepali and then back to English.
Selection of Participants
A recent WWF (2006) survey identified 4,570 people that resided in 860
households within the KCAP region. Of the four Village Development Committees
(VDC) within KCAP, Lelep contained the largest percentage of population (47%),
followed by Tapetok (31%), Yamphudin (15%), and Olachan Gola (7%). Respondent
selection followed a systematic sampling method that targeted every fourth household
within every village throughout the region from a random start. Among selected
households, the head of household (≥18 years old) was asked to participate. If the
household head was unavailable, the next most knowledgeable adult was requested to
participate. Due to the region’s high rate of illiteracy, and overall unfamiliarity with
survey procedures, survey questions were verbally read to participants while research
17 LADDER stands for Livelihoods and Diversification Directions Explored by Research.
81

assistants recorded all responses (see Nyaupane & Thapa 2004). All approached
households agreed to participate (response rate = 100%), which provided a 25%
population representation (n = 205) that was deemed sufficient for categorical analyses
(Cochran 1977; Bartlett et al. 2001).
Instrumentation
The questionnaire was adapted from Ellis and Freeman (2004) and consisted of
nine sections. The questionnaire was pilot tested in the district center of Taplejung
among KCAP staff. The questions were altered as needed to improve clarity. The first
section assessed basic household compositions that included number of members,
gender, education levels, ethnicity/caste/race, occupations, housing construction
materials, and available facilities. The second section assessed household
membership characteristics in sponsored programs, level of interaction with agency
staff, and level of perceived benefits received from sponsored programs18 at both the
community and household levels. Section three assessed household agricultural assets
and productivity levels that that included levels of land ownership and quantity of
individual crop yields. The fourth section assessed the value of livestock and natural
resources consumption for the household, which included those natural resources found
within community forests. The fifth section identified the sources of income that
originated from the farm (e.g. wage labor, pensions, salaries, remittances, self
employment, and tourism activities).
Operationalization and Data Analysis
This study assessed two research questions.
18 Sponsored programs are locally comprised and driven by community groups that are aided with financial and or technical assistance provided by an outside organization.
82

Research question 1: What are the existing levels of natural resource dependencies among households?
Income activities considered to be dependent on natural resources access
included those related to livestock, agriculture, and community forests. Income not
dependent on access to natural resources included all off-farm sources such as
remittances, wage labor, salaries, cottage industries, and other activities including
tourism. Household dependency on natural resources was determined by assessing
the ratio of total household income compared to household income derived from natural
resources (see Gunatilake 1998; Bahugana 2000; Masozera, & Alavalapati 2004;
Chandool 2007; Jumbe & Angelsen 2007). An index of dependency was created by
dividing income dependent on natural resources by total income.
Research question 2: What factors affect natural resource dependencies among households?
A logistic regression model was conducted to identify household factors that affect
natural resources dependency (see Chandool 2007). The mean value of natural
resources dependency identified in the first research question was used as a cutoff to
create a binary value of either not dependent=0 or dependent=1. Ten predictor
variables were utilized within the model representing the three constructs of economic,
social, and access variables. Economic variables included household landholdings and
remittances. Social variables included the highest education level achieved by an adult
household member, household size, number of dependents, and caste/race/ethnicity.
Access variables included if the household was visited by a KCAP officer or had visited
a KCAP office in the past year, had received training sponsored by KCAP, or had
received a loan from a sponsored group.
83

Results
Profile of Household Respondents
Of the 215 completed surveys 205 were usable. The majority of represented
households were of Sherpa (53%) and Limbu (41%) ethnicities, and headed by males
(86%) with less than a year of completed education. Most households19 were located in
Lelep VDC (59%), followed by Tapetok VDC (17%), Yamphudin VDC (17%), and
Olanchan Gola VDC (7%). The majority of households (76%) were located in the lower
elevations (between 1,380 and 2,249 meters), while others (24%) were at higher
elevations (between 2,250 and 3,000 meters). Additional household characteristics are
presented in Table 3-1.
Table 3-1. Household characteristics Characteristic Mean Std. dev. Max Min. Economic Variables Land owned (ropani1) 22.83 23.62 150 0 Remittance 37,282 69,576 500,000 0 Social Variables Highest education level 5.81 4.63 16 0 Household size 5.87 1.50 10 1 Number of dependents 2.22 1.37 6 0 Caste/ race/ ethnicity 0.53 0.32 1 0 Access Variables Household visits by KCAP staff 0.21 0.47 1 0
Household member visits to a KCAP office 0.15 0.36 1 0
Training participation 0.16 0.36 1 0 Borrowed loans (NRs2) 3,930 14,579 200,000 0 Additional Variables Total Livestock Units 4.51 5.21 49 0 Elevation (meters) 2,205 554 3,595 1,380 1 1 USD = 75 NRs 2 1 hectare = 19.65 ropani
19 The spatial distribution of communities was similar to that identified by WWF (2006).
84

The average household had six members (of which 2 were dependents), was
located within an 80-minute walk of a KCAP office and owned 23 ropani20 of land. Over
three quarters of households (78%) had borrowed a loan from a sponsored program,
while only a few had been visited by a KCAP staff member (21%) or had visited a
KCAP office (15%). Six categories of off-farm sources of income were identified. The
most prevalent source of off-farm income was remittances (32%), followed by tourism
(14%), private industry (6%), government (3%), wage (3%), and casual labor (3%).
Research Question 1: Levels of Natural Resources Dependency
The composition of stated household incomes varied throughout the region.
Table 3-2 presents the mean household values of income derived via different activities.
On-farm income values were heavily skewed towards the maximum value, the bottom
half of households earned less than NRs21 30,000 annually from on-farm activities. In
addition, over half the population earned less than NRs 10,000 annually from livestock
activities, and less than NRs 20,000 from off-farm activities. The average level of
dependency on natural resources was 63.75%. The most dependent quarter of the
population was at least 90% dependent on natural resources access, while the least
dependent quarter of the population was less than 38% dependent on natural resources
for household income. Elevation was significantly associated with household
dependency on natural resources access (F = 9.557, p value = 0.002). Households
located at higher elevations had the highest levels of dependency with a mean of
74.61%, while households at lower elevations were slightly less dependent at 60.33%.
20 1 hectare = 19.65 ropani. 21 At the time the field research was conducted (October 1st, 2008) 1 USD = 75 Nepali Rupees (NRs).
85

Table 3-2. Sources of household income and dependency on natural resources access Income Sources Mean (NRs) Std. dev Min. Max On-farm 43,464 39,874 0 230,000 Livestock 15,056 15,873 0 110,000 Off-farm 55,992 74,875 0 550,000 Total natural resources income 58,524 45,489 0 25,000 Total income 114,517 96,630 0 630,000 Natural resources dependency 63.75% 0.2874 0% 100% Higher elevation households 74% 0.2572 0% 100% Lower elevation households 60.03% 0.2876 8.47% 100%
Research Question 2: Factors Associated With Natural Resources Dependency
Results of the logistic regression model utilized to assess the factors that affect
household dependency on natural resources access are presented in Table 3-3. The
overall model was statistically significant including four individual predictor variables.
Table 3-3. Logistic regression of household natural resources dependency Variable Name Coefficient Std Error Wald Sig. Exp (B) Economic Variables Land ownership 0.007 0.009 0.623 0.430 1.007 Remittances (n/y) -3.976 *** 0.579 47.102 0.000 53.292 Social Variables Highest education -0.064 0.048 1.806 0.179 0.938 Household size 0.302 * 0.166 3.311 0.069 1.353 Dependents -0.403 ** 0.187 4.668 0.031 0.668 Caste/ Race/Ethnicity 0.176 0.394 0.200 0.655 0.838 Access Variables Staff visit (n/y) 0.280 0.483 0.337 0.562 0.756 Member visit (n/y) -0.470 0.586 0.643 0.423 1.600 Training (n/y) -0.175 0.528 0.109 0.741 1.191 Loans (n/y) 1.146 *** 0.429 7.125 0.008 0.318 Chi-squared (10) = 94.575; Prob (Chi-squared) ≤ 0.001; R-Squared = 0.210, -2 log likelihood = 187.029, Cox & Snell = 0.370. Overall percent correct = 81.5%.
The economic variable of remittances was negatively associated with natural
resources dependency; however, the access variable of households that received loans
was positively associated. Therefore, households that were able to supplement their
incomes with remittances were less likely to be dependent on natural resources for their
income. However, those households with access to available credit from sponsored
86

programs were most likely to actually hold loans. The social variables of household size
and number of dependents were also both significant. Households with more
dependents were less likely to be dependent on natural resources. However, larger
sized households were more dependent on natural resources.
Discussion
The ability to identify household natural resource use patterns has been shown to
drastically enhance the sustainability of conservation projects (Vedeld et al. 2004). An
improved identification methodology increases the effectiveness of capacity building
programs by efficiently targeting the most heavily dependent households (Vedeld et al.
2004). Similar to Chandool (2007) and Jumbe & Angelsen (2007), this study assessed
the level of household dependency on natural resources within KCAP, and identified
associated factors that affect dependency.
Results of this study indicate that households within KCAP were heavily
dependent on natural resources for their income. The average household dependency
on natural resources for income in developing countries is 22% (Vedeld et al. 2004).
However, this study found that 64% of households in KCAP were dependent, and a
greater proportion of those in higher elevations were dependent (74.6%) than
households in lower elevations (60.3%).
Variations in household dependency on natural resources access have been
attributed to socio-economic characteristics, values, beliefs, and preferences
(Gunatilake 1998; Dev et al. 2003; Adhikari et al. 2004; Vedeld et al. 2004; Herrod-
Menzies 2006; Maskey et al. 2006; Allendorf 2007; Baral & Heinen 2007). Household
affluence has been shown to decrease natural resources dependency by allowing an
opportunity to choose less resource dependent livelihood strategies (Dev et al. 2003;
87
Adhikari et al. 2004; Herrod-Menzies 2006; Baral & Heinen 2007). In addition, less
affluent households are often more reliant on natural resources access due to
inadequate land ownership (Dev et al. 2003; Vedeld et al. 2004). However, in this study
land ownership was not a significant economic predictor of dependency. Remittances
were found to be a significant indicator of natural resources dependency. Households
that received remittances were able to supplement their income without reliance on
natural resources based activities. This finding is common throughout Nepal.
Remittances in Nepal were valued at over US $1.2 billion in 2006 and comprised more
than 14.6% of Nepal’s national GDP in 2006 (World Bank 2008).
Other social variables that have been shown to have significant effects on natural
resources dependency in Nepal include education, household size, and spatial location.
Gunatilake (1998) and Adhikari et al. (2004) found that education led to higher paying
livelihood activities which resulted in decreased natural resources dependency.
However, education was not a significant predictor of natural resources dependency in
this study. The lack of significance may be attributed to the low overall rate of education
within the KCAP region. Heads of households averaged less than one year, and less
than six percent of individuals at least thirty years of age had ever attended school.
The size of a household has been shown to have both positive and negative
impacts on natural resources dependency (Gunatilake 1998; Maskey et al. 2006).
Households with more members require more income, but have more people to help in
natural resources related activities. However, more members could also provide an
opportunity to participate in alternative livelihood activities that are not reliant on natural
resources. This study found that households with more members were more likely to be
88

dependent on natural resources; however, households with fewer dependents were less
dependent.
Caste/race/ethnicity among households in Nepal have been significant predictors
of natural resources dependency in the literature (see Gunatilake 1998; Agrawal &
Gupta 2005; Allendorf 2007). However, these studies were conducted in the lowland
terai region of Nepal where the caste system is more prevalent. The population in this
study primarily consisted of the two different ethnic minorities of Sherpa and Limbu.
Therefore, caste/race/ethnicity failed to have any predictive significance in regards to
natural resources dependency.
Household spatial characteristics have been shown to be significant predictors of
household natural resources dependency (Gunatilake 1998; Jumbe & Angelsen 2007).
However the spatial distribution of households in this study was rather homogenous. All
households were extremely disconnected from external commercial market linkages (at
least by a three day walk), and the placement of four KCAP offices throughout the
region provided easy accessibility to sponsored programs for most households.
Variables associated with access have been frequently identified and researched
the decentralized conservation literature. Common significant variables have included
access to savings and credit programs, participation in sponsored programs,
participation in capacity building training programs, and frequent communication with
project staff via household visits and office visits (Dercon & Krishna 1996; Rew & Rew
2003; Agrawal & Gupta 2004; Acharya et al. 2005). Access to loans provided within the
sponsored program had a positive significant affect on natural resources dependency.
Participation in training programs, and interactions with KCAP staff failed to significantly
89

affect resources dependency. The lack of significant affect of KCAP staff interaction
and training programs could be explained by the overall small frequency of households
experiencing those situations. Less than 20% of households had direct communication
with KCAP staff within the past year, and only 16% had participated in a training
program.
Social mobilization techniques and training programs are targeted toward
achieving the overall aim of KCAP which is to protect the area’s biological diversity by
alleviating environmental pressures and concurrently improving livelihoods by
“strengthening the capacity of the local institutions for making decisions” (WWF 2006, p
1). The lack of social mobilization strategies and the absence of a region-wide system
of KCAP sponsored capacity development projects has detrimentally limited the
availability of opportunities for households to choose livelihood activities that are less
dependent on natural resources.
Conclusion
Results of this study indicate that households within KCAP are heavily dependent
on access to natural resources for their livelihood strategies. The sustainability of
KCAP as an ICDP is therefore contingent on project intervention via social mobilization,
training programs, and participatory inclusion in decision making. Results of this study
highlight the need for further research. An empirical study of consumption levels among
households should be assessed in terms of fuel wood, timber for construction, and
grazing (see Adhikari et al. 2004). Additionally, given the prevalence and impact of
remittances on natural resources dependency (31% of households received remittances
that constituted about two-thirds of their off-farm income), a study should be conducted
in regards to the factors that affect household acquisition of remittances. In addition,
90

providing externally funded training programs that target the adoption of alternative
livelihood activities are futile if there is disconnect with commercial markets. Further
research needs to be conducted on the potential to develop market linkages within the
KCAP region.
91

CHAPTER 4 LIVELIHOOD STRATEGIES AND DIVERSIFICATION FACTORS AMONG
HOUSEHOLDS WITHIN KANCHENJUNGA CONSERVATION AREA, NEPAL
Introduction
Nepal is considered a leader among least developed nations with respect to
environmental policy and conservation programs. The country has designated over
18% (26,695 km2) of its land as protected status in 17 different locations. More
importantly, it has been a pioneer in establishing decentralized conservation
management programs within parks and protected areas. Such programs highlight the
link between conservation and socio-economic development among residents within
protected areas. In 1986, the Annapurna Conservation Area Project (ACAP) became
the first protected area Integrated Conservation and Development Project (ICDP)
implemented by a local non-government organization in collaboration with the World
Wildlife Fund for Nature (WWF). The concept behind the project was economically self-
sustainable conservation with a focus on development that emphasized popular local
participation via a decentralized form of management (Sherpa et al. 1986). ACAP is
regarded as a model of success within the discourse of ICDPs because it has provided
increased development, improved distribution of benefits, empowered local residents,
and enhanced biological conservation (Nyaupane et al. 2006). However, an equitable
distribution of benefits, costs, influence, and a diversification of livelihood strategies has
been elusive in ACAP, largely due to the participatory exclusion of disadvantaged
groups, varied levels of natural resource dependencies, and disproportionate regulatory
and financial structures (Heinen & Mehta 1999; Nyaupane & Thapa 2004; Bajracharya
et al. 2005; 2006; Baral et al. 2008).
92

The ICDP framework has been promoted in developing countries as a means to
maximize benefits for local people and minimize costs endured due to biodiversity
conservation measures (Brandon & Wells 1992). Since its advocacy, ICDPs have
proliferated throughout developing countries and have garnered major support for
conservation (McShane & Wells 2004). ICDPs are based on the idea that if programs
improve the livelihoods of local people, then they would consume fewer natural
resources, and thus minimize pressures within protected areas (Brandon & Wells 1992;
Brandon et al. 1998). Additionally, ICDPs are based on the paradigm that projects need
to be focused on providing for the local population, and positively responding to
changes in their livelihoods (Berkes 2007).
However, results from existing ICDPs have shown varied results and have led to
a debate arguing both for and against them (Wells et al. 1992; Brandon 1997; Oates
1999; McShane & Wells 2004; Berkes 2007). Neuman (1997) states that ICDPs lack
true participation, and serve rather as a coercive form of conservation that resembles “ill
fated colonial efforts to convert shifting cultivators into progressive farmers” (p. 564).
Additionally, most ICDPs are created by western-based international organizations with
large amounts of funding, and little site-specific knowledge of cultural and institutional
frameworks (Oates 1999; McShane & Wells 2004). Furthermore, doubts have arisen as
well regarding the presence of an economic threshold that once achieved would
alleviate the need for natural resources conservation (Stem et al. 2005)
Conservation programs “are only valid and sustainable when they have the dual
objective of protecting and improving local livelihoods and ecological conditions”
(Ghimire & Pimbert 1997, p. 8). Program success is inherently dependent upon
93
ensuring an equitable distribution of benefits while simultaneously diversifying income
generating activities thus, reducing dependency on natural resources (Chapin 2004;
McShane & Wells 2004). Based on an assessment of ICDPs worldwide, the UK
Department for International Development (DFID) (2007) identified three major
shortcomings: 1) local development is usually assessed in terms of generation of cash,
increased production or jobs, while wider social issues and livelihoods concerns are
often ignored, 2) project assessments usually focus on the numeration of outputs
achieved and often create unintended consequences for livelihoods, and 3)
assessments usually focus on generation of local incomes instead of the promotion of
commercial viability. Given these limitations, and in order to overcome these major
shortcomings, the use of the sustainable livelihoods framework for project assessments
has been advocated (DFID 2007).
Within the theoretical lens of the sustainable livelihoods framework, the purpose of
this study was to assess two fundamental elements identified as essential to
sustainable integrated conservation and development projects. Specifically, within the
Kanchenjunga Conservation Area Project (KCAP) ICDP in Nepal, this research will: 1)
identify the current levels of diversification among livelihood strategies utilized by
households; and 2) identify potential factors associated with the adoption of existing
dominant livelihood strategies.
Findings of this research are beneficial along a range of scales from the local
community level to the broader body of academic knowledge. Results will enhance the
management of community based natural resources, and promote strategies that will
create more sustainable community capacity building programs while concurrently
94

alleviating pressures on the area’s extravagant biological diversity. Results will aid
program managers to identify household characteristics strongly associated with those
who lack access to livelihood assets (financial, social, physical, natural, and human)
necessary to graduate to an improved livelihood strategy. The potential for ICDP
sustainability would be greatly enhanced by the ability to identify disadvantaged
households and target project spending while organizational costs are minimized.
Findings will also aid policy makers to strengthen their ability to identify current
environmental pressures that are most contingent for further policy applications, while
simultaneously apply strategies that are most critical to a household’s livelihood.
Literature Review
Sustainable Livelihoods Framework
The primary objective of an ICDP is to provide for diversified sustainable livelihood
strategies with an emphasis on sustainable development that ensures biological
conservation (Scoones 1998). In 1987, the World Commission on Environment and
Development first advanced the term “sustainable livelihoods” in relation to poverty
alleviation and environmental protection through the promotion of participation and
sustainable development (WCED 1987). Subsequently, the 1992 UN Conference on
Environment and Development promoted sustainable livelihoods as a means to link
socioeconomic and environmental concerns. These two international forums were
essential to the formation of the sustainable livelihoods framework (Scoones 1998).
The sustainable livelihoods framework has been championed in both the
community development and environmental management disciplines, as it maintains a
shift of paradigm towards a more people-centered development approach within a
community (Ashley & Carney 1999). The framework emphasizes addressing
95

community assets rather than primarily focusing on a community’s needs (Chambers &
Conway 1992; Scoones 1998; Ashley & Carney 1999; Carney et al. 1999; Ellis 2000;
DFID 2007). The sustainable livelihoods framework is currently used by international
development agencies such as: United Nations Development Program (UNDP), Food
and Agriculture Organization (FAO), United States Agency for International
Development (USAID), CARE-International, Oxfam, and the United Kingdom
Department for International Development (DFID) (Frankenberger et al. 2000).
Chambers & Conway (1992) first defined a livelihood as “comprised of the
capabilities, assets (stores, resources, claims and access) and activities required for a
means of living. A livelihood is sustainable when it can cope with and recover from
stresses and shocks and maintain or enhance its capabilities and assets both now and
in the future, while not undermining the natural resource base” (p. 7). Ellis (2000)
adapted this definition with more emphasis on access in relation to social institutions
that might impact an individual from capacity to fulfill its consumption requirements
based on social inequalities such as, caste, race, gender, ethnicity, beliefs, etc. His
definition is “a livelihood comprises assets (natural, physical, human, financial and
social capital), activities, and access to assets (mediated by institutions and social
relations) that collectively determine the living gained by an individual or household” (p.
10).
The sustainable livelihoods framework has four main components (DFID 2007).
First, a population lives within a vulnerability context in which it is exposed to risk in the
forms of sudden shock, trends over time, and seasonal change. Examples of risk
include drought, tourism seasonality, or labor migration. Second, people utilize assets
96

to meet their livelihoods. These assets include social (networks, norms, trust,
institutions), human (skills, knowledge, and labor), natural (natural resources), physical
(infrastructure including transportation, water, and energy), and financial capital
(savings, income, and credit). Third, these assets are utilized by residents through
livelihood strategies in order to create their livelihood outcomes. Lastly, transforming
structures and processes shape and influence the ability of individuals to access
livelihood assets as a means to overcome risks within the vulnerability context. It is
within these transformative structures that programs can impact the linkage between
policies, institutions, and livelihood activities (DFID 2007). Figure 4-1 depicts the
accessibility of resources, controlled by institutions and norms that are used within
livelihood strategies to create an outcome that enhances pre-existing assets to
overcome vulnerability to risks and shocks.
Figure 4-1. Sustainable livelihoods framework (Source: DFID 2007)
The sustainable livelihoods framework deviates from purely economic
measurements such as primary income, gross domestic product, and consumption
97

metrics in poor regions, and levies emphasis on breaking accessibility barriers to
improve the quality of life via institutions, policies, and processes (Scoones 1998).
However, Ellis (2000) delineates the importance of a lack of priority on temporal
changes in access to assets. Individuals are continually changing their livelihood
strategies concurrently within the social institutions that govern access, especially in
developing countries (Ellis 2000). Projects that utilize the sustainable livelihoods
framework also emphasize resident empowerment and capacity building to effectively
enhance access to available resources that allows them to choose strategies in order to
negotiate vulnerabilities, and incrementally improve their livelihood assets (Ellis 2000).
The emphasis on diversification of livelihood strategies within the sustainable
livelihood framework has been the catalyst for numerous international development
agencies to utilize the framework (Brocklesby & Fisher 2003). It promotes the creation
of livelihood enhancement beyond just employment. Projects that have used the
framework have realized that a single source of income is not sufficient to truly aid in
poverty alleviation and environmental management in developing regions (Ashley &
Carney 1999).
For example, tourism promotion as a pro-poor strategy in developing regions has
thus far been unsuccessful due to a primary emphasis levied on one single strategy
(Tao & Wall 2009). Tourism is not a panacea for developing countries and is not a
reliable source of income in many marginal economies, but it may supplement other
income sources and help disperse vulnerabilities to risk (Tao & Wall 2009). Tourism
seldom occurs in isolation as it competes for the use of scarce resources; therefore,
tourism development projects need to be initiated as a complement to existing activities
98
(Ashley 2000). A comprehensive understanding of the link between tourism and other
sectors requires an analysis of the whole context in which tourism exists (Tao & Wall
2009). A sustainable livelihoods approach is more practical, especially within common
situations during which communities and individuals sustain themselves by multiple
activities rather than discrete jobs. Therefore, advocates of sustainable development
should “explore how tourism might fit into a suite of livelihood strategies, contributing to
the achievement of sustainable livelihood outcomes” (Tao & Wall 2009, p. 98).
Factors that Affect Livelihood Diversification
Rural livelihood diversification is defined as “the process by which rural
households construct an increasingly diverse portfolio of activities and assets in order to
survive and to improve their standard of living” (Ellis 2000, p. 15). Ellis delineates five
main categories of livelihood activities: 1) non-farm (unskilled labor, wage employment,
and non-farm business profits), 2) agriculture (net income from crop sales, own-
consumption, and off-farm labor), 3) transfers (national and international remittances22,
pensions, and payments to the poor), 4) livestock (net income from sales of cattle and
poultry, and own consumption), and 5) rental income (from ownership of assets,
including land, machinery and water).
Varying levels of livelihood diversification are often associated with the
disproportionately available access to necessary livelihood assets based on local,
regional, and national institutions and norms (Ellis 2000; Agrawal 2001; Blaikie &
Springate-Baginski, 2003). Associated access is also often correlated to the role of
22 Remittance is the money that someone sends to friends or family members that live somewhere else. Globally, remittances are a large source of financial transactions with over 190 million migrants sending US $433 billion in 2008, of which US $328 billion went to developing countries (World Bank 2009).
99

participation in project planning, management, and capacity building programs which
are based on pre-existing power structures linked to socio-economic characteristics
(Rew & Rew 2003; Agrawal & Gupta 2004). Less affluent households are usually more
dependent on natural resources for their livelihoods but have less access to them
(Adhikari et al. 2004). Without access to resources, poorer households are more likely
to have less diversified livelihood strategies, and thus are more dependent on local
natural resources in protected areas (Barret et al. 2001; Bhandari & Grant 2007).
Households are better suited to cope with vulnerability to shocks such as drought
and market seasonality with a more diverse livelihood strategy (Ellis 2000). However,
disadvantaged and poorer households more often bear an unequal share of the costs
associated with conservation. High levels of resource dependency and the lack of
participation roles in community management prevent poorer households from the
opportunity to either enhance their livelihood strategies or to graduate to a higher order
strategy (Scoones 1999; Ellis 2000). Given that disadvantaged households are held to
subservient roles in decision-making and only allowed minimal access, if at all, to
regional social, physical, financial, and environmental assets; the ability to achieve a
diverse livelihood strategy is severely limited (Agrawal 2001; Rew & Rew 2003; Agrawal
& Gupta 2005).
Several income based strategies have been employed to characterize livelihood
strategies. Barret et al. (2006) compared off-farm and on-farm income proportions to
total incomes and found that as total income rose, the number of strategies followed
suit. Dercon & Krishna (1996) identified that total income was related to number of
income sources, household characteristics, and access to credit. Ellis & Mdoe (2003)
100

indicated that poverty was strongly associated with lack of land and livestock, as well as
the inability to secure off-farm employment alternatives. These methods of analysis are
counterintuitive to the sustainable livelihood framework that emphasizes an analysis of
existing asset allocations beyond need discrepancies.
In Nepal, Bhandari & Grant (2007) found that agricultural production alone was not
a viable livelihood option, and livelihood security was based on landholdings, manpower
within the family, and access to agricultural technological inputs. The authors call for
empowerment and policies to provide local residents with adaptable income generating
activities, resilient resource management institutions and enhancement of knowledge,
skills and social capital (Bhandari & Grant 2007). These methods are also based on
externally driven assumptions that categorize activities into arbitrarily significant
employment sources. Additionally, Acharya et al. (2005) found that while functional
literacy programs are good initiatives in Nepal, participation in group savings and credit
programs provide the impetus to help illiterate rural women initiate small scale economic
activities that are effective in the absorption of the female workforce.
In Kenya, Brown et al. (2006) found several key characteristics that statistically
differentiate households that pursue low, medium, and high return livelihood strategies.
Brown et al. (2006) utilized cluster analysis and identified five livelihood strategies that
include part-time subsistence, mixed smallholders, staples producers, off-farm skilled
employment, and diversified commercial. The latter two strategies provided the highest
rates of return. Furthermore, household location, size, and farming experience were
significant predictors of households that pursued a livelihood strategy with lower rates of
return. Access to credit and remittances were significant predictors to pursue a higher
101

rate of return livelihood strategy. The authors state that the results should facilitate
specific interventions designed to improve household livelihoods (Brown et al. 2006).
Kanchenjunga Conservation Area Project
Kanchenjunga Conservation Area Project (KCAP) is located in the northeast
portion of the district of Taplejung, and was officially created as an ICDP in 1997. The
World Wide Fund for Nature (WWF), MacArthur Foundation, Kadoorie Agricultural Aid
Association, and the Darwin Initiative have provided financial and technical assistance.
KCAP received its namesake from the third highest mountain in the world (Mt.
Kanchenjunga) and is also home to eleven other mountains over 7,000m. The area
consists of 2,035 km2 of land composed primarily of glaciers and rocks (65%), forests
(24%), and a small amount of arable land (2%). The area has biological significance
with several endangered animals including the red panda, snow leopard, grey wolf,
Himalayan black bear, Himalayan Tahr, blue sheep, and musk deer (WWF 2006).
KCAP has an international trans-boundary conservation significance by maintaining
shared borders to the East with the Khangchendzonga Biosphere Reserve in Sikkim,
India and to the North with the Qomolangma Nature Preserve in Tibet, China (See
Figure 4-2). KCAP is a vital component for the eventual creation of an international
Kanchenjunga mountain complex conservation area (WWF 2006).
102

Figure 4-2. Map of KCAP (Source: WWF 2006)
Although KCAP creation paralleled the successful model utilized by the Annapurna
Conservation Area Project (ACAP), several limiting factors exist at KCAP. ACAP has
an extensively developed tourism infrastructure, is centrally located, and easily
accessible with a transportation network that includes paved roads and an airport with
several daily flights (Nyaupane & Thapa 2006). ACAP has also been highly successful
in attracting tourists and trekkers with over 75,000 entrance permits sold annually
(Nyaupane & Thapa 2004). Conversely, KCAP is one of the most sparsely populated
and remotely located protected areas with only rudimentary tourism facilities that cater
primarily to self-contained group tourists. Tourist arrivals peaked at 800 in 2001 and
dropped to 175 in 2006 (WWF 2007). The historic paucity of tourist arrivals and more
103

recent decrease has been attributed to the poor or non-existent transportation options,
lack of tourism infrastructure, and the domestic Maoist insurgency23 (WWF 2007).
Enhancing Local Livelihoods
The KCAP region is sparsely populated and comprised of 4,570 people in
approximately 860 households, of which 48% are of Limbu and 25% are of Sherpa
ethnicity (WWF 2006). The main sources of income include subsistence agriculture and
animal husbandry. Supplemental sources of income include cottage industries, trade
with Tibet, remittances24, government, military, and a small volume of tourism (Muller-
Boker & Kollmair 2000). The lack of productive land, civil infrastructure, and access to
markets and geographic isolation has contributed to the area being one of the poorest in
Nepal. Taplejung district, where KCAP is located, has the sixth lowest Human
Development Index25 score (0.328) in Nepal. Over one third of the residents live below
the poverty level, and less than 10% have the capability to produce sufficient quantities
of food for dietary subsistence (WWF 2006).
The aim of KCAP is “to safeguard the biodiversity of the area, and improve the
living conditions of the local residents by strengthening the capacity of the local
institutions responsible for making decisions, which will effect the long-term biodiversity
conservation and economic development of the area” (WWF 2006, p. 1). Therefore,
one of the project’s primary objectives is to strengthen the capacity of local communities 23 The Maoist insurgency was a decade long civil war between communist rebel group and the democratic national government; however, the conflict officially ended and the rebel group has been integrated into the government. See Thapa (2004), Battarai et al. (2005), and Baral & Heinen (2006). 24 In Nepal alone, remittances accounted for over 14.6% of the national gross domestic product in 2006, totaling over US $1.2 billion (World Bank 2009). 25 Human Development Index (HDI) scores are used to define well-being as a composite of education, life expectancy, and standard of living. In 2005, Nepal had an HDI Score of 0.534, and ranked 142 out of 177 countries (UNDP 2008).
104

to manage their natural resources while concurrently promoting sustainable livelihoods
and opportunities to reduce the pressure on natural resource, and thus enhance
individual, community, and institutional capacities for development and conservation.
Several accomplishments were achieved at KCAP during the first ten years of
existence in regards to enhancement of local livelihoods. Multiple programs have been
created to aid local financial sustainability and livelihood enhancement that includes:
several savings and credit groups, a non-timber forest product (NTFP) enterprises fund,
and a livestock insurance program to compensate instances of wildlife depredation. A
few local residents were also provided the opportunity to attend a national level NTFP
trade show. Additional community development programs initiated within KCAP include
a child day care center, a micro hydro electric project, drinking water systems, over
1,200 meters of trails, suspension bridges, toilets, a health post, an irrigation canal,
stone fences, and green houses (WWF 2006).
Livelihood Challenges
Although several positive strides appear to have been accomplished by WWF,
there has been a dearth of independent research conducted within KCAP. Muller-Boker
& Kollmair (2000) conducted a household survey one year after project initiation and
found that only a very small percent (5%) of individuals could identify WWF as the
primary organizational agency. Residents also perceived that successful wildlife
conservation activities had contributed to increased frequencies of livestock predation
and crop damage (Muller-Boker & Kollmair 2000). Furthermore, local resident
perceptions of project objectives were heavily skewed towards economic and
infrastructure related initiatives, and only a few conservation related objectives. In
addition to positive attitudes towards capacity building programs, there also existed
105

perceptions of unequal access to such programs due to social stratification based on
ethnicity, proximity to project offices, and the Maoist insurgency (Muller-Boker &
Kollmair 2000). A survey conducted seven years later by WWF (2007) found that
resident expectations of project objectives were still dominated by a hope for large
infrastructure developments.
Several challenges to obtaining a sustainable livelihood have been identified within
KCAP. Reasons include diminished agricultural capacities, unclear land tenure rights,
minimal productive land available and a lack of land ownership, socially inequitable
labor habits, food security issues, and the absence of established links to market
functions (WWF 2006). Slash and burn techniques are practiced around villages in
higher elevations (above 3,000 m) due to less available arable land, and are thus more
dependent on natural resources for their livelihoods which include resources for
cooking, heating, and economic purposes such as NTFPs (WWF 2006).
Human-wildlife conflicts and international demand for traditional medicine have
contributed to an increased prevalence of poaching and retaliatory killing of large
mammals, including snow leopards (Ikeda 2005; WWF 2006). The degradation of snow
leopard habitat and the corresponding decrease in natural prey has resulted in an
increase in livestock depredation and human-wildlife conflict (WWF 2006). Ikeda (2005)
found an abundance of retaliatory killings of snow leopards especially in the Ghunsa
Valley where the habitat coincided with yak pastoralism. The Ghunsa Valley contains
40 percent of the available snow leopard habitat in KCAP, and is also an integral portion
of the tourist trekking route. The average yak herd size was 36, and small to medium
herd sizes were most susceptible to killings, which jeopardizes herder livelihoods (Ikeda
106

2005). The annual economic loss due to snow leopard predation ranged from $54 to
$405, or from one to six animals and averaged $168 or 2.2 yaks. Average net income
per head was $54. Herders with neutral attitudes toward KCAP had negative views
towards snow leopard conservation policies. They also complained about increased
restrictions on fuel wood collection, a ban on snow leopard killings without
compensation, and insufficient project management reliability and transparency (Ikeda
2005).
Methods
The principal objective of this study was to assess discernable differences
between current livelihood strategies, and the associated ability to evolve to more
effective livelihood strategies within the Kanchenjunga Conservation Area. This study
followed a series of both qualitative and quantitative methodologies similarly utilized by
the DFID sponsored LADDER26 project (Ellis & Mdoe 2003; Ellis & Freeman 2004). A
triangulation method was employed to improve the validity of the data collected from
several sources, and also to reduce researcher bias (Denzin & Lincoln 2000).
Data Collection
Data collection occurred for three months (October through December 2008) and
utilized four methods. First, a review of KCAP project documents available in the capital
city of Kathmandu and the research site was completed. Information was examined
regarding past and current projects, policies, programs, or any other management
issues that might have been pertinent to the research. Second, participant observation
with respect to livelihood activities was conducted among local residents, project staff,
26 LADDER stands for Livelihoods and Diversification Directions Explored by Research.
107

and other associated individuals. Third, a participatory rural appraisal (PRA) wealth
ranking (World Bank 2007) was performed which consisted of a selection of key
informants and community households in ascending order based on affluence. The
PRA wealth ranking exercise aids researchers in assimilating into study site
communities, and enhances the capability of a more robust data collection commonly
used in conjunction with interview surveys (Grandin 1988; Ellis & Freeman 2004; World
Bank 2007). The final step consisted of an on-site survey (adapted from Ellis &
Freeman 2004), administered among a random sample of households.
It is worth noting that the primary researcher speaks fluent Nepali and had
previously lived in Nepal for over two years as a US Peace Corps volunteer in the
Department of National Parks and Wildlife Conservation. In addition to the primary
researcher, local research assistants were also hired and trained to administer the
survey utilizing local dialect where needed, which also helped to build local rapport in
the sampled communities.
Selection of Participants
The survey was administered to adults following a systematic sampling method
applied to the entire KCAP population among the four Village Development Committees
(VDC) of Lelep, Tapetok, Yamphudin, and Olachan Gola. Participant selection utilized
the comprehensive list created through the PRA wealth ranking, and then from a
random start, whereby every fourth household was selected. Due to the high
prevalence of illiteracy, and lack of familiarity with survey procedures, questions were
verbally administered while the interviewer recorded responses. The head of
households (≥18 years of age) were targeted. In their absence, the next most
knowledgeable adult was interviewed at their place of residence (see Nyaupane &
108

Thapa 2004). Every targeted house chose to participate (response rate = 100%), and
205 of the 215 surveys were usable in the analyses27.
Instrumentation
The questionnaire assessed household livelihood assets, levels of access, and
coping abilities within nine detailed sections. The first section assessed demographic
characteristics in regards to education, occupation, and race/caste/ethnicity. The
second section measured earned agriculture-related household income. Section three
pertained to income generated from livestock, privately owned natural resources and
community based natural resources, including NTFPs. The fourth section identified the
presence of off-farm income sources and household responses to unforeseen crises.
The questionnaire was slightly altered as deemed necessary following a pilot test
conducted among project and government agency staff in the district headquarters of
Taplejung. A professor at Tribhuvan University in Kathmandu assessed survey
translation accuracy from English to Nepali and also back to English.
Operationalization and Data Analysis
This study assessed two research questions.
Research question 1: What is the household level of livelihood strategy diversification?
Households within the KCAP region participate in a variety of both on and off-
farm livelihood activities. Categories chosen within the analyses represented the most
heavily adopted income generating activities. Agricultural crops were measured as
reported yield in weight28. The most dominant crops were corn, cardamom, millet, and
27 A sample size of 205 is deemed sufficient with a population of 860 for categorical data analysis with a 0.05 alpha level assumption and a 0.05 margin of error (Cochran 1977; Bartlett et al. 2001). 28 Crop yields were reported in maund (1 maund = 37.32 kg).
109

potatoes. The less frequently utilized crops of barley, wheat, and rice were analyzed as
cereals, while galaichi and charaito were assessed as medicinals. Livestock were
analyzed via two categories of large ruminants (yaks, cows, buffalo, and ox) and small
ruminants (pigs and goats). Within this region, remittances are a major source of
household income; therefore, annual values of remittances received were also collected
and utilized as a category. All off-farm income-generation activities (i.e. cottage
industries, wage labor, salary, pension, etc.) were assessed as an annual household
value. Therefore, a total of 10 distinct income-generation activities were utilized within
the analyses: corn, cardamom, millet, potato, cereal, medicinal, large ruminant, small
ruminant, remittance, and total off-farm income.
Similar to Brown et al. (2006), a multi-step cluster analysis was utilized to identify
discernable barriers to existing livelihood strategies. The authors deemed cluster
analysis as “a theoretically and statistically defensible means of aggregating the data
into distinct livelihood categories” (p. 26). This method allows the data to distinctly
identify discernable livelihood strategies via an asset based approach by accounting for
access to required financial, physical, social, human, and natural capital. The
identification of a household’s distribution of access to available capital represented
adopted livelihood strategies. The ten distinct income-generating activities were utilized
within the cluster analysis. A z-score transformation was conducted among the
independent variables (livelihood activities) prior to inclusion within the cluster analysis
(Hair et al. 2006).
110

Research question 2: What are the factors associated with dominant livelihood strategy adoption?
The second research question applied a multinomial logistic regression to examine
existing correlates of access or barriers to graduate to more effective livelihood
strategies (Brown et al. 2006). The multinomial logistic regression analysis determined
any discernable barriers to the adoption of additional or more dominant livelihood
strategies. A total of twelve variables were included within the model: the number of
household members under 18 years of age, amount land owned, total livestock units,
head of household education level, highest level of education completed by an adult
household member, receivership of remittance, ethnicity, participation role within
sponsored programs (non-member, general member, and leadership member),
participation in capacity building training programs, and visits by household members to
KCAP offices, or KCAP staff members to the households in the past year.
Results
Profile of Respondents
The geographic distribution of respondents (n=205) within the four VDCs were
similar to that identified by WWF29, and included: Lelep VDC (59%), Tapetok VDC
(17%), Yamphudin VDC (17%), and Olachan Gola VDC (7%). Males constituted the
majority of household heads (86%). Sherpa and Limbu ethnicities were dominant within
the region and represented 53% and 41% of the sampled population respectively. The
average head of household was 51 years old with no education, and lived with 4.9
additional members of which 2.2 were under 18 years of age. Over 94% owned their
29 Village Development Committee census results were Lelep (47%), Tapetok (31.3%), Yamphudin (15.1%), and Olachan Gola (6.8%) (WWF 2006).
111
homes with the oldest house built in 1933 and averaged 24 years old. Drinking water
systems were constructed of gravity fed above ground polyvinyl chloride (PVC) pipes.
Only 1.5% of the households had indoor toilets. Residents in the village of Ghunsa
(6.5% of the sample) had a fixed micro-hydro system, while other village residents
(63.1%) had small photovoltaic panels as their sole source of electricity. Houses were
constructed with walls of varying compositions of wood, brick, stones, and mud.
Houses at higher elevations primarily utilized wood for wall construction, while houses in
lower elevation were built of mud. The roofs of houses at higher elevations were
comprised of wood while lower elevation houses primarily had thatched roofs.
Participant observation determined that the most evident predictor of variance
within the population was household elevation. Therefore, additional analyses of
variance were conducted to compare households located at higher and lower
elevations30. All livelihood activities were found in both elevation levels; however,
notable differences were apparent. Table 4-1 summarizes the frequencies and means
for each type of livelihood activities within the lower (76%) and higher elevations (24%).
Households at lower elevations owned more land per household (27.3 ropani31)
compared to households at higher elevations (8.5 ropani). Therefore, lower elevation
households tended to produce more corn, cardamom, and millet, while those at higher
elevations tended to produce more potatoes and medicinals. Households at lower
elevations owned larger herd sizes of small ruminants; however, households at higher
elevations held a greater number of large ruminants. In addition, households located in
30 Lower elevation households were found between 1,380 and 2,249 meters, while higher elevation households were located from 2,250 up to 3,600 meters. 31 19.65 ropani equal 1 hectare.
112
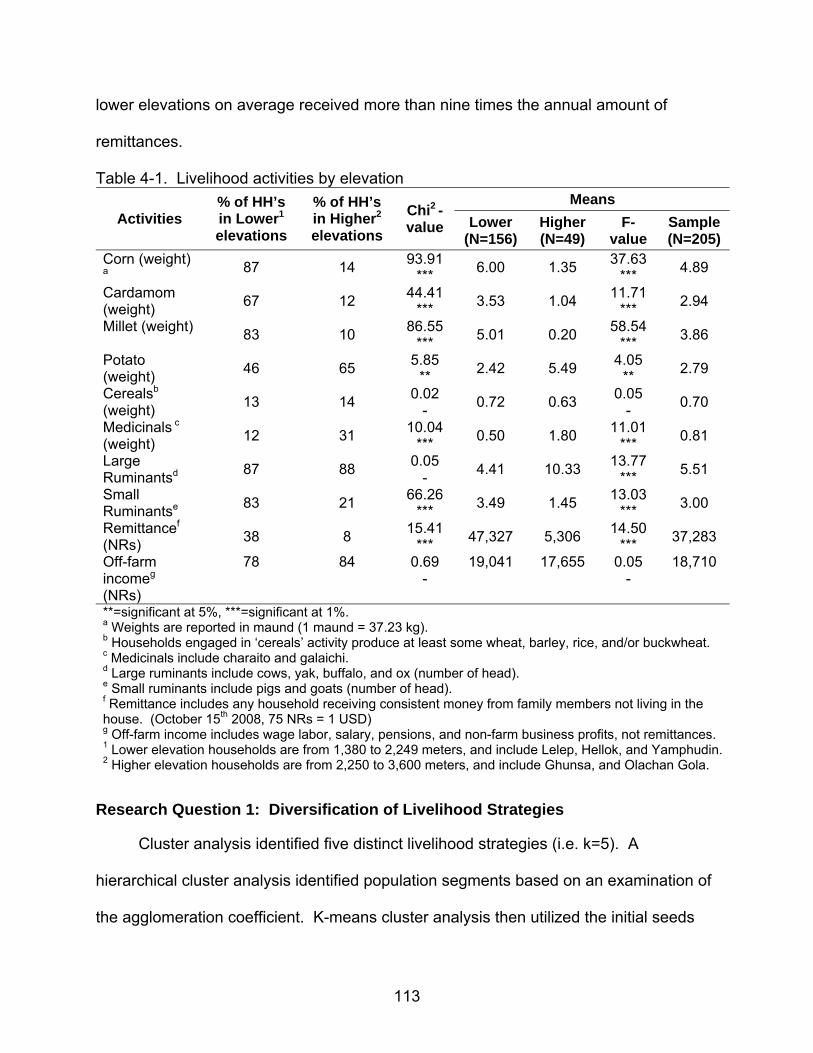
lower elevations on average received more than nine times the annual amount of
remittances.
Table 4-1. Livelihood activities by elevation Means
Activities % of HH’s in Lower1 elevations
% of HH’s in Higher2 elevations
Chi2 -value Lower
(N=156) Higher (N=49)
F-value
Sample (N=205)
Corn (weight)
a 87 14 93.91 *** 6.00 1.35 37.63
*** 4.89
Cardamom (weight) 67 12 44.41
*** 3.53 1.04 11.71 *** 2.94
Millet (weight) 83 10 86.55 *** 5.01 0.20 58.54
*** 3.86
Potato (weight) 46 65 5.85
** 2.42 5.49 4.05 ** 2.79
Cerealsb (weight) 13 14 0.02
- 0.72 0.63 0.05 - 0.70
Medicinals c (weight) 12 31 10.04
*** 0.50 1.80 11.01 *** 0.81
Large Ruminantsd 87 88 0.05
- 4.41 10.33 13.77 *** 5.51
Small Ruminantse 83 21 66.26
*** 3.49 1.45 13.03 *** 3.00
Remittancef (NRs) 38 8 15.41
*** 47,327 5,306 14.50 *** 37,283
Off-farm incomeg (NRs)
78 84 0.69 -
19,041 17,655 0.05 -
18,710
**=significant at 5%, ***=significant at 1%. a Weights are reported in maund (1 maund = 37.23 kg). b Households engaged in ‘cereals’ activity produce at least some wheat, barley, rice, and/or buckwheat. c Medicinals include charaito and galaichi. d Large ruminants include cows, yak, buffalo, and ox (number of head). e Small ruminants include pigs and goats (number of head). f Remittance includes any household receiving consistent money from family members not living in the house. (October 15th 2008, 75 NRs = 1 USD) g Off-farm income includes wage labor, salary, pensions, and non-farm business profits, not remittances. 1 Lower elevation households are from 1,380 to 2,249 meters, and include Lelep, Hellok, and Yamphudin. 2 Higher elevation households are from 2,250 to 3,600 meters, and include Ghunsa, and Olachan Gola.
Research Question 1: Diversification of Livelihood Strategies
Cluster analysis identified five distinct livelihood strategies (i.e. k=5). A
hierarchical cluster analysis identified population segments based on an examination of
the agglomeration coefficient. K-means cluster analysis then utilized the initial seeds
113

derived from the hierarchical method to identify the final clusters. The largest observed
increases in agglomeration coefficients between clusters were used. This non-
hierarchical step confirmed the initial cluster grouping seed points (Hair et al. 2006).
Utilization of both non-hierarchical and hierarchical steps confirms cluster seeds and
increases the credibility of the resulting cluster groups (Andreu et al. 2005). Table 4-2
provides the mean values for each of the livelihood activities within the five identified
livelihood strategies (clusters). In addition, Table 4-2 presents the percentage of lower
elevation households within each group, the total number of households within the
cluster, and the overall percentage of households represented by the cluster. Twelve
additional variables were also included in the table, of which seven were statistically
significant and included: number of dependents, total land owned, total livestock owned,
remittance, Sherpa ethnicity, and household sponsored program participation roles -
general or non-existent.
Over a quarter of the households (27%) adopted the least diversified livelihood
strategy (Cluster 1: Low-income/lowest diversity, large livestock, medicinals, and off-
farm). These households produce less than the sample mean values for each livelihood
activity besides large ruminants, medicinals, and off-farm income. In addition to
adopting the least diversified livelihood strategy, these households also have the lowest
annual per capita income of NRs 9,837. Most of the households within this livelihood
strategy are of Sherpa ethnicity (89%), and are located in higher elevations (70%) with
an average elevation of 2,842 m. These households are the least productive for six of
the livelihood activities. Due to the lowest level of land ownership (8 ropani), this
population segment owns the least amount of small ruminants and produces the
114

Table 4-2. Cluster analysis of activities within each livelihood strategy Clustering Variables Cluster
1 Cluster
2 Cluster
3 Cluster
4 Cluster
5 Sample means
Corn (weight) 0.32 5.15 10.36 3.83 4.48 4.89 Cardamom (weight) 0.45 1.69 3.28 6.00 4.48 2.94 Millet (weight) 0.32 1.15 10.04 1.50 2.83 3.86 Potato (weight) 2.41 17.31 2.60 1.00 0.87 2.79 Cereals (weight) 0.13 0.69 0.36 12.50 0.43 0.70 Medicinals (weight) 1.75 2.15 0.00 0.17 0.51 0.81 Large Ruminants (head) 7.41 14.96 4.85 3.17 3.21 5.51 Small Ruminants (head) 0.92 4.08 3.49 2.83 4.01 3.00 Remittance (NRs) 9,285 63,076 84,000 25,000 22,090 37,283 Off-farm income (NRs) 28,559 31,923 8,477 21,175 16,167 18,710 Overall % of all households 27 6 26 3 38 100 % from lower elevations 30 54 100 83 96 76 No. (#) of households 56 13 53 6 77 205 Per capita income (NRs) 9,837 22,896 20,098 20,066 11,203 14,436 Additional Variables
F-values
No. of dependents 2.09 2.54 1.85 1.50 2.51 3.12** Total land owned 8.02 24.39 36.59 18.33 23.81 12.40*** Total livestock 5.69 12.62 3.98 3.98 2.80 13.66*** Education of household head
0.91 0.77 0.75 0.83 0.76 0.05
Highest household education level
5.71 6.38 6.42 4.83 5.63 0.41
Remittance (n/y) 0.11 0.38 0.64 0.17 0.22 12.86*** Sherpa (n/y) 0.89 0.92 0.43 0.00 0.29 21.25*** Participation-Leader (n/y) 0.13 0.00 0.09 0.33 0.14 1.214 Participation-General (n/y) 0.68 0.62 0.83 0.00 0.53 5.75*** Participation-None (n/y) 0.19 0.38 0.08 0.67 0.33 4.76*** Trainings (n/y) 0.21 0.08 0.08 0.17 0.18 1.27 Staff visits (n/y) 0.20 0.08 0.30 0.17 0.19 1.05 Office visits (n/y) 0.18 0.15 0.17 0.00 0.12 0.45 Strategy Name Cluster 1: Low income/lowest diversity large livestock, medicinals, and off-farm Cluster 2: High income/highest diversity on and off the farm Cluster 3: High income/high diversity farmers with remittance Cluster 4: Low income/low diversity cardamom and cereals farmers Cluster 5: Low income/low diversity cardamom and millet farmers, small ruminants Statistical significance is represented by *10%, **5%, and ***1%. 1 USD = 75 NRs. 1 hectare = 19.65 ropani. Participation refers to household role with sponsored programs that are community based groups which provide financial or technical assistance for both individual and communal decision-making (leadership, general, and non-member).
115

smallest quantities of corn, cardamom, millet, and cereal yields. This group also
receives the lowest average annual value of remittances, and therefore supplements
their income with the second highest value of off-farm work, and the biggest large
ruminant herd sizes. The population also has the largest percent of households without
membership in sponsored programs.
The second identified adopted livelihood strategy (Cluster 2: High income/highest
diversity on and off the farm) represents 6% of households, are primarily of Sherpa
ethnicity (91%), and almost evenly distributed between the higher and lower elevations.
This group of households outperforms the other groups in five livelihood activities that
includes potatoes, medicinals, both large and small ruminants, and off-farm activities.
In fact, households within this strategy produce over six times the average weight of
potatoes. In addition, these households are the second largest producers of corn and
cereals. Households also supplement their highly productive on-farm activities with the
highest average value of off-farm incomes, and the second highest average values of
remittances received that provides them with the highest annual per capita income of
NRs 22,896.
The third livelihood strategy (Cluster 3: High income/high diversity farmers with
remittance) was adopted by 26% of the households, all located within lower elevations.
Households with this livelihood strategy own the most land (36.6 ropani), produce the
most corn and millet, and receive the largest average value of annual remittances (NRs
84,000). The per capita annual income for this group is the second highest at NRs
20,098. However, although this group receives the highest values of remittances, it
produces the lowest average values of off-farm income.
116

The fourth livelihood strategy (Cluster 4: Low income/low diversity cardamom and
cereals farmers) was adopted by the smallest percentage of households (3%). The
households within this group are primarily (83%) located in lower elevation villages,
have the least average amount of dependents, and are not of Sherpa ethnicity.
Although households who have adopted this strategy are the largest average producers
of cardamom and cereals, they have the smallest average number of large ruminants
and the second smallest average herd sizes of small ruminants. Average cereal
production within this strategy is 12.5 maund, while the overall average was only 0.7.
The fifth and most frequent livelihood strategy (Cluster 5: Low income/low
diversity cardamom and millet farmers, small ruminants) was adopted by 38% of
households. This group is predominantly from lower elevations (96%) with an average
elevation of 1905 m. This group has the second lowest average annual per capita
income of NRs 11,023, and second lowest average values of both remittances and off-
farm income. However, these households do produce the second largest average
yields of cardamom and millet.
Research Question 2: Factors Associated With Dominant Livelihood Strategy Adoption
The two most diversified livelihood strategies with higher levels of income
previously identified were only chosen by 32% of the households. Possible barriers and
factors could be related to access to necessary assets that include financial, technical,
physical, social, human and natural. A multinomial logistic regression analysis was
conducted to ascertain possible factors or barriers to the adoption of graduated
livelihood strategies. Results of the multinomial logistic regression utilized to assess
factors or barriers associated with the adoption of the highest income livelihood strategy
117

are presented in Table 4-3. However, prior to analysis, the fourth identified livelihood
strategy (Low income/low diversity cardamom and cereals farmers) (represented only
3% of households) was combined with the fifth livelihood strategy (Low income/low
diversity cardamom and millet farmers, small ruminants) and referred to as low
income/low diversity farmers.
Four variables (number of dependents, total land owned, total livestock units, and
Sherpa ethnicity) were significant predictors of the likelihood that a household adopted
the low income/lowest diversity large livestock livelihood strategy over the low
income/low diversity farmers livelihood strategy. Low income/off-farm workers, on
average, were more often located in the higher elevations with less than a third of land
under ownership, owned about twice the total livestock units, had less children, and
were more often of Sherpa ethnicity. Living at higher elevations limits the amount of
available livelihood activities, especially farm activities. Therefore, households within
this strategy are forced to seek off-farm activities for employment (e.g. trade and
tourism activities). Households that adopted this livelihood strategy were also more
likely to not participate in sponsored programs.
In the second comparison case, four predictor variables (total livestock owned,
remittance, Sherpa ethnicity, and leader participation role) were statistically significant in
regards to household adoption of the highest diversity and income producing livelihood
strategy of high income/highest diversity on and off the farm. Households that adopted
this diversified livelihood strategy on average owned five times more livestock units,
received remittances more often, and were more likely to be of Sherpa ethnicity.
118

Table 4-3. Factors of livelihood strategy adoption Variable Coefficient Std. error Sig. Low income/lowest diversity large livestock, medicinals, and off-farm vs. low income/low diversity farmers (Cluster 1 vs. Clusters 4 & 5) Dependents -0.364 * 0.194 0.060 Total land owned -0.112 *** 0.024 0.000 Total Livestock Units 0.374 *** 0.103 0.000 Education of head 0.060 0.113 0.595 Highest Education -0.042 0.060 0.482 Remittance (n/y) 0.116 0.718 0.871 Sherpa (n/y) 2.678 *** 0.593 0.000 Participation-Leader (n/y) 0.174 0.917 0.850 Participation-General (n/y) 0.896 0.605 0.151 Trainings (n/y) 0.504 0.740 0.496 Staff visits (n/y) 1.070 0.720 0.137 Office visits (n/y) 0.183 0.770 0.812 High income/highest diversity on and off the farm vs. low income/low diversity farmers (Cluster 2 vs. Clusters 4 & 5) Dependents -0.017 0.354 0.962 Total land owned -0.007 0.021 0.731 Total Livestock Units 0.528 *** 0.115 0.000 Education of head 0.113 0.166 0.495 Highest Education -0.061 0.099 0.536 Remittance (n/y) 1.809 ** 0.861 0.036 Sherpa (n/y) 2.418 ** 1.209 0.046 Participation-Leader (n/y) -18.210 *** 2.345 0.000 Participation-General (n/y) 0.417 0.854 0.625 Trainings (n/y) -0.173 1.511 0.909 Staff visits (n/y) -0.550 1.359 0.686 Office visits (n/y) 0.541 1.086 0.618 High income/high diversity farmers with remittance vs. low income/low diversity farmers (Cluster 3 vs. Clusters 4 & 5) Dependents -0.439 ** 0.184 0.017 Total land owned 0.013 0.010 0.186 Total Livestock Units 0.293 *** 0.106 0.006 Education of head 0.097 0.103 0.347 Highest Education -0.108 * 0.058 0.063 Remittance (n/y) 1.918 *** 0.487 0.000 Sherpa (n/y) 0.345 0.522 0.510 Participation-Leader (n/y) 1.204 0.965 0.212 Participation-General (n/y) 2.044 *** .0679 0.003 Trainings (n/y) -1.586 ** 0.798 0.047 Staff visits (n/y) 0.043 0.570 0.940 Office visits (n/y) 0.352 0.693 0.612 Number of observations 205 Percent correctly predicted 68.7 Log-likelihood value 298.561 Pseudo R-squared 0.703 Statistical significance is represented by *10%, **5%, and ***1%.
119
However, none of the households that adopted the most dominant livelihood strategy
held a leadership position within sponsored programs.
In the third comparison case, six variables (number of dependents, total livestock
units, highest education level, remittance, general participation role, and trainings) were
significant predictors of the likelihood a household adopted the more diversified and
financially lucrative livelihood strategy of high income/high diversity farmers with
remittance. These households, on average, had fewer dependents, owned almost 50%
more livestock units, had less educated adults within the family, and received
remittances about three times as frequently. Households that adopted this livelihood
strategy usually (83%) held general member participation roles within sponsored
programs, and participated less often in training provided by KCAP, possibly due to the
lack of necessity.
Discussion
The purpose of this research was to identify the current levels of livelihood
diversification among households, and subsequently to identify potential factors or
barriers to the successful adoption of potential dominant livelihood strategies at KCAP.
Results are based on a cluster analysis of the ten most prevalent livelihood activities,
where households were segmented into five distinct livelihood strategies. The five
livelihood strategies were statistically different among seven household characteristic
variables that included: number of dependents, total land owned, total livestock units,
remittance, Sherpa ethnicity, and participation roles. Findings were similar to the
literature with respect to diversified livelihood strategies, ICDP, and participation in
decentralized conservation (Barrett et al. 2001; Rew & Rew 2003; Ellis & Mdoe 2003;
120

Adhikari et al. 2004; Agrawal & Gupta 2004; Bennett et al. 2006; Brown et et al. 2006;
Bhandari & Grant 2007).
Similarly, other results resonated with the literature indicating households have
disproportionately adopted the more diversified and higher income generation livelihood
strategies based on several socio-economic variables and geographic location. These
households are characterized by access to livelihood assets that include human capital
(having fewer dependents) (Brown et al. 2006), natural capital (owned more land) (Ellis
& Mdoe 2003), financial capital (receive more remittances and own more livestock)
(Barrett et al. 2001; Ellis & Mdoe 2003; Adhikari et al. 2004; Bhandari & Grant 2007),
and social capital (participation in sponsored programs) (Rew & Rew 2003; Agrawal &
Gupta 2004).
Conversely, there were several predictor variables that failed to have statistical
significance in this study. Education of both the head of household and fellow adult
members had no impact on livelihood strategy adoption largely due to the overall lack of
education within the region. The average level of education among head of households
was less than one year, and only six percent of all household members at least thirty
years old had even attended school. In addition, access to saving and credit programs,
social connections with agency staff, and capacity building training and programs were
also all non-significant. Lack of statistical relationships could be attributed to the overall
low rates (less than 20%) of visitations by household members to KCAP offices, visits to
households by KCAP staff, and non-participation in sponsored training programs.
In relation to the overall financial state of the region, caution should be utilized in
the interpretation of the economic results. Although each of the identified livelihood
121
strategies were statistically discernable, over 75% of households failed to earn at least a
dollar a day. The KCAP area is still considered very poor with lack of infrastructure,
external markets, and community development. In addition, remittances are a crucial
determinant of livelihood strategy adoption in the region. Almost a third (31%) of the
households received remittances with an annual mean value that varied from US $124
to $1,120, and a maximum of over US $6,600. This finding is important since that total
annual off-farm household incomes (excluding remittances) only varied between US
$113 to $426, with an annual maximum value of half that of remittances or US $3,300.
Overall, based on the findings of this research, several recommendations can be
made to improve the management of KCAP. Livelihood diversification is dependent on
access to participation in sponsored programs (Rew & Rew 2003; Agrawal & Gupta
2004). Therefore, household participation in capacity building programs needs to
improve to reduce the impact of negative vulnerabilities (Ellis 2000), especially given the
temporal viability among commercial markets and associated linkages (DFID 2007).
KCAP staff needs to increase the frequency of social mobilization programs, and thus
improve the rate of interaction with household members. Study results could enhance
the ability of KCAP managers to target households that have the most need for
community capacity building programs and strategies. This would enhance the ability of
KCAP to effectively manage the area’s diverse biodiversity, while concurrently improve
the livelihoods of its residents. Successful management of KCAP is not only a priority
for Nepal, but also for the international conservation community. KCAP is a vital
component for the eventual creation of a trans-boundary Kanchenjunga mountain
complex conservation area between Nepal, India, and China.
122
The limitations of the study are primarily related to the nature of the data collected.
Economically related household information is often reluctantly provided to researchers.
Household values are based solely on what was provided by the respondent. However,
several steps were taken to alleviate possible socially desirable response effects. Even
though the primary researcher previously lived in Nepal for over two years providing
assistance to communities within protected areas, local research assistants were hired
to help administer the surveys. An additional limitation of economically related research
is due to temporal changes in market linkages, and the resultant affects on livelihood
strategy adoption. Therefore, this study operationalized on-farm livelihood activities in
yield weights and not economic value. Further research should assess the region’s
access to external markets, and the affect these linkages have on the associated value
of livelihood activities. For example, previously cardamom was an extremely lucrative
activity and was utilized as a livelihood strategy by most of the households. Recently,
the price of cardamom dramatically decreased and households have attempted to
switch livelihood activities.
Findings of this research are relevant along a range of scales from the local
community level to the broader body of academic knowledge. Results add to the
literature on sustainable livelihoods, as it could possibly be the first study to utilize this
research framework within a mountainous protected area that operates under a
completely decentralized form of management. In addition, results add to the discourse
on the need for a robust quantitative method of operationalization of diversified
livelihood strategies. This research adapted Brown et al.’s (2006) research whereby
cluster analysis was utilized to identify discernable livelihood strategies, and subsequent
123

techniques identified potential factors or barriers to the adoption of more diversified or
graduated livelihood strategies. Results will assist program managers in identifying
household characteristics strongly associated with those who lack access to livelihood
assets (financial, social, physical, natural, and human) necessary to adopt improved
livelihood strategies. The potential for ICDP sustainability would be greatly enhanced
by the ability to identify disadvantaged households and target project spending while
organizational costs are minimized.
In addition, findings will aid policy makers abilities to identify current environmental
pressures that are most important for future policy modifications, and to simultaneously
apply strategies that are most critical to a household’s livelihood. This ability will
enhance the management of community based natural resources, and promote
strategies that will create more sustainable community capacity building programs while
concurrently alleviating pressures on the area’s biological diversity.
124

CHAPTER 5 CONCLUSION
This study examined the role of participation in sponsored programs, levels of
natural resources dependency, and the existing levels of livelihood strategy
diversification among households in the Kanchenjunga Conservation Area Project,
Nepal. Overall, this study has shown that although KCAP is the first completely
decentralized conservation program in Nepal, a disproportionate amount of the benefits
are being accrued by a small group of households that maintain decision-making roles.
In terms of sustainability, the ICDP literature calls for a complete devolution of decision-
making responsibilities and system that provides for an equitable distribution of benefits;
neither currently exist at KCAP.
Participation Roles
The findings of this study highlight the variables that influence household
participation roles in sponsored programs, and ultimately underline the impact of
participation roles on the distribution of benefits derived from involvement in
decentralized conservation programs. Economic, social, and access variables were
included in the analyses. Economic variables included remittances, existence of off-
farm income, land, and livestock. Overall findings suggest that none of the economic
variables measured were significantly related to household participation roles. The lack
of statistical significance among the economic variables is likely associated with the
homogeneity of the population. There were significant positive correlations between the
four economic variables which indicated if a household had one of the variables, it
usually had all four variables. Likewise, if a household was economically disadvantaged
on one economic variable, they were often disadvantaged on all four variables. Overall
125

the KCAP region is rather homogeneous in economic terms; i.e., economically poor.
Quantities of livestock are highly correlated with altitude and inversely related to land
ownership. Households at higher elevations have larger herd sizes and less land
compared to lower elevation households. It is likely that the lack of variation within the
economic variables that led to statistical insignificance and thus were ineffective
predictors.
Social variables were significantly related to household participation roles and
included education levels of the head of household, highest education levels of
household adults, head of household age, and size of households. Although Maskey et
al. (2006) found age to be positively related to participation roles; however, this current
research found a statistically significant negative relationship. Results of this study
found that overall household size was a better predictor of participation roles than
number of dependents. Additionally, all three access variables in this study were
significantly related to participation roles. An increase in interactions with KCAP offices
and staff were positively related to participation roles. These results highlight the
importance of program staff to conduct social mobilization activities that include social
capacity trainings and community development projects. A simple act of allowing the
community to interact with agency staff provides a major benefit.
The distribution of benefits within KCAP was found to be unequal. Households
with higher participation roles benefited from enhanced access to financial credit in
terms of higher principles and lower interest rates. Higher participation roles also
provided for an increased level of involvement in capacity development training offered
126

via program offices. Within KCAP, if equal distribution is a goal, then increased
promotion of program participation is important and necessary.
Natural Resources Dependency
The sustainability of conservation projects has been shown to be enhanced by
the ability to identify household resource use patterns, and thus better target and
improve the capacity of those households (or communities) who are most heavily
dependent on access to natural resources for their livelihood strategies (Vedeld et al.
2004). This study assessed the level of household dependency on access to natural
resources within KCAP, and identified factors that affect the associated levels of natural
resources dependency. Results of this study indicate that households within KCAP
were heavily dependent on natural resources for their income. The average household
dependence on natural resources access for income in developing countries is 22%
(Vedeld et al. 2004); however, this study found that 64% of households in KCAP were
dependent. Households at higher elevations (74.6%) were more dependent than lower
elevation (60.3%) households.
Several economic, social, and access related variables were significant
predictors of natural resources dependency. Land ownership was not a significant
predictor of dependency, but remittances were significant. Households that received
remittances were able to supplement their income without reliance on natural resources
access. Education was not a significant predictor of natural resources dependency
which may be due to the low overall levels of education within the KCAP region. The
average education of a household head was less than one year, while less than six
percent of individuals at least thirty years of age had even attended school. This study
found that natural resources dependency increased among households with larger
127

numbers of household members, while dependency decreased among households with
more dependents. Caste/race/ethnicity failed to have any predictive significance.
Spatial distribution was rather homogenous within the study site. All households
were disconnected from external commercial market linkages (at least three days walk),
and the placement of four KCAP offices throughout the region facilitated accessibility to
sponsored programs. There was no predictive validity in regards to natural resources
dependency on the varying levels of training participation and the amount of interaction
with KCAP staff (both within the household and at the offices). However, access to
loans within the sponsored program did have a positive significant affect on natural
resources dependency. Less than 20% of households have had direct communication
with KCAP staff within the past year, and only 16% had participated in a training
program. Social mobilization techniques and provided training programs are targeted to
achieve the overall aim of KCAP which is to protect biological diversity by alleviating
environmental pressures while concurrently improving livelihoods via “strengthening the
capacity of the local institutions for making decisions” (WWF 2006, p. 1). However, few
households have benefited from project enhancement techniques, therefore they are
limited to the utilization of loans for traditional livelihood techniques that are strongly
reliant on natural resources.
Livelihood Diversification
This study identified the current levels of livelihood diversification among
households, and subsequent factors or barriers to the successful adoption of potential
dominant livelihood strategies. Based on a cluster analysis, the ten most prevalent
livelihood activities among households were segmented into five statistically distinct
strategies. Significant predictor variables included: number of dependents, total land
128

owned, total livestock units, remittance, Sherpa ethnicity, and participation roles.
Findings were similar the literature with respect to diversified livelihood strategies,
ICDP, and participation in decentralized conservation (Barrett et al. 2001; Rew & Rew
2003; Ellis & Mdoe 2003; Adhikari et al. 2004; Agrawal & Gupta 2004; Bennett et al.
2006; Brown et al. 2006; Bhandari & Grant 2007).
Similarly, other results resonated with the literature indicating households that
have disproportionately adopted more diversified and higher income generation
livelihood strategies were associated with several socio-economic variables and
geographic location. These households were characterized by access to livelihood
assets that included human capital (having fewer dependents) (Brown et al. 2006),
natural capital (more land under ownership) (Ellis & Mdoe 2003), financial capital
(receive more remittances and own more livestock) (Barrett et al. 2001; Ellis & Mdoe
2003; Adhikari et al. 2004; Bhandari & Grant 2007), and social capital (participation in
sponsored programs) (Rew & Rew 2003; Agrawal & Gupta 2004).
Conversely, there were several predictor variables that failed to achieve statistical
significance. Education of both the head of household and fellow adult members had
no impact on livelihood strategy adoption, largely due to the low levels of education
within the region. In addition, access to saving and credit programs (Dercon & Krishna
1996; Acharya et al. 2005), social connections with agency staff, and capacity building
trainings and programs were also all non-significant predictors.
In relation to the overall financial state of the region, caution should be utilized in
the interpretation of the economic results. Although each of the identified livelihood
strategies were statistically discernable, over 75% of households failed to earn at least a
129

US $1 a day. The KCAP area is very economically disadvantaged, it lacks
infrastructure, external markets, and community development. In addition, remittances
are a crucial determinant of livelihood strategy adoption in the region. Almost a third
(31%) of the households received remittances with an annual mean value that varied
from US $124 to $1,120, and a maximum of over US $6,600. This finding is important
given the total annual off-farm household incomes (excluding remittances) only varied
between US $113 to $426, with an annual maximum value of half that of remittances or
US $3,300.
Recommendations to Enhance KCAP Management
Several recommendations can be made based on the findings of this research to
improve the management of KCAP. Participation in sponsored programs was found to
be related to the level of interaction with KCAP staff. Greater roles of participation in
sponsored programs were also significantly related to increased access to associated
benefits including financial credit, lower interest rates, and training programs. However,
less than 20% of household had any interaction with KCAP staff. The lack of social
mobilization strategies and the absence of a region wide system of KCAP sponsored
capacity development projects has detrimentally limited the availability of opportunities
for households to choose livelihood activities that are less dependent on natural
resources. KCAP needs to target those households that are not participating in
sponsored programs, therefore they received fewer benefits, and are more heavily
dependent on natural resources for their livelihoods. Household size was positively
associated with participation roles. To ensure a more comprehensive level of
involvement within conservation areas and between socio-economic categories,
managers should encourage participation from smaller households.
130

Results in this study indicate that households within KCAP are heavily dependent
on access to natural resources for their livelihood strategies. The sustainability of
KCAP as an ICDP is therefore contingent on project intervention via social mobilization,
training programs, and participatory inclusion in decision making.
Livelihood diversification is dependent on access to participation in sponsored
programs (Rew & Rew 2003; Agrawal & Gupta 2004). Household participation rates in
capacity building programs need to be improved which would reduce the impact of
negative vulnerabilities (Ellis 2000), especially given the temporal viability among
commercial markets and associated linkages (DFID 2007). KCAP staff needs to
increase the frequency of social mobilization programs and thus improve the rate of
interaction with household members. The results of this research could be utilized to
enhance the ability of KCAP managers to identify and target households that lack the
necessary assets required for more viable livelihood strategy adoption. These
households thus have the most need for capacity building programs and strategies.
This would enhance the ability of KCAP to effectively manage the area’s diverse
biodiversity, while concurrently improving the livelihoods of its residents.
Research Limitations
There are some limitations to this study. Although the primary researcher had
previously lived in Nepal for over two years and spoke the national language, cultural
differences still occurred. Local research assistants were hired to alleviate response or
researcher bias; however, the availability of trained social researchers at the site was
non-exsistant. Economically related household information is often reluctantly provided
to researchers, and household values were based solely on the information provided by
131
respondents. However, several steps were taken to alleviate possible socially desirable
response effects.
The operationalization of variables within this study was adapted from previous
research conducted in decentralized conservation programs; however, additional
improvements could be made. Due to low frequencies of participation roles, this study
recoded participation in only three categories. A descriptive narrative of an example of
each participation role could accompany the questionnaire to facilitate comprehension
of role labels.
Future Research
Decentralized conservation programs have been heralded in the literature based
on their theoretical ability to: 1) decrease organization costs, 2) provide financial and
technical assistance opportunities to previously excluded stakeholders, and 3) establish
a creatively enhanced and competitive economic sector (Ribot 2002, Agrawal & Gupta
2005). However, considering the discrepancies of loan and interest rate distributions
across households, and the unequal distribution of capacity development training
present at KCAP, further research is needed to determine the level of financial and
social inequalities.
Households within KCAP are heavily dependent on access to natural resources
for their livelihood strategies. The sustainability of KCAP as an ICDP is therefore
contingent on project intervention via social mobilization, training programs, and
participatory inclusion in decision making. An empirical study of household
consumption levels among households should be assessed in terms of fuel wood,
timber for construction, and grazing (see Adhikari et al. 2004). Additionally, given the
prevalence and impact of remittances on natural resources dependency (31% receive
132
remittance that constitute about two-thirds of their off-farm income), a study should be
conducted as to the factors that affect whether a household receives remittances.
Providing externally funded training programs targeting the adoption of alternative
livelihood activities are futile if there is a disconnect from a commercial market. Further
research needs to be conducted pertaining to market linkages within the KCAP region.
A limitation on economically related research is due to temporal changes in market
linkages, and the resultant affects on livelihood strategy adoption. Therefore, this study
operationalized on-farm livelihood activities in yield weights and not economic value.
Further research should assess the region’s access to external markets, and the affect
these linkages have on the associated value of livelihood activities. For example,
previously cardamom was an extremely lucrative activity and was utilized as a livelihood
strategy by most of the households. Recently, the price of cardamom dramatically
decreased and households have attempted to switch livelihood activities.
133

APPENDIX A HOUSEHOLD SURVEY QUESTIONAIRRE
Protocol Title: Participation, dependency, and diversification: A livelihoods assessment of Kanchenjunga Conservation Area Project, Nepal. Please read this consent document carefully before you decide to participate in this study. Purpose of the research study: The purpose of this study is to assess non-government organizational impacts on local livelihood strategies. What you will be asked to do in the study: To answer the interview questions. Time required: 15 – 30 minutes Risks and Benefits: There are no anticipated risk or other direct benefits to you as a participant in this study. Compensation: There is no compensation for participating in this research. Confidentiality: Your identity will be kept confidential to the extent provided by law. Your name will not be recorded, and so your participation and responses will be completely anonymous. The findings will never discuss individual responses in any report. Voluntary participation: Your participation in this study is completely voluntary. There is no penalty for not participating. Right to withdraw from the study: You have the right to withdraw from the study at anytime without consequence. You do not have to answer any questions you do not want to answer. Whom to contact if you have questions about the study: Pete Parker, Graduate Student, Department of Tourism, Recreation & Sport Management, 325 Florida Gym, phone 208-731-0069. Email: [email protected]. Or Dr. Brijesh Thapa, Associate Professor, Department of Tourism, Recreation & Sport Management, 325 Florida Gym, phone (352) 392 4042extension 1239. Email: [email protected]. Whom to contact about your rights as a research participant in the study:
IRB02 Office, Box 112250, University of Florida, Gainesville, FL 32611-2250; ph. 352-392-0433.
134

135

136
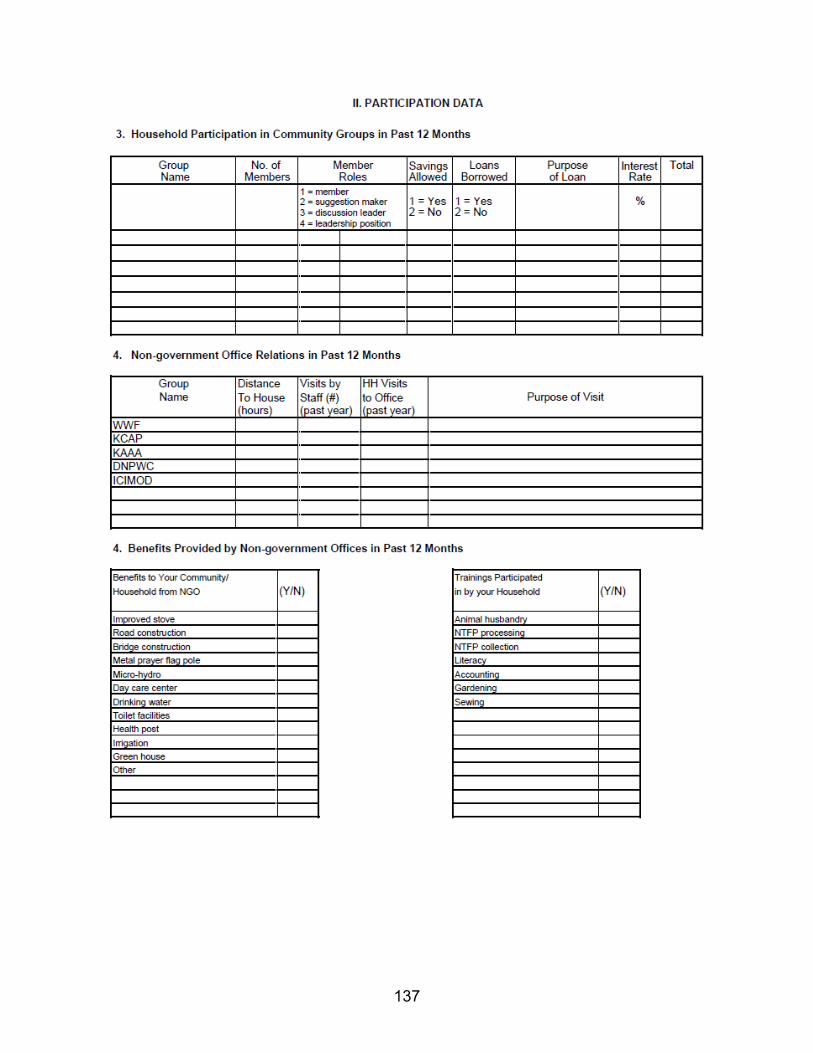
137
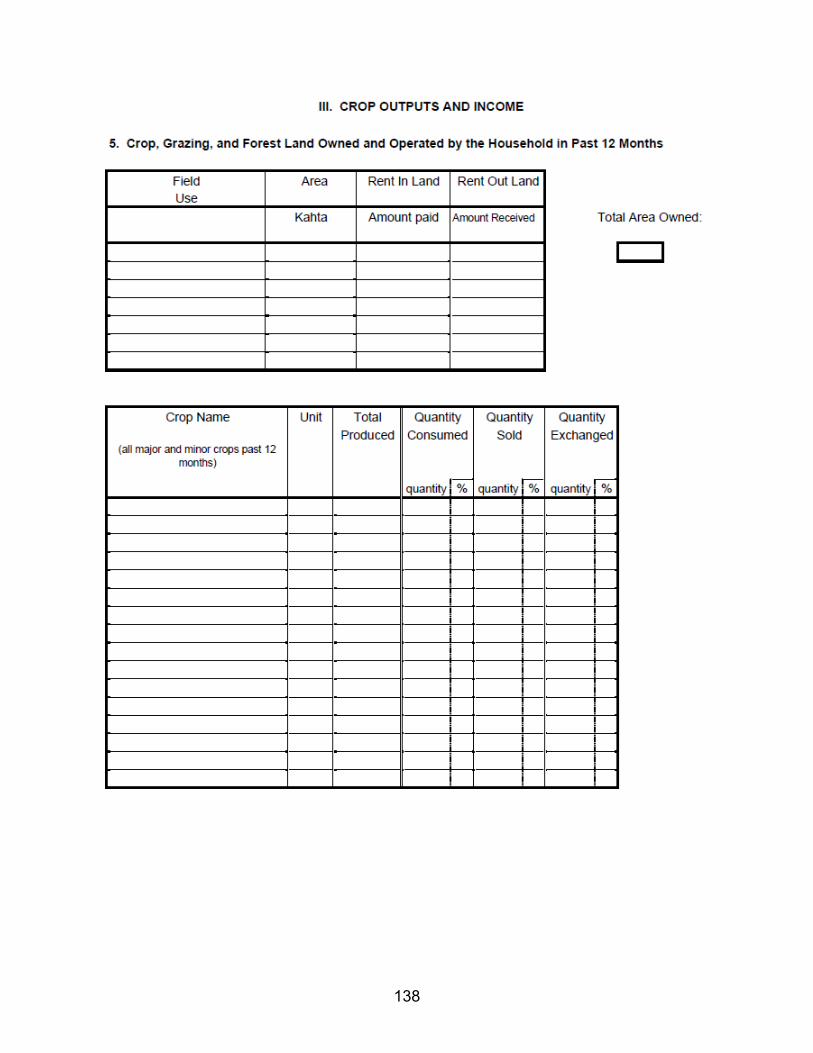
138
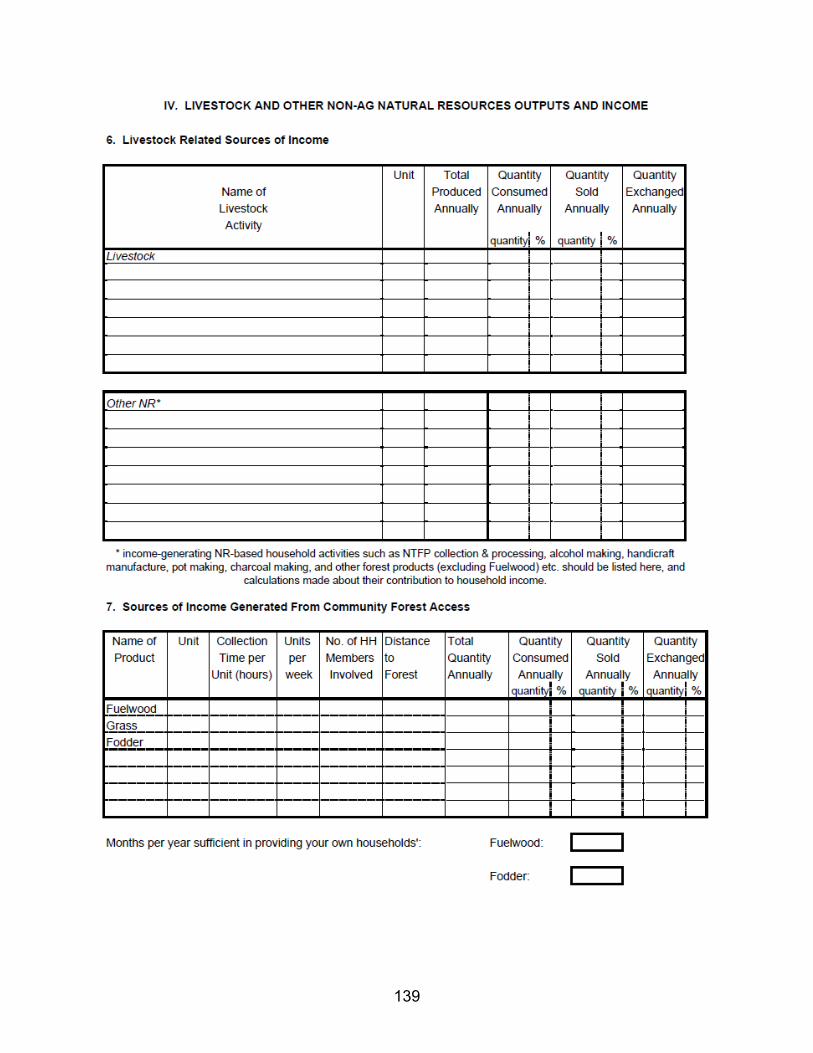
139

140

APPENDIX B HOUSEHOLD SURVEY QUESTIONAIRRE (TRANSLATED INTO NEPALI)
141

142
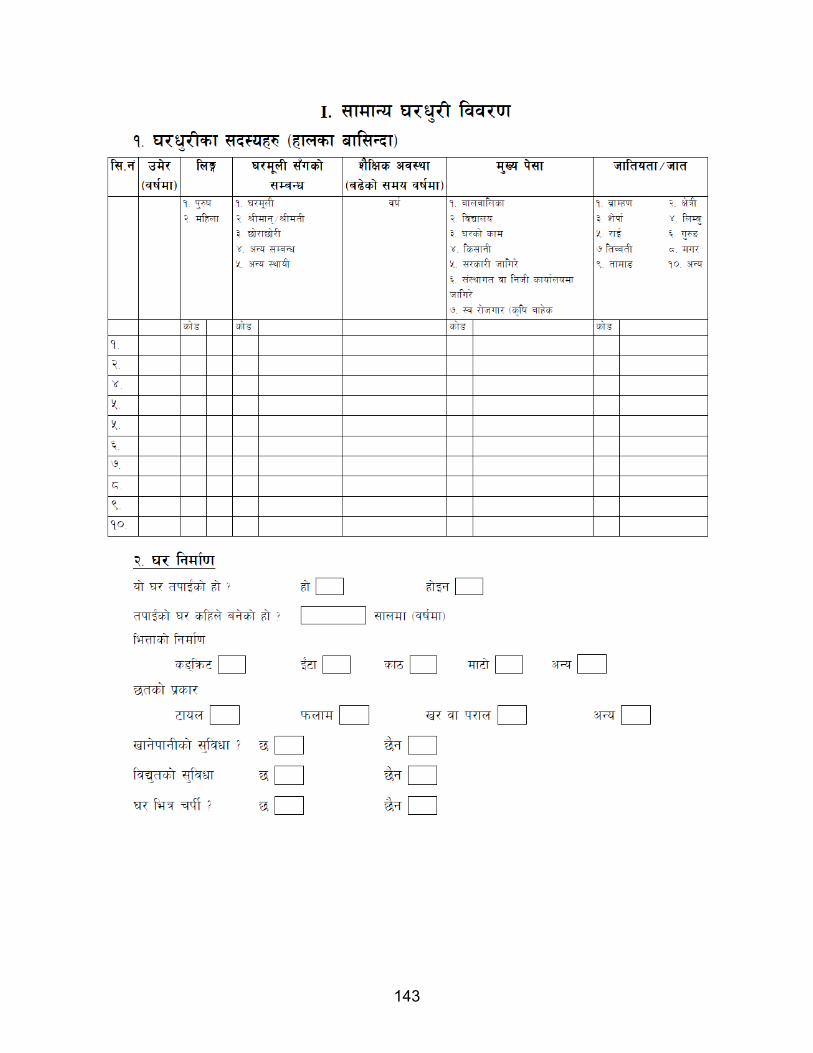
143
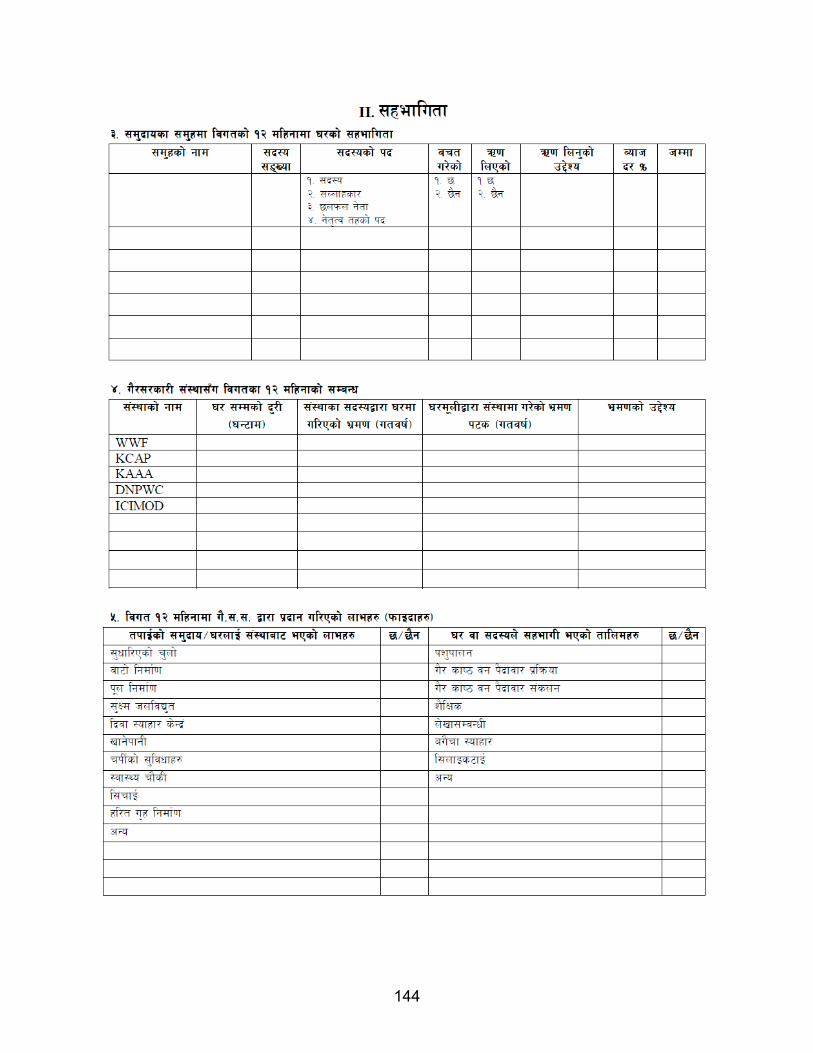
144

145

146

147
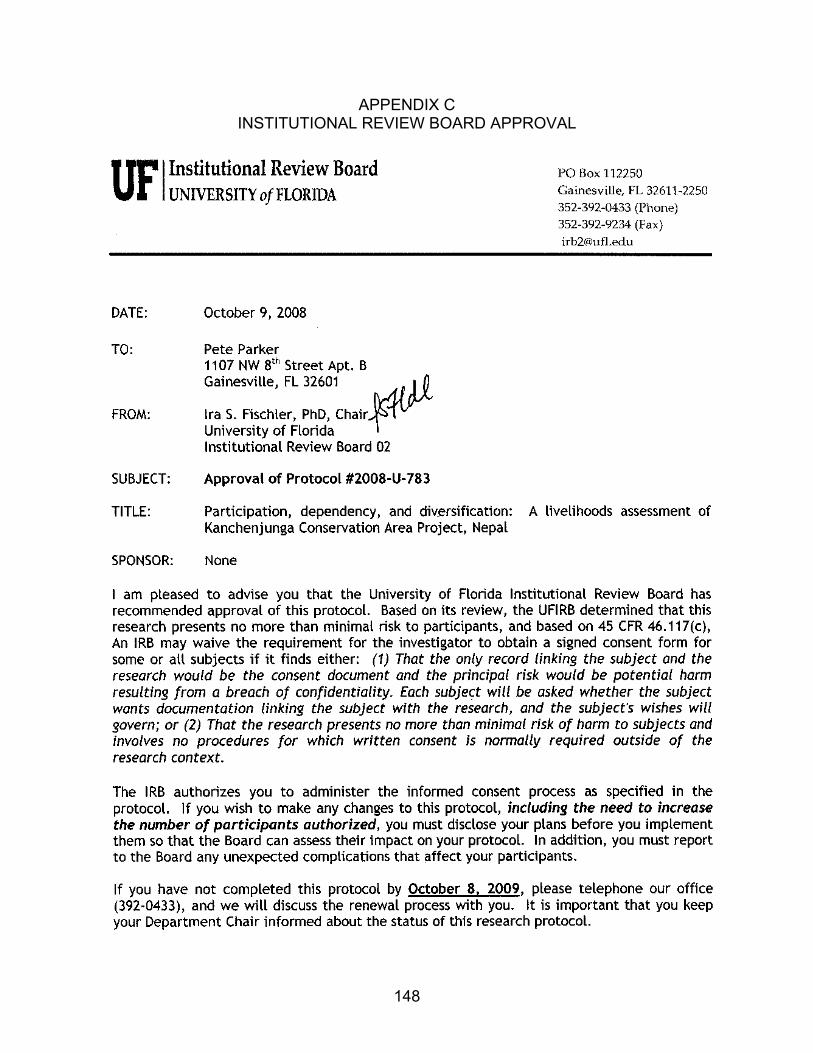
APPENDIX C INSTITUTIONAL REVIEW BOARD APPROVAL
148

LIST OF REFERENCES
Aase, T. & Vetaas, O. (2007) Risk management by communal decision in Trans-Himalayan farming: Manang Valley in Central Nepal. Human Ecology 35: 453-460.
Acharya, A., Yoshino, E., Jimba, M. & Wakai, S. (2005) Empowering rural women through a community development approach in Nepal. Community Development Journal 42(1): 43-46.
Adhikari, B., Falco, S. & Lovett, J. (2004) Household characteristics and forest dependency: Evidence from common property forest management in Nepal. Ecological Economics 48(2004): 245-257.
Agrawal, A. (2000) Small is beautiful, but is larger better? Forest-management institutions in the Kumaon Himalaya, India. In: Clark, G., Margaret, A. & Elinor, O. eds People and Forests, Communities, Institutions, and Governance. The MIT Press, Cambridge, pp.57-85.
Agrawal, A. & Gibson, C. (1999) Enchantment and disenchantment: The role of community in natural resource conservation. World Development 27(4): 629-649.
Agrawal, A. & Gupta. K. (2005) Decentralization and participation: The governance of common pool resources in Nepal’s Terai. World Development 33(7): 1101-1114.
Agarwal, B. (2001) Participatory exclusions, community forestry, and gender: An analysis for south Asia and a conceptual framework. World Development 29(10): 1623-1648
Allendorf, T. (2007) Residents’ attitudes toward three protected areas in southwest Nepal. Biodiversity and Conservation 16(7): 2087-2102.
Andreu, L. Kozak, M., Avci, N. & Cifter, N. (2005) Market segmentation by motivations to travel: British tourists visiting Turkey. Journal of Travel and Tourism Marketing 19(1): 34-56.
Ashley, C. (2000) The impacts of tourism on rural livelihoods: Namibia’s experience. Overseas Development Institute Working Paper 128.
Ashley, C. & Carney, D. (1999) Sustainable Livelihoods: Lessons from early experience, Department for International Development, London.
Bajracharya, S., Furley, P. & Newton, A. (2005) Effectiveness of community involvement in delivering conservation benefits to the Annapurna Conservation Area, Nepal. Environmental Conservation 32 (3): 239–247.
149
Bajracharya, S., Furley, P. & Newton, A. (2006) Impacts of community-based conservation on local communities in the Annapurna Conservation Area, Nepal. Biodiversity Conservation 15: 2765-2786.
Baral, N. & Heinen, J. (2005) The Maoist people’s war and conservation in Nepal. Politics and Life Sciences 24(1-2): 2-11.
_________________ (2007) Decentralization and people’s participation in conservation: A comparative study from the western terai of Nepal. International Journal of Sustainable Development & World Ecology 14(2007): 520-531.
Baral, N., Stern, M. & Heinen, J. (2007) Integrated conservation and development project life cycles in the Annapurna Conservation Area, Nepal: Is development overpowering conservation? Biodiversity Conservation 16(10): 2903-2917.
Barret, C., Reardon, T. & Webb, P. (2001) Nonfarm income diversification and household livelihood strategies in rural Africa: Concepts, dynamics, and policy implications. Food Policy 26(2001): 315-331.
Barret, C., Marenya, P., McPeak, J., Minten., B., Murithi, F., Oluoch-Kaoura, W., Place, F., Randrianarisoa, J., Rasambainarivo, J. & Wangila, J. (2006) Welfare dynamics in rural Kenya and Madagascar. Journal of Development Studies 42(2): 248-77.
Battarai, K., Conway, D. & Shresta, N. (2005) Tourism, terrorism and turmoil in Nepal. Annals of Tourism Research 32(3): 669-688.
Berkes, F. (2007) Community-based conservation in a globalized world. Proceedings of the National Academy of Sciences 104(39): 15188-15193.
Bhandari, B. & Grant, M. (2007) Analysis of livelihood security: A case study in the Kali-Kola watershed of Nepal. Journal of Environmental Management 85(2007): 17-26.
Blaikie, P. & Springate-Baginski, O. (2003) Is community forestry in contemporary Nepal pro-poor and sustainable? Improving policy-livelihood relationships in south Asia, Briefing Note 4.
Booth, D., Holland, J., Hentschel, J., Lanjouw, P. & Herbert, A. (1998) Participation and combined methods in African Poverty Assessment: Renewing the Agenda. Social Development Division, UK Department for International Development (DFID), Feb., mimeo.
Brandon, K. (1997) Policy and practical considerations in land-use strategies for biodiversity conservation. In Kramer, C., van Schaik, C. & Johnson, J. eds. Last stand: Protected areas and the defense of tropical biodiversity. Oxford, UK: Oxford University Press.
150

Brandon, K., Redford, K. & Sanderson, S. eds (1998) Parks in Peril: People, politics, and protected areas and the defense of tropical diversity. New York: Oxford University Press.
Brandon, K. & Wells, M. (1992) Planning for people and parks: Design dilemmas. World Development 20(4): 557-570.
Brechin, S. & West, P. (1991) Resident peoples and national parks: Social dilemmas and strategies in international conservation. Tuscon, AZ: University of Arizona Press.
Brechin, S., Wilshusen, P., Fortwangler, C. & West, P. (2002) Reinventing the square wheel: A critique of the new protectionist paradigm in international biodiversity conservation. Society and Natural Resources 15: 41-64.
Brown, D., Stephens, E., Okuro Ouma, J., Murithi, F. & Barrett, C. (2006) Livelihood strategies in the rural Kenyan highlands. African Journal of Agriculture and Resources Economics 1(1): 21-35.
Budhathoki, P. (2004) Linking communities with conservation in developing countries: Buffer zone management initiatives in Nepal. Oryx 38(3): 334-341.
Chambers, R. & Conway, G. (1992) Sustainable rural livelihoods: Practical concepts for the 21st century. IDS discussion paper 296. Brighton, UK: Institute of Development Studies, University of Sussex.
Chandool, C. (2007) Households’ resource use, conservation attitude and perceived socioeconomic impact of the protected areas policy in the Nariva Swamp, Trinidad and Tobago. Dissertation, University of Florida, Gainesville, FL.
Chapin, M. (2004) A challenge to conservationists. Wolrdwatch 17(6): 17-32.
Child, B. (2004) Parks in transition: Biodiversity, rural development and the bottom line. United Kingdom: Earthscan.
Cochran, W. (1977) Sampling techniques (3rd ed.). New York: John Wiley & Sons.
Denzin, N. & Lincoln, Y., eds. (2000) Handbook of Qualitative Research. Thousand Oaks, CA: Sage Publications, Inc.
Dercon, S. & Krishna, P. (1996) Income portfolios in rural Ethiopia and Tanzania: Choices and constraints. Journal of Development Studies 32(6): 850-75.
Dev, O., Yadav, N., Springate-Baginski, O. & Soussan, J. (2003) Impacts of community forestry on livelihoods in the middle hills of Nepal. Journal of Forest and Livelihood 3(1): 67-87.
151

Ellis, F. (1998) Household strategies and rural livelihood diversification. The Journal of Development Studies 35(1): 1-38.
Ellis, F. (2000) Rural livelihoods and diversity in developing countries. NY: Oxford University Press.
Ellis, F. & Allison, E. (2004) Livelihood diversification and natural resource access. Overseas Development Group, University of Anglia, UK FAO, LSP WP 9.
Ellis, F. & Freeman, A. (2004) Rural livelihoods and poverty reduction strategies in four African countries. The Journal of Development Studies 40(4): 1-30.
Ellis, F. & Mdoe, N. (2003) Livelihoods and rural poverty reduction in Tanzania. World Development 31(8): 1367-1384.
Frankenberger, T., Drinkwater, M. & Maxwell, D. (2000) Operationalizing household livelihood security: A holistic approach for addressing poverty and vulnerability. Program Document, CARE USA, CARE, Atlanta, GA.
Ghimire, K., & Pimbert, M., eds (1997) Social change and conservation. London: Earthscan.
Grandin, B. (1988) Wealth ranking in smallerholder communities: A field manual. London: Intermediate Technology.
Greene, W. (2000) Econometric analysis, fourth ed. Prentice Hall, Englewood, CA.
Gunatilake, H. (1998) The role of rural development in protecting tropical rainforests: Evidence from Sri Lanka. Journal of Environmental Management 53: 273–292.
Hair, D., Babin, B., Anderson, R., Tatham, R., & Black, W. 2005. Multivariate Data. NY: Prentice Hall.
Heinen, J. (1993) Park-people relationships in Kosi Tappu Wildlife Reserve, Nepal: A socio-economic analysis. Environmental Conservation 20(1): 25-34.
Heinen, J. & Kattel, B. (1992a) A review of conservation legislation in Nepal: Past progress and future needs. Environmental Management 16(6): 723-733.
Heinen, J. & Kattel, B. (1992b) Parks, people, and conservation: A review of management issues in Nepal’s protected areas. Population and Environment 14(1): 49-84.
Heinen, J. & Mehta, J. (1999) Conceptual and legal issues in the designation and management of conservation areas in Nepal. Environmental Conservation 26(1): 21-29.
152
Heinen, J. & Mehta, J. (2000) Emerging issues in legal and procedural aspects of buffer zone management with case studies from Nepal. Journal of Environment & Development 9(1): 45-67.
Herold-Menzies, M. (2006) Integrating conservation and development: What can we learn from Caohai, China. The Journal of Environment & Development 15(4): 382-406.
Horwich, R. & Lyon, J. (2007) Community conservation: Practitioners’ answer to critics. Oryx 41(3): 376-385.
Ikeda, N. (2005) Economic impacts of livestock depredation by snow leopard Uncia uncia in the Kanchenjunga Conservation Area, Nepal Himalaya. Environmental Conservation 31(4): 322-330.
IUCN. (1994) Guidelines for protected area management categories. Cambridge, UK: IUCN.
Jumkbe, C. & Angelsen, A. (2007) Forest dependence and participation in CPR management: Empirical evidence from forest co-management in Malawi. Ecological Economics 62(2007): 661-672.
Kellert, S., Mehta, J., Ebbin, S. & Lichtenfeld, L. (2000) Community natural resource management: Promise, rhetoric, and reality. Society and Natural Resources 17: 705-715.
Lachapelle, P., Smith, P. & McCool, S. (2004) Access to power or genuine empowerment? An analysis of three community forest groups in Nepal. Human Ecology Review 11(1): 1-12.
LADDER Research Team. (2001) Methods manual for fieldwork. LADDER Working Paper No. 2.
Lise, W. (2000) Factors influencing people’s participation in forest management in India. Ecological Economics 34: 379-92.
Maskey, V., Gebremedhin, T. & Dalton, T. (2006) Social and cultural determinants of collective management of community forest in Nepal. Journal of Forest Economics 11(2006): 261-274.
McNeely, J. (1988) Economics and biological diversity: Developing and using economic incentives to conserve biological resources. Gland, Switzerland: IUCN.
McShane, T., & Wells, M., eds. (2004) Getting biodiversity projects work: towards more effective conservation and development. Columbia University Press, New York.
153

Mehta, J. & Kellert, S. (1998) Local attitudes toward community-based conservation policy and programmes in Nepal: A case study in the Makalu-Barun Conservation Area. Environmental Conservation 25(4): 320-333.
Müller-Böker, U. & Kollmair, M. (2000) Livelihood strategies and local perceptions of a new nature conservation project in nepal: The Kanchenjunga Conservation Area Project. Mountain Research and Development 20(4): 324-331.
Murphee, M. (1994) The role of institutions in community-based conservation. In Western, D., Wright R. & Strum, S. eds Natural connections, pp. 403-427. Columbia University Press, New York, USA.
Naughton-Treves, L., Holland, M. & Brandon, K. (2005) The role of protected areas in conserving biodiversity and sustaining local livelihoods. Annual Review of Environment and Resources 30(2005): 219-252.
Neuman, R. (1997) Primitive ideas: Protected area buffer zones and the politics of land in Africa. Developmental Change 28: 579-582.
Neupane, H. (2003) Contested impact of community forestry on equity: Some evidences from Nepal. Journal of Forest and Livelihood 2(2): 43-51.
Nyaupane, G. & Thapa, B. (2004) Evaluation of ecotourism: A comparative assessment in the Annapurna Conservation Area Project, Nepal. Journal of Ecotourism 3(1): 20-45.
Nyaupane, G. & Thapa, B. (2006) Perceptions of environmental impacts of tourism: A case study at ACAP, Nepal. International Journal of Sustainable Development and World Ecology (13): 51-61.
Nyaupane, G., Morais, D. & Dowler, L. (2006) The role of community involvement and number/type of visitors ecotourism impacts: A controlled comparison of Annapurna, Nepal and Northwestern Yunnan, China. Tourism Management, 27(6): 1373-1385.
Oates, J. (1999) Myth and reality in rain forests: How conservation strategies are failing in West Africa. Berkeley: University of California Press.
Rew, A. & Rew, M. (2003) Development models “out of place”: Social research on methods to improve livelihoods in eastern India. Community Development Journal 38(3): 213-224.
Ribot. J. (1995) From Exclusion to Participation: Turning Senegal’s Forestry Policy Around? Harvard University, Cambridge, MA, USA.
Ribot, J. (2002) Democratic decentralization of natural resources: Institutionalizing popular participation. Washington DC: World Resources Institute.
154
Ribot, J. (2003) Democratic decentralization of natural resources: Institutional choice and discretionary power transfers in Sub-Saharan Africa. Public Administration and Development 23: 53-65.
Robinson, J. (1993) The limits to caring: Sustainable living and the loss of biodiversity. Conservation Biology 7(1): 20-28.
Salafsky, N. & Wollenberg, E. (2000) Linking livelihoods and conservation: A conceptual framework and scale for assessing the integration of human needs and biodiversity. World Development. 28(8): 1421-1438.
Scoones, I. (1998) Sustainable rural livelihoods: A framework for analysis. Brighton, UK: Institute of Development Studies, University of Sussex.
Sherpa, M., Coburn, B. & Gurung, C. (1986) Annapurna Conservation Area, Nepal: Operation plan. King Mahendra Trust for Nature Conservation, Kathmandu, Nepal.
Smith, R., Mulr, R., Walpole, M., Balmford, A. & Leader-Williams, N. (2003) Governance and the loss of biodiversity, Nature 426: 67-70.
Stem, C., Lassoie, J., Lee, J., Deshler, D. & Schelhas, J. (2003) Community participation in ecotourism benefits: The link to conservation practices and perspectives. Society and Natural Resources 16: 387-413.
Tao, T. & Wall G. (2009) Tourism as a sustainable livelihood strategy. Tourism Management 30(1): 90-98.
Terborgh, J., van Shaik, C., Davenport, L. & Rao, M., eds (2002) Making parks work: Strategies for preserving tropical nature. Washington DC: Island Press.
Thomas-Slayter, B. & Bhatt, N. (1994) Land, livestock and livelihoods: Changing dynamics of gender, caste, and ethnicity in a Nepalese village. Human Ecology 22: 467-494.
UNDP 2008. Human Development Reports. Http://hdr.undp.org/en/reports/nationalreports/asiathepacific/nepal/name,3287,en.html.
Vedeld, P., Angelsen, A., Sjaastad E. & Berg G. (2004) Counting on the environment forest incomes and the rural poor. Environmental Economics Series, World Bank Paper No. 98.
WCED. (1987) Our Common Future: World Commission on Environment and Development Oxford University Press, Oxford.
Wells, M., Brandon, K. & Hannah, L. (1992) People and parks: Linking protected area management with local communities. The World Bank, Washington, D.C.
155

Wells, M., McShane, T., Dublin, H., O’Connor, S. & Redford, K. (2004) The future of integrated conservation and development projects: Building on what works. In McShane, T. & Wells, M., eds. Getting Biodiversity Projects to Work, pp. 398-421. Columbia University Press, New York, USA.
Wells, M. & Sharma, U. (1998) Socio-economic and political aspects of biodiversity conservation in Nepal. International Journal of Social Economics 25(2-4): 226-243.
Western, D. & Wright, R. (1994) Natural connections: Perspectives in community based conservation. Washington DC: Island Press.
White, H. (2002) Combining quantitative and qualitative approaches in poverty analysis. World Development 30(3): 311-322.
World Bank (2008) Migration and Remittances Factbook. http://econ.worldbank.org/WBSITE/EXTERNAL/EXTDEC/EXTDECPROSPECTS/0,,contentMDK:21352016~pagePK:64165401~piPK:64165026~theSitePK:476883,00.html
_________ (2009) Remittance market lookout. http://web.worldbank.org/WBSITE/EXTERNAL/TOPICS/EXTFINANCIALSECTOR/EXTPAYMENTREMMITTANCE/0,,contentMDK:22121552~menuPK:2554287~pagePK:210058~piPK:210062~theSitePK:1943138~isCURL:Y,00.html
WWF (2006) Understanding the changes in livelihoods assets with locals: A case study from Kanchenjunga Conservation Area Project, Nepal. Sacred Himalayan Landscape in Nepal, Series Number 3.
____ (2007) Biodiversity Governance. Sustainable Livelihoods Sacred Himalayan Landscape in Nepal Series No. 2. www.wwfint.org
____ (2007) Kanchenjunga Conservation Area Project. 17-37. www.wwfint.org
____ (2007) Kanchenjunga Factsheet. www.wwfint.org
____ (2007) Nature, culture & conservation: Sacred Himalayan Landscape in Nepal. Thematic research working brief No. 1. www.wwfint.org
156

157
BIOGRAPHICAL SKETCH
Pete Parker is a sustainable development strategist with a background in
community-based natural resources project development and management. His
emphasis has been working with protected areas in developing countries utilizing
sustainable tourism as an economic alternative to natural resource consumption. He
grew up in rural Idaho and received his bachelor’s degree in environmental science at
the University of Idaho. He then joined the US Peace Corps in Nepal working as an
environmental awareness specialist within the Department of National Parks and
Wildlife Conservation. It was in Nepal, working alongside local communities, that he
found his career calling. He has conducted research within rural communities in the
Himalayan regions of Nepal (Ph.D.) and China (M.Sc. in environmental studies at San
Jose State University). His research focuses on enhancing sustainable livelihoods
through the equitable distribution of costs and benefits associated with natural
resources conservation. He began his studies at the University of Florida in August
2006 and received his Ph.D. in the fall of 2009.