household demand for cereals and cowpea in the sahel 17...
TRANSCRIPT

1
Household Demand for Sorghum and Pearl millet in Mali and Niger: An Application of the Linear Approximate Almost Ideal Demand Systems
(LA-AIDS)
Jupiter Ndjeunga Principal Scientist, Agricultural Economist, ICRISAT Niamey, Niger
Boubacar I. Kounche Institut National de la Statistisque du Niger
Harouna Kore Professor of Economics, Department of Agronomy, Université Abdou
Moumouni of Niamey, Niger Yahoussa Gambo
MsC Student at the Universite Abdou Moumouni of Niamey, Niger Lamissa Diakite
Agricultural Economist, Institut d’Economie Rurale, Bamako, Mali

2
Table of contents Summary ................................................................................................................................... 4
I - Introduction .......................................................................................................................... 6
II - Importance of sorghum and pearl millet in the livelihoods of Sahelian farmers .................... 7
III - Demand system specification ............................................................................................. 9
IV - Data and estimation .......................................................................................................... 11
V - Results and discussions ..................................................................................................... 12
5.1. Socio-demographic and economic profile of households and per-capita consumption ... 12
5.1.1. Socio-demographic and economic profile of households ........................................ 12
5.1.2. Cereal consumption per capita by poverty status and location ................................ 14
5.1.3. Expenditure shares for major cereals and legumes in Mali and Niger ..................... 15
5.2. Drivers of demand for major cereals and legumes ......................................................... 16
5.2.1. Demand for sorghum and pearl millet in Mali ........................................................ 16
5.2.2. Demand for sorghum and pearl millet in Niger ....................................................... 19
5.3. Expenditures and price elasticities of demand ............................................................... 22
5.3.1. Mali ....................................................................................................................... 22
5.3.2. Niger ...................................................................................................................... 24
VI - Conclusions and implications ........................................................................................... 26
References ............................................................................................................................... 27
List of tables Table 1. Relative importance of sorghum and pearl millet relative to all cereal crops in the Sahelian
countries .................................................................................................................................... 8
Table 3. Socio-economic and demographic profiles of households in Niger ................................ 13
Table 4. Socio-economic and demographic profiles of households in Mali .................................. 13
Table 5: Average quantities (kg) of food (cereals and/or cowpea) consumed by location and
poverty status in Mali and Niger ................................................................................................ 14
Table 8. Expenditure shares for major cereals and cowpea in Mali and Niger .............................. 15
Table 9. Determinants of demand for cereals and cowpea in Mali (all sample) ............................. 18
Table 10. Determinants of demand for cereals and cowpea in Niger (all sample) ......................... 21
Table 11: Expenditure and price elasticities of demand for Malian households by poverty groups 22
Table 12. Expenditure and price elasticities of demand for Nigerien households by poverty groups ................................................................................................................................................ 25
List of figures
Figure 1: Per capita consumption shares of cereals in West Africa ................................................ 9
List of annexes

3
Annex 1. Income and price elasticities for Nigerian households by income class ......................... 28
Annex 2. Determinants of demand for cereals and cowpea in Mali (Urban Non-poor) ................ 29
Annex 3. Determinants of demand for cereals and cowpea in Mali (Urban Poor) ........................ 30
Annex 4. Determinants of demand for cereals and cowpea in Mali (Rural Non-poor) ................. 31
Annex 5. Determinants of demand for cereals and cowpea in Mali (Rural Poor) ......................... 32
Annex 6. Determinants of demand for cereals and cowpea in Niger (Urban non-poor) ............... 33
Annex 7. Determinants of demand for cereals and cowpea in Niger (Urban poor) ...................... 34
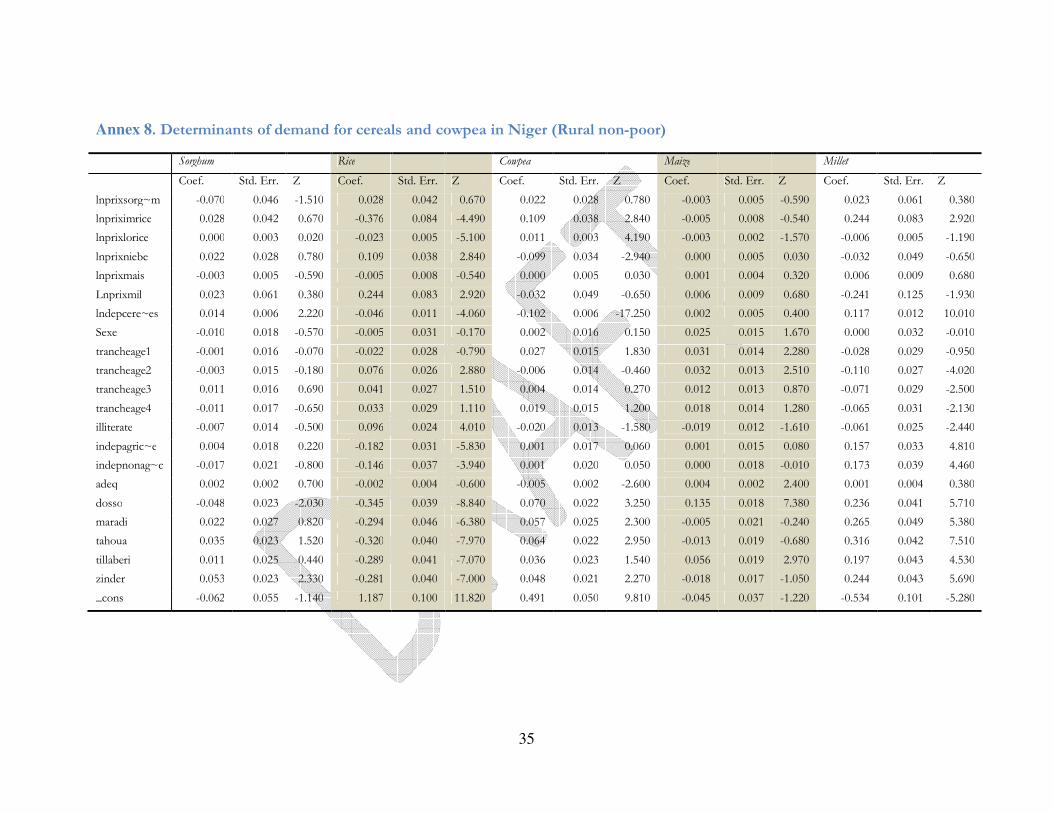
Annex 8. Determinants of demand for cereals and cowpea in Niger (Rural non-poor) ................. 35
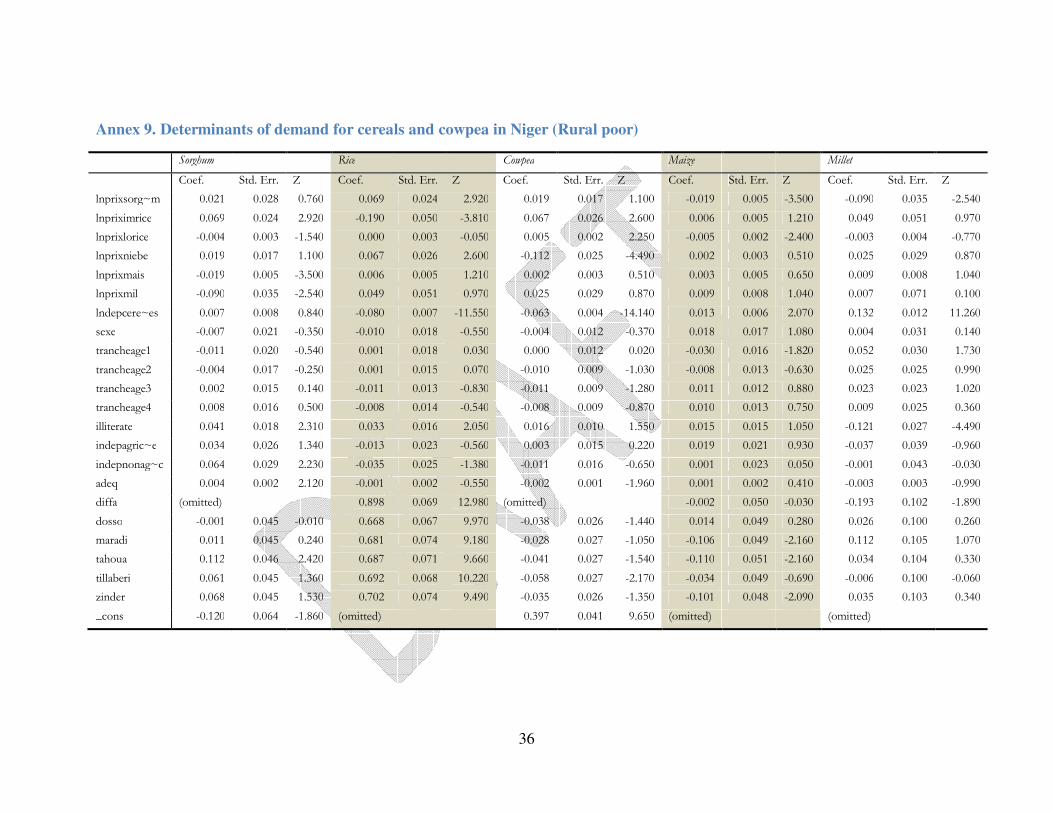
Annex 9. Determinants of demand for cereals and cowpea in Niger (Rural poor) ..................... 36

4
Summary
Data from household expenditure surveys in Mali (4453 households) and Niger (3905 households) were used to assess the factors driving the demand for coarse grains and cowpea by location and income groups in Mali and Niger and estimate price and demand elasticities for sorghum and pearl millet. Linear Approximate Almost Ideal Demand Systems model was used. Results showed that the demand for sorghum in Mali decreases with sorghum price and with rice price, increases with cowpea price, millet price and household expenditures. The demand for sorghum is high in rural areas, among the poor, with those that are unemployed and decreases among female headed households, increases among illiterate, decreases in households with high adult equivalents and increases irrespective of age groups. The demand for pearl millet is largely explained pearl millet price, increases with sorghum price, maize price and with household expenditures. The quantity demanded of pearl millet demanded increases in rural areas, among the poor, among those that are unemployed and decreases in households with high adult equivalents and with household heads with 30 to 40 years of age. In Niger, the demand for sorghum is not responsive to its own price but increases with increases the price of rice, with the price of cowpea, and with household expenditures. The demand for sorghum decreases with the price of maize and the price of pearl millet. In addition, the demand for sorghum increases in the rural areas, among the poor, in households with high number of adult equivalents. The demand for pearl millet increases with pearl millet price following the demand function for Giffen good, decreases with sorghum price, decreases with cowpea price, decreases with maize price, and increases with household expenditures. The quantity demanded increases in rural areas and among the poor. In addition, the quantity demanded of pearl millet increases among women, decreases in all age groups and among literate and increases among those whose major activity is agriculture. In the 2 countries, there are differences based on location and income groups. Among the rural poor in Niger for example, the demand for pearl millet decreases with sorghum price and increases with household expenditure. It increases among the young of 30 years or less and decreases among the literate. In Mali, among the Urban Non-poor, it is noted that the demand for sorghum increases with millet price and expenditures. In addition, the demand increases in households with high number of adult equivalents, and irrespective of age groups. Expenditure elasticities of demand in Mali showed that overall sorghum, pearl millet, cowpea and maize were luxury goods while rice is a necessity good. Own price elasticities indicate that sorghum, maize, and pearl millet are price elastic. Rice and cowpea are price inelastic and fonio is behaving as a Giffen good. For sorghum, cross price elasticities showed that sorghum is substituted by cowpea and pearl millet but is complemented by rice, maize and fonio. For pearl millet, cross-price elasticities indicate that sorghum, rice, cowpea, and maize are substitutes and fonio is a complement. In Niger, sorghum, maize, pearl millet are expenditure elastic (expenditure elasticities greater than 1) suggesting that these crops are luxury goods whereas imported rice and local rice are necessity goods and finally cowpea is an inferior good. The values of own price elasticities indicate that imported rice and cowpea are price elastic while sorghum, local rice, maize and pearl millet are price inelastic. For sorghum, cross-price elasticities showed that sorghum is substituted by imported rice
5
and cowpea while local rice, maize and millet are complements. For pearl millet, cross-price elasticities indicate that all food items are complements. A better knowledge of the demand for commodities is critical in formulating policies aimed at improving the livelihood of farmers. In the 2 countries, sorghum and pearl millet are behaving as luxury goods or superior goods implying that the demand for these food items increases more than proportionally as income rises. Policies likely to encourage farmers to produce sorghum and pearl millet are likely to boost the demand for these crops as income rises especially in the urban areas. A recent government policy to encourage cowpea production in Niger by raising its price may have a negative effect on pearl millet demand and endangered household food security. In fact these types of policies can affect the food security of millions of smallholder farmers whose pearl millet and sorghum remain the major staple foods. Key words: cereal demand, cowpea, almost ideal demand system, food security, Niger, Mali.

6
I - Introduction
Niger and Mali as well as many other countries in the Semi-Arid Tropics of West Africa are among
the least developed countries in the World. These countries have the lowest human development
indices estimated to 0.309 and 0.261 respectively on the basis of low national income, weak human
assets and high economic vulnerability. Agriculture accounts for about 35% of Gross Domestic
Product (GDP) and remains the major source of employment. More than 51.4% and 65.9% of its
population lives below the poverty line (PPP US$1.25 per day). The populations estimated to 13.3
million and 15.9 million are rapidly with annual growth rates estimated to 2.4% and 3.7%
respectively during the period 2010-15 (HDR, 2010). The rates of urbanization estimated to about
35.9% in Mali and 17.1% in Niger are increasing rapidly putting pressure on food demand in urban
areas (UNDP, 2010).
The Malian and Nigerien populations like most countries in the Sahel rely mostly on sorghum and
pearl millet for their rural livelihoods. These crops are the major sources of calories intake and food
security. However, population growth, urbanization, and rising incomes are pushing urban
consumers to shift their preferences towards other cereals such as rice and wheat. Though sorghum
and pearl millet remain the major staple foods, their relative importance in the urban area is likely to
decline. A better understanding of factors driving the demand for sorghum and pearl millet as well
as consumer responses to prices and income levels is necessary to search for policy and institutional
options for sorghum and pearl millet to remain competitive.
Estimation of demand for goods and services has attracted the attention of both the theoreticians
and empiricists, and a very dense literature is now available. Several methods are also available such
as the Rotterdam model (Theil, 1965) and the Translog model (Christensen et al., 1975). In this
study we will use the AIDS demand system because of its flexibility and linearity and linearity ad
because it is a complete system (Deaton and Muellbauer, 1980). This model will be used to identify
the drivers of demand for cereal crops and cowpea in Niger and Mali and estimate the price and
expenditure elasticities.
Following this brief introduction, the second section of the paper presents the importance of
sorghum and pearl millet in the livelihoods of Nigerien and Malians. The third section presents the
7
AIDS model. The fourth section discusses the methodology and section 5 the results. The final
section concludes with options to improve the competitiveness of sorghum and pearl millet.
II - Importance of sorghum and pearl millet in the livelihoods of
Sahelian farmers
Sorghum and pearl millet grains are the main staple cereal crops for people in the WASAT and in
Mali, Niger and Nigeria. Pearl millet is cultivated on 1,530,000 ha, 6,580,000 ha and 4,490,000 ha
Mali, Niger and Nigeria respectively. Production of pearl millet follows the same pattern. However,
yields remain very low estimated to 479 kg/ha to 1,480 kg/ha in Nigeria on average in 2006-2010.
Growth in production is largely explained by area growth in Mali and Niger than productivity.
Growth in pearl millet production in Mali is estimated to 2.42 % per annum from 1984 to 2010
largely explained by area growth estimated to 2.23%. Similarly, in Niger growth in production is
estimated to about 4.03 % per annum largely explained by area growth (2.97%). However, in
Nigeria, growth in production is explained by both area (1.37%) growth and production growth
(1.02%).
Likewise, sorghum follows the same trend as pearl millet. Sorghum is cultivated on 1,060,000 ha,
2,890,000 ha and 6,440,000 ha in Mali, Niger and Nigeria respectively. Sorghum production follows
the same trend. Productivity of these crops remain low estimated to about 355 kg/ha in Niger to
1,171 kg per ha in Nigeria below World average. Growth in sorghum production in Mali is
estimated to 2.62 % per annum from 1984 to 2010 largely explained by area growth estimated to
2.79%. Similarly, in Niger growth in production is estimated to about 4.97 % per annum largely
explained by area growth (3.19%). However, in Nigeria, growth in production (2.04%) is also largely
explained by area growth (1.43%).
Pearl millet and sorghum account for more than 50% of the total cereal grain area in the 3
countries. In Mali for example, sorghum and millet account for 72% of the total crop area. In Niger
both crops account for 99% and in Nigeria, sorghum and millet account for 69%. The same trend
is recorded on production on average in 2006-10 (Table 1). It is noted that the relative importance
of these crops is decreasing. In Mali, sorghum and millet accounted for 84% of area planted in
1981-85 against 72% in 2006-10. With regard to production, sorghum and pearl millet accounted
for 80% in 1981-85 and decreased significantly to 48% in 2006-10. This is largely explained by the
increasing importance of maize and rice. In Nigeria, the proportion of sorghum and millet area
combined accounted for 76% in 1981-85 and decreased to 65% in 2006-10. Production of both

8
crops accounted for 75% and dropped to 56% in 2006-10. These trends are recorded in West
Africa as a whole.
Table 1. Relative importance of sorghum and pearl millet relative to all cereal crops in the Sahelian countries
Country
Area planted (%) Production (%)
1981-85 2006-10 1981-85 2006-10
Burkina Faso 92.45 82.29 88.06 72.4
Cote d’Ivoire 10.2 14.76 5.33 5.87
Ghana 41.75 30.58 33.99 21.16
Mali 83.77 72.15 80.33 47.79
Niger 99.29 99.68 96.9 98.59
Nigeria 76.49 65.06 74.58 57.27
Senegal 87.45 79.16 75.01 55.6
Togo 46.44 34.83 44.85 28.38
West Africa 72.87 68.88 64.7 52.5 Source: Constructed from FAOSTAT, 2012.
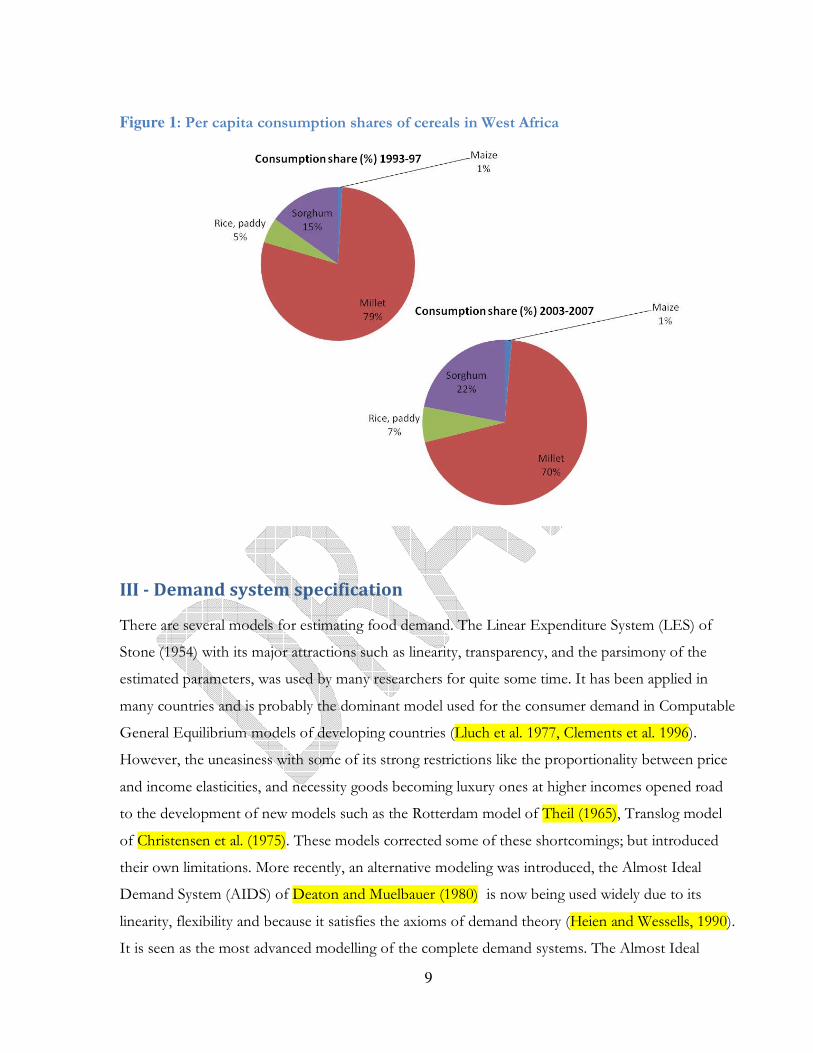
Because little production is traded in these countries, most of the production is consumed. Per
capita consumption has been increasing for sorghum but decreasing for pearl millet in West Africa.
Figure 1 shows that the share of per capita consumption of sorghum was estimated to 15% in
1993-97 and increased to 22% in 2003-07. This may largely explained by increasing demand from
the feed sector. But for pearl millet, the share of per capita consumption decreased from 79% in
1993-97 to 70% in 2003-07.
9
Figure 1: Per capita consumption shares of cereals in West Africa
III - Demand system specification
There are several models for estimating food demand. The Linear Expenditure System (LES) of
Stone (1954) with its major attractions such as linearity, transparency, and the parsimony of the
estimated parameters, was used by many researchers for quite some time. It has been applied in
many countries and is probably the dominant model used for the consumer demand in Computable
General Equilibrium models of developing countries (Lluch et al. 1977, Clements et al. 1996).
However, the uneasiness with some of its strong restrictions like the proportionality between price
and income elasticities, and necessity goods becoming luxury ones at higher incomes opened road
to the development of new models such as the Rotterdam model of Theil (1965), Translog model
of Christensen et al. (1975). These models corrected some of these shortcomings; but introduced
their own limitations. More recently, an alternative modeling was introduced, the Almost Ideal
Demand System (AIDS) of Deaton and Muelbauer (1980) is now being used widely due to its
linearity, flexibility and because it satisfies the axioms of demand theory (Heien and Wessells, 1990).
It is seen as the most advanced modelling of the complete demand systems. The Almost Ideal
10
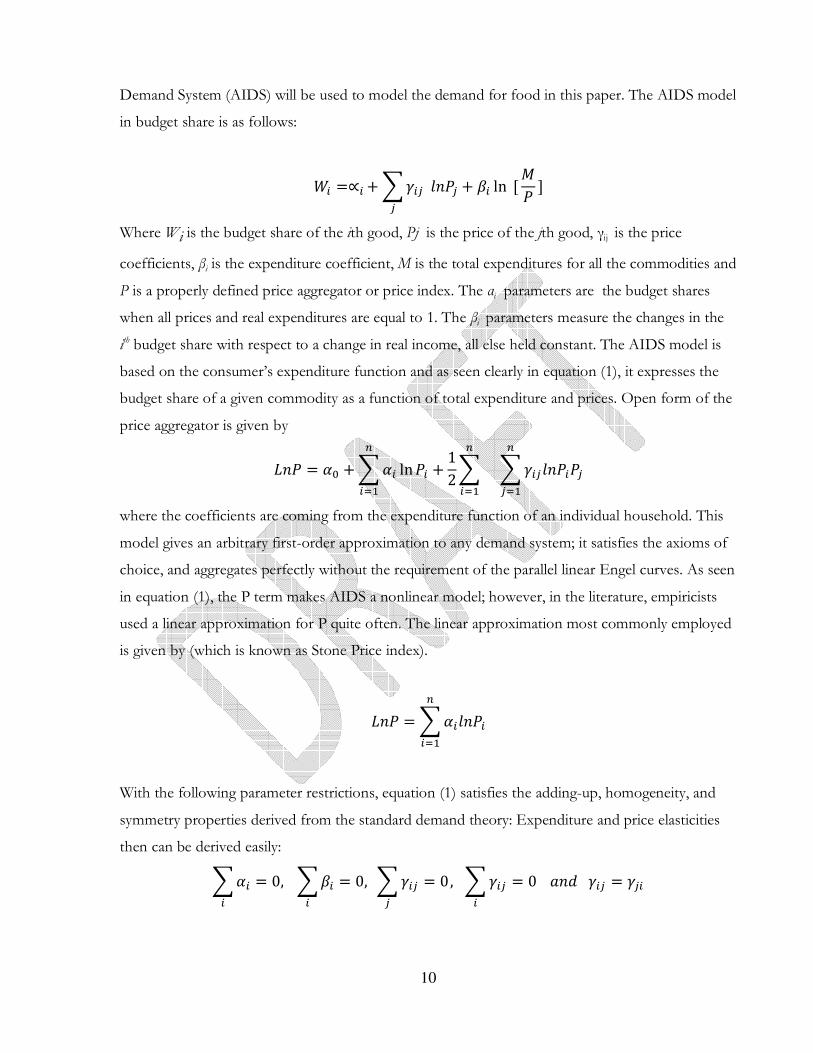
Demand System (AIDS) will be used to model the demand for food in this paper. The AIDS model
in budget share is as follows:
�� =∝�+���
�� + � ln [�� ] Where Wi is the budget share of the ith good, Pj is the price of the jth good, γij is the price
coefficients, βi is the expenditure coefficient, M is the total expenditures for all the commodities and
P is a properly defined price aggregator or price index. The αi parameters are the budget shares
when all prices and real expenditures are equal to 1. The βi parameters measure the changes in the
ith budget share with respect to a change in real income, all else held constant. The AIDS model is
based on the consumer’s expenditure function and as seen clearly in equation (1), it expresses the
budget share of a given commodity as a function of total expenditure and prices. Open form of the
price aggregator is given by
��� = �� +����
���ln�� + 1
2��
�����������
��
where the coefficients are coming from the expenditure function of an individual household. This
model gives an arbitrary first-order approximation to any demand system; it satisfies the axioms of
choice, and aggregates perfectly without the requirement of the parallel linear Engel curves. As seen
in equation (1), the P term makes AIDS a nonlinear model; however, in the literature, empiricists
used a linear approximation for P quite often. The linear approximation most commonly employed
is given by (which is known as Stone Price index).
��� =�������
���
With the following parameter restrictions, equation (1) satisfies the adding-up, homogeneity, and
symmetry properties derived from the standard demand theory: Expenditure and price elasticities
then can be derived easily:
��� = 0,�
� � = 0,�
��� = 0
,��� = 0�
����� = ��

11
where i is the expenditure elasticity, Wi is the budget share of good i, ��� is the own price elasticity,
and �� represents the cross-price elasticity, in Marshallian terms (uncompensated). Compensated
(Hicksian) price elasticities, �� , can be derived easily by using � , and !�� and the following relation:
� = 1 + ���
�� = −1 + #!���$ − � �� = %!����& − � %���&
'� = �� + � � The demand for food is influenced by the age composition of the household, and sex of household
head, location, age groups, poverty status, household size, and various other demographic variables.
To capture the effects of the demographic variables on food demand patterns, socio-economic and
demographic variables will be used as explanatory variables in the share equations.
A system of share equations based on equation (1) and subject to the restrictions (adding-up,
homogeneity, and symmetry) in (4) is estimated using iterative Seemingly Unrelated Regression
(SUREG) method of Zellner. This method is equivalent to full Information Maximum Likelihood
(FIML) estimation. The adding-up property of demand causes the error covariance matrix of
system to be singular, so one of the expenditure share equations is dropped from the system to
avoid singularity problems. The estimates are invariant of which equation is deleted from the
system. Symmetry is imposed during the estimation of the system of equations.
IV - Data and estimation
Two data sets were used in this study. The 2007 Household Consumption and Expenditure Survey
data (ENBC) of the Institut National de la Statistique (INS) of the Republic of Niger and the
household consumption data of 2006 of the Institut National de la Statistique (INSTAT) in of the
Republic of Mali.
In Niger, data were collected in 8 regions including Tillaberi, Zinder, Maradi, Dosso, Tahoua, Diffa,
Agadez and Commune Urbaine de Niamey. This survey contains data on food consumption used at
home during 2 weeks for 4,050 households. The data is stratified by location (rural and urban areas)
and poverty status (poor and non-poor). Other socio-economics characteristics of the households
include region, age of household head, sex of household head, marital status, and household size,

12
age groups of household members, number of adult equivalents, quantity of food item demanded
(maize, sorghum, pearl millet, local rice, and imported rice, cowpea, etc…).
This ENBC survey was carried out on a sample of 4050 households including 1845 in urban and
2205 rural households divided in 450 survey zones (ZDs), drawn by a multi-stage, stratified
probability sample of households in the 8 regions including Niamey, urban communities of Maradi,
Tahoua and Zinder and urban and rural area of the seven regions. To choose the households, the 8
regions were divided into 18 strata on the basis of location (urban, rural), poverty status (poor, non-
poor). However, some layers such as the department of Bilma were excluded because of the
difficulties to reach it and its very low population density. This represented about 0.5% of the
totality of the population of Niger (ENBC, 2007).
The data were collected by interview with the head of household. Interviewers recorded the kind,
form, quantity and cost of each food and beverage purchased by the household during the last 14
days. The sample size used in the estimation was 4050. The entire sample could not be used
because some members did not respond in all categories or dropped out.
In Mali, in 2006, a similar sampling scheme was used as in the case of Niger. Data was collected
from 8 regions of Mali namely Koulikoro, Sikasso, Segou, Mopti, Tombouctou Gao, Kidal, and
Bamako. , procedure was used in Mali in 2006. This survey contains data on food consumption
used at home during 2 weeks for 4,453 households. The data is stratified by location (rural and
urban areas) and poverty status (poor and non-poor). Other socio-economics characteristics of the
households include region, age of household head, sex of household head, marital status, and
household size, age groups of household members, number of adult equivalents, quantity of food
item demanded (maize, sorghum, pearl millet, local rice, and imported rice, cowpea, etc…).
V - Results and discussions
5.1. Socio-demographic and economic profile of households and per-capita consumption
5.1.1. Socio-demographic and economic profile of households
Tables 2 and 3 present the socio-demographic and economic profile of households surveyed in
Niger and Mali respectively. In Niger, a total of 3,905 households were interviewed of which 1831
poor and 2074 non-poor, 1856 households located in urban areas and 2049 located in rural areas.

13
The average age of household heads is 46 years with an average 5 adult equivalents and household
size estimated to about 7 members. Most of the households surveyed are male accounting for 88%
of the sample. More 83 % of the members of households have between 30 and 59 years old. About
74% of the surveyed households are illiterate. Agriculture is the major occupation of households
for 48% and non-farm employment accounts for 34% (Table 2).
Table 2. Socio-economic and demographic profiles of households in Niger
Location/Poverty status Urban Rural Total Non
poor Poor Non poor Poor Non
poor Poor Total
Region Agadez 218 31 0 0 218 31 249 Diffa 77 28 122 20 199 48 247 Dosso 76 54 171 309 247 363 610 Maradi 142 119 78 192 220 311 531 Tahoua 141 116 130 139 271 255 526 Tillabery 58 69 128 271 186 340 526 Zinder 197 104 235 254 432 358 790 CU Niamey 301 125 - - 301 125 426 Sub-total 1210 646 864 1185 2074 1831 3905 Gender Male 85.54 83.75 90.86 92.57 87.75 89.46 88.55 Age (years) 45.302 49.113 42.700 46.528 44.218 47.440 45.729 Age group < 30 years 9.42 5.57 21.30 10.89 14.37 9.01 11.86 30-39 years 27.44 17.65 27.20 21.18 27.34 19.93 23.87 40-49 years 28.35 30.19 19.33 28.44 24.59 29.06 26.68 50-59 years 20.08 23.68 14.47 19.92 17.74 21.25 19.39 >59 years 14.71 22.91 17.71 19.58 15.96 20.75 18.21 Adult equivalents
4.836 5.946 4.221 6.182 4.580 6.099 5.292
Household size
6.432 8.102 5.821 8.625 6.177 6.099 7.239
Illiterate (%) 51.16 76.63 81.48 90.21 63.79 85.42 73.93 Self- agric 9.09 21.83 76.74 81.27 37.27 60.29 48.07 Self- non-agr 53.72 56.66 14.12 14.43 37.22 29.33 33.52
Source: Computed from ENBC data, 2007.
In Mali, a total of 4,453 households were interviewed of which 2,701 poor and 1,752 non-poor,
2,558 households located in urban areas and 2,895 households are located in rural areas. The
average number of adult equivalents is estimated to 7 and household size estimated to about 9
members. About 93% of the surveyed households are illiterate. Agriculture is the major occupation
of households for 51% and non-farm employment accounts for 15% (Table 3).
Table 3. Socio-economic and demographic profiles of households in Mali
Location/Poverty status
Urban Rural Total

14
Non poor
Poor Non poor Poor Non poor Poor Total
Region Kayes 132 36 254 172 386 208 594 Koulikoro 163 40 400 348 563 388 951 Sikasso 110 70 53 381 163 451 614 Segou 183 79 316 312 499 391 890 Mopti 130 20 149 151 279 171 450 Tombouctou 79 16 169 89 248 105 353 Gao 65 12 52 7 117 19 136 Kidal 29 1 42 0 71 1 72 Bamako 375 18 0 0 375 18 393 Sub-total 1266 292 1435 1460 2701 1752 4453 Gender Male (%) 88.55 94.29 88.70 96.64 88.58 95.47 93.06 Age group Group 1(%) 29.02 24.05 29.22 18.56 29.13 19.47 25.27 Group 2(%) 31.93 28.52 26.99 27.88 29.32 27.98 28.78 Group 3(%) 21.67 24.40 20.89 24.73 21.25 24.67 22.62 Group 4(%) 17.38 23.02 22.90 28.84 20.30 27.87 23.33 Adult equivalents
5.902 8.215 5.974 8.458 5.845 8.417 6.873
Household size
7.679 10.928 7.763 11.441 7.724 11.356 9.176
Illiterate (%) 35.81 65.29 85.00 90.27 61.86 86.12 71.56 Self- agric (%) 10.51 36.08 65.69 73.42 39.73 67.22 50.72 Self- non-agr (%)
28.54 25.43 10.34 4.45 18.90 7.94 14.52
Source: Computed from INSTAT data, 2006.
5.1.2. Cereal consumption per capita by poverty status and location
On average in Mali, it is estimated that cereal is consumed at 291 kg/person/year on a per capita
basis. Millet accounts for 24% of cereal consumption, 26% of sorghum consumption, 27% of
maize consumption , 13% of rice consumption and 11% of fonio consumption. Non-poor
households consume significantly more cereals than poor and more cereals is consumed in urban
areas than rural areas.
In Niger, it is estimated that cereal is consumed at 174 kg/person/year on a per capita basis. Millet
accounts for 24% of cereal consumption, 26% of sorghum consumption, 27% of maize
consumption , 13% of rice consumption and 11% of fonio consumption. Non-poor households
consume significantly more cereals than poor and more cereals is consumed in urban areas than
rural areas.
Table 4: Average quantities (kg) of food (cereals and/or cowpea) consumed by location and poverty status in Mali and Niger
Product Urban Rural Total

15
Non-poor Poor Non-poor Poor
Mali
Millet 90.183 49.86 82.419 39.758 68.504
Sorghum 98.044 53.806 88.423 44.014 74.328 Maize 104.212 58.041 91.839 46.909 78.409 Rice 48.905 25.595 44.424 20.613 36.656
Fonio 43.725 24.137 41.051 18.853 33.424 Cowpea 47.196 24.298 41.362 19.51 34.737 Total cereals 385.068 211.439 348.157 170.147 291.322
Niger Sorghum 5.472 6.476 24.094 18.605 13.743
Millet 30.345 49.199 203.427 174.026 115.360 Maize 9.475 12.315 17.177 12.677 12.620 Imp rice 59.810 27.994 21.718 4.964 29.475
Local rice 0.788 2.156 7.874 2.214 3.015 Total cereals 105.890 98.140 274.290 212.486 174.214
Source: Computed from INSTAT data, Mali 2006 and ENBC data, Niger 2007.
In Niger, the average quantity of cereal consumption is estimated to 174 kg/person/year. Sorghum
accounts for only 8% of the total cereals, 66% of pearl millet, 7% of maize, 17% of imported rice
and 2% of local rice. More cereals are consumed in rural areas.
5.1.3. Expenditure shares for major cereals and legumes in Mali and Niger
In terms of food expenditures, in Mali, it is estimated that sorghum accounts for 14% of the cereals
and cowpea expenses, rice accounts for 44%, millet for 28%, maize accounts for 10%, fonio for 1%
and cowpea for 10%.
Table 5. Expenditure shares for major cereals and cowpea in Mali and Niger
Product
Urban Rural Average Non-poor Poor Non-poor Poor
Mali
Sorghum 7.50% 11.50% 14.30% 18.60% 13.60% Rice 65.00% 48.80% 43.50% 25.50% 44.00% Cowpea 3.40% 3.40% 4.00% 5.40% 4.20%
Maize 5.20% 12.50% 7.80% 15.10% 9.80% Millet 18.10% 23.40% 30.00% 34.50% 27.70%
Fonio 0.90% 0.50% 0.40% 0.90% 0.70% Niger Sorghum 1.417% 3.296% 6.239% 7.557% 4.658%
Imp rice 75.369% 48.417% 20.870% 6.741% 38.026% Local rice 0.576% 2.673% 3.518% 1.299% 1.793% Cowpea 6.451% 8.130% 7.121% 4.339% 6.236%
Maize 3.834% 8.013% 4.915% 5.585% 5.296% Millet 12.353% 29.471% 57.337% 74.479% 43.991%
16
In Niger, it is estimated that millet accounts for 44% of cereals and cowpea expenses, imported rice
for 38%, sorghum for 5%, 2% for local rice and 5% for maize.
5.2. Drivers of demand for major cereals and legumes
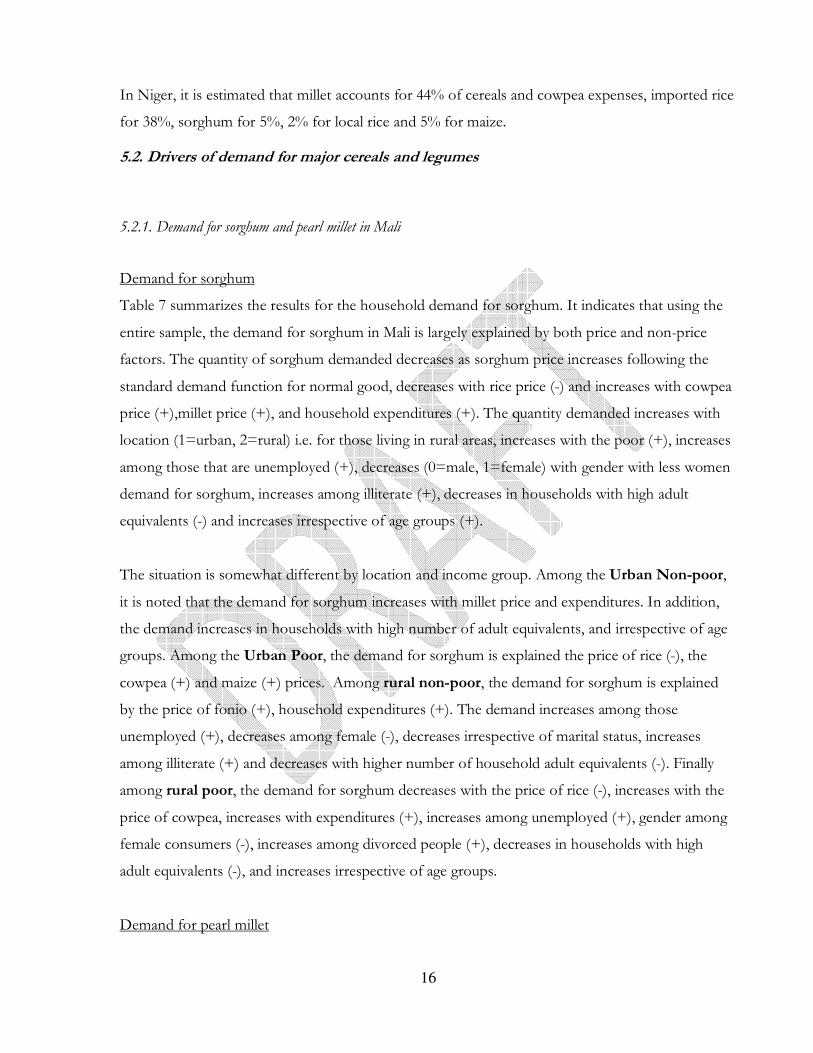
5.2.1. Demand for sorghum and pearl millet in Mali
Demand for sorghum
Table 7 summarizes the results for the household demand for sorghum. It indicates that using the
entire sample, the demand for sorghum in Mali is largely explained by both price and non-price
factors. The quantity of sorghum demanded decreases as sorghum price increases following the
standard demand function for normal good, decreases with rice price (-) and increases with cowpea
price (+),millet price (+), and household expenditures (+). The quantity demanded increases with
location (1=urban, 2=rural) i.e. for those living in rural areas, increases with the poor (+), increases
among those that are unemployed (+), decreases (0=male, 1=female) with gender with less women
demand for sorghum, increases among illiterate (+), decreases in households with high adult
equivalents (-) and increases irrespective of age groups (+).
The situation is somewhat different by location and income group. Among the Urban Non-poor,
it is noted that the demand for sorghum increases with millet price and expenditures. In addition,
the demand increases in households with high number of adult equivalents, and irrespective of age
groups. Among the Urban Poor, the demand for sorghum is explained the price of rice (-), the
cowpea (+) and maize (+) prices. Among rural non-poor, the demand for sorghum is explained
by the price of fonio (+), household expenditures (+). The demand increases among those
unemployed (+), decreases among female (-), decreases irrespective of marital status, increases
among illiterate (+) and decreases with higher number of household adult equivalents (-). Finally
among rural poor, the demand for sorghum decreases with the price of rice (-), increases with the
price of cowpea, increases with expenditures (+), increases among unemployed (+), gender among
female consumers (-), increases among divorced people (+), decreases in households with high
adult equivalents (-), and increases irrespective of age groups.
Demand for pearl millet

17
Table 7 summarizes the results for the household demand for pearl millet. It indicates that using the
entire sample, the demand for pearl millet in Mali is largely explained by both price and non-price
factors. The quantity of pearl millet demanded decreases with pearl millet price following the
standard demand function for normal good, increases with sorghum price, increases with maize
price (+)increases with household expenditures (+). The quantity demanded increases with location
(1=urban, 2=rural) i.e. for those living in rural areas, increases with the poor (+), increases among
those that are unemployed (+),decreases in households with high adult equivalents (-) and decreases
significantly for those having 30 to 40 years (-).
The situation is somewhat different by location and income group. Among the Urban Non-poor,
it is noted that the demand for pearl millet decreases with millet price, increases with sorghum price
(+), decreases with rice price (-), increases with cowpea price (+), increases with maize price (+),
and increases with expenditures (+). In addition, the demand increases in households whose main
activity is agriculture, decreased with high number of adult equivalents, and decreases with with
consumers having less than 40 years of age. Among the Urban Poor, the demand for pearl millet
increases with expenditure (+), increases among those unemployed (+), increases with gender
especially women. Among the rural non-poor, the demand for pearl millet is significantly increases
with household expenditures (+) and decreases in households with high number of adult
equivalents (-). Finally among the rural poor, the demand for pearl millet decreases with pearl
millet price (-), increases with the price of rice (+), decreases with the price of cowpea (-), increases
with fonio price (+) and increases with expenditures (+). In addition, the demand for pearl millet
decreases among unemployed (-), decreased among female consumers (-), and decreases among
households between 30 and 40 years of age.

18
Table 6. Determinants of demand for cereals and cowpea in Mali (all sample)
Sorghum Rice Cowpea Maize Millet
Coef. Std rr Z Coef. Std rr Z Coef. Std Err Z Coef. Std Err Z Coef. Std Err Z
Ln(sorghum price) -0.088 0.041 -2.160 -0.046 0.025 -1.810 0.038 0.023 1.670 -0.010 0.021 -0.450 0.117 0.035 3.330
Ln(rice price) -0.046 0.025 -1.810 -0.208 0.035 -5.980 0.083 0.022 3.780 0.194 0.019 10.070 -0.012 0.028 -0.430
Ln(Cowpea price) 0.038 0.023 1.670 0.083 0.022 3.780 -0.193 0.028 -6.830 0.062 0.013 4.860 0.003 0.022 0.150
Ln (Maize price) -0.010 0.021 -0.450 0.194 0.019 10.070 0.062 0.013 4.860 -0.611 0.023 -27.010 0.337 0.022 15.060
Ln (Millet price) 0.117 0.035 3.330 -0.012 0.028 -0.430 0.003 0.022 0.150 0.337 0.022 15.060 -0.430 0.044 -9.830
Ln (Fonio price) -0.012 0.009 -1.270 -0.011 0.008 -1.510 0.007 0.008 0.800 0.026 0.006 4.420 -0.015 0.010 -1.490
Ln (Expenditures) 0.042 0.003 13.170 -0.085 0.005 -18.360 -0.034 0.002 -21.780 0.019 0.003 6.770 0.061 0.004 14.750
Location 0.030 0.008 3.960 -0.123 0.011 -11.240 0.010 0.004 2.710 -0.004 0.007 -0.530 0.086 0.010 8.830
Poverty status 0.045 0.006 6.910 -0.153 0.009 -16.320 -0.009 0.003 -2.910 0.033 0.006 5.610 0.082 0.008 9.840
indepagric~e 0.004 0.008 0.430 -0.044 0.012 -3.630 0.001 0.004 0.220 0.012 0.007 1.580 0.030 0.011 2.810
indepnonag~c 0.004 0.009 0.420 0.017 0.014 1.230 -0.003 0.005 -0.700 -0.002 0.008 -0.280 -0.014 0.012 -1.170
Unemployed 0.033 0.011 3.040 -0.016 0.016 -1.050 -0.004 0.005 -0.660 -0.008 0.010 -0.830 -0.004 0.014 -0.270
Gender -0.034 0.016 -2.130 0.012 0.023 0.500 0.010 0.008 1.320 0.003 0.014 0.240 0.009 0.021 0.420
Monogamus -0.005 0.023 -0.240 -0.001 0.033 -0.030 0.004 0.011 0.380 -0.004 0.020 -0.200 0.002 0.029 0.060
Polygamus -0.011 0.023 -0.490 0.012 0.034 0.350 0.009 0.011 0.790 0.005 0.021 0.250 -0.020 0.030 -0.670
Divorced 0.031 0.026 1.190 -0.010 0.038 -0.270 -0.013 0.013 -1.030 -0.006 0.023 -0.270 -0.005 0.034 -0.160
Illiterate 0.015 0.007 2.020 -0.036 0.010 -3.480 0.006 0.004 1.550 0.010 0.006 1.490 0.008 0.009 0.890
Adult equivalent -0.002 0.001 -2.460 0.003 0.001 2.340 0.004 0.000 8.980 -0.002 0.001 -2.130 -0.003 0.001 -3.100
nnhage1 0.021 0.009 2.380 0.001 0.013 0.090 -0.004 0.004 -0.910 0.001 0.008 0.100 -0.019 0.012 -1.640
nnhage2 0.028 0.008 3.370 0.007 0.012 0.540 0.000 0.004 -0.040 -0.011 0.007 -1.510 -0.024 0.011 -2.240
nnhage3 0.020 0.008 2.440 -0.010 0.012 -0.820 -0.002 0.004 -0.580 -0.009 0.007 -1.230 0.002 0.011 0.140
Region -0.017 0.001 -12.590 0.033 0.002 17.740 -0.005 0.001 -7.420 -0.019 0.001 -16.000 0.006 0.002 3.830
Constant -0.140 0.042 -3.350 1.293 0.059 21.870 0.337 0.022 15.010 -0.244 0.036 -6.700 -0.265 0.053 -5.030
Source: Calculated from INSTAT data, 2006.

19
The largest expenditure elasticity is 1.94 for both the education and transportation services. Except
health, education, tourism services, and possibly clothing all commodity aggregates are in the
inelastic region of their demand curves at the sample mean.
5.2.2. Demand for sorghum and pearl millet in Niger
Demand for sorghum
Table 9 summarizes the results for the household demand for sorghum in Niger. It indicates that
using the entire sample, the demand for sorghum in Niger is not responsive to its own price but
increases with increases the price of rice (+), increases with the price of cowpea (+), decreases with
the price of maize (-) and the price of pearl millet (-) but increases with household expenditures (+).
In addition the demand increases in the rural area, among the poor, in households with high
number of adult equivalents.
The situation is somewhat different by location and income group. Among the Urban Non-poor,
it is noted that the demand for sorghum increases with millet price (+), with cowpea price (+),
decreases with maize (-) and pearl millet prices (-) and increases with expenditures (+). In addition,
the demand increases among the young of less than 30 years of age; decreases among literate (-),
increases among those households whose main occupation is agriculture. Among the Urban Poor,
the demand for sorghum is explained the price of cowpea (+) and household expenditures (+).
Among rural non-poor, the demand for sorghum is explained by household expenditures (+).
Finally among rural poor, the demand for sorghum increases with the price of rice (+), decreases
with maize price (-) and millet price (-). In addition, the demand for sorghum increases among
illiterate (+), those with major occupation in the non-farm sector, increases in households with high
adult equivalents (+).
Demand for pearl millet
Table 9 summarizes the results for the household demand for pearl millet. It indicates that using the
entire sample, the demand for pearl millet in Niger is largely explained by both price and non-price
factors. The quantity of pearl millet demanded increases with pearl millet price following the
demand function for Giffen good, decreases with sorghum price, decreases with cowpea price (-),

20
decreases with maize price (-), and increases with household expenditures (+). The quantity
demanded increases with location (1=urban, 2=rural) i.e. for those living in rural areas, increases
with the poor (+). In addition, the quantity demanded of pearl millet increases among women,
decreases in all age groups (-), decreases among literate (-), and increases among those whose major
activity is agriculture (+).
The situation is somewhat different by location and income group. Among the Urban Non-poor,
it is noted that the demand for pearl millet decreases with sorghum price, decreases with maize
price (+) and increases with expenditures (+). In addition, the demand for pearl millet decreases
irrespective of age groups (-), decreases among literate (-), increases in households whose main
activity is agriculture (+), and decreases with consumers having less than 40 years of age. Among
the Urban Poor, the demand for pearl millet increases millet price (+), decreases with cowpea price
(-), decrease s with pearl millet price (-), and increases with household expenditure (+). It increases
among women (+), decreases among consumers between 30 and 50 years old, and decreases among
literate (-). Among the rural non-poor, the demand for pearl millet decreases with millet price (-),
increases with rice price (+) and increases with household expenditures (+). It decreases in age
groups of more than 30 years old, decreases among literate (-), and increases among households
whose main activity is agriculture. Finally among the rural poor, the demand for pearl millet
decreases with sorghum price (-) and increases with expenditure (+). It increases among the young
of 30 years or less and decreases among the literate.

21
Table 7. Determinants of demand for cereals and cowpea in Niger (all sample)
Sorghum Imported Rice Cowpea Maize Millet
Coef. Std. Err. z Coef. Std. Err. z Coef. Std. Err. z Coef. Std. Err. z Coef. Std. Err. z
lnprixsorg~m 0.020 0.016 1.240 0.062 0.019 3.320 0.039 0.011 3.510 -0.014 0.003 -5.150 -0.108 0.023 -4.730
lnpriximrice 0.062 0.019 3.320 -0.153 0.042 -3.650 0.082 0.018 4.610 0.013 0.005 2.790 -0.003 0.041 -0.080
lnprixlorice -0.002 0.001 -1.180 -0.010 0.002 -4.490 0.006 0.001 4.790 -0.004 0.001 -3.720 -0.002 0.002 -0.900
lnprixniebe 0.039 0.011 3.510 0.082 0.018 4.610 -0.083 0.015 -5.570 0.002 0.002 0.910 -0.040 0.020 -2.040
lnprixmais -0.014 0.003 -5.150 0.013 0.005 2.790 0.002 0.002 0.910 0.008 0.003 2.990 -0.009 0.005 -1.820
Lnprixmil -0.108 0.023 -4.730 -0.003 0.041 -0.080 -0.040 0.020 -2.040 -0.009 0.005 -1.820 0.160 0.052 3.060
lndepcere~es 0.015 0.003 5.180 -0.075 0.005 -14.910 -0.065 0.002 -26.910 0.016 0.003 5.350 0.110 0.005 20.250
Urru 0.028 0.006 4.520 -0.289 0.011 -26.470 0.029 0.005 5.540 -0.064 0.006 -10.170 0.297 0.012 25.140
Pauvre 0.015 0.005 3.110 -0.144 0.008 -17.600 -0.010 0.004 -2.640 0.004 0.005 0.910 0.140 0.009 15.740
Sexe -0.007 0.007 -1.010 -0.012 0.012 -1.010 -0.003 0.006 -0.490 0.003 0.007 0.430 0.021 0.013 1.650
trancheage1 0.004 0.008 0.510 -0.002 0.014 -0.170 0.007 0.007 1.080 0.000 0.008 -0.050 -0.004 0.016 -0.290
trancheage2 0.001 0.007 0.120 0.044 0.012 3.650 -0.011 0.006 -1.860 0.007 0.007 1.050 -0.042 0.013 -3.280
trancheage3 0.005 0.006 0.770 0.022 0.011 2.010 -0.004 0.005 -0.840 0.011 0.006 1.720 -0.030 0.012 -2.440
trancheage4 0.004 0.007 0.610 0.014 0.012 1.220 0.002 0.006 0.360 0.011 0.007 1.580 -0.026 0.013 -2.020
Illiterate -0.003 0.006 -0.550 0.076 0.010 7.900 -0.011 0.005 -2.350 0.001 0.006 0.150 -0.067 0.010 -6.400
indepagric~e 0.006 0.007 0.880 -0.101 0.013 -8.050 0.008 0.006 1.320 0.026 0.007 3.610 0.044 0.014 3.250
indepnonag~c 0.006 0.006 0.980 -0.056 0.011 -5.050 -0.001 0.005 -0.100 0.011 0.006 1.660 0.036 0.012 2.990
Adeq 0.002 0.001 2.060 -0.001 0.001 -0.810 -0.003 0.001 -4.340 0.003 0.001 4.070 -0.001 0.001 -0.550
Diffa 0.001 0.013 0.040 0.094 0.023 4.020 -0.004 0.012 -0.320 0.070 0.013 5.430 -0.171 0.025 -6.870
Dosso -0.025 0.011 -2.220 -0.139 0.020 -7.020 -0.019 0.010 -1.970 0.166 0.011 15.130 0.020 0.021 0.950
Maradi -0.003 0.012 -0.250 -0.140 0.023 -5.970 -0.002 0.011 -0.170 0.057 0.011 5.340 0.091 0.024 3.800
Tahoua 0.039 0.012 3.320 -0.154 0.021 -7.450 -0.018 0.010 -1.770 0.036 0.011 3.240 0.134 0.022 6.090
Tillaberi 0.020 0.013 1.580 -0.117 0.022 -5.350 -0.036 0.011 -3.380 0.108 0.012 8.950 0.002 0.023 0.100
Zinder 0.029 0.013 2.330 -0.106 0.024 -4.400 -0.025 0.011 -2.210 0.059 0.010 5.590 0.048 0.024 1.980
Cuniamey 0.011 0.012 0.940 0.102 0.021 4.880 -0.040 0.010 -3.950 0.051 0.012 4.260 -0.076 0.023 -3.370
_cons -0.154 0.024 -6.480 1.518 0.045 33.820 0.322 0.020 15.690 -0.049 0.020 -2.400 -0.643 0.048 -13.520
Source: Authors’ calculation based on INSTAT Data, Mali 2006.

22
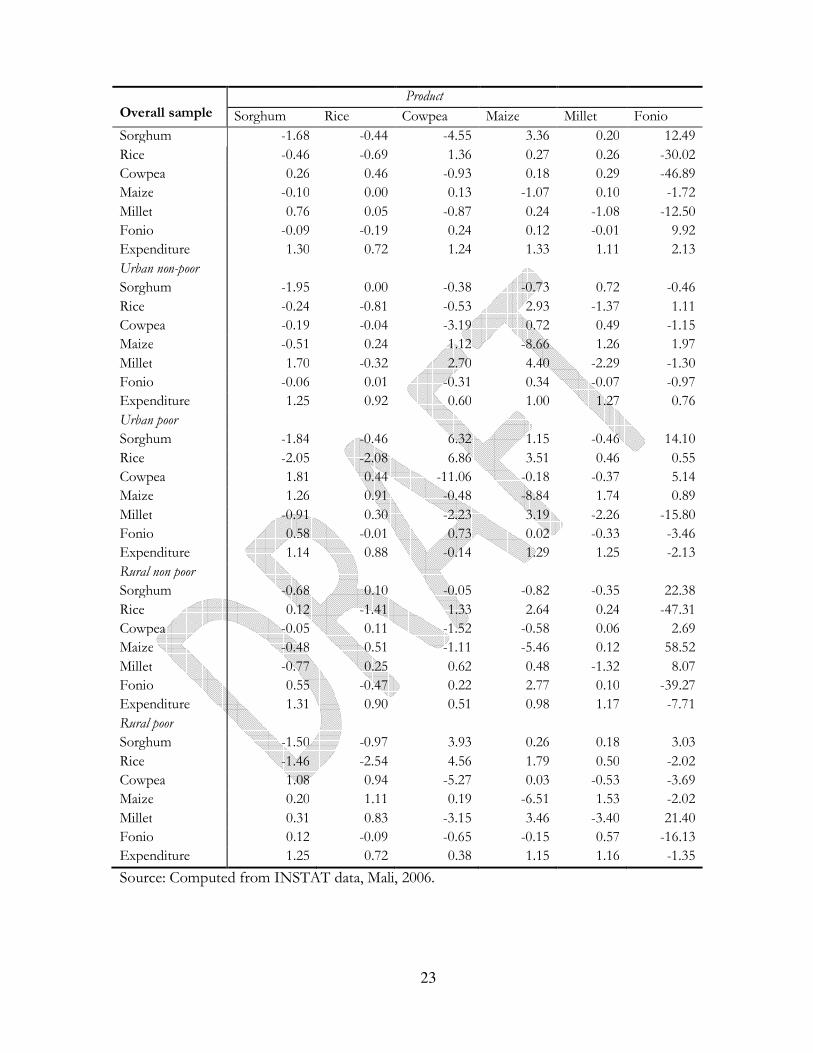
5.3. Expenditures and price elasticities of demand
5.3.1. Mali
Table 10 summarizes the expenditure and price elasticities of demand for surveyed households in
Mali. For the whole sample, the values of own price elasticities indicate that sorghum, maize, and
pearl millet are price elastic. Rice and cowpea are price inelastic and fonio is behaving as a Giffen
good. Sorghum, cowpea, maize, pearl millet and fonio are expenditure elastic (income elasticities
greater than 1) suggesting that these crops are luxury goods whereas rice is a necessity good. For
sorghum, cross price elasticities showed that sorghum is substituted by cowpea and pearl millet but
is complemented by rice, maize and fonio. For pearl millet, cross-price elasticities indicate that
sorghum, rice, cowpea, and maize are substitutes and fonio is a complement.
This is somewhat different by location and income group. Among Urban non-poor, it is estimated
that sorghum, cowpea, maize, and millet are price elastic while rice and fonio are price inelastic.
Pearl millet, maize and sorghum are luxury goods; rice, cowpea and fonio are necessity goods. For
sorghum, all other food items are complements while pearl millet is substitute for sorghum. For
pearl millet, sorghum, cowpea, maize are substitutes while rice and fonio are complements. Among
Urban poor, all food items are price elastic. Sorghum, maize and millet are luxury goods. Rice is a
necessity good and cowpea and fonio are inferior goods. Cross-price relationships showed that
cowpea, fonio and maize are sorghum substitutes whereas rice and pearl millet are complements.
For pearl millet, rice and maize are substitutes and sorghum, cowpea and fonio are complements.
Among Rural non-poor, all food items except sorghum are price elastic. Sorghum and pearl millet
are luxury goods, rice, cowpea, maize are necessity goods and fonio is an inferior good. Cross-price
elasticities showed that for sorghum, fonio and rice are substitutes while cowpea, maize, and pearl
millet are complements. For pearl millet, rice, cowpea, maize and fonio are substitutes whereas
sorghum is a complement. Among the Rural poor, all food items are price elastic. Sorghum, maize
and pearl millet are luxury goods and rice, cowpea are necessity goods and fonio behaves as an
inferior good. Cross-price relationships showed that for sorghum, rice is a complement and other
food items are substitutes. For pearl millet, sorghum, rice, maize and fonio are substitutes while
cowpea is a complement.
Table 8: Expenditure and price elasticities of demand for Malian households by poverty groups
23
Overall sample
Product
Sorghum Rice Cowpea Maize Millet Fonio
Sorghum -1.68 -0.44 -4.55 3.36 0.20 12.49
Rice -0.46 -0.69 1.36 0.27 0.26 -30.02
Cowpea 0.26 0.46 -0.93 0.18 0.29 -46.89
Maize -0.10 0.00 0.13 -1.07 0.10 -1.72
Millet 0.76 0.05 -0.87 0.24 -1.08 -12.50
Fonio -0.09 -0.19 0.24 0.12 -0.01 9.92
Expenditure 1.30 0.72 1.24 1.33 1.11 2.13
Urban non-poor
Sorghum -1.95 0.00 -0.38 -0.73 0.72 -0.46
Rice -0.24 -0.81 -0.53 2.93 -1.37 1.11
Cowpea -0.19 -0.04 -3.19 0.72 0.49 -1.15
Maize -0.51 0.24 1.12 -8.66 1.26 1.97
Millet 1.70 -0.32 2.70 4.40 -2.29 -1.30
Fonio -0.06 0.01 -0.31 0.34 -0.07 -0.97
Expenditure 1.25 0.92 0.60 1.00 1.27 0.76
Urban poor
Sorghum -1.84 -0.46 6.32 1.15 -0.46 14.10
Rice -2.05 -2.08 6.86 3.51 0.46 0.55
Cowpea 1.81 0.44 -11.06 -0.18 -0.37 5.14
Maize 1.26 0.91 -0.48 -8.84 1.74 0.89
Millet -0.91 0.30 -2.23 3.19 -2.26 -15.80
Fonio 0.58 -0.01 0.73 0.02 -0.33 -3.46
Expenditure 1.14 0.88 -0.14 1.29 1.25 -2.13
Rural non poor
Sorghum -0.68 0.10 -0.05 -0.82 -0.35 22.38
Rice 0.12 -1.41 1.33 2.64 0.24 -47.31
Cowpea -0.05 0.11 -1.52 -0.58 0.06 2.69
Maize -0.48 0.51 -1.11 -5.46 0.12 58.52
Millet -0.77 0.25 0.62 0.48 -1.32 8.07
Fonio 0.55 -0.47 0.22 2.77 0.10 -39.27
Expenditure 1.31 0.90 0.51 0.98 1.17 -7.71
Rural poor
Sorghum -1.50 -0.97 3.93 0.26 0.18 3.03
Rice -1.46 -2.54 4.56 1.79 0.50 -2.02
Cowpea 1.08 0.94 -5.27 0.03 -0.53 -3.69
Maize 0.20 1.11 0.19 -6.51 1.53 -2.02
Millet 0.31 0.83 -3.15 3.46 -3.40 21.40
Fonio 0.12 -0.09 -0.65 -0.15 0.57 -16.13
Expenditure 1.25 0.72 0.38 1.15 1.16 -1.35
Source: Computed from INSTAT data, Mali, 2006.

24
5.3.2. Niger
Table 11 summarizes the expenditure and price elasticities of demand for surveyed households in
Niger. For the whole sample, the values of own price elasticities indicate that imported rice and
cowpea are price elastic while sorghum, local rice, maize and pearl millet are price inelastic.
Sorghum, maize, pearl millet are expenditure elastic (expenditure elasticities greater than 1)
suggesting that these crops are luxury goods whereas imported rice and local rice are necessity
goods and finally cowpea is an inferior good. For sorghum, cross-price elasticities showed that
sorghum is substituted by imported rice and cowpea while local rice, maize and millet are
complements. For pearl millet, cross-price elasticities indicate that all food items are complements.
This is somewhat different by location and income group. Among Urban non-poor, it is estimated
that cowpea and millet are price elastic. Sorghum, imported and maize are price non-elastic whereas
local rice is giffen good. All food items are luxury goods while local rice is a necessity good. Cross-
price elasticities showed that for sorghum, local, imported rice and local rice are substitutes. For
pearl millet, all food items are complements while sorghum is a substitute. Among Urban poor, all
food items are price inelastic except for local rice behaving as a Giffen good and imported rice is
price elastic. Cross-price relationships showed that all food items are complements except for
cowpea which is a substitute. cowpea, fonio and maize are sorghum substitutes whereas rice and
pearl millet are complements. For pearl millet all food items are complements except sorghum
which is a substitute. Among Rural non-poor, all food items except sorghum are price elastic
except for local rice and maize which are price inelastic. Sorghum, maize and pearl millet are luxury
goods, imported rice and local rice are necessity goods and cowpea is an inferior good. Cross-price
elasticities showed that for imported rice, cowpea and millet are sorghum substitutes while local rice
and maize are sorghum complements. For pearl millet, sorghum and imported are substitutes and
whereas all food items are complements. Among the Rural poor, imported rice, cowpea and pearl
millet are price elastic. Sorghum, local rice and maize are price non-elastic. Sorghum, maize and
pearl millet are luxury goods. Local rice is a necessity good and imported rice and cowpea are
inferior goods. Cross-price relationships showed that for sorghum, imported rice and cowpea are
substitutes and other food items are complements. For pearl millet, sorghum, local rice and maize
are complements whereas imported rice and cowpea substitutes.

25
Table 9. Expenditure and price elasticities of demand for Nigerien households by poverty groupsi
Overall sample Product
Sorghum Imp rice Loc. rice Cowpea Maize Millet
Sorghum -0.578 0.172 0.002 0.678 -0.272 -0.256
Imported rice 1.204 -1.329 0.014 1.318 0.127 -0.102
Local rice -0.038 -0.024 -0.271 0.107 -0.089 -0.009
Cowpea 0.823 0.228 0.002 -2.267 0.033 -0.108
Maize -0.311 0.044 0.002 0.088 -0.863 -0.130
Millet -2.452 0.078 0.016 -0.192 -0.299 -0.746
Expenditures 1.320 0.803 0.963 -0.038 1.293 1.250
Urban non-poor
Sorghum -0.231 0.050 -24.227 -0.033 0.279 0.639
Imported rice 0.612 -0.963 -18.177 -0.104 -0.191 -0.696
Local rice 0.173 -0.121 17.182 -0.226 -0.055 -0.005
Cowpea 4.678 -0.012 0.300 -1.076 0.670 -0.764
Maize -1.491 0.044 -2.873 -0.099 -0.877 -0.134
Millet -5.928 0.039 8.243 -0.180 -0.019 -1.084
Expenditures 2.368 1.033 0.884 1.306 1.501 2.292
Urban poor
Sorghum -0.719 0.068 -2.861 -0.197 0.159 0.126
Imported rice -2.360 -1.339 7.152 0.146 0.058 -0.027
Local rice -0.104 -0.118 1.378 0.039 -0.011 -0.019
Cowpea 3.522 -0.092 0.946 -0.822 0.681 -0.560
Maize -0.178 -0.034 -1.052 0.343 -0.784 -0.051
Millet -1.910 0.145 -6.371 0.190 -0.007 -0.507
Expenditures 1.662 0.879 0.975 0.056 1.430 1.305
Rural non poor
Sorghum -2.137 0.149 0.001 0.396 -0.063 0.027
Imported rice 0.405 -2.757 0.004 1.531 -0.103 0.382
Local rice -0.007 -0.104 -0.388 0.201 -0.066 -0.017
Cowpea 0.334 0.538 0.001 -2.294 0.001 -0.070
Maize -0.059 -0.011 0.001 0.073 -0.975 -0.106
Millet 0.237 1.293 0.011 0.380 0.099 -1.538
Expenditures 1.229 0.782 0.981 -0.436 1.044 1.204
Rural poor
Sorghum -0.725 1.113 0.004 0.539 -0.362 -0.134
Imported rice 0.906 -3.745 0.003 1.533 0.092 0.054
Local rice -0.059 0.013 -0.330 0.124 -0.098 -0.007
Cowpea 0.242 1.039 0.002 -3.513 0.027 0.026
Maize -0.259 0.156 0.003 0.120 -0.960 -0.121
Millet -1.250 1.613 0.038 1.665 -0.023 -1.123
Expenditures 1.087 -0.191 0.948 -0.462 1.237 1.178
Source: calculated from the ENBD data, Niger 2007.

26
VI - Conclusions and implications
This study used household consumption surveys carried out in Mali and Niger in 2006 an 2007
respectively to identify the drivers of consumption of pearl millet and sorghum and compute the
price and expenditure elasticities of sorghum and pearl millet. Price of substitutes and expenditure
are major drivers of demand for sorghum and pearl millet. Sorghum and millet are luxury goods for
many households in the Sahel. Sorghum and millet are substitutes. There are however differences
based on income groups and location.
The coefficients derived from this study may be biased because many of the goods have zero
consumption. Techniques that do not account for zero in consumption may yield biased results.
However a simultaneous multivariate tobit model was used to correct for the bias and inconsistency
but did not converge. Continuing efforts to look for appropriate models is warranted.

27
References
Akinleye & MAY Rahji (2006) Nutrient elasticities among Nigerian Households differentiated by income, Agrekon, Vol. 46 (2):274-288. J. Banks, R. Blundell, and A. Lewbel (1997). Quadratic engel curves and consumer demand. Review of Econ. and Stat., 4:527-539. Christensen, L.R., D.W. Jorgensen, and L.J. Lau (1975). Transcendental logarithmic utility functions,. Amer. Econ. Rev, 65:367-83. Deaton, A. (1988). Quality, quantity, and spatial variation of price. Amer. Econ. Rev.,78:418-30. Deaton, A. and J. Muellbauer. (1980). Economics and Consumer Behavior. Cambridge University Press, Cambridge., 1980. ENBC. Troisieme enquete nationale sur le budget et la consommation des ménages. Technical report, NER-INS-ENBC, 2007. HDReport (2010). The Real Wealth of Nations: Pathways to Human Development. Technical Report, Human Development Report: United Nations Development Program, 2010. C. Lluch, A. Powell, and R. Williams (1977). Patterns in Household Demand and Savings. Oxford University Press. Theil, H. (1965). The information approach to demand analysis. Econometrica, 33:67-87.
28
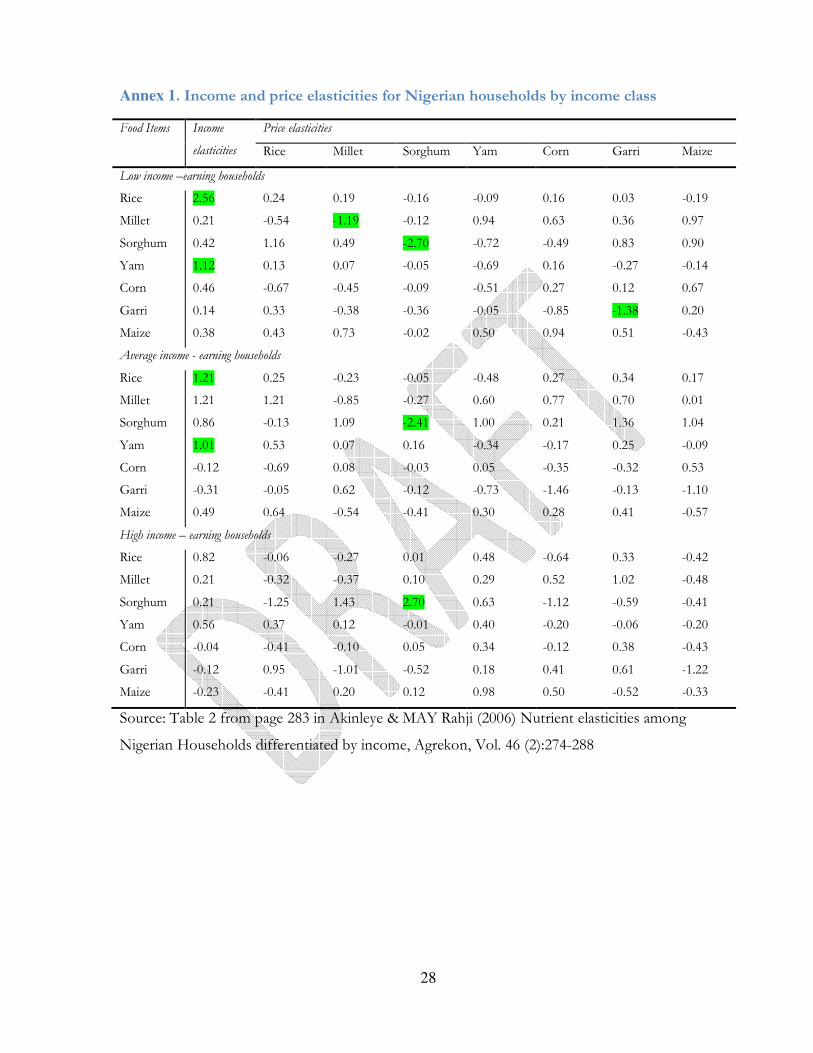
Annex 1. Income and price elasticities for Nigerian households by income class
Food Items Income
elasticities
Price elasticities
Rice Millet Sorghum Yam Corn Garri Maize
Low income –earning households
Rice 2.56 0.24 0.19 -0.16 -0.09 0.16 0.03 -0.19
Millet 0.21 -0.54 -1.19 -0.12 0.94 0.63 0.36 0.97
Sorghum 0.42 1.16 0.49 -2.70 -0.72 -0.49 0.83 0.90
Yam 1.12 0.13 0.07 -0.05 -0.69 0.16 -0.27 -0.14
Corn 0.46 -0.67 -0.45 -0.09 -0.51 0.27 0.12 0.67
Garri 0.14 0.33 -0.38 -0.36 -0.05 -0.85 -1.38 0.20
Maize 0.38 0.43 0.73 -0.02 0.50 0.94 0.51 -0.43
Average income - earning households
Rice 1.21 0.25 -0.23 -0.05 -0.48 0.27 0.34 0.17
Millet 1.21 1.21 -0.85 -0.27 0.60 0.77 0.70 0.01
Sorghum 0.86 -0.13 1.09 -2.41 1.00 0.21 1.36 1.04
Yam 1.01 0.53 0.07 0.16 -0.34 -0.17 0.25 -0.09
Corn -0.12 -0.69 0.08 -0.03 0.05 -0.35 -0.32 0.53
Garri -0.31 -0.05 0.62 -0.12 -0.73 -1.46 -0.13 -1.10
Maize 0.49 0.64 -0.54 -0.41 0.30 0.28 0.41 -0.57
High income – earning households
Rice 0.82 -0.06 -0.27 0.01 0.48 -0.64 0.33 -0.42
Millet 0.21 -0.32 -0.37 0.10 0.29 0.52 1.02 -0.48
Sorghum 0.21 -1.25 1.43 2.70 0.63 -1.12 -0.59 -0.41
Yam 0.56 0.37 0.12 -0.01 0.40 -0.20 -0.06 -0.20
Corn -0.04 -0.41 -0.10 0.05 0.34 -0.12 0.38 -0.43
Garri -0.12 0.95 -1.01 -0.52 0.18 0.41 0.61 -1.22
Maize -0.23 -0.41 0.20 0.12 0.98 0.50 -0.52 -0.33
Source: Table 2 from page 283 in Akinleye & MAY Rahji (2006) Nutrient elasticities among
Nigerian Households differentiated by income, Agrekon, Vol. 46 (2):274-288

29
Annex 2. Determinants of demand for cereals and cowpea in Mali (Urban Non-poor)
Sorghum Rice Cowpea Maize Millet
Coef. Std Err Z Coef. Std Err Z Coef. Std Err Z Coef. Std Err Z Coef. Std Err Z
Ln(Sorghum price) -0.071 0.045 -1.570 -0.006 0.036 -0.160 -0.014 0.028 -0.510 -0.038 0.028 -1.360 0.134 0.044 3.060
Ln(Rice price) -0.006 0.036 -0.160 0.088 0.058 1.530 -0.027 0.030 -0.910 0.153 0.030 5.060 -0.217 0.044 -4.900
Ln(Cowpea price) -0.014 0.028 -0.510 -0.027 0.030 -0.910 -0.076 0.037 -2.020 0.038 0.018 2.090 0.090 0.029 3.140
Ln (Maize price) -0.038 0.028 -1.360 0.153 0.030 5.060 0.038 0.018 2.090 -0.400 0.035 -11.590 0.230 0.035 6.660
Ln (Millet price) 0.134 0.044 3.060 -0.217 0.044 -4.900 0.090 0.029 3.140 0.230 0.035 6.660 -0.225 0.064 -3.490
Ln (Fonio price) -0.004 0.012 -0.360 0.009 0.012 0.740 -0.011 0.012 -0.870 0.018 0.010 1.790 -0.012 0.016 -0.770
Ln (Expenditures) 0.019 0.005 3.590 -0.052 0.009 -6.010 -0.014 0.002 -5.720 0.000 0.005 0.010 0.049 0.007 6.880
indepagric~e 0.006 0.013 0.440 -0.041 0.021 -1.970 -0.002 0.006 -0.360 -0.004 0.011 -0.330 0.045 0.017 2.640
indepnonag~c 0.006 0.010 0.630 -0.021 0.016 -1.330 0.001 0.004 0.280 0.013 0.008 1.590 0.000 0.013 0.040
Unemployed 0.021 0.015 1.410 -0.012 0.024 -0.480 -0.006 0.007 -0.850 0.006 0.013 0.480 -0.007 0.020 -0.350
Gender 0.000 0.019 0.020 -0.024 0.030 -0.780 -0.007 0.008 -0.790 0.017 0.016 1.070 0.012 0.025 0.500
Monogamus -0.023 0.026 -0.910 -0.039 0.041 -0.960 0.020 0.011 1.730 0.016 0.022 0.710 0.018 0.034 0.550
Polygamus -0.010 0.027 -0.370 -0.034 0.044 -0.780 0.025 0.012 2.060 0.020 0.024 0.840 -0.011 0.036 -0.300
Divorced -0.020 0.030 -0.660 -0.023 0.049 -0.470 0.027 0.013 2.000 0.004 0.026 0.150 -0.001 0.040 -0.020
Illiterate 0.014 0.009 1.620 -0.005 0.014 -0.340 0.008 0.004 2.050 0.002 0.007 0.270 -0.017 0.011 -1.520
Adult equivalent 0.002 0.001 1.650 0.000 0.002 0.080 0.002 0.001 3.180 0.000 0.001 -0.260 -0.004 0.002 -2.370
nnhage1 0.027 0.015 1.820 0.013 0.024 0.550 0.005 0.007 0.760 -0.006 0.013 -0.470 -0.041 0.020 -2.100
nnhage2 0.035 0.014 2.510 0.003 0.023 0.150 0.002 0.006 0.310 0.000 0.012 -0.010 -0.043 0.019 -2.340
nnhage3 0.024 0.014 1.680 0.003 0.023 0.150 -0.004 0.006 -0.670 -0.007 0.012 -0.610 -0.013 0.019 -0.700
Region -0.005 0.001 -3.760 0.006 0.002 3.010 -0.002 0.001 -2.540 -0.003 0.001 -3.040 0.003 0.002 1.700
Constant -0.059 0.056 -1.040 1.031 0.089 11.580 0.191 0.029 6.520 -0.159 0.049 -3.230 -0.018 0.073 -0.250
Source: Calculated from INSTAT data, 2006.
30
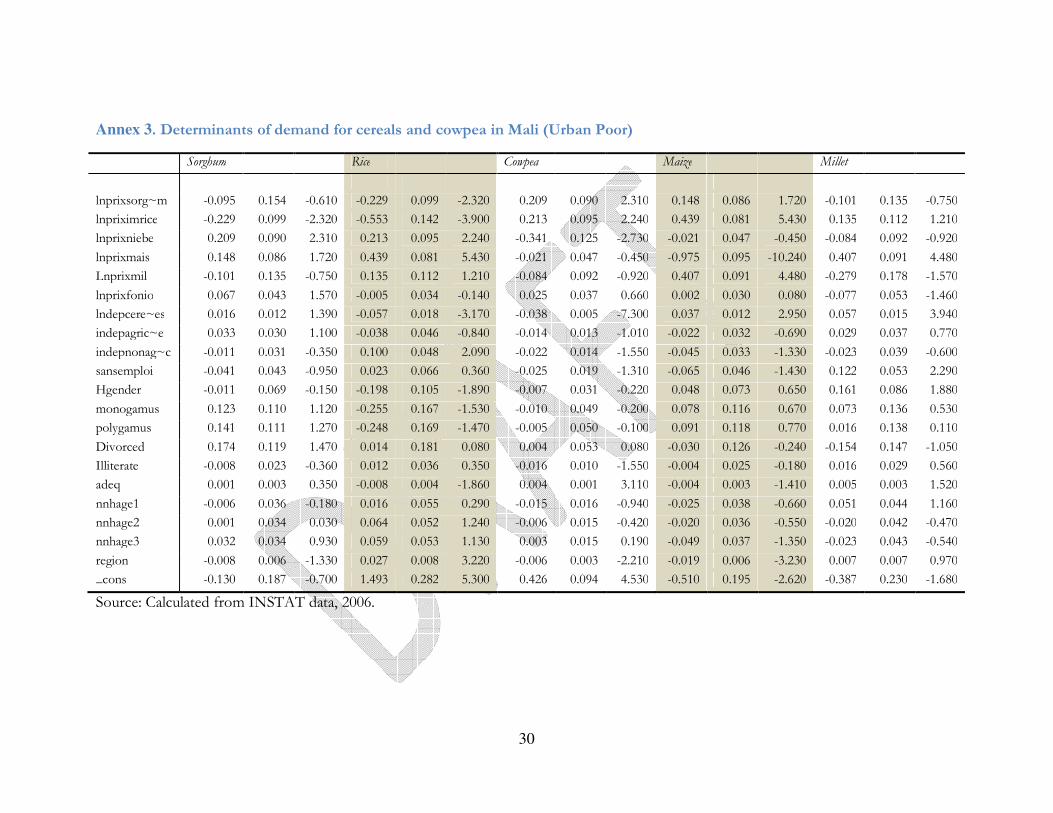
Annex 3. Determinants of demand for cereals and cowpea in Mali (Urban Poor)
Sorghum Rice Cowpea Maize Millet
lnprixsorg~m -0.095 0.154 -0.610 -0.229 0.099 -2.320 0.209 0.090 2.310 0.148 0.086 1.720 -0.101 0.135 -0.750
lnpriximrice -0.229 0.099 -2.320 -0.553 0.142 -3.900 0.213 0.095 2.240 0.439 0.081 5.430 0.135 0.112 1.210
lnprixniebe 0.209 0.090 2.310 0.213 0.095 2.240 -0.341 0.125 -2.730 -0.021 0.047 -0.450 -0.084 0.092 -0.920
lnprixmais 0.148 0.086 1.720 0.439 0.081 5.430 -0.021 0.047 -0.450 -0.975 0.095 -10.240 0.407 0.091 4.480
Lnprixmil -0.101 0.135 -0.750 0.135 0.112 1.210 -0.084 0.092 -0.920 0.407 0.091 4.480 -0.279 0.178 -1.570
lnprixfonio 0.067 0.043 1.570 -0.005 0.034 -0.140 0.025 0.037 0.660 0.002 0.030 0.080 -0.077 0.053 -1.460
lndepcere~es 0.016 0.012 1.390 -0.057 0.018 -3.170 -0.038 0.005 -7.300 0.037 0.012 2.950 0.057 0.015 3.940
indepagric~e 0.033 0.030 1.100 -0.038 0.046 -0.840 -0.014 0.013 -1.010 -0.022 0.032 -0.690 0.029 0.037 0.770
indepnonag~c -0.011 0.031 -0.350 0.100 0.048 2.090 -0.022 0.014 -1.550 -0.045 0.033 -1.330 -0.023 0.039 -0.600
sansemploi -0.041 0.043 -0.950 0.023 0.066 0.360 -0.025 0.019 -1.310 -0.065 0.046 -1.430 0.122 0.053 2.290
Hgender -0.011 0.069 -0.150 -0.198 0.105 -1.890 -0.007 0.031 -0.220 0.048 0.073 0.650 0.161 0.086 1.880
monogamus 0.123 0.110 1.120 -0.255 0.167 -1.530 -0.010 0.049 -0.200 0.078 0.116 0.670 0.073 0.136 0.530
polygamus 0.141 0.111 1.270 -0.248 0.169 -1.470 -0.005 0.050 -0.100 0.091 0.118 0.770 0.016 0.138 0.110
Divorced 0.174 0.119 1.470 0.014 0.181 0.080 0.004 0.053 0.080 -0.030 0.126 -0.240 -0.154 0.147 -1.050
Illiterate -0.008 0.023 -0.360 0.012 0.036 0.350 -0.016 0.010 -1.550 -0.004 0.025 -0.180 0.016 0.029 0.560
adeq 0.001 0.003 0.350 -0.008 0.004 -1.860 0.004 0.001 3.110 -0.004 0.003 -1.410 0.005 0.003 1.520
nnhage1 -0.006 0.036 -0.180 0.016 0.055 0.290 -0.015 0.016 -0.940 -0.025 0.038 -0.660 0.051 0.044 1.160
nnhage2 0.001 0.034 0.030 0.064 0.052 1.240 -0.006 0.015 -0.420 -0.020 0.036 -0.550 -0.020 0.042 -0.470
nnhage3 0.032 0.034 0.930 0.059 0.053 1.130 0.003 0.015 0.190 -0.049 0.037 -1.350 -0.023 0.043 -0.540
region -0.008 0.006 -1.330 0.027 0.008 3.220 -0.006 0.003 -2.210 -0.019 0.006 -3.230 0.007 0.007 0.970
_cons -0.130 0.187 -0.700 1.493 0.282 5.300 0.426 0.094 4.530 -0.510 0.195 -2.620 -0.387 0.230 -1.680
Source: Calculated from INSTAT data, 2006.

31
Annex 4. Determinants of demand for cereals and cowpea in Mali (Rural Non-poor)
Sorghum Rice Cowpea Maize Millet
lnprixsorg~m 0.054 0.072 0.750 0.036 0.041 0.870 -0.005 0.036 -0.140 -0.067 0.042 -1.580 -0.100 0.066 -1.510
lnpriximrice 0.036 0.041 0.870 -0.192 0.058 -3.300 0.046 0.035 1.310 0.212 0.034 6.270 0.094 0.049 1.940
lnprixniebe -0.005 0.036 -0.140 0.046 0.035 1.310 -0.022 0.048 -0.460 -0.047 0.030 -1.540 0.019 0.037 0.530
lnprixmais -0.067 0.042 -1.580 0.212 0.034 6.270 -0.047 0.030 -1.540 -0.359 0.046 -7.830 0.038 0.043 0.880
lnprixmil -0.100 0.066 -1.510 0.094 0.049 1.940 0.019 0.037 0.530 0.038 0.043 0.880 -0.083 0.081 -1.020
lnprixfonio 0.081 0.023 3.550 -0.197 0.018 -10.900 0.009 0.017 0.530 0.223 0.018 12.170 0.031 0.025 1.230
lndepcere~es 0.045 0.005 8.690 -0.042 0.008 -5.200 -0.020 0.003 -7.450 -0.002 0.004 -0.420 0.052 0.007 7.420
indepagric~e 0.003 0.015 0.210 -0.039 0.024 -1.670 0.011 0.007 1.500 0.018 0.011 1.720 0.028 0.020 1.400
indepnonag~c -0.008 0.019 -0.430 0.096 0.031 3.110 -0.006 0.010 -0.660 -0.030 0.014 -2.140 -0.026 0.027 -0.990
sansemploi 0.043 0.020 2.140 0.003 0.032 0.100 0.005 0.010 0.460 -0.007 0.015 -0.470 -0.014 0.028 -0.510
Hgender -0.082 0.024 -3.450 0.311 0.038 8.280 0.091 0.012 7.480 -0.083 0.017 -4.800 -0.051 0.032 -1.590
monogamus -0.072 0.031 -2.270 0.428 0.049 8.670 0.058 0.016 3.560 -0.037 0.023 -1.590 -0.122 0.043 -2.860
polygamus -0.061 0.033 -1.830 0.395 0.052 7.540 0.060 0.017 3.490 -0.035 0.024 -1.460 -0.113 0.045 -2.510
Divorced -0.001 0.042 -0.030 0.190 0.068 2.810 -0.013 0.021 -0.620 0.014 0.030 0.470 -0.050 0.058 -0.860
Illiterate 0.026 0.013 1.930 -0.056 0.022 -2.590 0.010 0.007 1.430 0.012 0.010 1.210 0.027 0.018 1.450
Adeq -0.005 0.002 -3.290 0.007 0.003 2.790 0.003 0.001 3.280 -0.001 0.001 -0.940 -0.006 0.002 -2.490
nnhage1 0.015 0.014 1.050 0.045 0.023 1.970 0.011 0.007 1.560 -0.014 0.010 -1.390 -0.025 0.020 -1.260
nnhage2 0.019 0.014 1.340 0.015 0.022 0.660 0.016 0.007 2.270 -0.015 0.010 -1.480 -0.014 0.019 -0.720
nnhage3 -0.001 0.014 -0.090 -0.004 0.023 -0.180 0.008 0.007 1.050 0.003 0.010 0.250 0.000 0.020 0.020
Region -0.036 0.003 -11.380 0.078 0.004 18.130 -0.009 0.002 -5.140 -0.030 0.002 -12.250 0.001 0.004 0.290
_cons (omitted) (omitted) (omitted) (omitted) (omitted)
Source: Calculated from INSTAT data, 2006.

32
Annex 5. Determinants of demand for cereals and cowpea in Mali (Rural Poor)
Sorghum Rice Cowpea Maize Millet
lnprixsorg~m -0.085 0.185 -0.460 -0.260 0.069 -3.750 0.204 0.081 2.530 0.043 0.067 0.650 0.074 0.157 0.470
lnpriximrice -0.260 0.069 -3.750 -0.409 0.066 -6.170 0.236 0.053 4.450 0.271 0.039 6.870 0.186 0.067 2.770
lnprixniebe 0.204 0.081 2.530 0.236 0.053 4.450 -0.231 0.070 -3.320 0.005 0.035 0.160 -0.180 0.072 -2.490
lnprixmais 0.043 0.067 0.650 0.271 0.039 6.870 0.005 0.035 0.160 -0.830 0.045 -18.330 0.531 0.058 9.210
lnprixmil 0.074 0.157 0.470 0.186 0.067 2.770 -0.180 0.072 -2.490 0.531 0.058 9.210 -0.807 0.150 -5.370
lnprixfonio 0.024 0.043 0.550 -0.024 0.023 -1.060 -0.035 0.024 -1.430 -0.022 0.019 -1.140 0.195 0.041 4.710
lndepcere~es 0.047 0.005 8.900 -0.071 0.006 -11.140 -0.033 0.003 -11.410 0.022 0.005 4.650 0.056 0.006 8.830
indepagric~e 0.006 0.021 0.270 0.012 0.025 0.480 0.028 0.011 2.440 0.021 0.019 1.080 -0.024 0.025 -0.940
indepnonag~c 0.007 0.032 0.230 -0.006 0.040 -0.160 0.021 0.018 1.160 0.022 0.030 0.720 -0.011 0.040 -0.290
sansemploi 0.056 0.025 2.260 0.016 0.030 0.520 0.019 0.014 1.410 0.021 0.023 0.910 -0.074 0.030 -2.430
Hgender -0.075 0.036 -2.060 0.193 0.045 4.330 0.126 0.020 6.210 0.026 0.034 0.780 -0.075 0.045 -1.670
monogamus 0.044 0.048 0.900 0.388 0.058 6.660 0.203 0.028 7.370 -0.169 0.044 -3.860 -0.064 0.059 -1.090
polygamus 0.014 0.050 0.290 0.426 0.060 7.100 0.203 0.028 7.170 -0.151 0.045 -3.340 -0.094 0.060 -1.570
Divorced 0.116 0.064 1.810 0.282 0.079 3.580 0.113 0.036 3.160 -0.173 0.060 -2.910 -0.035 0.079 -0.450
Illiterate 0.007 0.018 0.380 -0.026 0.022 -1.170 0.024 0.010 2.480 0.013 0.017 0.810 0.002 0.022 0.080
Adeq -0.003 0.001 -1.920 0.005 0.002 2.970 0.003 0.001 4.710 -0.004 0.001 -3.070 -0.002 0.002 -1.390
nnhage1 0.029 0.017 1.650 0.020 0.021 0.920 -0.001 0.010 -0.120 0.018 0.016 1.090 -0.032 0.021 -1.520
nnhage2 0.040 0.015 2.680 0.020 0.019 1.070 -0.005 0.008 -0.560 -0.012 0.014 -0.840 -0.033 0.019 -1.790
nnhage3 0.038 0.015 2.510 -0.029 0.019 -1.540 -0.007 0.008 -0.820 0.004 0.014 0.310 0.003 0.019 0.170
Region -0.036 0.005 -7.490 0.083 0.005 16.230 -0.019 0.003 -7.290 -0.053 0.004 -13.320 0.035 0.005 6.460
Source: Calculated from INSTAT data, 2006.

33
Annex 6. Determinants of demand for cereals and cowpea in Niger (Urban non-poor)
Sorghum Rice Cowpea Maize Millet
Coef. Std. Err. Z Coef. Std. Err. Z Coef. Std. Err. Z Coef. Std. Err. Z Coef. Std. Err. Z
lnprixsorg~m 0.011 0.030 0.370 0.023 0.027 0.850 0.068 0.018 3.740 -0.020 0.003 -6.070 -0.082 0.041 -1.990
lnpriximrice 0.023 0.027 0.850 -0.130 0.089 -1.470 0.022 0.033 0.670 0.038 0.010 3.680 0.047 0.077 0.610
lnprixlorice 0.003 0.001 1.710 -0.006 0.005 -1.260 0.002 0.002 1.170 -0.005 0.002 -2.780 0.000 0.004 0.080
lnprixniebe 0.068 0.018 3.740 0.022 0.033 0.670 -0.050 0.025 -1.980 0.002 0.004 0.400 -0.041 0.036 -1.130
lnprixmais -0.020 0.003 -6.070 0.038 0.010 3.680 0.002 0.004 0.400 0.014 0.005 2.850 -0.033 0.009 -3.690
Lnprixmil -0.082 0.041 -1.990 0.047 0.077 0.610 -0.041 0.036 -1.130 -0.033 0.009 -3.690 0.108 0.096 1.130
lndepcere~es 0.019 0.003 6.850 -0.091 0.009 -9.800 -0.023 0.004 -6.410 0.028 0.004 6.910 0.063 0.008 8.200
Sexe -0.001 0.006 -0.170 -0.007 0.019 -0.390 -0.002 0.007 -0.260 -0.010 0.008 -1.190 0.024 0.016 1.550
trancheage1 0.018 0.009 2.060 0.034 0.028 1.200 -0.007 0.011 -0.630 0.009 0.012 0.690 -0.046 0.024 -1.950
trancheage2 0.011 0.007 1.560 0.032 0.022 1.450 -0.014 0.008 -1.720 0.017 0.010 1.680 -0.039 0.019 -2.110
trancheage3 0.006 0.006 0.990 0.025 0.021 1.200 -0.004 0.008 -0.460 0.011 0.009 1.190 -0.031 0.017 -1.780
trancheage4 0.004 0.007 0.680 0.031 0.022 1.450 -0.006 0.008 -0.690 0.007 0.010 0.750 -0.026 0.018 -1.430
Illiterate -0.016 0.004 -3.770 0.062 0.014 4.340 -0.009 0.005 -1.690 -0.002 0.006 -0.310 -0.039 0.012 -3.300
indepagric~e 0.015 0.007 2.050 -0.149 0.024 -6.130 0.020 0.009 2.140 0.026 0.011 2.400 0.081 0.020 4.010
indepnonag~c -0.007 0.004 -1.520 -0.037 0.014 -2.580 -0.001 0.005 -0.200 0.005 0.006 0.850 0.034 0.012 2.850
Adeq 0.001 0.001 1.160 -0.001 0.002 -0.350 -0.002 0.001 -1.760 0.002 0.001 1.610 0.000 0.002 0.180
Diffa -0.002 0.011 -0.230 0.069 0.033 2.080 -0.007 0.014 -0.510 0.019 0.014 1.400 -0.084 0.028 -3.010
Dosso 0.021 0.011 1.950 -0.098 0.032 -3.050 -0.027 0.012 -2.210 0.107 0.013 8.020 0.003 0.027 0.120
Maradi 0.007 0.013 0.560 -0.067 0.040 -1.670 0.012 0.015 0.800 0.042 0.011 3.780 0.009 0.035 0.270
Tahoua 0.005 0.011 0.460 -0.133 0.032 -4.210 -0.032 0.013 -2.420 0.023 0.013 1.770 0.160 0.027 5.950
Tillaberi 0.002 0.013 0.170 -0.161 0.038 -4.230 -0.037 0.015 -2.520 0.150 0.016 9.490 0.017 0.032 0.530
Zinder 0.017 0.014 1.260 -0.050 0.043 -1.160 -0.029 0.016 -1.760 0.038 0.011 3.480 0.027 0.036 0.750
Cuniamey -0.014 0.009 -1.500 0.094 0.030 3.190 -0.038 0.011 -3.430 0.048 0.013 3.720 -0.062 0.025 -2.500
_cons -0.118 0.026 -4.460 1.280 0.084 15.250 0.202 0.031 6.490 -0.158 0.026 -6.080 -0.204 0.074 -2.740

34
Annex 7. Determinants of demand for cereals and cowpea in Niger (Urban poor)
Sorghum Rice Cowpea Maize Millet
Coef. Std. Err. Z Coef. Std. Err. Z Coef. Std. Err. Z Coef. Std. Err. Z Coef. Std. Err. Z
lnprixsorg~m 0.010 0.036 0.270 -0.067 0.050 -1.350 0.118 0.029 4.080 -0.004 0.007 -0.590 -0.057 0.054 -1.040
lnpriximrice -0.067 0.050 -1.350 0.122 0.161 0.760 0.106 0.061 1.730 0.031 0.020 1.550 -0.192 0.140 -1.370
lnprixlorice -0.003 0.003 -1.010 -0.006 0.009 -0.710 0.000 0.004 0.010 0.000 0.004 0.120 -0.009 0.008 -1.130
lnprixniebe 0.118 0.029 4.080 0.106 0.061 1.730 -0.071 0.045 -1.590 0.001 0.009 0.100 -0.154 0.060 -2.580
lnprixmais -0.004 0.007 -0.590 0.031 0.020 1.550 0.001 0.009 0.100 0.029 0.012 2.480 -0.057 0.018 -3.130
Lnprixmil -0.057 0.054 -1.040 -0.192 0.140 -1.370 -0.154 0.060 -2.580 -0.057 0.018 -3.130 0.460 0.156 2.940
lndepcere~es 0.022 0.005 4.530 -0.059 0.015 -3.940 -0.077 0.006 -12.620 0.034 0.008 4.240 0.090 0.013 6.960
Sexe -0.006 0.011 -0.540 -0.049 0.033 -1.510 -0.019 0.013 -1.390 -0.001 0.018 -0.030 0.073 0.028 2.570
trancheage1 0.045 0.018 2.460 -0.021 0.056 -0.380 0.012 0.023 0.510 -0.027 0.031 -0.890 -0.023 0.049 -0.470
trancheage2 0.001 0.013 0.040 0.053 0.039 1.360 0.001 0.016 0.070 -0.006 0.021 -0.260 -0.062 0.034 -1.830
trancheage3 -0.001 0.010 -0.050 0.020 0.032 0.610 0.008 0.013 0.630 0.014 0.018 0.790 -0.051 0.028 -1.830
trancheage4 0.005 0.011 0.420 -0.005 0.034 -0.130 0.022 0.014 1.570 0.021 0.019 1.150 -0.042 0.029 -1.430
Illiterate -0.015 0.009 -1.630 0.074 0.029 2.550 -0.007 0.012 -0.610 0.000 0.016 0.000 -0.049 0.025 -1.980
indepagric~e 0.008 0.012 0.670 -0.117 0.036 -3.280 -0.010 0.015 -0.660 0.055 0.019 2.850 0.040 0.031 1.290
indepnonag~c 0.009 0.010 0.910 -0.060 0.030 -2.010 -0.010 0.012 -0.830 0.020 0.016 1.230 0.036 0.026 1.370
Adeq 0.001 0.001 0.790 -0.004 0.004 -1.030 -0.003 0.002 -2.010 0.010 0.002 4.260 -0.003 0.004 -0.930
Diffa 0.036 0.028 1.290 0.103 0.084 1.230 -0.009 0.036 -0.240 0.051 0.044 1.170 -0.158 0.072 -2.180
Dosso 0.010 0.023 0.430 -0.229 0.071 -3.240 -0.022 0.030 -0.750 0.194 0.037 5.300 0.012 0.061 0.190
Maradi 0.054 0.026 2.070 -0.343 0.081 -4.210 0.029 0.032 0.890 0.090 0.033 2.700 0.172 0.070 2.440
Tahoua 0.035 0.023 1.510 -0.300 0.070 -4.260 0.036 0.030 1.220 0.015 0.036 0.400 0.274 0.060 4.540
Tillaberi 0.031 0.025 1.210 -0.271 0.075 -3.640 0.030 0.031 0.990 0.015 0.039 0.400 0.146 0.064 2.270
Zinder 0.096 0.029 3.350 -0.229 0.090 -2.550 -0.012 0.036 -0.340 0.116 0.034 3.380 0.029 0.076 0.380
Cuniamey -0.005 0.023 -0.210 0.124 0.070 1.770 -0.007 0.028 -0.240 0.080 0.038 2.090 -0.150 0.060 -2.470
_cons -0.073 0.050 -1.470 0.899 0.156 5.780 0.391 0.060 6.460 -0.254 0.060 -4.230 0.007 0.140 0.050
35
Annex 8. Determinants of demand for cereals and cowpea in Niger (Rural non-poor)
Sorghum Rice Cowpea Maize Millet
Coef. Std. Err. Z Coef. Std. Err. Z Coef. Std. Err. Z Coef. Std. Err. Z Coef. Std. Err. Z
lnprixsorg~m -0.070 0.046 -1.510 0.028 0.042 0.670 0.022 0.028 0.780 -0.003 0.005 -0.590 0.023 0.061 0.380
lnpriximrice 0.028 0.042 0.670 -0.376 0.084 -4.490 0.109 0.038 2.840 -0.005 0.008 -0.540 0.244 0.083 2.920
lnprixlorice 0.000 0.003 0.020 -0.023 0.005 -5.100 0.011 0.003 4.190 -0.003 0.002 -1.570 -0.006 0.005 -1.190
lnprixniebe 0.022 0.028 0.780 0.109 0.038 2.840 -0.099 0.034 -2.940 0.000 0.005 0.030 -0.032 0.049 -0.650
lnprixmais -0.003 0.005 -0.590 -0.005 0.008 -0.540 0.000 0.005 0.030 0.001 0.004 0.320 0.006 0.009 0.680
Lnprixmil 0.023 0.061 0.380 0.244 0.083 2.920 -0.032 0.049 -0.650 0.006 0.009 0.680 -0.241 0.125 -1.930
lndepcere~es 0.014 0.006 2.220 -0.046 0.011 -4.060 -0.102 0.006 -17.250 0.002 0.005 0.400 0.117 0.012 10.010
Sexe -0.010 0.018 -0.570 -0.005 0.031 -0.170 0.002 0.016 0.150 0.025 0.015 1.670 0.000 0.032 -0.010
trancheage1 -0.001 0.016 -0.070 -0.022 0.028 -0.790 0.027 0.015 1.830 0.031 0.014 2.280 -0.028 0.029 -0.950
trancheage2 -0.003 0.015 -0.180 0.076 0.026 2.880 -0.006 0.014 -0.460 0.032 0.013 2.510 -0.110 0.027 -4.020
trancheage3 0.011 0.016 0.690 0.041 0.027 1.510 0.004 0.014 0.270 0.012 0.013 0.870 -0.071 0.029 -2.500
trancheage4 -0.011 0.017 -0.650 0.033 0.029 1.110 0.019 0.015 1.200 0.018 0.014 1.280 -0.065 0.031 -2.130
illiterate -0.007 0.014 -0.500 0.096 0.024 4.010 -0.020 0.013 -1.580 -0.019 0.012 -1.610 -0.061 0.025 -2.440
indepagric~e 0.004 0.018 0.220 -0.182 0.031 -5.830 0.001 0.017 0.060 0.001 0.015 0.080 0.157 0.033 4.810
indepnonag~c -0.017 0.021 -0.800 -0.146 0.037 -3.940 0.001 0.020 0.050 0.000 0.018 -0.010 0.173 0.039 4.460
adeq 0.002 0.002 0.700 -0.002 0.004 -0.600 -0.005 0.002 -2.600 0.004 0.002 2.400 0.001 0.004 0.380
dosso -0.048 0.023 -2.030 -0.345 0.039 -8.840 0.070 0.022 3.250 0.135 0.018 7.380 0.236 0.041 5.710
maradi 0.022 0.027 0.820 -0.294 0.046 -6.380 0.057 0.025 2.300 -0.005 0.021 -0.240 0.265 0.049 5.380
tahoua 0.035 0.023 1.520 -0.320 0.040 -7.970 0.064 0.022 2.950 -0.013 0.019 -0.680 0.316 0.042 7.510
tillaberi 0.011 0.025 0.440 -0.289 0.041 -7.070 0.036 0.023 1.540 0.056 0.019 2.970 0.197 0.043 4.530
zinder 0.053 0.023 2.330 -0.281 0.040 -7.000 0.048 0.021 2.270 -0.018 0.017 -1.050 0.244 0.043 5.690
_cons -0.062 0.055 -1.140 1.187 0.100 11.820 0.491 0.050 9.810 -0.045 0.037 -1.220 -0.534 0.101 -5.280
36
Annex 9. Determinants of demand for cereals and cowpea in Niger (Rural poor)
Sorghum Rice Cowpea Maize Millet
Coef. Std. Err. Z Coef. Std. Err. Z Coef. Std. Err. Z Coef. Std. Err. Z Coef. Std. Err. Z
lnprixsorg~m 0.021 0.028 0.760 0.069 0.024 2.920 0.019 0.017 1.100 -0.019 0.005 -3.500 -0.090 0.035 -2.540
lnpriximrice 0.069 0.024 2.920 -0.190 0.050 -3.810 0.067 0.026 2.600 0.006 0.005 1.210 0.049 0.051 0.970
lnprixlorice -0.004 0.003 -1.540 0.000 0.003 -0.050 0.005 0.002 2.250 -0.005 0.002 -2.400 -0.003 0.004 -0.770
lnprixniebe 0.019 0.017 1.100 0.067 0.026 2.600 -0.112 0.025 -4.490 0.002 0.003 0.510 0.025 0.029 0.870
lnprixmais -0.019 0.005 -3.500 0.006 0.005 1.210 0.002 0.003 0.510 0.003 0.005 0.650 0.009 0.008 1.040
lnprixmil -0.090 0.035 -2.540 0.049 0.051 0.970 0.025 0.029 0.870 0.009 0.008 1.040 0.007 0.071 0.100
lndepcere~es 0.007 0.008 0.840 -0.080 0.007 -11.550 -0.063 0.004 -14.140 0.013 0.006 2.070 0.132 0.012 11.260
sexe -0.007 0.021 -0.350 -0.010 0.018 -0.550 -0.004 0.012 -0.370 0.018 0.017 1.080 0.004 0.031 0.140
trancheage1 -0.011 0.020 -0.540 0.001 0.018 0.030 0.000 0.012 0.020 -0.030 0.016 -1.820 0.052 0.030 1.730
trancheage2 -0.004 0.017 -0.250 0.001 0.015 0.070 -0.010 0.009 -1.030 -0.008 0.013 -0.630 0.025 0.025 0.990
trancheage3 0.002 0.015 0.140 -0.011 0.013 -0.830 -0.011 0.009 -1.280 0.011 0.012 0.880 0.023 0.023 1.020
trancheage4 0.008 0.016 0.500 -0.008 0.014 -0.540 -0.008 0.009 -0.870 0.010 0.013 0.750 0.009 0.025 0.360
illiterate 0.041 0.018 2.310 0.033 0.016 2.050 0.016 0.010 1.550 0.015 0.015 1.050 -0.121 0.027 -4.490
indepagric~e 0.034 0.026 1.340 -0.013 0.023 -0.560 0.003 0.015 0.220 0.019 0.021 0.930 -0.037 0.039 -0.960
indepnonag~c 0.064 0.029 2.230 -0.035 0.025 -1.380 -0.011 0.016 -0.650 0.001 0.023 0.050 -0.001 0.043 -0.030
adeq 0.004 0.002 2.120 -0.001 0.002 -0.550 -0.002 0.001 -1.960 0.001 0.002 0.410 -0.003 0.003 -0.990
diffa (omitted) 0.898 0.069 12.980 (omitted) -0.002 0.050 -0.030 -0.193 0.102 -1.890
dosso -0.001 0.045 -0.010 0.668 0.067 9.970 -0.038 0.026 -1.440 0.014 0.049 0.280 0.026 0.100 0.260
maradi 0.011 0.045 0.240 0.681 0.074 9.180 -0.028 0.027 -1.050 -0.106 0.049 -2.160 0.112 0.105 1.070
tahoua 0.112 0.046 2.420 0.687 0.071 9.660 -0.041 0.027 -1.540 -0.110 0.051 -2.160 0.034 0.104 0.330
tillaberi 0.061 0.045 1.360 0.692 0.068 10.220 -0.058 0.027 -2.170 -0.034 0.049 -0.690 -0.006 0.100 -0.060
zinder 0.068 0.045 1.530 0.702 0.074 9.490 -0.035 0.026 -1.350 -0.101 0.048 -2.090 0.035 0.103 0.340
_cons -0.120 0.064 -1.860 (omitted) 0.397 0.041 9.650 (omitted) (omitted)
37
i Income elasticity of demand (IEoD) measures the responsiveness of the demand for a good to a change in the income of the people demanding the good. It is calculated as the ratio of the percentage change in demand to the percentage change in income. If Income Elasticty of Demand (IEoD) > 1 then the good is a Luxury Good and Income Elastic. If If IEoD < 1 and IEOD > 0 then the good is a Normal Good and Income Inelastic and if IEoD < 0 then the good is an Inferior Good and Negative Income Inelastic.
An inferior good is a good that decreases in demand when consumer income rises, unlike normal goods for which the opposite is observed. Normal goods are those for which consumers' demand increases when their income increases.
A necessity good is a type of normal good. Like any other normal good, when income rises, demand increases. But the increase for a necessity good is less than proportional to the rise in income, so the proportion of expenditure on these goods falls as income rises. The income elasticity of a necessity good is thus between zero and one. Necessity goods are goods that we can't live without and won't likely cut back on even when times are tough.
A luxury good is a good for which the demand increases more than proportionally as income rises, and is a contrast to a necessity good, for which demand is not related to income. Luxury goods are often synonymous with superior goods. Luxury goods are said to have high income elasticity of demand as people become wealthier, they will buy more and more of the luxury good. This also means, however, that should there be a decline in income its demand will drop.
Price elasticity of demand (PED or Ed) is a measure to show the responsiveness, or elasticity, of the quantity demanded of a good or service to a change in its price. More precisely, it gives the percentage change in quantity demanded in response to a one percent change in price (holding constant all the other determinants of demand, such as income). Only goods which do not conform to the law of demand such as Veblen and Giffen goods, have a positive PED. In general, the demand for a good is said to be inelastic (or relatively inelastic) when the PED is less than one (in absolute value): that is, changes in price have a relatively small effect on the quantity of the good demanded. The demand for a good is said to be elastic (or relatively elastic) when its PED is greater than one (in absolute value): that is, changes in price have a relatively large effect on the quantity of a good demanded.
A complementary good is one with a negative cross elasticity of demand, in contrast to a substitute good. This means that the demand for a good is decreased when the price of another good is increased. A substitute good, is a one with a positive cross elasticity of demand. This means that the demand for a good is increased when the price of another good is increased and conversely. Cross-price elasticities The cross-price elasticity of demand (CPEoD ) is used to see how sensitive the demand for a good is to a price change of another good. A high positive cross-price elasticity tells us that if the price of one good goes up, the demand for the other good goes up as well. A negative tells us just the opposite. A small value (either negative or positive) tells us that there is little relation between the two goods. In general, if CPEoD > 0 then the two goods are substitutes. If CPEoD =0 then the two goods are independent (no relationship between the two goods and if CPEoD < 0 then the two goods are complements.