hotel report june 2018 - tcaabudhabi.ae performance monthly... · dear friends, the june figures...
TRANSCRIPT

HOTEL REPORTJUNE 2018

Dearfriends,
TheJunefiguresforhotelperformanceallowustodrawalineunderthefirsthalfof2018;thisisareportwithbothpositivesandnegativestotakeintoconsideration.
Ourultimateaimofachievinganewbenchmarkvisitorfigurefortheyeariscurrentlystillontrackandlooksingoodshape.ForthemonthofJune,wecanreporta6%increaseinthenumberofhotelguestsstayinginAbuDhabicomparedwiththesameperiodin2017.Intotal,339,592hotelguestswererecordedintheemirate’s162hotelsandhotelapartments..Thisrepresentsanincreaseofmorethan19,000comparedtoJune2017.
ThelatestfiguresalsoshowthattheJunearrivalsaredrivenbyincreasesinuptakefrombothSaudiArabiaandtheUnitedStates,withbothcountriespostingsignificantpercentagegrowth(approximately57%and27%respectively).
TheinfluxofadditionalSaudiguestscannaturallybeattributed,atleastinpart,totheHolyMonthofRamadan.Itisworthnotingthatlastyear’sRamadanincluded24Junedays,butonly14daysin2018,Despitethisunfavourablecomparison,thenumberofSaudihotelguestwereonly4.6%below2017numbers.Conversely,theJunefiguresfromtheUSforJunewereupbyalmost26%onayear-to-datebasis.
Theemirate’spopularitywithChinesevisitorstookadipinJune,withthecountrypostinganalmost11%declineinvisitationnumbers.ThismeantChinalostitsplaceastheNo.1overseassourcemarketforthismonth– but2018todate,thecountrystillrepresentsAbuDhabi’slargestoverseassourceofguests(almost16%upfortheyear).
Visitornumberswereinhealthyterritoryforotherkeymarkets,withIndiatakingtopspotforJunewithmorethan29,900Indianguestsarriving,whichrepresenteda3.7%increasefromJune2017.Thiscontributedtoanincreaseof19%forthecountrysofarthisyear.
TheUKposteda14.5%increaseforthemonth,a12.9%increasefortheYear-to-date.Regionallyspeaking,hotelguestnumberswerepositiveforthemonthinAbuDhabiCity(5.6%),AlAin(7.6%)andAlDhafra (15.3%).OccupancyRateswerealsoinpositiveterritoryinallthreeregions(6.4%,8.5%and22.2%respectively).
Incontrasttothesepositivemetrics,wemustcontinuetoacknowledgethechallengeswearefacing:inJune,TotalRevenuesandRevenueperAvailableRoom(RevPAR)increasedonlyslightly(around1%)comparedtoJune2017,butAverageRoomRate(ARR)decreasedbyabout6%.Onayear-to-datebasis,HotelRevenuesaredown4.5%,ARRisdown6.9%andRevPARisdown5%.Asever,weconsiderthisajointresponsibilitythatwearelookingtoaddressinconcertwithyourefforts,aswelooktobringallourmetricsintopositiveterritory.
Asweheadintothesecondhalfoftheyear,DCTAbuDhabiwillmaintainthemomentumwehavealreadygeneratedin2018,withourtraditionallystrongline-upofeventsfromJulytoDecemberakeydriverforourcollectiveambitions.
Yourssincerely,Saif SaeedGhobashUndersecretary,DepartmentofCulture&Tourism– AbuDhabi
PAGE 1
HOTEL GUESTS
OVERALL PERFORMANCE
PAGE 2
PERFORMANCE BY REGION PAGE 3
PERFORMANCE BY STAR RATING PAGE 4
UPCOMING EVENTS PAGE 5
DCT NEWS PAGE 6
GLOSSARY PAGE 7
TABLE OF CONTENTS

JUNE 2018
2017 2018
OVERALL PERFORMANCE
OCCUPANCY RATE
AVERAGE LENGTH OF STAY (ALOS-DAYS)
HOTEL TOTAL REVENUE (MILLION UAE)
AVERAGE ROOM RATE (UAE)
REVENUE PER AVAILABLE ROOM (UAE)
HOTEL GUESTS (000)
419 406 465 438 346 340 0 0 0 0 0 0
396352
414 445369
320402 432 420 404 427 475
Jan Feb Mar Apr May Jun Jul Aug Sep Oct Nov Dec
75% 78% 80% 78% 62% 56% 0% 0% 0% 0% 0% 0%
75% 77% 75% 76%65%
52%62% 66% 71%
79% 83% 79%
Jan Feb Mar Apr May Jun Jul Aug Sep Oct Nov Dec
2.7 2.6 2.7 2.7 2.6 2.4 0.0 0.0 0.0 0.0 0.0 0.0
2.7 2.7 2.6 2.5 2.52.3 2.3 2.4 2.5 2.8 2.7 2.5
Jan Feb Mar Apr May Jun Jul Aug Sep Oct Nov Dec
471 471 542 498 368 299 0 0 0 0 0 0
505 535 510 522408
294 327 334395
533676
582
Jan Feb Mar Apr May Jun Jul Aug Sep Oct Nov Dec
362 365 366 360 298 271 0 0 0 0 0 0
378457
362 381309 288 281 275 302
383515 421
Jan Feb Mar Apr May Jun Jul Aug Sep Oct Nov Dec
272 286 293 282 184 151 0 0 0 0 0 0
285352
271 290
201150 173 181
214
302426 331
Jan Feb Mar Apr May Jun Jul Aug Sep Oct Nov Dec
2.6 2.6
2017 2018
2,774 2,650
2017 2018
367 342
2017 2018
257 244
2017 2018
1
70% 71%
2017 2018
2,296 2,413
2017 2018
162 Hotels with 31,545 rooms
From Previous Year
From Previous Year
From Previous Year
From Previous Year
From Previous Year
From Previous Year
YTD (JAN- JUN)
JUNE 2018
+5.1%
+2.0%
+2.6%
-4.5%
-6.9%
-5.0%

185.3
165.2
119.7
75.3
89.7
77.3
65.9
70.2
214.6
196.6
135.2
94.7
82.2
80.8
77.3
66.9
China
India
UK
United States
Philippines
Egypt
Germany
Saudi Arabia
2.1
1.4
2.8
3.8 3.7
1.8
2.6
4.7
2.32.2
1.5
2.8
3.73.1
1.9
2.8
4.6
2.2
TOP NON-UAE NATIONALITIES (000)
% Change
HOTEL GUESTS
From Previous Year
HOTEL GUESTS HOTEL GUESTS
From Previous Year
100,894 107,961
219,421 231,631
2017 2018
705,444 692,398
1,590,748 1,720,832
2017 2018
28.8
24.7
21.0
13.3
8.2
11.9
9.8
8.6
29.9
22.0
16.7
15.3
12.9
12.9
12.4
8.9
India
China
Philippines
UK
Saudi Arabia
Egypt
United States
Jordan
2
ALOS BY NATIONALITY (DAYS)
TRIP MAIN PURPOSE
Vacations Business Mice VFR Shopping Others
% Change
Non UAEUAE
2.0
2.5
1.21.5
3.3
2.22.6
3.6
2.42.0
2.7
1.41.8
3.6
2.2
2.7
3.3
2.6
JUNE 2018
JUNE 2018 YTD (JAN- JUN)
339,592 2,413,230
3.7%
-10.8%
-20.6%
14.5%
56.8%
8.5%
26.6%
4.3%
15.8%
19.0%
12.9%
25.8%
-8.3%
4.6%
17.4%
-4.6%
2018
JUNE 2017 JUNE 2018 YTD 2017 YTD 2018
JUNE 2018 YTD 2018
+6.0% +5.1%
52%
30%
7%5%
4%3%
51%
30%
7%
6%
4%2%

GUESTS
OCCUPANCY RATE
ALOS DAYS
REVENUES (M AED)
ARR (AED)
REVPAR (AED)
PERFORMANCE BY REGION
GUESTS
OCCUPANCY RATE
ALOS DAYS
REVENUES (M AED)
ARR (AED)
REVPAR (AED)
27%
12%
7%
7%
6%
5%
UAE
China
Saudi Arabia
India
UK
Germany
27%
10%
8%
6%
4%
4%
UAE
China
India
UK
United States
Philippines
ABU DHABI132 Hotels with
27,833 rooms
AL AIN19 Hotels with
2,505 rooms
AL DHAFRA11 Hotels with
1,207 rooms
3
ABU DHABI Al AIN Al DHAFRA
Actual % Change vs Previous Year Actual
% Change vsPrevious Year Actual
% Change vs Previous Year
ABU DHABI Al AIN Al DHAFRA
Actual % Change vsPrevious YTD
Actual % Change vsPrevious YTD
Actual % Change vsPrevious YTD
SUPPLY AND TOP NATIONALITIES - YTD
JUNE 2018
JUNE 2018
YTD (JAN- JUN) 2018
48%
8%
5%
4%
3%
3%
UAE
Oman
India
Egypt
Jordan
Philippines
300,614
57%
2.5
269.6
268
154
5.6%
6.4%
4.6%
1.9%
-5.1%
1.0%
30,224
47%
1.9
20.3
276
131
7.6%
8.5%
-5.3%
-0.3%
-7.4%
0.5%
8,754
31%
2.1
8.8
389
121
15.3%
22.2%
4.3%
-0.1%
-25.1%
-8.4%
2,134,014
74%
2.7
2,394.9
337
250
5.3%
3.1%
3.2%
-4.1%
-7.0%
-4.1%
206,991
56%
2.0
143.4
288
161
1.5%
-5.3%
0.5%
-12.6%
-13.9%
-18.4%
72,225
44%
2.1
111.7
646
287
9.4%
-12.5%
-14.4%
-1.1%
11.7%
-2.3%
2018
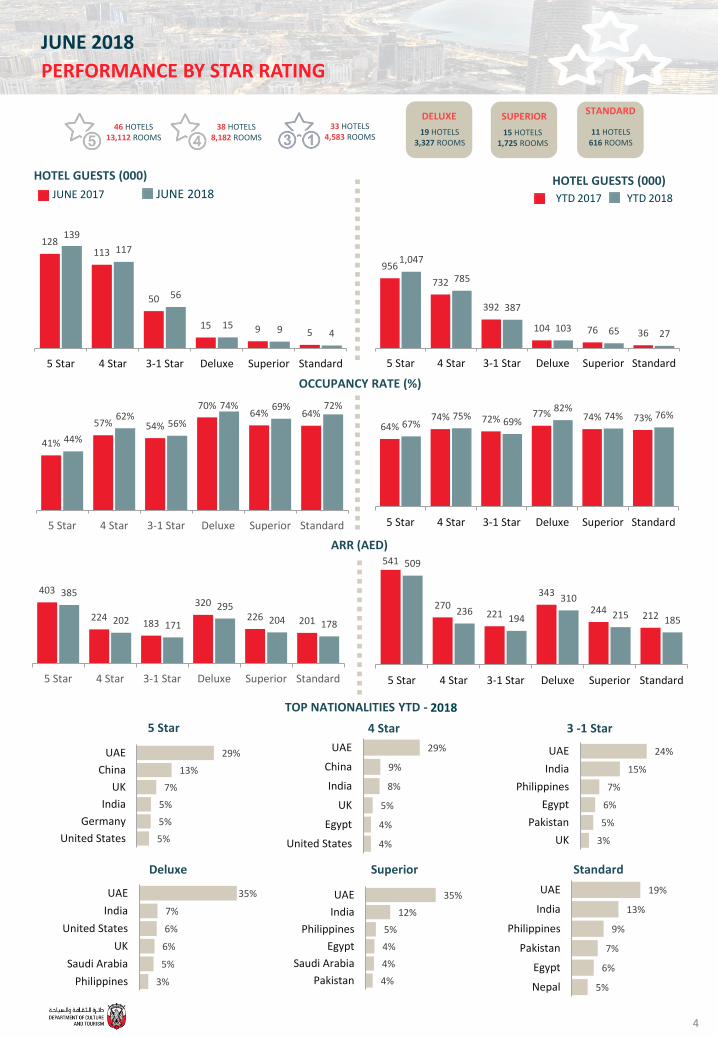
PERFORMANCE BY STAR RATING
HOTEL GUESTS (000)
OCCUPANCY RATE (%)
ARR (AED)
128113
50
15 9 5
139
117
56
15 9 4
5 Star 4 Star 3-1 Star Deluxe Superior Standard
41%
57% 54%
70%64% 64%
44%
62%56%
74% 69% 72%
5 Star 4 Star 3-1 Star Deluxe Superior Standard
403
224183
320
226 201
385
202 171
295
204 178
5 Star 4 Star 3-1 Star Deluxe Superior Standard
956
732
392
104 76 36
1,047
785
387
103 65 27
5 Star 4 Star 3-1 Star Deluxe Superior Standard
64%74% 72%
77% 74% 73%67%
75%69%
82%74% 76%
5 Star 4 Star 3-1 Star Deluxe Superior Standard
541
270221
343
244212
509
236194
310
215 185
5 Star 4 Star 3-1 Star Deluxe Superior Standard
5 Star 4 Star 3 -1 Star
Deluxe Superior Standard
29%
13%
7%
5%
5%
5%
UAE
China
UK
India
Germany
United States
35%
7%
6%
6%
5%
3%
UAE
India
United States
UK
Saudi Arabia
Philippines
29%
9%
8%
5%
4%
4%
UAE
China
India
UK
Egypt
United States
24%
15%
7%
6%
5%
3%
UAE
India
Philippines
Egypt
Pakistan
UK
35%
12%
5%
4%
4%
4%
UAE
India
Philippines
Egypt
Saudi Arabia
Pakistan
19%
13%
9%
7%
6%
5%
UAE
India
Philippines
Pakistan
Egypt
Nepal
HOTEL GUESTS (000)
4
46 HOTELS13,112 ROOMS
38 HOTELS8,182 ROOMS
33 HOTELS4,583 ROOMS
DELUXE
19 HOTELS3,327 ROOMS
SUPERIORSTANDARD
15 HOTELS1,725 ROOMS
11 HOTELS616 ROOMS
JUNE 2018
TOP NATIONALITIES YTD - 2018
JUNE 2017 JUNE 2018 YTD 2017 YTD 2018

UPCOMING EVENTS
5
For detailed list of events please check https://abudhabievents.ae/en/Pages/default.aspx
JUNE 2018
JULY 2018
AUGUST 2018

DCT ABU DHABI NEWS
6
JUNE 2018
Department Concludes Successful Roadshow in Kazakhstan and Ukraine: Promotional activities recently organized by the Department in Kazakhstan and Ukraine aimed to reinforce ties with key stakeholders in these markets and capitalize on newly-relaxed visa rules for Kazakh and Ukrainian travellers. The Kazakhstan roadshow attracted more than 90 local travel trade experts, with the Ukrainian roadshow attracting more than 120 stakeholders.
Department leads trade meeting with Saudi delegation: The Department successfully hosted a three-day delegation of ten key stakeholders and senior travel experts from the Kingdom of Saudi Arabia (KSA) between June 29th and July 1st. Given KSA’s important source-market status, this high-level trade meeting was focused on ways to leverage opportunities and address challenges as Abu Dhabi aims to attract 5.5 million visitors by end of 2018, with Saudi travellers making up a significant percentage of that total.
Abu Dhabi Summer Season: The much-loved and hugely popular Abu Dhabi Summer Season (ADSS) is back. Running from Thursday, 21st June until Saturday, 18th August, UAE residents and visitors will have the chance to win a whole host of exciting prizes and deals as they ‘Unbox the Amazing’ at participating malls.
Eid Al Fitr: The Department of Culture and Tourism – Abu Dhabi (DCT Abu Dhabi) in association with the Department of Economic Development of Abu Dhabi (DED) recently concluded a 24-hour mall mega sale, featuring discounts of up to 90 per cent, as part of 2018’s Eid Fest celebrations. The one-day event saw more than 1,500 stores involved, with more than 455,000 visitors from across the region and beyond coming to Abu Dhabi to celebrate this special occasion.
‘Unbox the Amazing’ was created especially for ADSS 2018, where for every AED250 spent shoppers will get the chance to register digitally for a chance to win instant prizes, including vouchers for luxury dining at Abu Dhabi’s high-end hotel restaurants, and also gain entry into the grand raffle with the chance of winning a car.
The delegation representing AbuDhabi in Almaty and Kiev includedrepresentatives from Etihad Airwaysand Yas Experiences, along withhotels including Yas Viceroy, St. RegisAbu Dhabi, Fairmont Bab Al Bahr,Saadiyat Rotana, Royal Rose,InterContinental Abu Dhabi and AlRaha Beach Hotel.

GLOSSARY
7
JUNE 2018
Disclaimer: All rights are reserved regarding the data contained in the Department of Culture and Tourism – Abu Dhabi (DCT Abu Dhabi) attached report.
The content and data included in the report are subject to alteration with the emergence of more accurate data or the acquisition of the full required data, in accordance with the requirements of the data updating process or audit conducted in accordance with UAE legislation and procedures.
DCT Abu Dhabi shall not be held accountable to the requestor or any other parties regarding alterations made to the data or information contained in this report as a result of the updating process, the conducted audit, the emergence of new data obtained from partners' overseas sources, or in any other case.
Number of rooms available during the month covered by the report excluding out-of-order (a room status term indicating that a room is scheduled for maintenance, refurbishment, deep cleaning, etc.)
Available rooms for sale
Occupied rooms
Occupancy Rate, %
Hotel Guests
Guests Nights
Average Lengthof Stay (ALOS)
Total revenues
Average room(daily) rateARR/ADR
Revenue peravailable room
RevPAR
Number of rooms used on a daily basis including complimentary rooms.
Occupancy is the percentage of available rooms that are occupied, calculated by dividing the number of occupied rooms by the available rooms.
Number of guests staying in the hotel including those who occupied complimentary or non-revenue generating rooms either for day-stay or overnight-stay.
Number of night guests spent in the hotel regardless of the type of rooms they occupy.
Average number of nights guests spent in a single stay, calculated by dividing guest nights by hotel guests.
Revenue generated by hotels from all their operations, including service charge and taxes.
A ratio that indicates average room rate and to what extent rooms are being up-sold or discounted; calculated by dividing room revenue by the number of occupied rooms. (excludes complimentary & house use)
Revenue per Available rooms, calculated by dividing the total revenues by total rooms in hotel minus out-of-service rooms