hotel property investments (hpi) report for the year ended ... › asxpdf › 20150827 › pdf ›...
TRANSCRIPT

Comprising Hotel Property Investments Trust (ARSN 166 484 377) and Hotel Property
Investments Limited (ABN 25 010 330 515) and their controlled entities
Hotel Property Investments (HPI)
Report for the Year Ended 30 June 2015
For
per
sona
l use
onl
y
Hotel Property Investments
Report for the year ended 30 June 2015
Contents Page
Directors' report 3
Auditor's independence declaration 14
Consolidated statement of profit or loss and other comprehensive income 15
Consolidated statement of financial position 16
Consolidated statement of changes in equity 17
Consolidated statement of cash flows 18
Notes to the consolidated financial statements 19
Directors’ declaration 43
Independent auditor’s report to the stapled security holders 44
46
47
Security holder information
Corporate directory
2
For
per
sona
l use
onl
y
Hotel Property Investments
Report for the year ended 30 June 2015
Directors’ report
Corporate Governance
1. Directors and officers
Andrew Cannane Appointed 31 March 2011
Christopher Green Appointed 7 March 2014
Gillian Larkins Appointed 7 March 2014, resigned 31 July 2015
Anna O'Sullivan Appointed 7 March 2014 as an alternate director for each of Andrew Cannane and Christopher Green
Glenn Foster
Joanne Hawkins Appointed 7 March 2014 as an alternate director for Gillian Larkins, resigned 26 June 2015
Michael Vainauskas Appointed 2 March 2015
The directors of The Trust Company (RE Services) Limited (the "Responsible Entity") for the Hotel Property Investments Trust ("the
Trust”), present their consolidated financial report of the Trust and its controlled entity, together with the consolidated financial report of
Hotel Property Investments Limited (“the Company”) and its controlled entity (together "the HPI Group") for the year ended 30 June 2015.
The units in the Trust and the shares in the Company are stapled and cannot be traded or dealt with separately.
The Responsible Entity is incorporated and domiciled in Australia. The registered office of the Responsible Entity is located at Level 12,
123 Pitt Street, Sydney, NSW 2000.
The Responsible Entity and the Company have entered into a Management Agreement pursuant to which the Company has agreed to be
responsible for the oversight and day-to-day management of the HPI Group. The initial term of the Management Agreement is 3 years
ending on 19 November 2016.
The Services Manager has agreed to provide administrative, operational and management services to the Company in exchange for a
fixed monthly fee.
The Services Manager has retained the employment of a dedicated Fund Manager who is responsible for ensuring the Services Manager
provides these services to the HPI Group. If requested by the Company, the Services Manager may also provide transaction and other
designated services for the HPI Group. Any further fees for the provision of additional services by the Services Manager must be agreed
with the HPI Group.
The following persons were directors of the Responsible Entity during the year ended 30 June 2015:
Separately, while the Company and the Responsible Entity each remain responsible for the financial and operating policies and
management of the HPI Group, the Company has delegated and subcontracted substantially all of its administrative, operational and
management obligations under the Management Agreement to the Services Manager (Redcape Services Pty Ltd) pursuant to the
Administrative Services Agreement (ASA).
A copy of HPI Group’s Corporate Governance Statement is available on HPI Group’s website at
www.hpitrust.com.au/cms/corporate_governance
Appointed 7 March 2014 as an alternate director for Gillian Larkins, resigned as alternate director 31 July
2015
Appointed director 31 July 2015
3
For
per
sona
l use
onl
y
1
Experience
Appointed 19 November 2013.
Appointed 19 November 2013.
Appointed 19 November 2013.
Hotel Property Investments
Report for the year ended 30 June 2015
Directors’ report (continued)
Lachlan Edwards
Independent non-executive Director
The members of the Board of Directors of the Company in office during the year and since the end of the year are:
Name and position
Independent non-executive Director Raymond Gunston was appointed an Independent non-executive Director of the Company in
November 2013. Ray has over 30 years of corporate and financial services experience in the
public and private sectors, specialising in finance, treasury, mergers and acquisitions, and
accounting.
Raymond is currently a Non-Executive Director of Sigma Pharmaceuticals Limited, where he
is also a member of the Remuneration and Nomination and Risk Management and Audit
Committees.
He was formerly Chief Financial Officer of Tatts Group Limited and director of many of the
Tatts Group’s subsidiary and associate companies. He is currently the General Manager-
Finance, Corporate and Major Projects at the Australian Football League, and a Board
Member of Greyhound Racing Victoria.
Raymond has a Bachelor of Commerce (with Honours) from the University of Melbourne and
a Diploma of Education. Raymond is a Fellow Certified Practising Accountant, and a
Graduate Member of the Australian Institute of Company Directors, and is Chairman of the
HPI Group's Audit and Risk Management Committee.
Michael Tilley was appointed non-executive Chairman of the Company in November 2013.
He is a highly experienced executive having spent over 30 years advising and managing
leading companies in financial services, life insurance and funds management in
Australasia. He has served as Managing Director and Chief Executive Officer of Challenger
Financial Services, Chairman and Chief Executive Officer of Merrill Lynch Australasia, and
as a partner at Deloitte Touche Tohmatsu.
Michael was a non-executive Director at Orica Ltd from November 2003 until January 2014
where he was the Chairman of Orica's Safety, Health & Environment Committee and a
member of the Audit and Risk and Corporate Governance and Nominations Committees.
Michael is a former member of the Takeovers Panel and has previously served as a non-
executive director of Incitec Ltd.
He holds a Post Graduate Diploma in Business Administration from Swinburne University
and is a Fellow of The Australian Institute of Company Directors.
Raymond Gunston
Michael Tilley
Independent non-executive Chairman
Lachlan Edwards is a Managing Director and Co-Head of the advisory businesses at Lazard
in Australia. Lachlan has extensive experience in capital markets and has been a senior
level advisor to Governments, boards, executive teams and creditors in Australia and
Europe. He has previously held board positions as a Director of NM Rothschild & Sons, a
Governor of the English National Ballet in London, and at the University & Schools Club in
Sydney.
Lachlan was a Managing Director at Goldman Sachs between 2006 - 2013 where he was
Head of Restructuring Europe and more recently Head of Restructuring Asia-Pacific.
Prior to joining Goldman Sachs Lachlan spent 15 years at Rothschild Australia and NM
Rothschild & Sons in London in various risk management, project finance and restructuring
roles latterly as Co-Head of Restructuring Europe and Co-Head of Corporate Debt Advisory,
UK.
Lachlan has a Bachelor of Economics degree from the University of Sydney and a Graduate
Diploma in Applied Finance & Investments from the Securities Institute of Australia. He is a
Graduate Member of the Australian Institute of Company Directors.
Directors and officers (continued)
4
For
per
sona
l use
onl
y
1
Experience
Appointed 23 May 2013.
Resigned 29 May 2015
Appointed 1 July 2011
Appointed 21 November 2014
Company Secretary
John Russell
Non-executive Director John Russell has an extensive background in the hospitality and gaming industries. He is
currently Chief Executive Officer of Redcape Group Ltd and has enjoyed senior executive
roles at Australian Leisure and Hospitality Group Limited (ALH) and Tabcorp Holdings
Limited.
John joined Redcape Group Ltd from Customers Limited where he was Managing Director &
Chief Executive Officer. Previously he was Chief Financial Officer of ALH and has served as
General Manager Strategy & Operations at AWB Limited and Group General Manager
Operations at Tabcorp.
John has a broad range of senior management experience in large and small public and
private companies.
John holds an Honours Degree in Economics and a Master of Business Administration from
the University of Adelaide and is a Graduate Member of the Australian Institute of Company
Directors.
Trevor O'Hoy
Non-executive Director Trevor O’Hoy was appointed Non-Executive Chairman of Redcape Group Ltd in May 2012.
Trevor brings an unparalleled understanding of the Pub industry having spent 32 years at
Foster’s Group Limited in various senior executive finance and operational roles culminating
in that of Chief Executive Officer.
Trevor is currently Executive Chairman of Swisse Wellness Group, Chairman of Tobin
Brothers Foundation, and a director of Stone and Wood Brewing Company and The
Melbourne Stars BBL Team. Trevor Chairs the Ponting Foundation and is a board member
of Cricket Victoria.
Trevor graduated from Monash University, where he was recognised as a Distinguished
Alumni in 2006, and also completed the Advanced Management Program at Harvard
University.
David Charles
Philip Thomas
Philip Thomas specialises in Management and Boardroom Governance, and the provision of
Risk and Compliance services. Clients range from international and Australian Listed
entities, large private companies, and Not for Profits in a variety of sectors and industries.
He is currently a director of four companies and Chairman of a Not for Profit.
Hotel Property Investments
Report for the year ended 30 June 2015
Directors’ report (continued)
Directors and officers (continued)
Company Secretary David Charles is an experienced Chartered Accountant with 25 years experience in the
accounting and audit, financial services, aviation and the hotel property sectors. David
commenced his career with Touche Ross in 1989 and has held senior positions in a number
of large companies including Citibank in London, Ansett Australia, ANZ Bank and the
Spotless Group. Immediately prior to joining Redcape Property Group on 1 July 2009 as
Chief Financial Officer, David spent 5 years with the Coles Group including 4 years within
the Liquor and Hotels division in senior Finance and Business Management roles.
The members of the Board of Directors of the Company in office during the year and since the end of the year are:
Name and position
5
For
per
sona
l use
onl
y

Hotel Property Investments
Report for the year ended 30 June 2015
2. Principal activities
5. Matters subsequent to the end of the financial year
No item, transaction or event has occurred subsequent to 30 June 2015 that is likely in the opinion of the directors of the Responsible Entity
to significantly affect the operations of the HPI Group, the results of those operations, or the state of affairs of the HPI Group in future
financial years.
For the year ended 30 June 2015 the Trust paid an interim distribution of 7.9 cents per stapled security and declared a final distribution of
8.4 cents per stapled security to be paid on 11 September 2015. For the year ended 30 June 2014 the Trust paid a final distribution of 8.8
cents per stapled security.
4. Distributions and dividends
During the year ended 30 June 2015 the HPI Group undertook a series of corporate activities including several freehold hotel acquisitions,
several asset divestments, interest rate hedging, and an equity raising of $30 million. The interest rate margin on the original loan facility
was also reduced by 20 basis points, whilst an additional $10 million was added to the loan facility.
The principal activity of the HPI Group consists of real estate investment in the freehold pub sector in Australia. There has been no
significant change in the nature of the principal activity during the year.
3. Significant changes in state of affairs
In order to rebalance gearing following the acquisitions and to provide additional funds for growth, the HPI Group undertook a $25 million
institutional equity placement and a Security Purchase Plan to raise a further $5 million from mostly retail security holders, raising $30
million in total (before costs) and issuing 13,235,439 new stapled securities.
During the year total assets increased by $68.5 million, total liabilities increased by $27.5 million and net assets increased by $41.0 million.
Net assets per security increased from $1.96 to $2.07.
There were no other significant changes to the state of affairs of the HPI Group.
No provisions for or payments of Company dividends have been made during the year (2014: nil).
Directors’ report (continued)
Four freehold hotels were acquired, three of which are leased to the Coles Group and the fourth leased to the ALH Group, a joint venture
75% controlled by Woolworths Limited. Seven non-strategic assets with lower long term investment returns were divested, six of which were
detached bottle shops and the seventh a freehold hotel in South Australia.
The HPI Group recorded a total profit after tax for the year of $35.4 million. Operating revenues and expenses included rental income from
investment properties of $40.7 million, property cost recoveries of $4.1 million, property outgoing costs of $6.9 million, management fees
and other trust costs of $3.2 million, and financing costs of $10.4 million. Additionally there was a fair value gain on investment property of
$18.0 million, a $3.9 million realised loss on the cancellation of interest rate swaps entered into during the year ended 30 June 2014, and a
$3.0 million fair value loss on swaps entered into during the year ended 30 June 2015. Adjusting profit after tax for fair value adjustments,
losses on hedging and other minor items, the distributable earnings of the HPI Group was $24.7 million. Adjusting further for maintenance
capex of $0.9 million the Adjusted Funds from Operations (AFFO) was $23.8 million, 100% of which will be distributed to security holders.
The total distribution for the year is 16.3 cents per security, comprised of an interim distribution of 7.9 cents and a final distribution of 8.4
cents per security.
6. Review and results of operations
Background
The HPI Group is an Australian Real Estate Investment Trust (“AREIT”) whose principal activity is real estate investment in freehold pubs in
Australia. The HPI Group was restructured and listed on the Australian Securities Exchange (“ASX”) in December 2013. Accordingly the
comparative financial statements for the year ended 30 June 2014 include income and expenditure related to assets no longer within the
HPI Group, and financing costs related to the previous capital structure.
Current year performance
At 30 June 2015 independent valuations were obtained for the two investment properties acquired which settled in the second half of
financial year 2015. The remaining properties have been valued by Directors. In accordance with the HPI Group policy, valuations have
been determined by reference to the current net income for each property with valuation yields maintained constant at their previous
independent valuation level. Independent valuations will be gained for one third of the portfolio at 31 December 2015 in accordance with the
HPI Group’s established valuation cycle. The current average valuation yield is 7.4%.
6
For
per
sona
l use
onl
y
Hotel Property Investments
Report for the year ended 30 June 2015
Directors’ report (continued)
Financial position
At 30 June 2015 the HPI Group's net assets were $302.0 million representing net assets per security of $2.07 (2014: $1.96). Major assets
and liabilities included cash on hand of $4.6 million, investment property of $563.5 million, assets held for sale of $0.7 million, receivables
and other current assets $1.1 million and bank loans of $250.2 million. Additionally, a provision was created for payment of distributions of
$12.3 million. During the year investment property increased by $66.8 million resulting mainly from acquisitions of $58.4 million, divestments
of $9.9 million and fair value gains of $18.0 million, whilst loans have increased by $27.0 million to partly fund the acquisitions. At reporting
date the mark to market valuation of HPI Group’s hedging instruments is negative $3.0 million.
At 30 June 2015 the HPI Group’s loan facility of $270 million (drawn to $251.1 million) have a weighted average 3.5 years to expiry, and
interest rate swaps are in place for an aggregate $125 million until 10 December 2018. The HPI Group will continue to monitor debt capital
markets and interest rates with the goal of prudently managing its interest rate and refinancing risk, including identifying and examining all
potential financing sources and looking to improve the HPI Group's debt composition, debt cost and maturity profile.
The HPI Group expects to improve the quality of its existing property portfolio by diligently managing those properties in co-operation with its
tenants and trading out of lesser quality properties in the portfolio as markets create value opportunities over time.
The HPI Group's key financial goal is to improve cash distributions to stapled security holders whilst maintaining the key attributes of the
HPI Group business. Distribution growth may be achieved organically from annual rent increases averaging 3.9% across the portfolio, and
by prudent management of financing charges, management fees and costs of the Trust. Further distribution growth may arise from
development opportunities undertaken on surplus land or with the Coles Group as it pursues its retail liquor and hotels strategy, or through
further accretive freehold hotel acquisitions. During the year the HPI Group completed the acquisition of 4 freehold hotel properties for a
total investment of $58.4 million, and the divestment of 1 freehold hotel and 6 freehold bottleshops for total proceeds of $9.9 million, which
resulted in an incremental $1.4 million rental income.
6. Review and results of operations (continued)
Risk management
The HPI Group's business of investing directly in freehold property exposes it to certain risks which the HPI Group actively monitors and
seeks to manage. The Company's Board Audit and Risk Committee (BARC) assists the Company and Responsible Entity Boards' in
fulfilling their responsibilities relating to overseeing the HPI Group's risk profile, policy, and the effectiveness of the HPI Group's risk
management framework. During the period the BARC and the Company’s Board reviewed and updated the risk management framework,
including the risk matrix established in 2014. They determined that two risks previously identified, namely interest rate risk and regulatory
risk pertaining to liquor laws in Queensland (where the majority of the HPI Group property portfolio is concentrated) remained the key risks
for the HPI Group, with further risks including ongoing credit availability, tenant credit risk, valuation risk, property liquidity risk, reliance on
external management, and the possible adverse impacts of high inflation. The Company’s Board concluded that the risks to which the HPI
group is exposed remain consistent with those previously identified, and continues to maintain a level of interest rate hedging to mitigate
interest rate risk, and to continually monitor the Queensland regulatory environment.
Business strategies and prospects
The HPI Group will continue to pursue acquisition opportunities which meet its investment criteria, namely that target properties be in good
condition, in key regional or metropolitan locations with potential for long term growth, and leased to experienced tenants on favourable
lease terms. The HPI Group will maintain gearing around its target range of 40 to 50 percent.
7
For
per
sona
l use
onl
y
Hotel Property Investments
Report for the year ended 30 June 2015
Directors’ report (continued)
2015
$’000
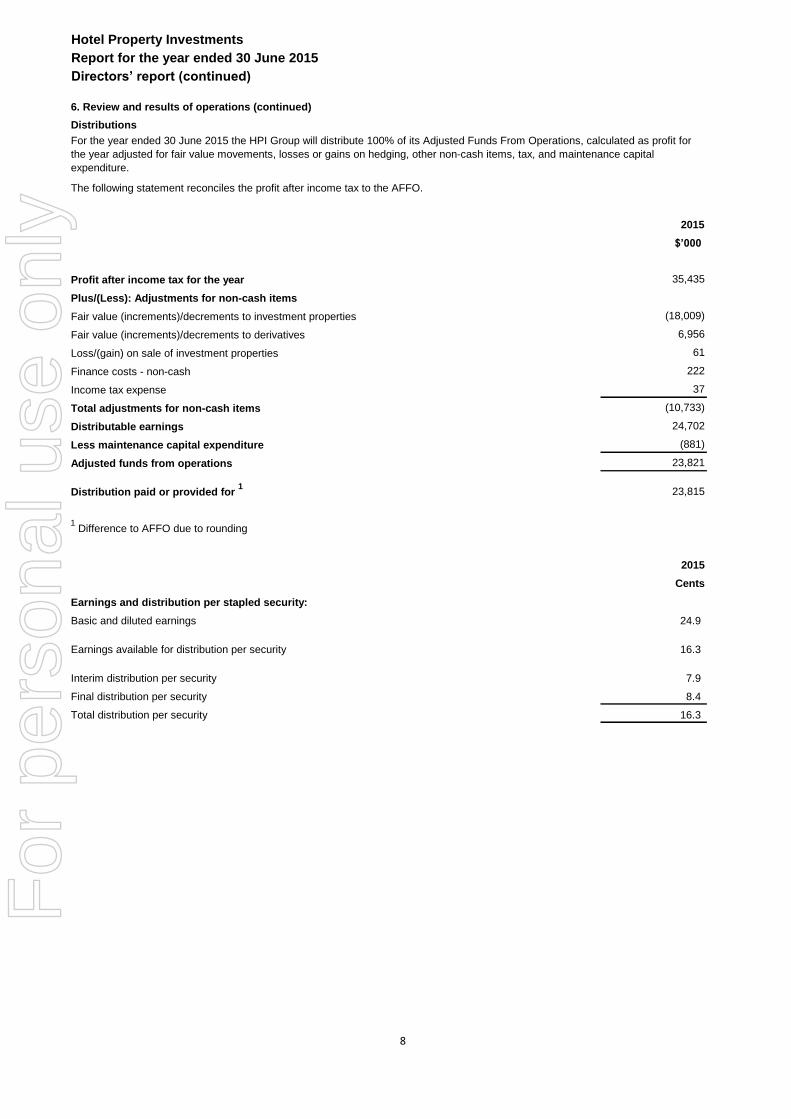
Profit after income tax for the year 35,435
Plus/(Less): Adjustments for non-cash items
Fair value (increments)/decrements to investment properties (18,009)
Fair value (increments)/decrements to derivatives 6,956
Loss/(gain) on sale of investment properties 61
Finance costs - non-cash 222
Income tax expense 37
Total adjustments for non-cash items (10,733)
Distributable earnings 24,702
Less maintenance capital expenditure (881)
Adjusted funds from operations 23,821
Distribution paid or provided for 1
23,815
1 Difference to AFFO due to rounding
2015
Cents
Earnings and distribution per stapled security:
Basic and diluted earnings 24.9
Earnings available for distribution per security 16.3
Interim distribution per security 7.9
Final distribution per security 8.4
Total distribution per security 16.3
6. Review and results of operations (continued)
For the year ended 30 June 2015 the HPI Group will distribute 100% of its Adjusted Funds From Operations, calculated as profit for
the year adjusted for fair value movements, losses or gains on hedging, other non-cash items, tax, and maintenance capital
expenditure.
The following statement reconciles the profit after income tax to the AFFO.
Distributions
8
For
per
sona
l use
onl
y

Hotel Property Investments
Report for the year ended 30 June 2015
Directors’ report (continued)
7. Directors' information
Directorships of listed entities within the last three years
Director Directorships of listed entities Type Appointed Resigned
Michael Tilley Orica Limited Non-executive November 2003 January 2014
Raymond Gunston Sigma Pharmaceuticals Limited Non-executive July 2010
Trevor O'Hoy ASG Group Limited Non-executive September 2010 April 2014
Number Net Number
held at Movement held at
Name Role 1/07/2014 30/06/2015
Michael Tilley Independent non-executive Chairman 1,119,048 (18,334) 1,100,714
Raymond Gunston Independent non-executive Director 119,048 6,666 125,714
Lachlan Edwards Independent non-executive Director 154,762 17,748 172,510
John Russell Non-executive Director 47,618 8,832 56,450
Trevor O'Hoy Non-executive Director 487,142 - 487,142
Name Held Attended Held Attended
Michael Tilley 13 13 4 4
Raymond Gunston 13 13 4 4
Lachlan Edwards 13 12 4 4
John Russell 13 13 4 4
Trevor O'Hoy 13 12 4 4
Lachlan Edwards and John Russell are members of the BARC
Raymond Gunston is Chairman of the BARC
The following are the special responsibilities of each director:
The following Company directors held directorships of other listed entities within the last three years and from the date appointed
up to the date of this report unless otherwise stated:
Special responsibilities of directors
Michael Tilley is Chairman of the Board
Board BARC
Directors' interests in stapled securities
The following directors and their associates held or currently hold the following stapled security interests in the HPI Group:
Meetings of directors
The number of meetings of the Company's Board of Directors held and of each Board committee during the year ended 30 June
2015 and the number of meetings attended by each director at the time the director held office during the year were:
The directors of the Responsible Entity have no interests in the stapled securities of the HPI Group.
9
For
per
sona
l use
onl
y
Hotel Property Investments
Report for the year ended 30 June 2015
Directors’ report (continued)
8. Remuneration Report - Audited
8.1 Principles of remuneration
8.2 Remuneration of the Company's directors
8.3 Remuneration of the Responsible Entity's Directors and Company Secretaries
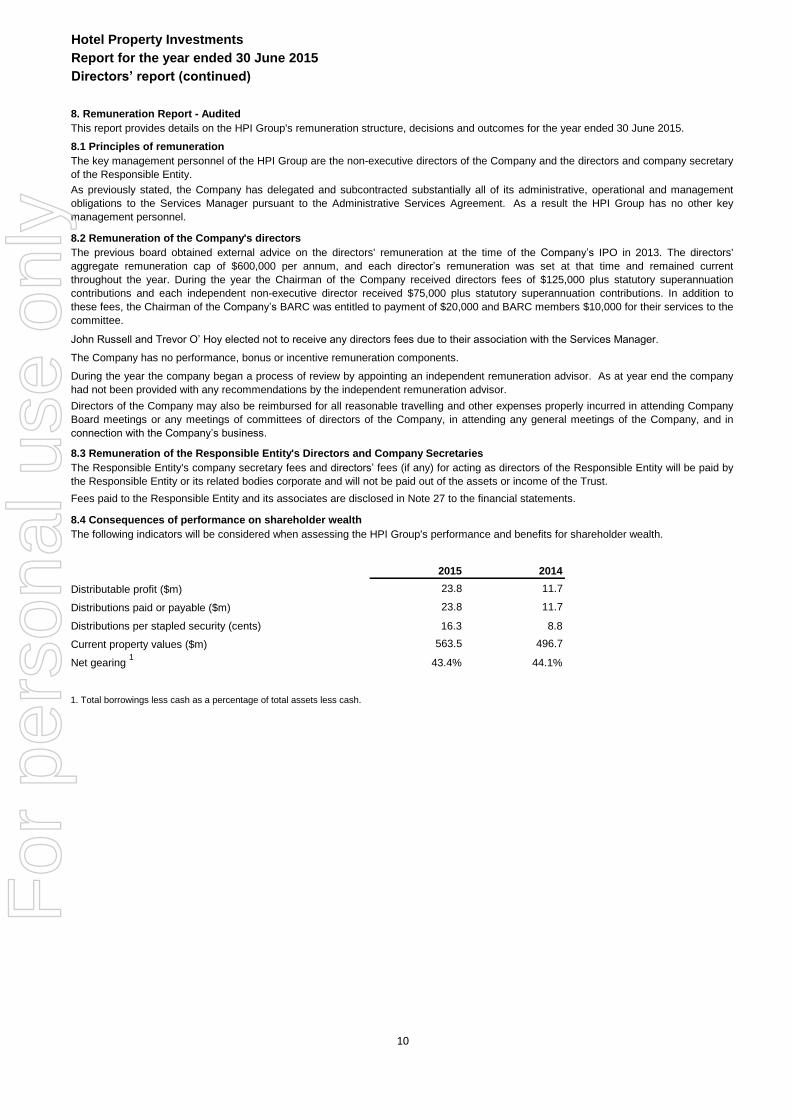
8.4 Consequences of performance on shareholder wealth
2015 2014
23.8 11.7
23.8 11.7
16.3 8.8
563.5 496.7
43.4% 44.1%
1. Total borrowings less cash as a percentage of total assets less cash.
Net gearing 1
The following indicators will be considered when assessing the HPI Group's performance and benefits for shareholder wealth.
Distributable profit ($m)
Distributions paid or payable ($m)
Distributions per stapled security (cents)
Current property values ($m)
Fees paid to the Responsible Entity and its associates are disclosed in Note 27 to the financial statements.
The Responsible Entity's company secretary fees and directors’ fees (if any) for acting as directors of the Responsible Entity will be paid by
the Responsible Entity or its related bodies corporate and will not be paid out of the assets or income of the Trust.
John Russell and Trevor O’ Hoy elected not to receive any directors fees due to their association with the Services Manager.
The previous board obtained external advice on the directors' remuneration at the time of the Company’s IPO in 2013. The directors'
aggregate remuneration cap of $600,000 per annum, and each director’s remuneration was set at that time and remained current
throughout the year. During the year the Chairman of the Company received directors fees of $125,000 plus statutory superannuation
contributions and each independent non-executive director received $75,000 plus statutory superannuation contributions. In addition to
these fees, the Chairman of the Company’s BARC was entitled to payment of $20,000 and BARC members $10,000 for their services to the
committee.
This report provides details on the HPI Group's remuneration structure, decisions and outcomes for the year ended 30 June 2015.
The Company has no performance, bonus or incentive remuneration components.
Directors of the Company may also be reimbursed for all reasonable travelling and other expenses properly incurred in attending Company
Board meetings or any meetings of committees of directors of the Company, in attending any general meetings of the Company, and in
connection with the Company’s business.
During the year the company began a process of review by appointing an independent remuneration advisor. As at year end the company
had not been provided with any recommendations by the independent remuneration advisor.
The key management personnel of the HPI Group are the non-executive directors of the Company and the directors and company secretary
of the Responsible Entity.
As previously stated, the Company has delegated and subcontracted substantially all of its administrative, operational and management
obligations to the Services Manager pursuant to the Administrative Services Agreement. As a result the HPI Group has no other key
management personnel.
10
For
per
sona
l use
onl
y
Hotel Property Investments
Report for the year ended 30 June 2015
Directors’ report (continued)
8. Remuneration Report - Audited (continued)
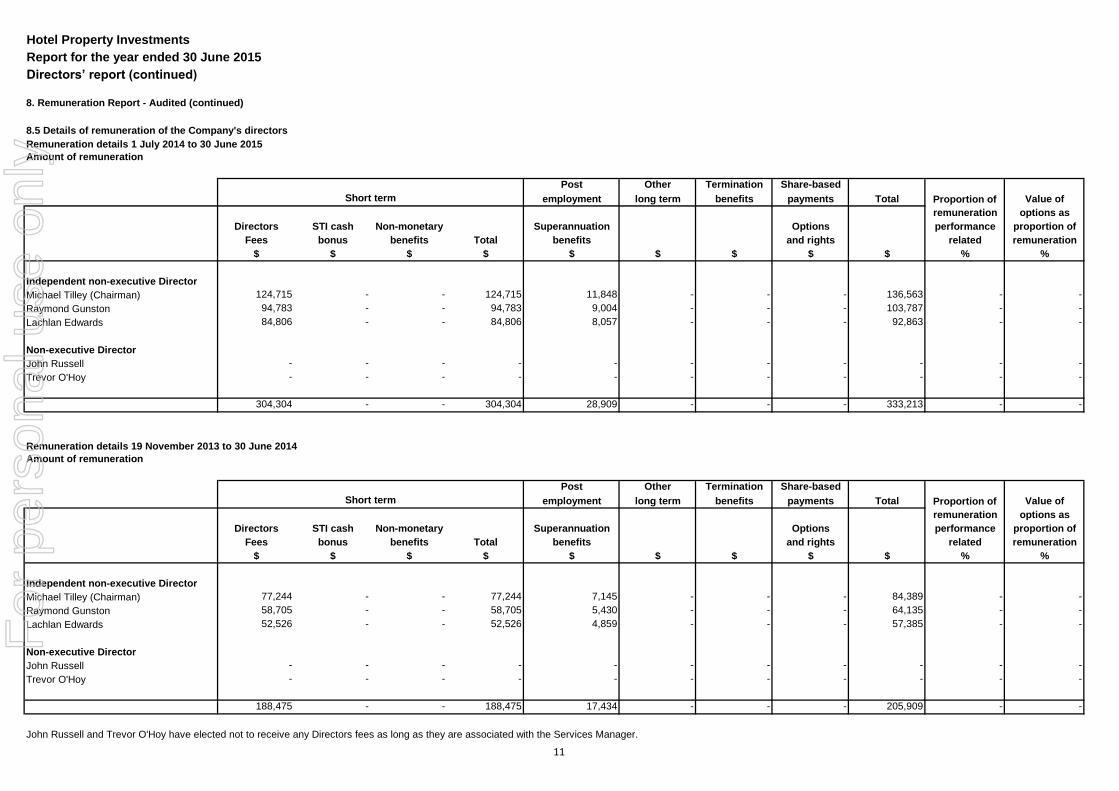
8.5 Details of remuneration of the Company's directors
Remuneration details 1 July 2014 to 30 June 2015
Post Other Termination Share-based
employment long term benefits payments Total Proportion of Value of
remuneration options as
Directors STI cash Non-monetary Superannuation Options performance proportion of
Fees bonus benefits Total benefits and rights related remuneration
$ $ $ $ $ $ $ $ $ % %
Independent non-executive Director
Michael Tilley (Chairman) 124,715 - - 124,715 11,848 - - - 136,563 - -
Raymond Gunston 94,783 - - 94,783 9,004 - - - 103,787 - -
Lachlan Edwards 84,806 - - 84,806 8,057 - - - 92,863 - -
Non-executive Director
John Russell - - - - - - - - - - -
Trevor O'Hoy - - - - - - - - - - -
304,304 - - 304,304 28,909 - - - 333,213 - -
Remuneration details 19 November 2013 to 30 June 2014
Post Other Termination Share-based
employment long term benefits payments Total Proportion of Value of
remuneration options as
Directors STI cash Non-monetary Superannuation Options performance proportion of
Fees bonus benefits Total benefits and rights related remuneration
$ $ $ $ $ $ $ $ $ % %
Independent non-executive Director
Michael Tilley (Chairman) 77,244 - - 77,244 7,145 - - - 84,389 - -
Raymond Gunston 58,705 - - 58,705 5,430 - - - 64,135 - -
Lachlan Edwards 52,526 - - 52,526 4,859 - - - 57,385 - -
Non-executive Director
John Russell - - - - - - - - - - -
Trevor O'Hoy - - - - - - - - - - -
188,475 - - 188,475 17,434 - - - 205,909 - -
Amount of remuneration
Short term
John Russell and Trevor O'Hoy have elected not to receive any Directors fees as long as they are associated with the Services Manager.
Short term
Amount of remuneration
11
For
per
sona
l use
onl
y
Hotel Property Investments
Report for the year ended 30 June 2015
Directors’ report (continued)
9. Indemnification and insurance of officers and auditors
2015
$
Compliance plan review 4,000
4,000
Audit and review of financial statements 153,750
Total payable to KPMG 157,750
14. Rounding of amounts
12. Auditor’s independence declaration
A copy of the auditor's independence declaration as required under section 307C of the Corporations Act 2001 is set out on page 14 and
forms part of the Directors' Report for the year ended 30 June 2015.
The Constitution of the Company provides that, subject to and to the extent permitted by the Corporations Act, the Company must indemnify
or enter into and pay premiums on a contract insuring any current or former Officer of the Company and/or its Related Bodies Corporate
against any liability incurred by that person in that capacity, including legal costs. The Company has agreed to indemnify the following
current directors of the Company, Michael Tilley, Raymond Gunston, Lachlan Edwards, John Russell and Trevor O'Hoy.
No insurance premiums are paid out of the HPI Group in regards to insurance cover for either the Responsible Entity or the auditors of the
HPI Group. So long as the Directors and officers of the Responsible Entity and its Compliance Committee act in accordance with the
Constitution and Corporations Act, the Directors and officers remain indemnified out of the assets of the HPI Group against losses incurred
while acting on behalf of the HPI Group. The auditors of the HPI Group are in no way indemnified out of the assets of the HPI Group.
During the financial year, the HPI Group paid an insurance premium of $86,187 (2014: $86,231) in respect of the current directors of the
Company.
The HPI Group will continue to review the portfolio with a view to increasing distributions, whether by divesting assets and recycling the
proceeds into higher returning assets, or by acquiring new assets at appropriate prices.
10. Non-audit services
During the year KPMG, the HPI Group's auditor, has performed certain other services in addition to the audit and review of the financial
statements.
The HPI Group will continue to receive average 3.9% annual rental increases on the anniversary of the commencement of each lease,
which is expected to contribute to ongoing distribution growth.
11. Likely developments
The Company's Board has considered the remaining non-audit services provided during the year by the auditor and in accordance with
advice provided by resolution of the BARC, is satisfied that the provision of those non-audit services during the year by the auditor is
compatible with, and did not compromise, the auditor independence requirements of the Corporations Act 2001 and has made the same
recommendation to the RE Board.
Details of the amounts paid to the auditor of the HPI Group, KPMG, and its network firms for audit and non-audit services provided during
the year are set out below.
Services other than audit and review of financial statements
13. Environmental regulation
The HPI Group is of a kind referred to in Class Order 98/100, issued by the Australian Securities and Investments Commission, relating to
the “rounding off” of amounts in the directors’ report and financial report. Amounts in the directors’ report and financial report have been
rounded off to the nearest one thousand dollars, in accordance with that Class Order, except where otherwise indicated.
Whilst the HPI Group is not subject to significant environmental regulation in respect of its property activities, the Company directors are
satisfied that adequate systems are in place for the management of its environmental responsibility and compliance with the various licence
requirements and regulations. Further, the Company directors are not aware of any material breaches of these requirements.
12
For
per
sona
l use
onl
y

Hotel Property Investments
Report for the year ended 30 June 2015
Directors’ report (continued)
15. Units on issue
Andrew Cannane
Director
Sydney
Dated this 26th day of August 2015
The movement in units on issue in the Trust during the year is disclosed in Note 18 to the financial statements.
Signed in accordance with a resolution of the directors of the Trust Company (RE Services) Limited.
13
For
per
sona
l use
onl
y

ABCD
Lead Auditor’s Independence Declaration under Section 307C of the Corporations Act 2001
To: the directors of The Trust Company (RE Services) Limited as responsible entity for the Hotel Property Investments Trust
I declare that, to the best of my knowledge and belief, in relation to the audit for the financial year ended 30 June 2015 there have been:
(i) no contraventions of the auditor independence requirements as set out in the Corporations Act 2001 in relation to the audit; and
(ii) no contraventions of any applicable code of professional conduct in relation to the audit.
KPMG
Darren Scammell Partner
Melbourne
26 August 2015
14
KPMG, an Australian partnership and a member firm of the KPMG network of independent member firms affiliated with KPMG International Cooperative (“KPMG International”), a Swiss entity.
Liability limited by a scheme approved under Professional Standards Legislation.
For
per
sona
l use
onl
y
Hotel Property Investments
Report for the year ended 30 June 2015
Consolidated statement of profit or loss and other comprehensive income
2015 2014
$’000 $’000
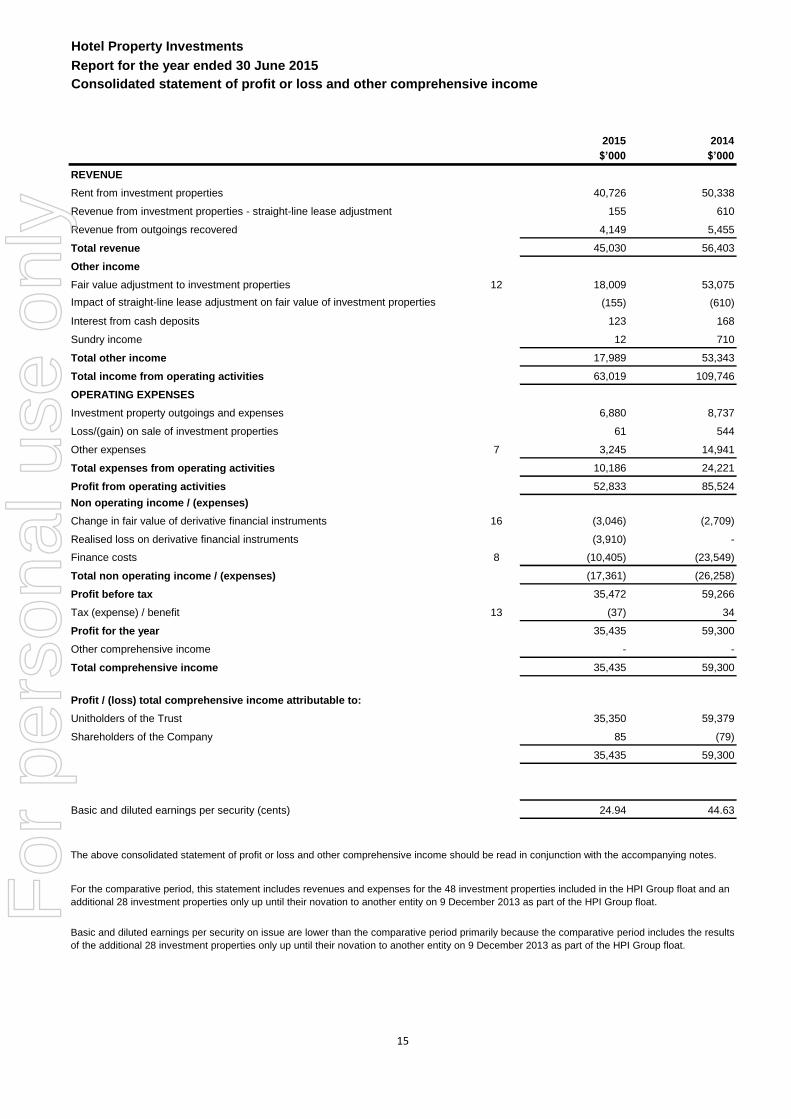
REVENUE
Rent from investment properties 40,726 50,338
Revenue from investment properties - straight-line lease adjustment 155 610
Revenue from outgoings recovered 4,149 5,455
Total revenue 45,030 56,403
Other income
Fair value adjustment to investment properties 12 18,009 53,075
Impact of straight-line lease adjustment on fair value of investment properties (155) (610)
Interest from cash deposits 123 168
Sundry income 12 710
Total other income 17,989 53,343
Total income from operating activities 63,019 109,746
OPERATING EXPENSES
Investment property outgoings and expenses 6,880 8,737
Loss/(gain) on sale of investment properties 61 544
Other expenses 7 3,245 14,941
Total expenses from operating activities 10,186 24,221
Profit from operating activities 52,833 85,524
Non operating income / (expenses)
Change in fair value of derivative financial instruments 16 (3,046) (2,709)
Realised loss on derivative financial instruments (3,910) -
Finance costs 8 (10,405) (23,549)
Total non operating income / (expenses) (17,361) (26,258)
Profit before tax 35,472 59,266
Tax (expense) / benefit 13 (37) 34
Profit for the year 35,435 59,300
Other comprehensive income - -
Total comprehensive income 35,435 59,300
Profit / (loss) total comprehensive income attributable to:
Unitholders of the Trust 35,350 59,379
Shareholders of the Company 85 (79)
35,435 59,300
Basic and diluted earnings per security (cents) 24.94 44.63
For the comparative period, this statement includes revenues and expenses for the 48 investment properties included in the HPI Group float and an
additional 28 investment properties only up until their novation to another entity on 9 December 2013 as part of the HPI Group float.
Basic and diluted earnings per security on issue are lower than the comparative period primarily because the comparative period includes the results
of the additional 28 investment properties only up until their novation to another entity on 9 December 2013 as part of the HPI Group float.
The above consolidated statement of profit or loss and other comprehensive income should be read in conjunction with the accompanying notes.
15
For
per
sona
l use
onl
y
Hotel Property Investments
Report for the year ended 30 June 2015
Consolidated statement of financial position
2015 2014
$’000 $’000
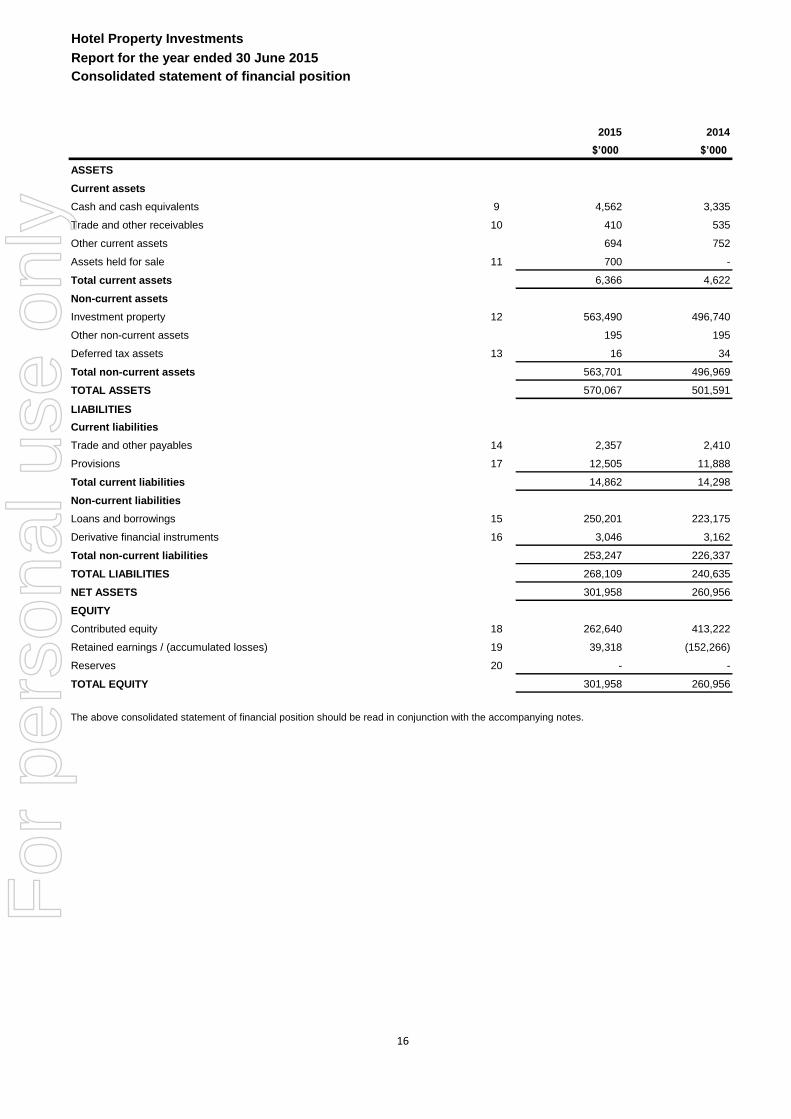
ASSETS
Current assets
Cash and cash equivalents 9 4,562 3,335
Trade and other receivables 10 410 535
Other current assets 694 752
Assets held for sale 11 700 -
Total current assets 6,366 4,622
Non-current assets
Investment property 12 563,490 496,740
Other non-current assets 195 195
Deferred tax assets 13 16 34
Total non-current assets 563,701 496,969
TOTAL ASSETS 570,067 501,591
LIABILITIES
Current liabilities
Trade and other payables 14 2,357 2,410
Provisions 17 12,505 11,888
Total current liabilities 14,862 14,298
Non-current liabilities
Loans and borrowings 15 250,201 223,175
Derivative financial instruments 16 3,046 3,162
Total non-current liabilities 253,247 226,337
TOTAL LIABILITIES 268,109 240,635
NET ASSETS 301,958 260,956
EQUITY
Contributed equity 18 262,640 413,222
Retained earnings / (accumulated losses) 19 39,318 (152,266)
Reserves 20 - -
TOTAL EQUITY 301,958 260,956
The above consolidated statement of financial position should be read in conjunction with the accompanying notes.
16
For
per
sona
l use
onl
y
Hotel Property Investments
Report for the year ended 30 June 2015
Consolidated statement of changes in equity
Contributed
Equity
Accumulated
Losses Reserves Total Equity
Note $’000 $’000 $’000 $’000
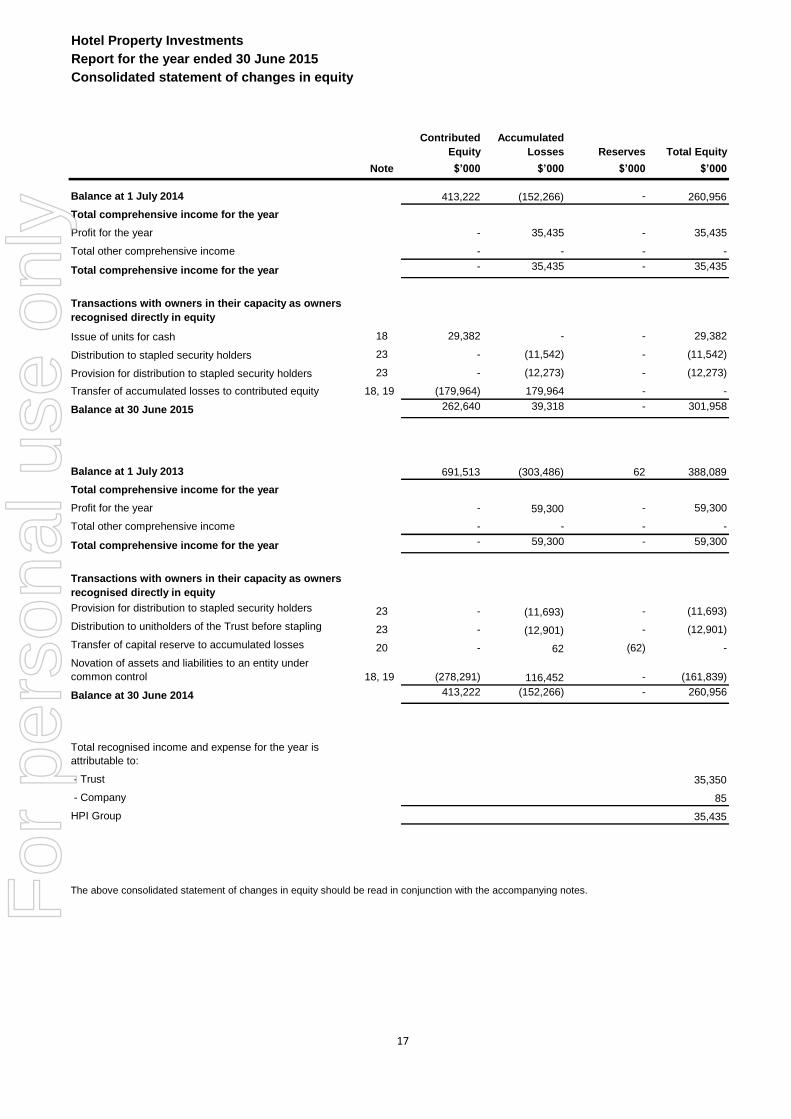
Balance at 1 July 2014 413,222 (152,266) - 260,956
Total comprehensive income for the year
Profit for the year - 35,435 - 35,435
Total other comprehensive income - - - -
Total comprehensive income for the year - 35,435 - 35,435
Issue of units for cash 18 29,382 - - 29,382
Distribution to stapled security holders 23 - (11,542) - (11,542)
Provision for distribution to stapled security holders 23 - (12,273) - (12,273)
Transfer of accumulated losses to contributed equity 18, 19 (179,964) 179,964 - -
Balance at 30 June 2015 262,640 39,318 - 301,958
Balance at 1 July 2013 691,513 (303,486) 62 388,089
Total comprehensive income for the year
Profit for the year - 59,300 - 59,300
Total other comprehensive income - - - -
Total comprehensive income for the year - 59,300 - 59,300
Provision for distribution to stapled security holders 23 - (11,693) - (11,693)
23 - (12,901) - (12,901)
20 - 62 (62) -
Novation of assets and liabilities to an entity under
common control 18, 19 (278,291) 116,452 - (161,839)
Balance at 30 June 2014 413,222 (152,266) - 260,956
Total recognised income and expense for the year is
attributable to:
- Trust 35,350
- Company 85
HPI Group 35,435
The above consolidated statement of changes in equity should be read in conjunction with the accompanying notes.
Transactions with owners in their capacity as owners
recognised directly in equity
Transfer of capital reserve to accumulated losses
Transactions with owners in their capacity as owners
recognised directly in equity
Distribution to unitholders of the Trust before stapling
17
For
per
sona
l use
onl
y
Hotel Property Investments
Report for the year ended 30 June 2015
Consolidated statement of cash flows
2015 2014
Note $’000 $’000
Cash flows from operating activities
Rent and outgoings from investment properties (GST inclusive) 49,481 58,961
Payments to suppliers (14,829) (21,135)
Interest receipts - bank deposits 123 168
Interest paid (10,182) (15,388)
Net cash from operating activities 29 24,593 22,606
Cash flows from investing activities
Proceeds from disposal of investment properties 9,880 3,590
Payment for investment properties (58,440) (6,660)
Payment for additions to investment property (881) (2,699)
Net cash from investing activities (49,441) (5,769)
Cash flows from financing activities
Proceeds from borrowings 84,000 5,000
Repayments of borrowings (57,000) (16,192)
Proceeds as a result of refinancing - 14,686
Proceeds from the issue of securities (net of costs) 29,382 -
Payment for swap termination 16 (7,072) -
Payment of distributions (23,235) (12,901)
Payments on behalf of related parties - (8,943)
Receipts from related parties - 3,000
Payments as a result of restructuring and public float - (8,923)
Payment of cash on novation - (4,974)
Net cash from financing activities 26,075 (29,247)
Net increase/(decrease) in cash held 1,227 (12,410)
Cash and cash equivalents at the beginning of the period 3,335 15,745
Cash and cash equivalents at the end of the period 9 4,562 3,335
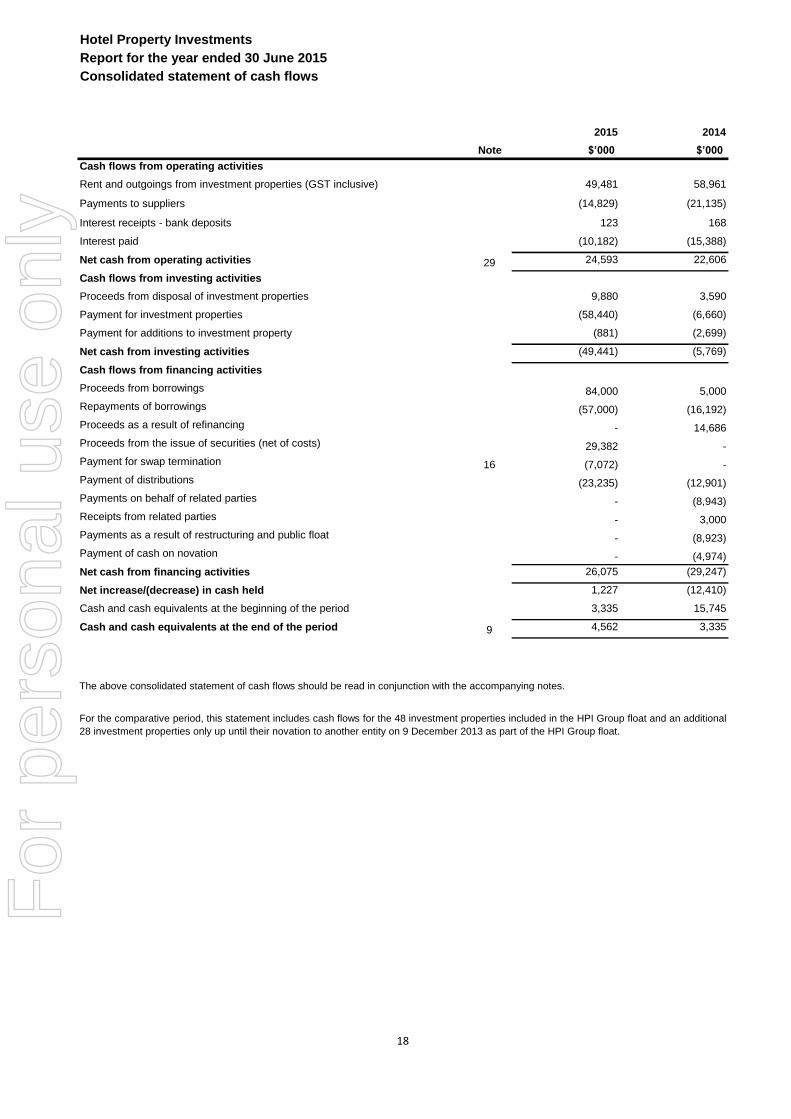
The above consolidated statement of cash flows should be read in conjunction with the accompanying notes.
For the comparative period, this statement includes cash flows for the 48 investment properties included in the HPI Group float and an additional
28 investment properties only up until their novation to another entity on 9 December 2013 as part of the HPI Group float.
18
For
per
sona
l use
onl
y
Hotel Property Investments
Report for the year ended 30 June 2015
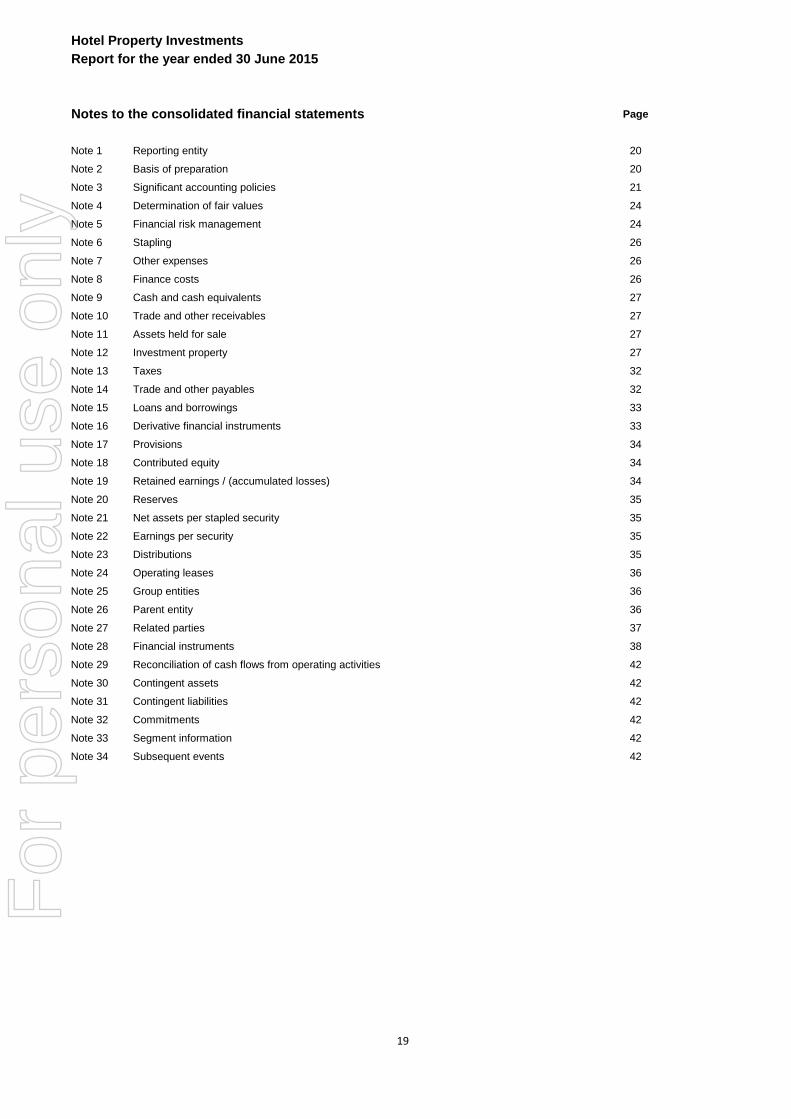
Notes to the consolidated financial statements Page
Note 1 Reporting entity 20
Note 2 Basis of preparation 20
Note 3 Significant accounting policies 21
Note 4 Determination of fair values 24
Note 5 Financial risk management 24
Note 6 Stapling 26
Note 7 Other expenses 26
Note 8 Finance costs 26
Note 9 Cash and cash equivalents 27
Note 10 Trade and other receivables 27
Note 11 Assets held for sale 27
Note 12 Investment property 27
Note 13 Taxes 32
Note 14 Trade and other payables 32
Note 15 Loans and borrowings 33
Note 16 Derivative financial instruments 33
Note 17 Provisions 34
Note 18 Contributed equity 34
Note 19 Retained earnings / (accumulated losses) 34
Note 20 Reserves 35
Note 21 Net assets per stapled security 35
Note 22 Earnings per security 35
Note 23 Distributions 35
Note 24 Operating leases 36
Note 25 Group entities 36
Note 26 Parent entity 36
Note 27 Related parties 37
Note 28 Financial instruments 38
Note 29 Reconciliation of cash flows from operating activities 42
Note 30 Contingent assets 42
Note 31 Contingent liabilities 42
Note 32 Commitments 42
Note 33 Segment information 42
Note 34 Subsequent events 42
19
For
per
sona
l use
onl
y
Hotel Property Investments
Report for the year ended 30 June 2015
Notes to the consolidated financial statements
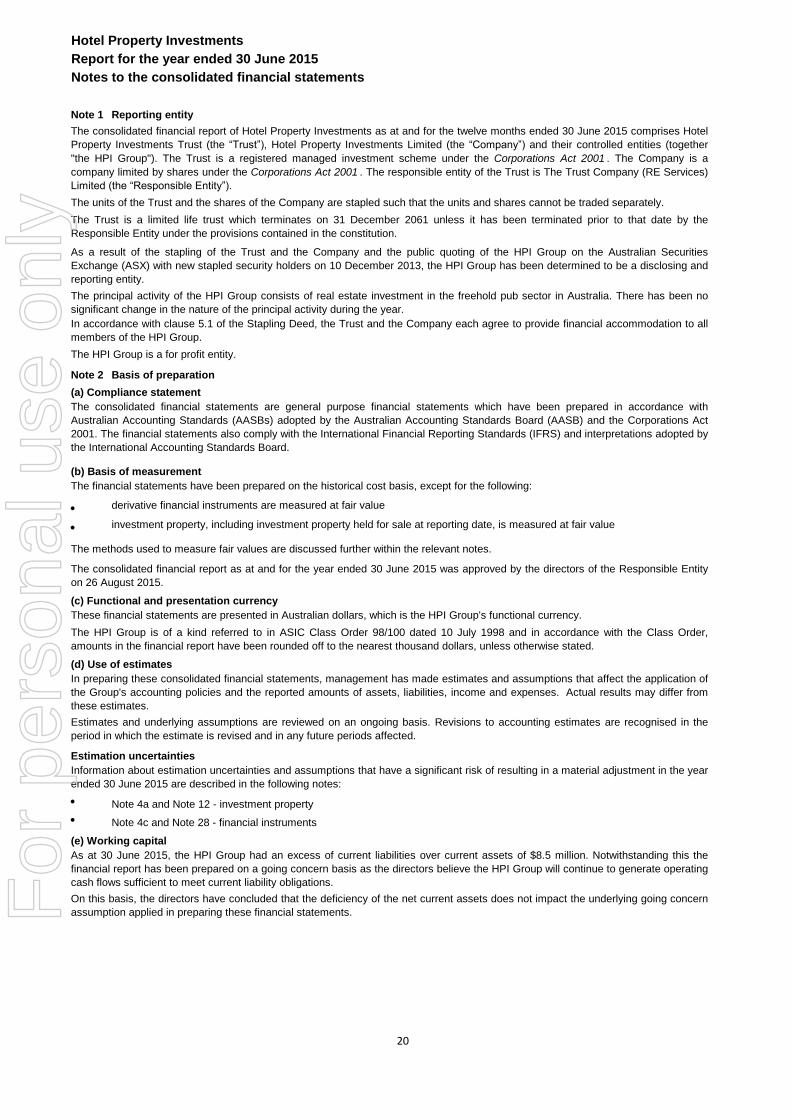
Note 1 Reporting entity
Note 2 Basis of preparation
(a) Compliance statement
(b) Basis of measurement
(c) Functional and presentation currency
(d) Use of estimates
(e) Working capital
As a result of the stapling of the Trust and the Company and the public quoting of the HPI Group on the Australian Securities
Exchange (ASX) with new stapled security holders on 10 December 2013, the HPI Group has been determined to be a disclosing and
reporting entity.
The financial statements have been prepared on the historical cost basis, except for the following:
derivative financial instruments are measured at fair value
investment property, including investment property held for sale at reporting date, is measured at fair value
The methods used to measure fair values are discussed further within the relevant notes.
In preparing these consolidated financial statements, management has made estimates and assumptions that affect the application of
the Group's accounting policies and the reported amounts of assets, liabilities, income and expenses. Actual results may differ from
these estimates.
These financial statements are presented in Australian dollars, which is the HPI Group's functional currency.
Estimates and underlying assumptions are reviewed on an ongoing basis. Revisions to accounting estimates are recognised in the
period in which the estimate is revised and in any future periods affected.
Information about estimation uncertainties and assumptions that have a significant risk of resulting in a material adjustment in the year
ended 30 June 2015 are described in the following notes:
Note 4a and Note 12 - investment property
Note 4c and Note 28 - financial instruments
The consolidated financial statements are general purpose financial statements which have been prepared in accordance with
Australian Accounting Standards (AASBs) adopted by the Australian Accounting Standards Board (AASB) and the Corporations Act
2001. The financial statements also comply with the International Financial Reporting Standards (IFRS) and interpretations adopted by
the International Accounting Standards Board.
The consolidated financial report as at and for the year ended 30 June 2015 was approved by the directors of the Responsible Entity
on 26 August 2015.
The HPI Group is of a kind referred to in ASIC Class Order 98/100 dated 10 July 1998 and in accordance with the Class Order,
amounts in the financial report have been rounded off to the nearest thousand dollars, unless otherwise stated.
Estimation uncertainties
The HPI Group is a for profit entity.
The principal activity of the HPI Group consists of real estate investment in the freehold pub sector in Australia. There has been no
significant change in the nature of the principal activity during the year.
As at 30 June 2015, the HPI Group had an excess of current liabilities over current assets of $8.5 million. Notwithstanding this the
financial report has been prepared on a going concern basis as the directors believe the HPI Group will continue to generate operating
cash flows sufficient to meet current liability obligations.
On this basis, the directors have concluded that the deficiency of the net current assets does not impact the underlying going concern
assumption applied in preparing these financial statements.
In accordance with clause 5.1 of the Stapling Deed, the Trust and the Company each agree to provide financial accommodation to all
members of the HPI Group.
The consolidated financial report of Hotel Property Investments as at and for the twelve months ended 30 June 2015 comprises Hotel
Property Investments Trust (the “Trust”), Hotel Property Investments Limited (the “Company”) and their controlled entities (together
"the HPI Group"). The Trust is a registered managed investment scheme under the Corporations Act 2001 . The Company is a
company limited by shares under the Corporations Act 2001 . The responsible entity of the Trust is The Trust Company (RE Services)
Limited (the “Responsible Entity”).
The units of the Trust and the shares of the Company are stapled such that the units and shares cannot be traded separately.
The Trust is a limited life trust which terminates on 31 December 2061 unless it has been terminated prior to that date by the
Responsible Entity under the provisions contained in the constitution.
20
For
per
sona
l use
onl
y

Hotel Property Investments
Report for the year ended 30 June 2015
Notes to the consolidated financial statements (continued)
Note 3
(a) Basis of consolidation
(iii) Business combinations
Significant accounting policies
(b) Revenue recognition
Revenue is recognised to the extent that it is probable that the economic benefits will flow to the entity and the revenue can be reliably
measured. Revenue recognised but not received at balance date is recognised as a receivable. The following specific recognition
criteria must also be met before revenue is recognised:
Rental income
Business combinations are accounted for by applying the acquisition method as at the acquisition date, which is the date on which
control is transferred to the HPI Group. The HPI Group controls an entity when it is exposed to, or has rights to, variable returns through
its power over the entity. The consideration transferred in the acquisition is generally measured at fair value, as are the identifiable net
assets acquired. Any goodwill that arises is tested annually for impairment. Any gain on a bargain purchase price is recognised in profit
or loss immediately. Transaction costs are expensed as incurred, except if related to the issue of debt or equity securities.
Changes in the HPI Group's interest in a subsidiary that do not result in a loss of control are accounted for as equity transactions.
The accounting standards require that an acquirer is identified in a business combination. In a stapling transaction, judgement is
applied to determine the acquirer as outlined in Note 6. Non-controlling interests are measured at their proportionate share of the
acquiree's identifiable net assets at the acquisition date.
(i) Subsidiaries
Subsidiaries are entities controlled by the Trust or the Company. The financial statements of subsidiaries are included in the
consolidated financial statements from the date that control commences until the date that control ceases.
(ii) Transactions eliminated on consolidation
Intra-group balances and transactions, and any unrealised income and expenses arising from intra-group transactions, are eliminated in
preparing the consolidated financial statements.
Revenues, expenses and assets are recognised net of the amount of goods and services tax (GST), except where the amount of GST
incurred is not recoverable from the Australian Taxation Office (ATO). In these circumstances the GST is recognised as part of the cost
of acquisition of the asset or as part of an item of expense. Receivables and payables are stated with the amount of GST included. The
net amount of GST recoverable from, or payable to, the ATO is included as a current asset or liability in the statement of financial
position. Cash flows are included in the statement of cash flows on a gross basis. The GST components of cash flows arising from
investing and financing activities which are recoverable from, or payable to, the ATO are classified as operating cash flows.
Rental income from operating leases is recognised on a straight line basis for those leases with fixed annual rent increases. An asset is
recognised to represent the portion of operating lease revenue in a reporting period relating to fixed increases in operating lease rentals
in future periods. This receivable is considered to be a component part of the relevant property investment carrying value.
(d) Tax
Under current Australian income tax legislation, the Trust is not liable to income tax, provided:
Finance income comprises interest income on funds invested, changes in the fair value of financial assets at fair value through profit or
loss, and gains on hedging instruments that are recognised in profit or loss.
The Company and its wholly owned subsidiary are liable to corporate income tax, have formed a tax consolidated group and will be
subject to tax at the current corporate income tax rate of 30%.
(e) Goods and services tax
(c) Finance income and finance costs
Finance costs comprise interest expense on borrowings, unwinding of the discount on provisions, changes in the fair value of financial
assets at fair value through profit or loss, impairment losses recognised on financial assets, and losses on hedging instruments that are
recognised in profit or loss.
Borrowing costs that are not directly attributable to the acquisition, construction or production of a qualifying asset are recognised in
profit or loss using the effective interest method.
unit holders are presently entitled to all the Trust’s income at each year end; and
the Trust only invests in land primarily for the purpose of deriving rental income or units that invest in land primarily for the
purpose of deriving rental income.
Interest revenue
Interest revenue is recognised on an effective interest rate method as it accrues.
Outgoings and other revenue
Outgoings recoverable from tenants and other revenue are recognised when the right to receive the revenue has been established.
21
For
per
sona
l use
onl
y
Hotel Property Investments
Report for the year ended 30 June 2015
Notes to the consolidated financial statements (continued)
Note 3
Loans and receivables
Cash and cash equivalents
(ii) Non-derivative financial liabilities
The HPI Group has the following non-derivative financial liabilities: loans and borrowings and trade and other payables.
Such financial liabilities are recognised initially at fair value plus any directly attributable transaction costs. Subsequent to initial
recognition these financial liabilities are measured at amortised cost using the effective interest rate method.
The HPI Group has the following non-derivative financial assets:
Loans and receivables are financial assets with fixed or determinable payments that are not quoted in an active market. Such assets
are recognised initially at fair value plus any directly attributable transaction costs. Subsequent to initial recognition, loans and
receivables are measured at amortised cost using the effective interest method, less any impairment losses.
Loans and receivables comprise cash and cash equivalents, and trade and other receivables.
Cash and cash equivalents comprise cash balances and call deposits with original maturities of three months or less from the
acquisition date that are subject to an insignificant risk of changes in their fair value, and are used by the HPI Group in the management
of its short term commitments.
Financial liabilities (including liabilities designated at fair value through profit or loss) are recognised initially on the trade date at which
the HPI Group becomes a party to the contractual provisions of the instrument. The HPI Group derecognises a financial liability when
its contractual obligations are discharged or cancelled or expire. Financial assets and liabilities are offset and the net amount presented
in the statement of financial position when, and only when the HPI Group has a legal right to offset the amounts and intends either to
settle on a net basis or to realise the asset and settle the liability simultaneously.
(h) Financial instruments
(i) Non-derivative financial assets
The HPI Group initially recognises loans and receivables and deposits on the date that they are originated. All other financial assets
(including assets designated at fair value through profit or loss) are recognised initially on the trade date at which the HPI Group
becomes a party to the contractual provisions of the instrument.
The HPI Group derecognises a financial asset when the contractual rights to the cash flows from the asset expire, or it transfers the
rights to receive the contractual cash flows on the financial asset in a transaction in which substantially all the risks and rewards of
ownership of the financial asset are transferred. Any interest in transferred financial assets that is created or retained is recognised as a
separate asset or liability.
Financial assets and liabilities are offset and the net amount presented in the statement of financial position when, and only when, the
HPI Group has a legal right to offset the amounts and intends either to settle on a net basis or to realise the asset and settle the liability
simultaneously.
Significant accounting policies (continued)
The HPI Group policy is to independently value at least one third of all properties each financial year. A greater number of valuations
may be sought if the board determines that circumstances have arisen that warrant it. The remainder of properties will be valued by the
directors. Where external valuation yields have deteriorated, the directors will apply the average yield expansion to the yields of the
remaining investment properties in determining the directors’ valuations. Where external valuation yields have improved, the directors
will maintain the existing external yield and use the present net rent in determining the directors’ valuations. The directors will also take
into consideration any property nuances, specific market factors, property location, and change in weighted average lease expiry before
deciding on the final directors’ valuation.
(g) Assets held for sale
Properties that are expected to be recovered primarily through sale rather than through continuing use are classified as held for sale.
These assets are reclassified from investment property to assets held for sale at the fair value as at the previous reporting period. Any
subsequent gains or losses on remeasurement are recognised in profit or loss.
(f) Investment property
Investment property is property held to earn rental income or for capital appreciation or for both, but not for sale in the ordinary course of
business, use in the production or supply of goods or services or for administrative purposes.
Investment property is accounted for using the fair value model. Under the fair value model, investment properties are measured initially
at cost. Transaction costs are included in the initial measurement. Subsequent to initial recognition, investment properties are stated at
fair value, which is the amount for which an asset could be exchanged between knowledgeable, willing parties in an arm’s length
transaction and reflects market conditions at the reporting date. Gains and losses arising from changes in the fair values of investment
properties are recognised in profit or loss in the period in which they arise.
22
For
per
sona
l use
onl
y
Hotel Property Investments
Report for the year ended 30 June 2015
Notes to the consolidated financial statements (continued)
Note 3
(iii) Derivative financial instruments
(iv) Issued units and issued shares
(j) New standards and interpretations not yet adopted
A number of new standards, amendments to standards and interpretations are effective for annual periods beginning 1 January 2015,
and have not been applied in preparing these financial statements. None of these are expected to have a significant effect on the
financial statements of the HPI Group, except for AASB 9 Financial Instruments, which becomes mandatory for the HPI Group's 2019
financial statements and could change the classification and measurement of financial assets. The HPI Group does not plan to adopt any
of these standards early and the extent of the impact has not been determined.
A financial asset not classified as at fair value through profit or loss is assessed at each reporting date to determine whether there is
objective evidence that it is impaired. A financial asset is impaired if objective evidence indicates that a loss event has occurred after the
initial recognition of the asset, and that the loss event had a negative effect on the estimated future cash flows of that asset that can be
estimated reliably.
An impairment loss in respect of a financial asset measured at amortised cost is calculated as the difference between its carrying amount
and the present value of the estimated future cash flows discounted at the asset's original effective interest rate. Losses are recognised
in profit or loss and reflected in an allowance account against loans and receivables. Interest on the impaired asset continues to be
recognised. When a subsequent event causes the amount of impairment loss to decrease, the decrease in impairment is reversed
through the profit or loss.
(i) Impairment
Significant accounting policies (continued)
The HPI Group uses derivative financial instruments, such as interest rate caps and interest rate swaps to hedge its exposure to interest
rate risks arising from financing and investment activities. The HPI Group does not hold or issue derivative financial instruments for
trading purposes. When a derivative financial instrument is not held for trading and is not designated in a qualifying hedge relationship,
all changes in fair value are recognised immediately in profit or loss.
Derivative financial instruments are recognised initially at fair value. Subsequent to initial recognition, derivative financial instruments are
stated at fair value. Derivatives are carried as assets when their fair value is positive and as liabilities when their fair value is negative.
Since the HPI Group's derivative financial instruments have not been designated in hedge relationships that qualify for hedge accounting,
the gain or loss on re-measurement to fair value is recognised immediately in profit or loss.
The fair value of interest rate derivatives are based on market prices. The prices are tested for reasonableness by discounting estimated
future cash flows based on the terms and maturity of each contract, and using market interest rates for similar derivatives at the
measurement date, and represent the estimated amount that the HPI Group would receive or pay to terminate the derivatives at the
reporting date. Fair values reflect the credit risk of the instrument and include adjustments to take account of the credit risk of the HPI
Group or the counter party when appropriate.
Issued units in the Trust are classified as equity. Incremental costs directly attributable to the issue of units are recognised as a
deduction from equity. Issued shares in the Company are classified as equity.
(h) Financial instruments (continued)
Non derivative financial assets
Objective evidence that financial assets (including equity securities) are impaired can include default or delinquency by a debtor,
restructuring of an amount due on terms that the HPI Group would not consider otherwise, indications that a debtor or issuer will enter
bankruptcy, economic conditions that correlate with defaults or the disappearance of an active market for a security.
Non-financial assets
The carrying amounts of the HPI Group's non-financial assets, other than investment property, are reviewed at each reporting date to
determine whether there is any indication of impairment. If any such indication exists, then the asset's recoverable amount is estimated.
An impairment loss is recognised if the carrying amount of an asset or its related cash-generating unit (CGU) exceeds its estimated
recoverable amount.
The recoverable amount of an asset or CGU is the greater of its value in use and its fair value less costs to sell. In assessing value in
use, the estimated future cash flows are discounted to their present value using a pre-tax discount rate that reflects current market
assessments of the time value of money and the risks specific to the asset. For the purpose of impairment testing, assets that cannot be
tested individually are grouped together into the smallest group of assets that generates cash inflows from continuing use that are largely
independent of the cash inflows of other assets or CGUs.
23
For
per
sona
l use
onl
y

Hotel Property Investments
Report for the year ended 30 June 2015
Notes to the consolidated financial statements (continued)
Note 4 Determination of fair values
(a) Investment property
(b) Trade receivables
(c) Derivatives
Note 5 Financial risk management
Where properties have not been independently valued at reporting date, properties will be valued by Directors of the Company by
capitalising the assessed net rent at the appropriate valuation yield.
The valuations of individual properties are prepared inclusive of liquor and gaming licences owned by the HPI Group. The fair value of
investment properties is based on the amounts for which the properties could be exchanged between willing parties in an arm’s length
transaction, based on current prices in an active market for similar properties in the same location and condition and subject to similar
leases. Valuations for properties are determined by reference to the net rent for each property and an applicable valuation yield.
Selection of an appropriate valuation yield is based on multiple criteria including risk associated with achieving the net rent cash flows
into the future, and observed market based valuation yields for similar properties where they are available. Valuations reflect the
creditworthiness of the tenant including market perceptions of the tenant’s creditworthiness, the responsibility and division of property
holding costs between the lessor and the lessee and the remaining economic life of the property. Properties held for sale are valued at
the fair value as at the previous reporting period.
The fair value of interest rate derivatives are based on market prices. The prices are tested for reasonableness by discounting
estimated future cash flows based on the terms and maturity of each contract, and using market interest rates for similar derivatives at
the measurement date, and represent the estimated amount that the HPI Group would receive or pay to terminate the derivatives at the
reporting date. Fair values reflect the credit risk of the instrument and include adjustments to take account of the credit risk of the HPI
Group or the counter party when appropriate.
A number of the HPI Group's accounting policies and disclosures require the determination of fair value, for both financial and non-
financial assets and liabilities. Fair values have been determined for measurement and/or disclosure purposes based on the following
methods. When applicable, further information about the assumptions made in determining fair values is disclosed in the notes specific
to that asset or liability.
The fair values of trade receivables, are estimated at the present value of future cash flows, discounted at the market rate of interest at
the measurement date. Short-term receivables with no stated interest rate are measured at the original invoice amount if the effect of
discounting is immaterial. Fair value is determined at initial recognition and, for disclosure purposes, at each annual reporting date.
Independent valuations of investment properties which the HPI Group intends to hold are obtained from suitably qualified independent
valuers as discussed in note 12.
The HPI Group has exposure to the following risks from its use of financial instruments:
credit risk
liquidity risk
market (price) risk
This note presents information about the HPI Group's exposure to each of the above risks, its objectives, policies and processes for
measuring and managing risk, and the management of capital. Further quantitative disclosures are included throughout this financial
report.
The Responsible Entity and the Company have overall responsibility for the establishment and oversight of the risk management
framework.
The Company has established and does maintain risk management policies and procedures to identify and analyse the risks faced by
the HPI Group, sets appropriate risk limits, and monitors risks and adherence to limits. Risk management policies and procedures are
reviewed regularly to reflect changes in market conditions and the HPI Group’s activities.
The Responsible Entity has appointed a Compliance Committee whose duties include but are not limited to the monitoring of the
Responsible Entity’s compliance with the Scheme’s compliance plan, and reporting any findings or breaches of the Corporations Act
2001 of which the Committee becomes aware of or that it suspects.
24
For
per
sona
l use
onl
y
Hotel Property Investments
Report for the year ended 30 June 2015
Notes to the consolidated financial statements (continued)
Note 5 Financial risk management (continued)
Credit risk
Rental and outgoing receivables
Derivatives
Liquidity risk
Market (price) risk
Interest rate risk
Property valuation risk
Capital management
The HPI Group has targeted a gearing ratio in the range of 40% to 50% in the normal course of business, which has been determined
as a prudent and appropriate range given the nature of the business. However, gearing may be higher if the HPI Boards consider the
circumstances warrant a short term increase and it is prudent to increase gearing. The targeted gearing ratio range is lower than the
covenant under the SFA, which requires the HPI Group to have an initial LVR of less than or equal to 65% reducing to 60% over the
term of the SFA.
The distribution policy of the HPI Group has been established taking into consideration the covenants of the SFA and may be adapted
to maintain gearing within the range of 40-50% in the normal course of business.
Liquidity risk is the risk that the HPI Group will not be able to meet its financial obligations as they fall due. The HPI Group's approach
to managing liquidity is to ensure, as far as possible, that it will always have sufficient liquidity to meet its liabilities when due, under
both normal and stressed conditions, without incurring unacceptable losses or risking damage to the HPI Group's reputation. The HPI
Group maintains a prudent level of gearing (targeting a 40-50% range) to mitigate liquidity risk associated with refinancing.
Credit risk is the risk of financial loss to the HPI Group if a customer or counterparty to a financial instrument fails to meet its
contractual obligations, and arises principally from the HPI Group's receivables from tenants.
The HPI Group's exposure to credit risk is influenced mainly by the individual characteristics of its tenants. The HPI Group has sought
to reduce this tenancy risk by establishing leases with reputable tenants of multiple properties. These are considered to be experienced
operators in the pub industry with a strong financial position. Approximately 95% of the HPI Group’s rental revenue is attributable to
one major tenant, the Coles Group.
In the event of rental defaults by any of the HPI Group's tenants or if a lease comes to an end the liquor and gaming licences where
owned, will revert to the HPI Group which will therefore have a business capable of immediate sale. Should there be any intervening
period of time between surrender and sale of the new lease, then the lease can be operated on behalf of the HPI Group by another
operator.
The HPI Group has entered into derivative contracts with its bankers to hedge its interest rate risk. Each counterparty has an
investment grade credit rating.
Market risk is the risk that changes in market prices, such as interest rates will affect the HPI Group's income or the value of its
holdings of financial instruments. The objective of market risk management is to manage and control market risk exposures within
acceptable parameters, while optimising the return.
Interest rate risk for the HPI Group arises from borrowings on which the banking syndicate charges interest on a variable rate basis.
This risk is mitigated by the interest rate hedging the HPI Group has in place as described in note 3 (h) (iii). Interest rate risk also exists
for interest earned on cash/bank holdings.
The HPI Group owns a number of investment properties. Those property valuations may increase or decrease from time to time. The
HPI Group's Syndicated Facility Agreement ("SFA") entered into on 9 December 2013 with its banks, contains financial covenants
which include a Loan to Value Ratio ("LVR") covenant. The HPI Group reviews the risk of breach of this covenant by regularly
monitoring and reporting on it.
The HPI Group's policy is to maintain a strong capital base so as to maintain investor and creditor confidence and to sustain future
development of the business. Capital consists of ASX listed stapled securities. The HPI Group monitors the return on capital as well as
yields on the property portfolio.
As noted previously the HPI Group entered into the SFA with its banks on 9 December 2013. The HPI Group considers its borrowings
as part of its capital management strategy. The SFA contains financial covenants within which the HPI Group must always operate,
and includes a LVR covenant and an Interest Cover Ratio (ICR) covenant. The Manager manages compliance with the financial
covenants through forward projections to ensure that the HPI Group is unlikely to breach the covenants into the future. The HPI Group
complied with the covenants for the year ended 30 June 2015.
25
For
per
sona
l use
onl
y

Hotel Property Investments
Report for the year ended 30 June 2015
Notes to the consolidated financial statements (continued)
Note 6 Stapling
2015 2014
Note $’000 $’000
Note 7 Other expenses
473 11,359
1,647 1,785
158 423
333 206
634 1,168
3,245 14,941
$ $
153,750 150,000
4,000 272,500
157,750 422,500
2015 2014
$’000 $’000
Note 8 Finance costs
- interest expense (i) 10,116 15,617
(ii) 222 7,587
- other finance costs 67 345
10,405 23,549
(i)
(ii)
As the Trust has not acquired an equity interest in the Company, no consideration was transferred in connection with the stapling. The
Company had no assets at the time of stapling.
The stapling of the units of the Trust and the shares of the Company occurred on 10 December 2013 for the purpose of the public quotation
of the HPI Group on the ASX. Australian Accounting Standards require an acquirer to be identified in a business combination. In relation to
the stapling of the Company and the Trust, the Trust has been identified as the acquirer due to its large relative size to the Company.
In a business combination achieved as a consequence of stapling, the acquirer receives no equity interests in the acquiree. Therefore
100% of the acquiree's equity is attributable to the shareholders of the Company and is accounted for as non-controlling interests. Also, as
a result, no goodwill is recognised.
Advisory and legal fees
Management fees
All other expenses
In the comparative period the HPI Group incurred $11.4m of advisory and legal fees directly related to its listing on 10 December 2013.
Auditor's remuneration
Directors' fees
Represents the write-off of the unamortised borrowing costs relating to the SFA which terminated on 9 December 2013, and
amortisation of the borrowing costs relating to the new SFA which were capitalised on 9 December 2013 and which are being
amortised over the term of the SFA.
Syndicated Facility Agreement (“SFA”)
Auditor’s remuneration
KPMG Australia
- Audit and review of financial reports
- amortised borrowing costs and write off of deferred borrowing costs
Represents interest expense under the previous SFA which terminated on 9 December 2013 and the SFA which commenced
contemporaneously on that date. The SFA interest rate is the average monthly BBSY (Bank Bill Swap Bid Rate) at the
commencement of each funding period plus a margin.
- Other assurance services
In the comparative period the HPI Group paid $272,500 of fees in relation to an Investigating Accountants report relating to the listing on 10
December 2013.
26
For
per
sona
l use
onl
y
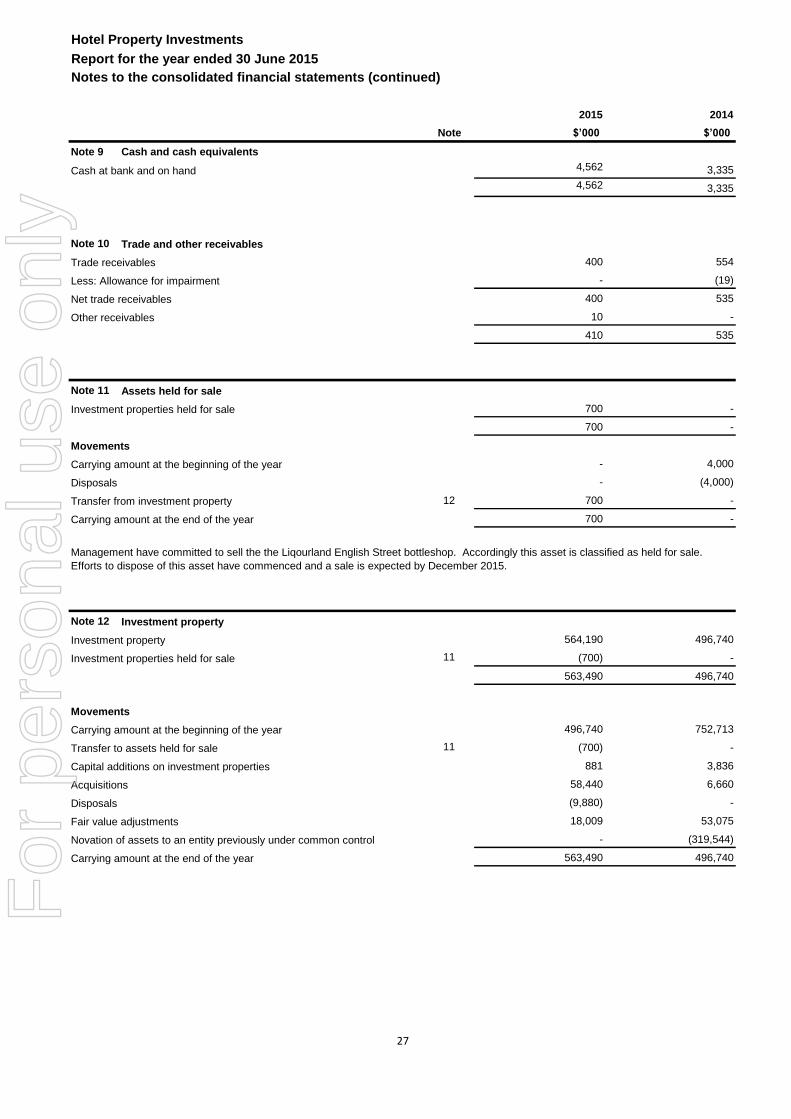
Hotel Property Investments
Report for the year ended 30 June 2015
Notes to the consolidated financial statements (continued)
2015 2014
Note $’000 $’000
Note 9 Cash and cash equivalents
Cash at bank and on hand 4,562 3,335
4,562 3,335
Note 10 Trade and other receivables
Trade receivables 400 554
Less: Allowance for impairment - (19)
Net trade receivables 400 535
Other receivables 10 -
410 535
Note 11 Assets held for sale
Investment properties held for sale 700 -
700 -
Movements
Carrying amount at the beginning of the year - 4,000
Disposals - (4,000)
Transfer from investment property 12 700 -
Carrying amount at the end of the year 700 -
Note 12 Investment property
Investment property 564,190 496,740
Investment properties held for sale 11 (700) -
563,490 496,740
Movements
Carrying amount at the beginning of the year 496,740 752,713
Transfer to assets held for sale 11 (700) -
Capital additions on investment properties 881 3,836
Acquisitions 58,440 6,660
Disposals (9,880) -
Fair value adjustments 18,009 53,075
- (319,544)
Carrying amount at the end of the year 563,490 496,740
Novation of assets to an entity previously under common control
Management have committed to sell the the Liqourland English Street bottleshop. Accordingly this asset is classified as held for sale.
Efforts to dispose of this asset have commenced and a sale is expected by December 2015.
27
For
per
sona
l use
onl
y
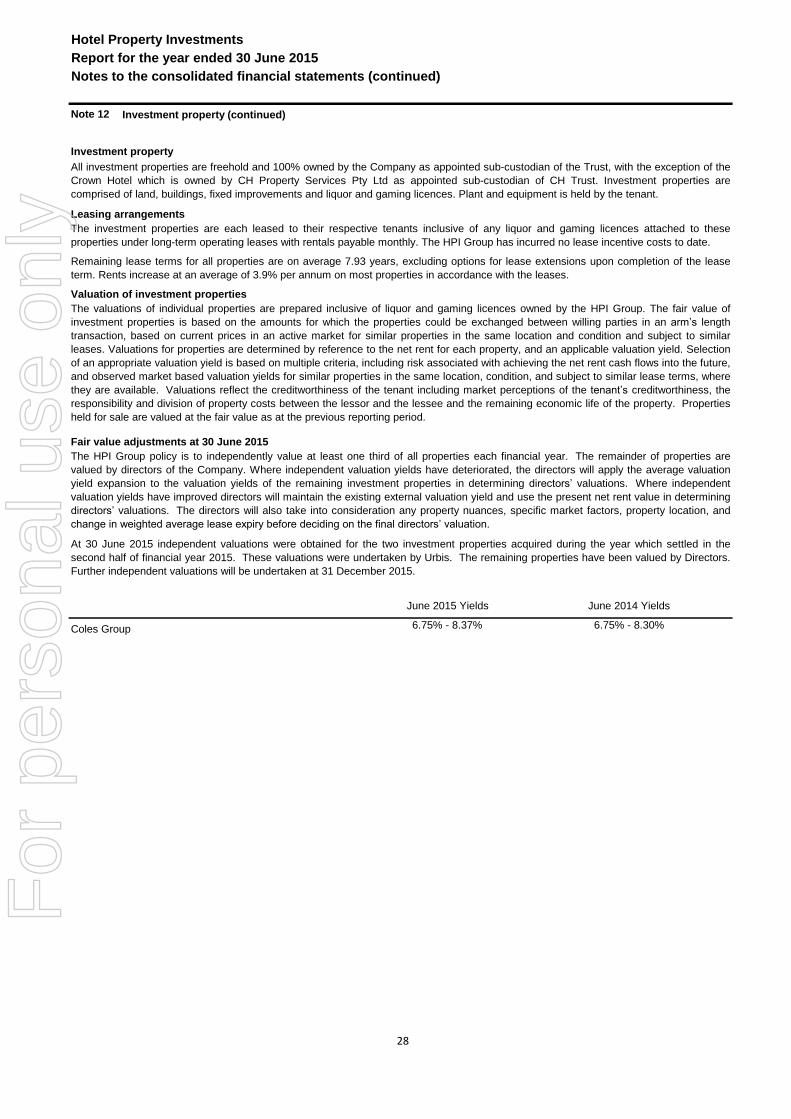
Hotel Property Investments
Report for the year ended 30 June 2015
Notes to the consolidated financial statements (continued)
Note 12 Investment property (continued)
Investment property
Leasing arrangements
Valuation of investment properties
Fair value adjustments at 30 June 2015
Coles Group
All investment properties are freehold and 100% owned by the Company as appointed sub-custodian of the Trust, with the exception of the
Crown Hotel which is owned by CH Property Services Pty Ltd as appointed sub-custodian of CH Trust. Investment properties are
comprised of land, buildings, fixed improvements and liquor and gaming licences. Plant and equipment is held by the tenant.
Remaining lease terms for all properties are on average 7.93 years, excluding options for lease extensions upon completion of the lease
term. Rents increase at an average of 3.9% per annum on most properties in accordance with the leases.
The investment properties are each leased to their respective tenants inclusive of any liquor and gaming licences attached to these
properties under long-term operating leases with rentals payable monthly. The HPI Group has incurred no lease incentive costs to date.
The valuations of individual properties are prepared inclusive of liquor and gaming licences owned by the HPI Group. The fair value of
investment properties is based on the amounts for which the properties could be exchanged between willing parties in an arm’s length
transaction, based on current prices in an active market for similar properties in the same location and condition and subject to similar
leases. Valuations for properties are determined by reference to the net rent for each property, and an applicable valuation yield. Selection
of an appropriate valuation yield is based on multiple criteria, including risk associated with achieving the net rent cash flows into the future,
and observed market based valuation yields for similar properties in the same location, condition, and subject to similar lease terms, where
they are available. Valuations reflect the creditworthiness of the tenant including market perceptions of the tenant’s creditworthiness, the
responsibility and division of property costs between the lessor and the lessee and the remaining economic life of the property. Properties
held for sale are valued at the fair value as at the previous reporting period.
The HPI Group policy is to independently value at least one third of all properties each financial year. The remainder of properties are
valued by directors of the Company. Where independent valuation yields have deteriorated, the directors will apply the average valuation
yield expansion to the valuation yields of the remaining investment properties in determining directors’ valuations. Where independent
valuation yields have improved directors will maintain the existing external valuation yield and use the present net rent value in determining
directors’ valuations. The directors will also take into consideration any property nuances, specific market factors, property location, and
change in weighted average lease expiry before deciding on the final directors’ valuation.
At 30 June 2015 independent valuations were obtained for the two investment properties acquired during the year which settled in the
second half of financial year 2015. These valuations were undertaken by Urbis. The remaining properties have been valued by Directors.
Further independent valuations will be undertaken at 31 December 2015.
June 2015 Yields
6.75% - 8.37%
June 2014 Yields
6.75% - 8.30%
28
For
per
sona
l use
onl
y

Hotel Property Investments
Report for the year ended 30 June 2015
Notes to the consolidated financial statements (continued)
Note 12 Investment property (continued)
2015 2014
$’000 $’000
Fair value as at beginning of the year 496,740 752,713
Transfer to assets held for sale (700) -
Capital additions on investment properties 881 3,836
Acquisitions 58,440 6,660
Disposals (9,880) -
- (319,544)
Carrying amount before revaluations 545,481 443,665
Fair value as at end of the year 563,490 496,740
Fair value gain/(loss) for year 18,009 53,075
- Additional land
- Capital allowance Capitalisation rates
Additional land
Capital allowance
Reconciliation of fair value gains/losses
Valuation technique and significant unobservable inputs
The following table shows the valuation technique used in measuring the fair value of investment property, as well as the significant
unobservable inputs used.
Valuation technique
Capitalisation of rent allowing for the following
adjustments:
The estimated fair value would increase (decrease)
if:
Capital allowance was (smaller) larger
Capitalisation rates were (lower) higher
Net rent was higher (lower)
Additional land was higher (lower) in value
Net rent
Fair value hierarchy
The fair value measurement for investment property of $563.5 million has been categorised as a Level 3 fair value based on the inputs to
the valuation technique used.
Level 3 fair value
The following table shows a reconciliation from the opening balances to the closing balances for Level 3 fair values.
Novation of assets to an entity under common control
Significant unobservable inputs
Inter-relationship between key unobservable
inputs and fair value measurement
29
For
per
sona
l use
onl
y
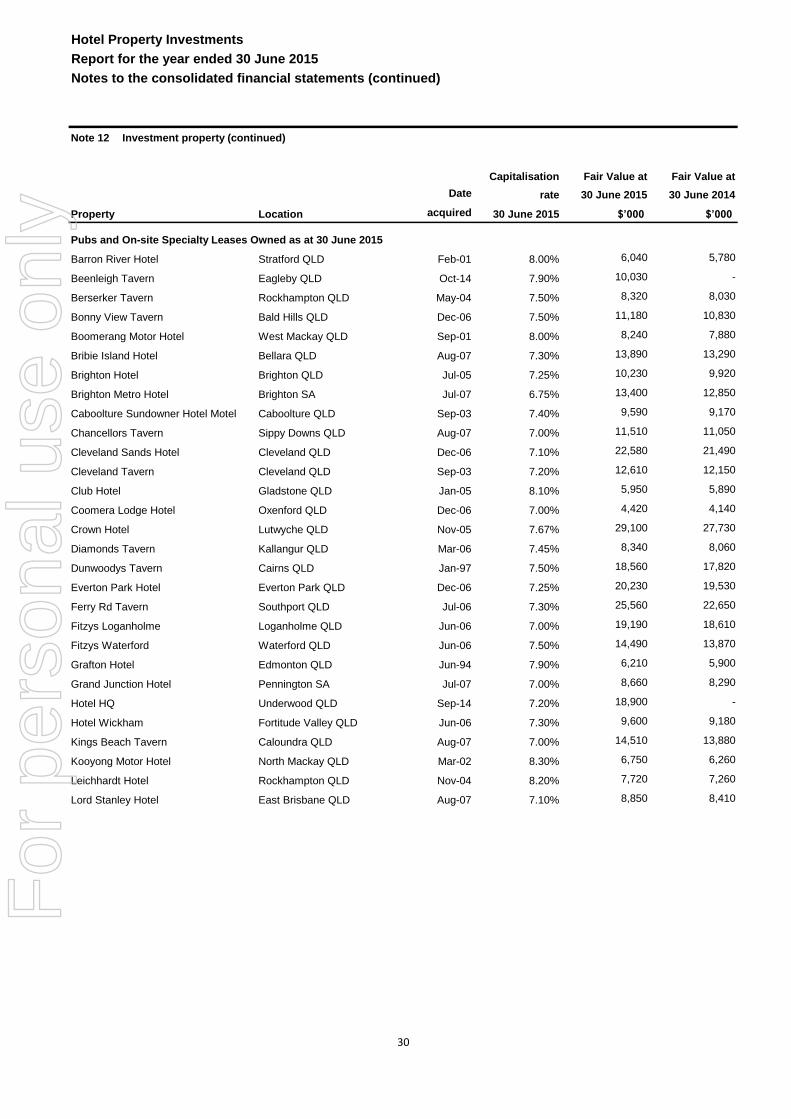
Hotel Property Investments
Report for the year ended 30 June 2015
Notes to the consolidated financial statements (continued)
Note 12 Investment property (continued)
Capitalisation Fair Value at Fair Value at
Date rate 30 June 2015 30 June 2014
Property Location acquired 30 June 2015 $’000 $’000
Pubs and On-site Specialty Leases Owned as at 30 June 2015
Barron River Hotel Stratford QLD Feb-01 8.00% 6,040 5,780
Beenleigh Tavern Eagleby QLD Oct-14 7.90% 10,030 -
Berserker Tavern Rockhampton QLD May-04 7.50% 8,320 8,030
Bonny View Tavern Bald Hills QLD Dec-06 7.50% 11,180 10,830
Boomerang Motor Hotel West Mackay QLD Sep-01 8.00% 8,240 7,880
Bribie Island Hotel Bellara QLD Aug-07 7.30% 13,890 13,290
Brighton Hotel Brighton QLD Jul-05 7.25% 10,230 9,920
Brighton Metro Hotel Brighton SA Jul-07 6.75% 13,400 12,850
Caboolture Sundowner Hotel Motel Caboolture QLD Sep-03 7.40% 9,590 9,170
Chancellors Tavern Sippy Downs QLD Aug-07 7.00% 11,510 11,050
Cleveland Sands Hotel Cleveland QLD Dec-06 7.10% 22,580 21,490
Cleveland Tavern Cleveland QLD Sep-03 7.20% 12,610 12,150
Club Hotel Gladstone QLD Jan-05 8.10% 5,950 5,890
Coomera Lodge Hotel Oxenford QLD Dec-06 7.00% 4,420 4,140
Crown Hotel Lutwyche QLD Nov-05 7.67% 29,100 27,730
Diamonds Tavern Kallangur QLD Mar-06 7.45% 8,340 8,060
Dunwoodys Tavern Cairns QLD Jan-97 7.50% 18,560 17,820
Everton Park Hotel Everton Park QLD Dec-06 7.25% 20,230 19,530
Ferry Rd Tavern Southport QLD Jul-06 7.30% 25,560 22,650
Fitzys Loganholme Loganholme QLD Jun-06 7.00% 19,190 18,610
Fitzys Waterford Waterford QLD Jun-06 7.50% 14,490 13,870
Grafton Hotel Edmonton QLD Jun-94 7.90% 6,210 5,900
Grand Junction Hotel Pennington SA Jul-07 7.00% 8,660 8,290
Hotel HQ Underwood QLD Sep-14 7.20% 18,900 -
Hotel Wickham Fortitude Valley QLD Jun-06 7.30% 9,600 9,180
Kings Beach Tavern Caloundra QLD Aug-07 7.00% 14,510 13,880
Kooyong Motor Hotel North Mackay QLD Mar-02 8.30% 6,750 6,260
Leichhardt Hotel Rockhampton QLD Nov-04 8.20% 7,720 7,260
Lord Stanley Hotel East Brisbane QLD Aug-07 7.10% 8,850 8,410
30
For
per
sona
l use
onl
y
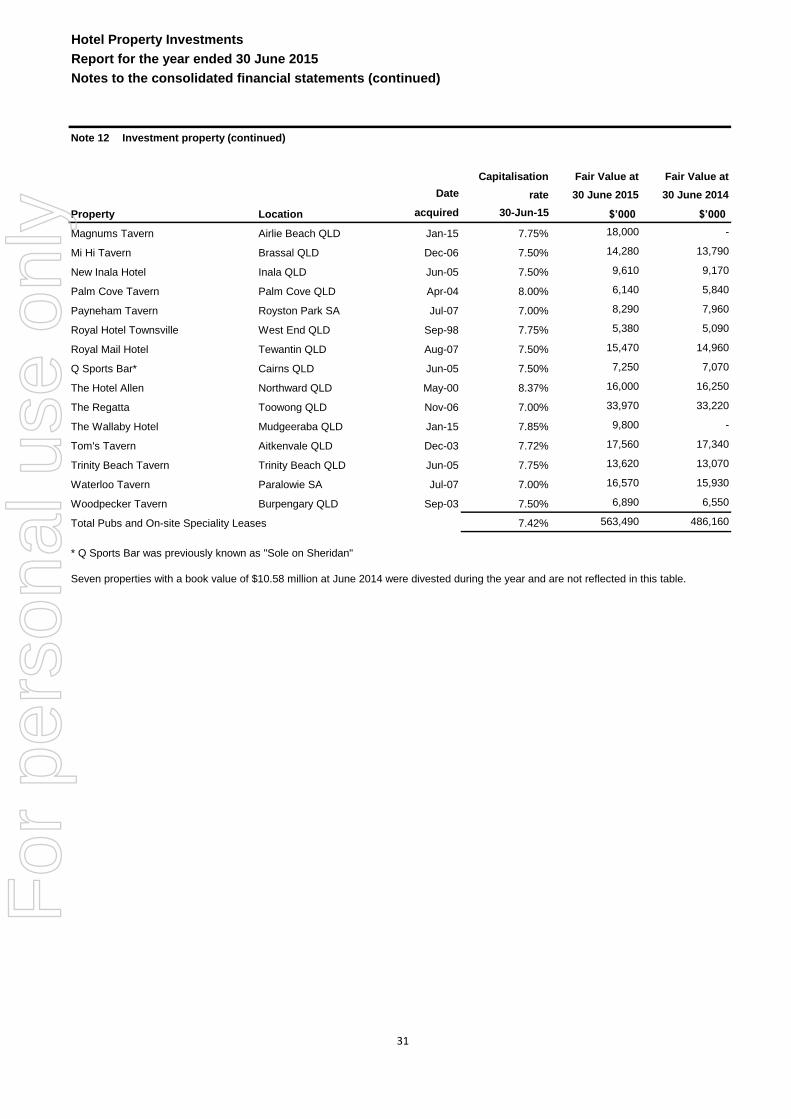
Hotel Property Investments
Report for the year ended 30 June 2015
Notes to the consolidated financial statements (continued)
Note 12 Investment property (continued)
Capitalisation Fair Value at Fair Value at
Date rate 30 June 2015 30 June 2014
Property Location acquired 30-Jun-15 $’000 $’000
Magnums Tavern Airlie Beach QLD Jan-15 7.75% 18,000 -
Mi Hi Tavern Brassal QLD Dec-06 7.50% 14,280 13,790
New Inala Hotel Inala QLD Jun-05 7.50% 9,610 9,170
Palm Cove Tavern Palm Cove QLD Apr-04 8.00% 6,140 5,840
Payneham Tavern Royston Park SA Jul-07 7.00% 8,290 7,960
Royal Hotel Townsville West End QLD Sep-98 7.75% 5,380 5,090
Royal Mail Hotel Tewantin QLD Aug-07 7.50% 15,470 14,960
Q Sports Bar* Cairns QLD Jun-05 7.50% 7,250 7,070
The Hotel Allen Northward QLD May-00 8.37% 16,000 16,250
The Regatta Toowong QLD Nov-06 7.00% 33,970 33,220
The Wallaby Hotel Mudgeeraba QLD Jan-15 7.85% 9,800 -
Tom's Tavern Aitkenvale QLD Dec-03 7.72% 17,560 17,340
Trinity Beach Tavern Trinity Beach QLD Jun-05 7.75% 13,620 13,070
Waterloo Tavern Paralowie SA Jul-07 7.00% 16,570 15,930
Woodpecker Tavern Burpengary QLD Sep-03 7.50% 6,890 6,550
Total Pubs and On-site Speciality Leases 7.42% 563,490 486,160
* Q Sports Bar was previously known as "Sole on Sheridan"
Seven properties with a book value of $10.58 million at June 2014 were divested during the year and are not reflected in this table.
31
For
per
sona
l use
onl
y
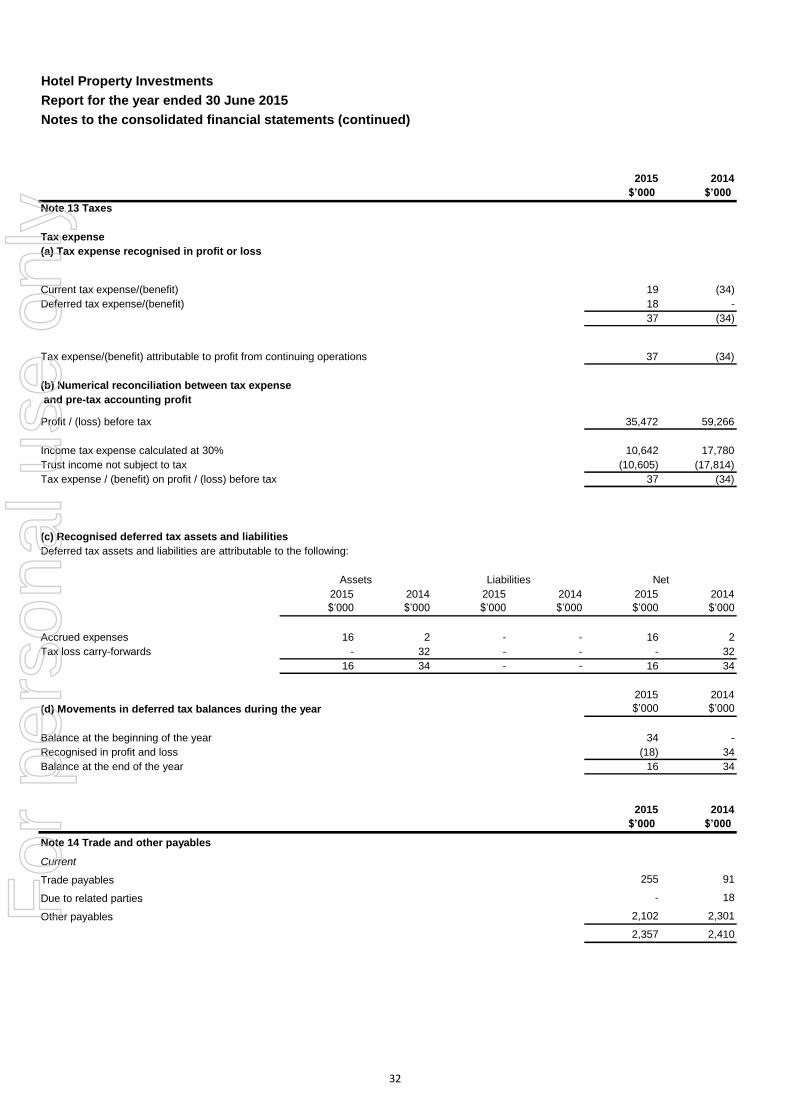
Hotel Property Investments
Report for the year ended 30 June 2015
Notes to the consolidated financial statements (continued)
2015 2014
$’000 $’000
Note 13 Taxes
Tax expense
(a) Tax expense recognised in profit or loss
Current tax expense/(benefit) 19 (34)
Deferred tax expense/(benefit) 18 -
37 (34)
Tax expense/(benefit) attributable to profit from continuing operations 37 (34)
(b) Numerical reconciliation between tax expense
and pre-tax accounting profit
Profit / (loss) before tax 35,472 59,266
Income tax expense calculated at 30% 10,642 17,780
Trust income not subject to tax (10,605) (17,814)
Tax expense / (benefit) on profit / (loss) before tax 37 (34)
(c) Recognised deferred tax assets and liabilities
Deferred tax assets and liabilities are attributable to the following:
2015 2014 2015 2014 2015 2014
$’000 $’000 $’000 $’000 $’000 $’000
Accrued expenses 16 2 - - 16 2
Tax loss carry-forwards - 32 - - - 32
16 34 - - 16 34
2015 2014
(d) Movements in deferred tax balances during the year $’000 $’000
Balance at the beginning of the year 34 -
Recognised in profit and loss (18) 34
Balance at the end of the year 16 34
2015 2014
$’000 $’000
Note 14 Trade and other payables
255 91
- 18
2,102 2,301
2,357 2,410
Due to related parties
Other payables
Assets Liabilities Net
Current
Trade payables
32
For
per
sona
l use
onl
y
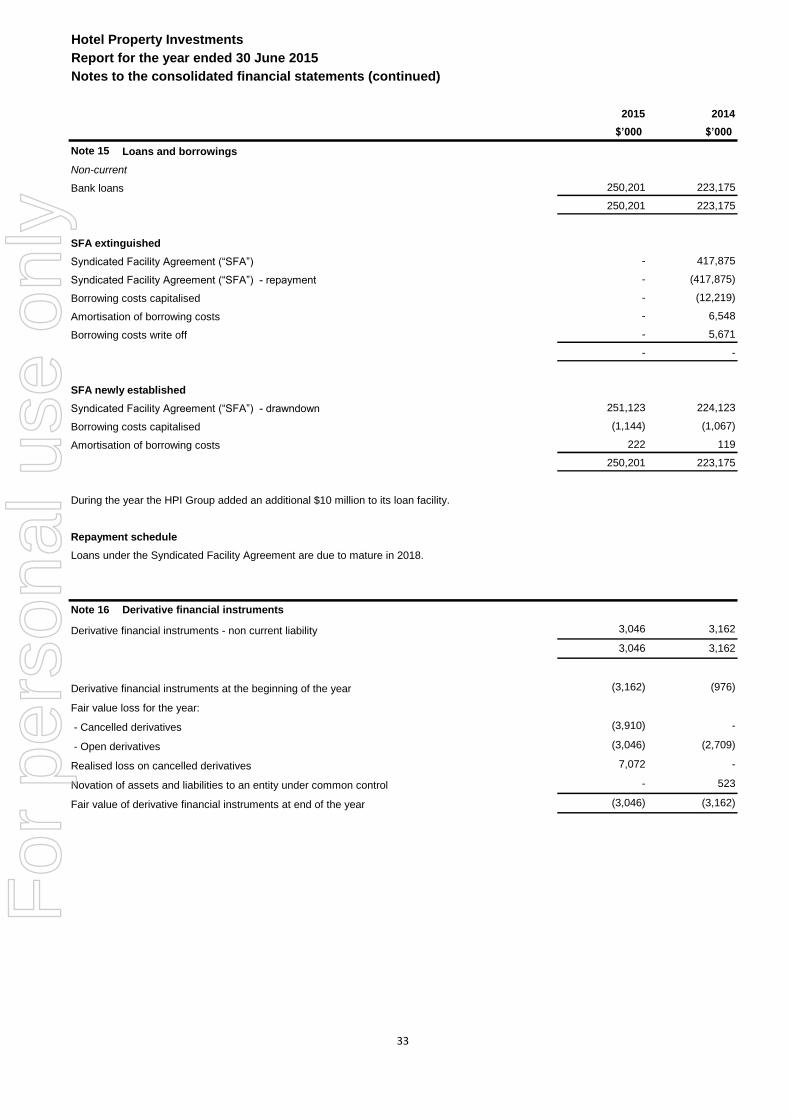
Hotel Property Investments
Report for the year ended 30 June 2015
Notes to the consolidated financial statements (continued)
2015 2014
$’000 $’000
Note 15 Loans and borrowings
Non-current
Bank loans 250,201 223,175
250,201 223,175
SFA extinguished
Syndicated Facility Agreement (“SFA”) - 417,875
Syndicated Facility Agreement (“SFA”) - repayment - (417,875)
Borrowing costs capitalised - (12,219)
Amortisation of borrowing costs - 6,548
Borrowing costs write off - 5,671
- -
SFA newly established
Syndicated Facility Agreement (“SFA”) - drawndown 251,123 224,123
Borrowing costs capitalised (1,144) (1,067)
Amortisation of borrowing costs 222 119
250,201 223,175
Note 16 Derivative financial instruments
Derivative financial instruments - non current liability 3,046 3,162
3,046 3,162
Derivative financial instruments at the beginning of the year (3,162) (976)
Fair value loss for the year:
- Cancelled derivatives (3,910) -
- Open derivatives (3,046) (2,709)
Realised loss on cancelled derivatives 7,072 -
- 523
Fair value of derivative financial instruments at end of the year (3,046) (3,162)
Loans under the Syndicated Facility Agreement are due to mature in 2018.
Repayment schedule
During the year the HPI Group added an additional $10 million to its loan facility.
Novation of assets and liabilities to an entity under common control
33
For
per
sona
l use
onl
y
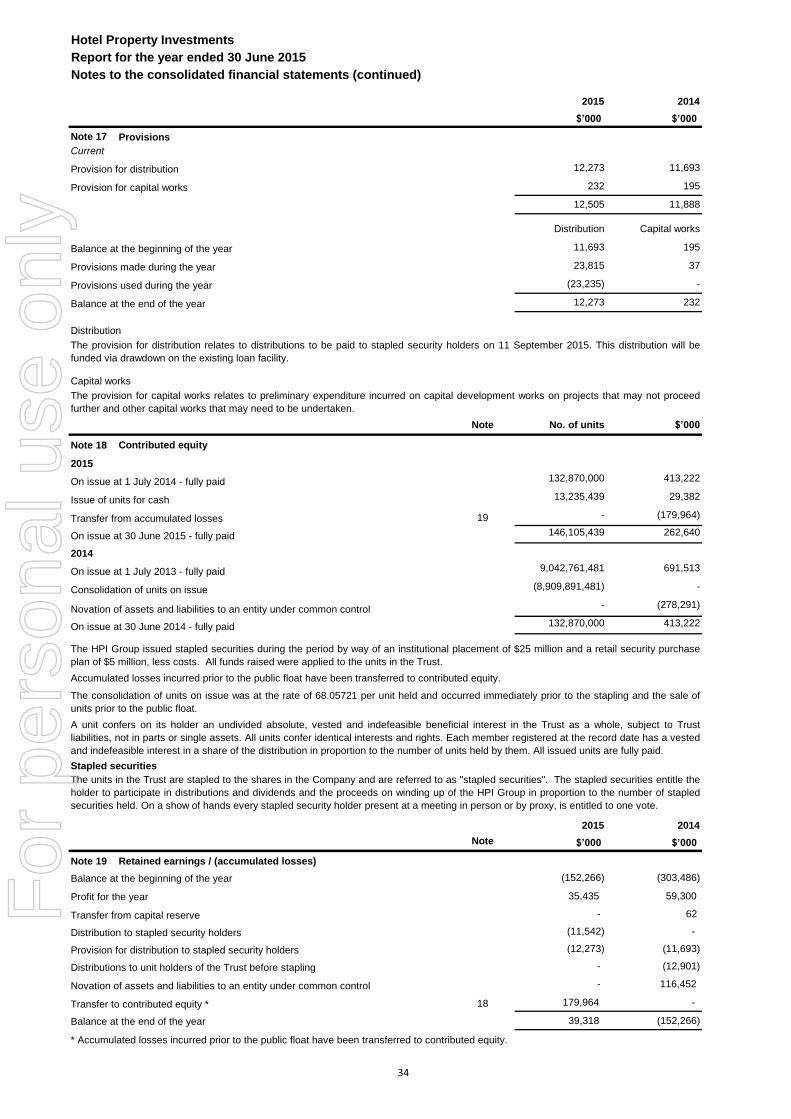
Hotel Property Investments
Report for the year ended 30 June 2015
Notes to the consolidated financial statements (continued)
2015 2014
$’000 $’000
Note 17 Provisions
Current
Provision for distribution 12,273 11,693
Provision for capital works 232 195
12,505 11,888
Distribution Capital works
Balance at the beginning of the year 11,693 195
Provisions made during the year 23,815 37
Provisions used during the year (23,235) -
Balance at the end of the year 12,273 232
Note No. of units $’000
Note 18
2015
132,870,000 413,222
13,235,439 29,382
19 - (179,964)
146,105,439 262,640
2014
9,042,761,481 691,513
(8,909,891,481) -
- (278,291)
132,870,000 413,222
2015 2014
Note $’000 $’000
Note 19
(152,266) (303,486)
35,435 59,300
- 62
(11,542) -
(12,273) (11,693)
- (12,901)
- 116,452
18 179,964 -
39,318 (152,266)
Novation of assets and liabilities to an entity under common control
Balance at the end of the year
Profit for the year
Provision for distribution to stapled security holders
Distributions to unit holders of the Trust before stapling
Distribution to stapled security holders
Transfer to contributed equity *
Contributed equity
On issue at 1 July 2013 - fully paid
Distribution
Capital works
The provision for distribution relates to distributions to be paid to stapled security holders on 11 September 2015. This distribution will be
funded via drawdown on the existing loan facility.
The provision for capital works relates to preliminary expenditure incurred on capital development works on projects that may not proceed
further and other capital works that may need to be undertaken.
Transfer from accumulated losses
* Accumulated losses incurred prior to the public float have been transferred to contributed equity.
The HPI Group issued stapled securities during the period by way of an institutional placement of $25 million and a retail security purchase
plan of $5 million, less costs. All funds raised were applied to the units in the Trust.
Accumulated losses incurred prior to the public float have been transferred to contributed equity.
On issue at 1 July 2014 - fully paid
Issue of units for cash
On issue at 30 June 2015 - fully paid
The units in the Trust are stapled to the shares in the Company and are referred to as "stapled securities". The stapled securities entitle the
holder to participate in distributions and dividends and the proceeds on winding up of the HPI Group in proportion to the number of stapled
securities held. On a show of hands every stapled security holder present at a meeting in person or by proxy, is entitled to one vote.
Stapled securities
Consolidation of units on issue
The consolidation of units on issue was at the rate of 68.05721 per unit held and occurred immediately prior to the stapling and the sale of
units prior to the public float.
A unit confers on its holder an undivided absolute, vested and indefeasible beneficial interest in the Trust as a whole, subject to Trust
liabilities, not in parts or single assets. All units confer identical interests and rights. Each member registered at the record date has a vested
and indefeasible interest in a share of the distribution in proportion to the number of units held by them. All issued units are fully paid.
Novation of assets and liabilities to an entity under common control
On issue at 30 June 2014 - fully paid
Retained earnings / (accumulated losses)
Balance at the beginning of the year
Transfer from capital reserve
34
For
per
sona
l use
onl
y

Hotel Property Investments
Report for the year ended 30 June 2015
Notes to the consolidated financial statements (continued)
2015 2014
$’000 $’000
Note 20
- -
- 62
- (62)
- -
Note 21
146,105,439 132,870,000
$301,958,130 $260,955,870
$2.07 $1.96
Note 22
$35,435,157 $59,299,646
No of securities No of securities
132,870,000 9,042,761,481
- (8,909,891,481)
9,192,177 -
142,062,177 132,870,000
24.94 44.63
Note 23
Total Distributions per
distribution No of stapled stapled security
$’000 securities cents
11,542 146,105,439 7.90
12,273 146,105,439 8.40
23,815 16.30
- 132,870,000 -
11,693 132,870,000 8.80
11,693 8.80
Total Distributions
distribution per unit
$’000 No of units cents
12,901 9,042,761,481 0.14 1 July 2013 to 9 December 2013
Distributions
10 December 2013 to 31 December 2013
1 January 2014 to 30 June 2014
Total distribution for the year
2014
Distributions to stapled security holders
Distributions to unit holders of the Trust before stapling
2014
Total distribution for the year
2015
1 July 2014 to 31 December 2014
1 January 2015 to 30 June 2015
Reserves
Capital reserve
Opening balance at the beginning of the year
Movements
Profit for the year
Transfer to accumulated losses
Closing balance at the end of the year
Net assets at balance date
The capital reserve was no longer being maintained for a specific purpose and a decision was made to transfer the balance to retained
earnings / (accumulated losses).
Net assets per stapled security
Per stapled security on issue
Earnings per security
Number of stapled securities on issue as at the end of the year
Basic and diluted earnings per security - cents
Basic and diluted earnings per security on issue are lower than the comparative period primarily because the comparative period includes
the results of an additional 28 investment properties only up until their novation to another entity on 9 December 2013 as part of the HPI
Group float.
Effect of securities issued
Weighted average number of securities
On issue at the beginning of the year
Effect of consolidation of securities on issue
35
For
per
sona
l use
onl
y
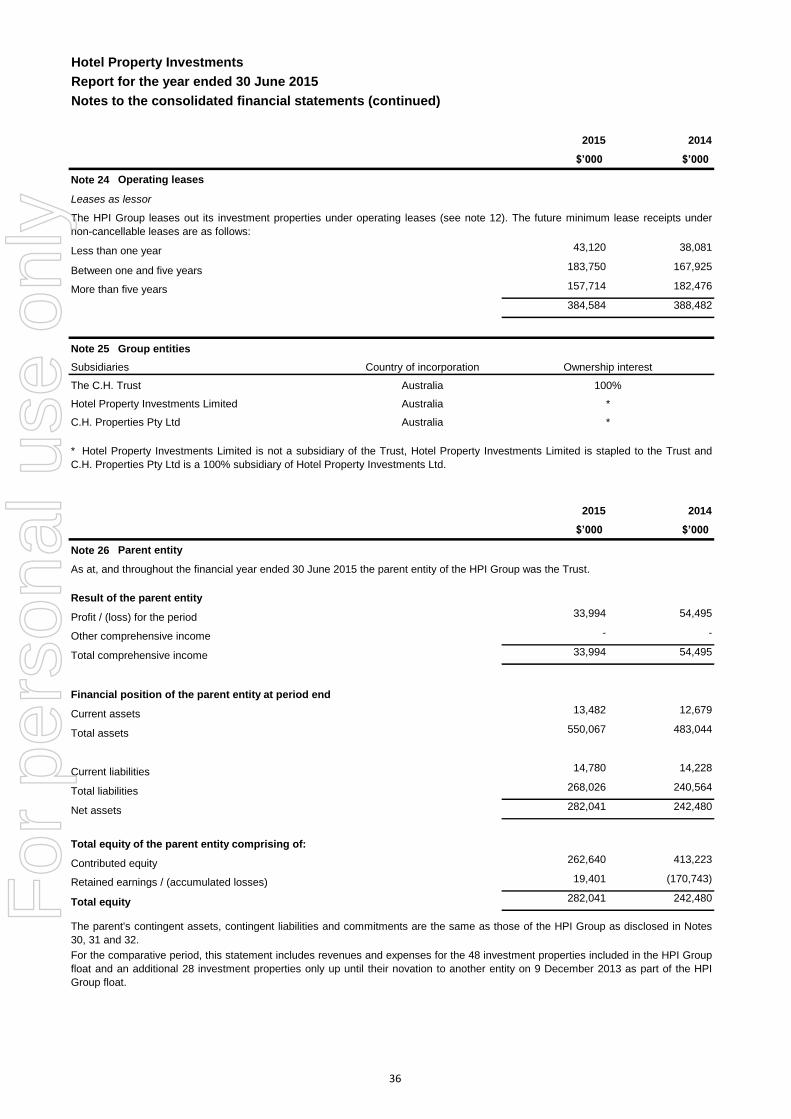
Hotel Property Investments
Report for the year ended 30 June 2015
Notes to the consolidated financial statements (continued)
2015 2014
$’000 $’000
Note 24
Leases as lessor
43,120 38,081
Between one and five years 183,750 167,925
157,714 182,476
384,584 388,482
Note 25
2015 2014
$’000 $’000
Note 26
Result of the parent entity
Profit / (loss) for the period 33,994 54,495
- -
33,994 54,495
Financial position of the parent entity at period end
Current assets 13,482 12,679
Total assets 550,067 483,044
Current liabilities 14,780 14,228
Total liabilities 268,026 240,564
Net assets 282,041 242,480
Total equity of the parent entity comprising of:
Contributed equity 262,640 413,223
19,401 (170,743)
Total equity 282,041 242,480
The parent's contingent assets, contingent liabilities and commitments are the same as those of the HPI Group as disclosed in Notes
30, 31 and 32.
Operating leases
Group entities
For the comparative period, this statement includes revenues and expenses for the 48 investment properties included in the HPI Group
float and an additional 28 investment properties only up until their novation to another entity on 9 December 2013 as part of the HPI
Group float.
Total comprehensive income
Country of incorporation Ownership interest
C.H. Properties Pty Ltd Australia *
The C.H. Trust Australia 100%
Hotel Property Investments Limited
Parent entity
As at, and throughout the financial year ended 30 June 2015 the parent entity of the HPI Group was the Trust.
Retained earnings / (accumulated losses)
The HPI Group leases out its investment properties under operating leases (see note 12). The future minimum lease receipts under
non-cancellable leases are as follows:
Less than one year
More than five years
Australia
Other comprehensive income
*
Subsidiaries
* Hotel Property Investments Limited is not a subsidiary of the Trust, Hotel Property Investments Limited is stapled to the Trust and
C.H. Properties Pty Ltd is a 100% subsidiary of Hotel Property Investments Ltd.
36
For
per
sona
l use
onl
y

Hotel Property Investments
Report for the year ended 30 June 2015
Notes to the consolidated financial statements (continued)
Note 27
2015 2014
$ $
304,304 188,475
28,909 17,434
333,213 205,909
(c) Other related party transactions
2015 2014 2015 2014
$ $ $ $
222,204 185,727 37,296 18,333
1,647,173 1,784,651 - -
a.
b.
Related parties
(a) Key management personnel
The Trust does not employ personnel in its own right. However, the Trust is required to have an incorporated responsible entity to
manage its activities. The directors and company secretaries of the Responsible Entity are considered key management personnel of
the Trust and the HPI Group.
No fees or benefits are payable to the directors of the Responsible Entity out of the assets of the Trust. Those directors are employees
of an entity related to the Responsible Entity.
The Responsible Entity is entitled to receive a fee each financial year while it is the responsible entity of the Trust. The fees will be paid
from the income or assets of the Trust monthly in arrears.
The base fee is equal to:
Services Manager fee
Unit holders prior to stapling
John Russell and Trevor O'Hoy, non-executive directors of the Company during the year, are also directors of the Services Manager.
The directors of the Company are considered key management personnel of the HPI Group.
Transaction values for the
year ended 30 June
Balance outstanding as at
30 June
Responsible entity fee
Services Manager fee
Post-employment benefits relate to defined contribution superannuation benefits.
Entities related to the Responsible Entity within the Perpetual Group held 1,320,534 of stapled securities.
Prior to the public float of the HPI Group, assets and liabilities not intended for the float were assigned or novated to entities under
common control of the vendors. At the end of the period there were no amounts owing to the vendors.
During the comparative period distributions totalling $12.9 million were paid to the unit holders of the Trust prior to stapling.
For the period prior to the listing of the HPI Group, the HPI Group paid for transactions on behalf of other entities under common control
of the vendors. The total amount paid was $8.9 million of which $3.0 million was repaid. The amounts owing to the HPI Group were
then novated to other entities under common control of the vendors. At the end of the period there were no amounts owing to the HPI
Group.
As stated previously the Company has delegated and subcontracted substantially all of its administrative, operational and management
obligations to the Services Manager (Redcape Services Pty Ltd) pursuant to the Administrative Services Agreement. As a result the HPI
Group has no other key management personnel.
(b) Key management personnel compensation
Key management personnel compensation from the date of stapling comprised the following:
Short-term employee benefits
Post-employment benefits
The Services Manager is being paid a fixed monthly fee (adjusted annually for CPI) of $138,473 for providing the primary administrative,
operational and management services under the Administrative Services Agreement.
Responsible Entity fee
where the value of the Portfolio on the last Business Day of a financial year is less than or equal to $500 million, $220,000 per
annum (as adjusted annually for CPI); or
where the value of the portfolio on the last business day of a financial year is more than $500 million, $220,000 per annum (as
adjusted annually for CPI) plus 0.03% per annum of the value of the Portfolio in excess of $500 million.
37
For
per
sona
l use
onl
y
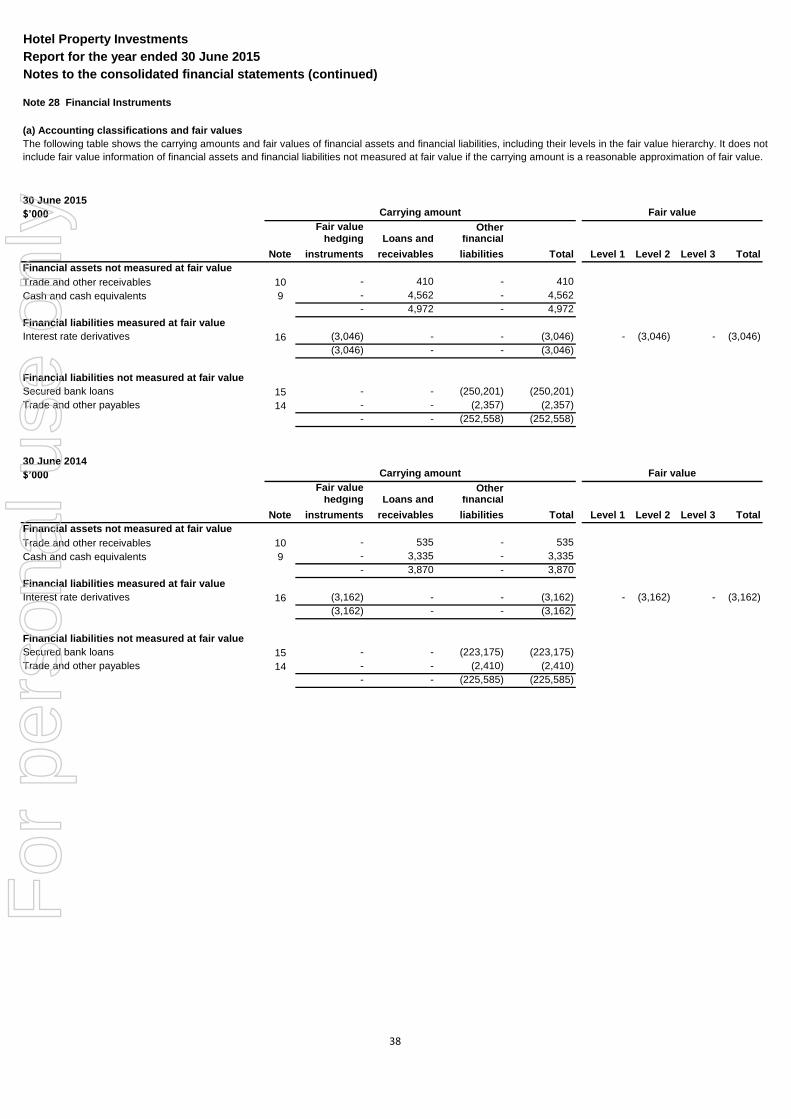
Hotel Property Investments
Report for the year ended 30 June 2015
Notes to the consolidated financial statements (continued)
Note 28 Financial Instruments
(a) Accounting classifications and fair values
30 June 2015
$’000
Fair value Otherhedging Loans and financial
Note instruments receivables liabilities Total Level 1 Level 2 Level 3 Total
Financial assets not measured at fair value
Trade and other receivables 10 - 410 - 410
Cash and cash equivalents 9 - 4,562 - 4,562
- 4,972 - 4,972
Financial liabilities measured at fair value
Interest rate derivatives 16 (3,046) - - (3,046) - (3,046) - (3,046)
(3,046) - - (3,046)
Financial liabilities not measured at fair value
Secured bank loans 15 - - (250,201) (250,201)
Trade and other payables 14 - - (2,357) (2,357)
- - (252,558) (252,558)
30 June 2014
$’000
Fair value Otherhedging Loans and financial
Note instruments receivables liabilities Total Level 1 Level 2 Level 3 Total
Financial assets not measured at fair value
Trade and other receivables 10 - 535 - 535
Cash and cash equivalents 9 - 3,335 - 3,335
- 3,870 - 3,870
Financial liabilities measured at fair value
Interest rate derivatives 16 (3,162) - - (3,162) - (3,162) - (3,162)
(3,162) - - (3,162)
Financial liabilities not measured at fair value
Secured bank loans 15 - - (223,175) (223,175)
Trade and other payables 14 - - (2,410) (2,410)
- - (225,585) (225,585)
The following table shows the carrying amounts and fair values of financial assets and financial liabilities, including their levels in the fair value hierarchy. It does not
include fair value information of financial assets and financial liabilities not measured at fair value if the carrying amount is a reasonable approximation of fair value.
Carrying amount Fair value
Carrying amount Fair value
38
For
per
sona
l use
onl
y
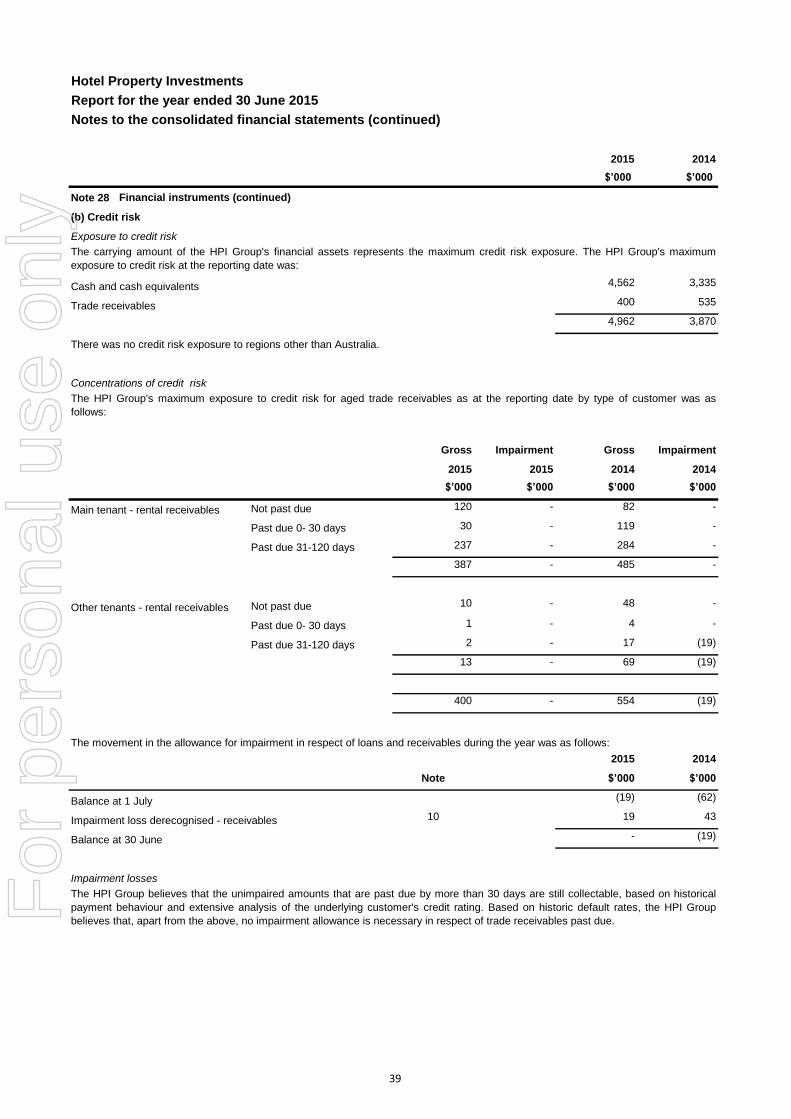
Hotel Property Investments
Report for the year ended 30 June 2015
Notes to the consolidated financial statements (continued)
2015 2014
$’000 $’000
Note 28
(b) Credit risk
Exposure to credit risk
Cash and cash equivalents 4,562 3,335
Trade receivables 400 535
4,962 3,870
There was no credit risk exposure to regions other than Australia.
Concentrations of credit risk
Gross Impairment Gross Impairment
2015 2015 2014 2014
$’000 $’000 $’000 $’000
Not past due 120 - 82 -
Past due 0- 30 days 30 - 119 -
Past due 31-120 days 237 - 284 -
387 - 485 -
Not past due 10 - 48 -
Past due 0- 30 days 1 - 4 -
Past due 31-120 days 2 - 17 (19)
13 - 69 (19)
400 - 554 (19)
2015 2014
Note $’000 $’000
Balance at 1 July (19) (62)
Impairment loss derecognised - receivables 10 19 43
Balance at 30 June - (19)
Impairment losses
Other tenants - rental receivables
The HPI Group believes that the unimpaired amounts that are past due by more than 30 days are still collectable, based on historical
payment behaviour and extensive analysis of the underlying customer's credit rating. Based on historic default rates, the HPI Group
believes that, apart from the above, no impairment allowance is necessary in respect of trade receivables past due.
Financial instruments (continued)
Main tenant - rental receivables
The carrying amount of the HPI Group's financial assets represents the maximum credit risk exposure. The HPI Group's maximum
exposure to credit risk at the reporting date was:
The HPI Group's maximum exposure to credit risk for aged trade receivables as at the reporting date by type of customer was as
follows:
The movement in the allowance for impairment in respect of loans and receivables during the year was as follows:
39
For
per
sona
l use
onl
y
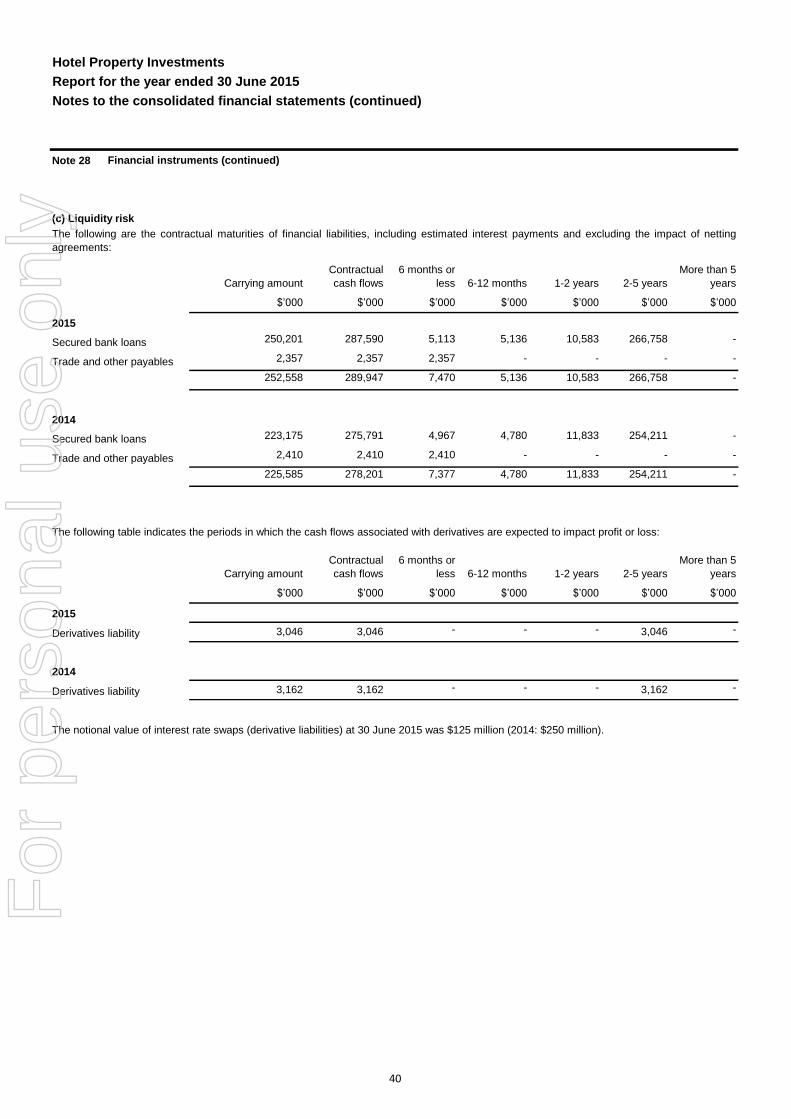
Hotel Property Investments
Report for the year ended 30 June 2015
Notes to the consolidated financial statements (continued)
Note 28
(c) Liquidity risk
Carrying amount
Contractual
cash flows
6 months or
less 6-12 months 1-2 years 2-5 years
More than 5
years
$’000 $’000 $’000 $’000 $’000 $’000 $’000
250,201 287,590 5,113 5,136 10,583 266,758 -
2,357 2,357 2,357 - - - -
252,558 289,947 7,470 5,136 10,583 266,758 -
223,175 275,791 4,967 4,780 11,833 254,211 -
2,410 2,410 2,410 - - - -
225,585 278,201 7,377 4,780 11,833 254,211 -
Carrying amount
Contractual
cash flows
6 months or
less 6-12 months 1-2 years 2-5 years
More than 5
years
$’000 $’000 $’000 $’000 $’000 $’000 $’000
Derivatives liability 3,046 3,046 - - - 3,046 -
Derivatives liability 3,162 3,162 - - - 3,162 -
The notional value of interest rate swaps (derivative liabilities) at 30 June 2015 was $125 million (2014: $250 million).
The following table indicates the periods in which the cash flows associated with derivatives are expected to impact profit or loss:
2014
2015
Trade and other payables
Financial instruments (continued)
2014
Secured bank loans
The following are the contractual maturities of financial liabilities, including estimated interest payments and excluding the impact of netting
agreements:
2015
Secured bank loans
Trade and other payables
40
For
per
sona
l use
onl
y

Hotel Property Investments
Report for the year ended 30 June 2015
Notes to the consolidated financial statements (continued)
Note 28
(d) Market risk
Interest rate risk
2015 2014
$’000 $’000
Variable rate instruments
Financial assets 4,562 3,335
Financial liabilities (253,247) (226,337)
(248,685) (223,002)
Cash flow sensitivity analysis for variable rate instruments
Carrying
amount
+ 100 bps of
AUD IR
- 100 bps of
AUD IR
Equity Equity
$’000 $’000 $’000
2015
Cash at bank 4,562 46 (46)
Bank loans (250,201) (2,502) 2,502
Interest rate derivatives (3,046) 1,077 (7,278)
(248,685) (1,379) (4,822)
2014
Cash at bank 3,335 33 (33)
Bank loans (223,175) (2,232) 2,232
Interest rate derivatives (3,162) 1,325 (7,607)
(223,002) (874) (5,408)
(e) Fair values
Financial instruments (continued)
Interest rate profile of the HPI Group's interest-bearing financial instruments:
A change of 100 basis points in interest rates at the reporting date would have increased / (decreased) equity and profit or loss by the
amounts shown below. This analysis assumes that all other variables remain constant.
+ 100 bps of AUD IR - 100 bps of AUD IR
Profit/(Loss) Profit/(Loss)
$’000 $’000
The fair values of financial assets and liabilities are the same as their carrying values.
(1,379) (4,822)
46 (46)
(2,502) 2,502
1,077 (7,278)
Interest rate derivative financial instruments carried at fair value (note 16). Under the "Fair value hierarchy", the valuation method relevant to
interest derivatives is Level 2, defined as: "inputs, other than quoted prices in active markets for identical assets and liabilities, that are
observable for the asset or liability, either directly (i.e. as prices) or indirectly (i.e. derived from prices)".
(874) (5,408)
33 (33)
(2,232) 2,232
1,325 (7,607)
41
For
per
sona
l use
onl
y

Hotel Property Investments
Report for the year ended 30 June 2015
Notes to the consolidated financial statements (continued)
2015 2014
$’000 $’000
Note 29
Reconciliation of cash flows from operating activities with profit attributable to the stapled security holders
35,435 59,300
(18,009) (53,075)
61 544
3,046 2,709
3,910 -
222 7,587
37 (34)
106 (4,516)
58 575
(53) 9,364
(220) 152
24,593 22,606
Note 30
Note 31
Note 32
Note 33 Segment information
Note 34
(Gain) / loss on sale of investment property
Tax benefit
Change in operating assets and liabilities
Statement of cash flows - additional information
Profit for the period
Amortisation of borrowing costs
Fair value adjustment of derivative financial instruments
Fair value adjustment to investment property
Fair value loss on cancelled derivatives
The HPI Group is not aware of any contingent liabilities at 30 June 2015 which may materially affect the operation of the business (2014:
none).
Contingent liabilities
The HPI Group is not aware of any contingent assets at 30 June 2015 which may materially affect the operation of the business (2014:
none).
Contingent assets
Revenues from Coles Group represented approximately $38.0 million (2014: $35.0 million) of the HPI Group's total revenues.
No item, transaction or event has occurred subsequent to 30 June 2015 that is likely in the opinion of the directors of the Responsible Entity
to significantly affect the operations of the HPI Group, the results of those operations, or the state of affairs of the HPI Group in future
financial years.
Subsequent events
Commitments
The HPI Group has a memorandum of understanding with its major tenant the Coles Group, to perform various capital maintenance works.
Additionally the HPI Group has agreed to capital development of certain Coles Group properties.
The HPI Group operates wholly within Australia and derives rental income, as a freehold pub owner and lessor.
(Increase)/decrease in trade and other receivables
(Increase)/decrease in prepayments
Increase/(decrease) in trade and other payables
Increase/(decrease) in provisions
Net cash from operating activities
42
For
per
sona
l use
onl
y
Hotel Property Investments
Report for the year ended 30 June 2015
Directors’ declaration
1.
2.
Sydney
In the opinion of the directors of The Trust Company (RE Services) Limited, as Responsible Entity for the Hotel Property Investment Trust:
the consolidated financial statements and notes, set out on pages 15 to 42, are in accordance with the Corporations Act 2001 ,
including:
There are reasonable grounds to believe that the Hotel Property Investment Trust will be able to pay its debts as and when they
become due and payable.
Dated this 26th day of August 2015
Signed in accordance with a resolution of the directors of The Trust Company (RE Services) Limited.
Andrew Cannane
Director
(a) giving a true and fair view of the Hotel Property Investments Group financial position as at 30 June 2015 and of its
performance for the twelve months ended on that date; and
(b) complying with Australian Accounting Standards and the Corporations Regulations 2001.
The directors draw attention to note 2(a) to the consolidated financial statements, which includes the statement of compliance with
International Financial Reporting Standards.
The directors have been given the declarations required by section 295A of the Corporations Act 2001 from the individuals employed by
the Services Manager effectively performing roles similar to that of a Chief Executive Officer and Chief Financial Officer for the financial
year ended 30 June 2015.
43
For
per
sona
l use
onl
y
ABCD
Independent auditor’s report to the stapled security holders of Hotel Property Investments Trust and Hotel Property Investments Limited
Report on the financial report
We have audited the accompanying financial report of Hotel Property Investments Trust (the Trust), which comprises the consolidated statement of financial position as at 30 June 2015, and consolidated statement of profit or loss and consolidated statement of comprehensive income, consolidated statement of changes in equity and consolidated statement of cash flows for the year ended on that date, notes 1 to 34 comprising a summary of significant accounting policies and other explanatory information and the directors’ declaration of the Group comprising the Trust, Hotel Property Investments Limited (the Company) and the entities they controlled at the year’s end or from time to time during the financial year.
Directors’ responsibility for the financial report
The directors of The Trust Company (RE Services) Limited, being the Responsible Entity of the Trust, are responsible for the preparation of the financial report that gives a true and fair view in accordance with Australian Accounting Standards and the Corporations Act 2001 and for such internal control as the directors determine is necessary to enable the preparation of the financial report that is free from material misstatement whether due to fraud or error. In note 2(a), the directors also state, in accordance with Australian Accounting Standard AASB 101 Presentation of Financial Statements, that the financial statements of the Group comply with International Financial Reporting Standards.
Auditor’s responsibility
Our responsibility is to express an opinion on the financial report based on our audit. We conducted our audit in accordance with Australian Auditing Standards. These Auditing Standards require that we comply with relevant ethical requirements relating to audit engagements and plan and perform the audit to obtain reasonable assurance whether the financial report is free from material misstatement.
An audit involves performing procedures to obtain audit evidence about the amounts and disclosures in the financial report. The procedures selected depend on the auditor’s judgement, including the assessment of the risks of material misstatement of the financial report, whether due to fraud or error. In making those risk assessments, the auditor considers internal control relevant to the entity’s preparation of the financial report that gives a true and fair view in order to design audit procedures that are appropriate in the circumstances, but not for the purpose of expressing an opinion on the effectiveness of the entity’s internal control. An audit also includes evaluating the appropriateness of accounting policies used and the reasonableness of accounting estimates made by the directors, as well as evaluating the overall presentation of the financial report.
We performed the procedures to assess whether in all material respects the financial report presents fairly, in accordance with the Corporations Act 2001 and Australian Accounting Standards, a true and fair view which is consistent with our understanding of the Group’s financial position and of its performance.
We believe that the audit evidence we have obtained is sufficient and appropriate to provide a basis for our audit opinion.
44
KPMG, an Australian partnership and a member firm of the KPMG network of independent member firms affiliated with KPMG International Cooperative (“KPMG International”), a Swiss entity.
Liability limited by a scheme approved under Professional Standards Legislation.
For
per
sona
l use
onl
y
ABCD
Independence
In conducting our audit, we have complied with the independence requirements of the Corporations Act 2001.
Auditor’s opinion
In our opinion:
(a) the financial report of the Group is in accordance with the Corporations Act 2001, including:
(i) giving a true and fair view of the Group’s financial position as at 30 June 2015 and of its performance for the year ended on that date; and
(ii) complying with Australian Accounting Standards and the Corporations Regulations 2001.
(b) the financial report also complies with International Financial Reporting Standards as disclosed in note 2(a).
Report on the remuneration report
We have audited the Remuneration Report included in pages 10 to 11 of the directors’ report for the year ended 30 June 2015. The directors of the company are responsible for the preparation and presentation of the remuneration report in accordance with Section 300A of the Corporations Act 2001. Our responsibility is to express an opinion on the remuneration report, based on our audit conducted in accordance with auditing standards.
Auditor’s opinion
In our opinion, the remuneration report of Hotel Property Investments for the year ended 30 June 2015, complies with Section 300A of the Corporations Act 2001
KPMG
Darren Scammell Partner
Melbourne
26 August 2015
45
For
per
sona
l use
onl
y
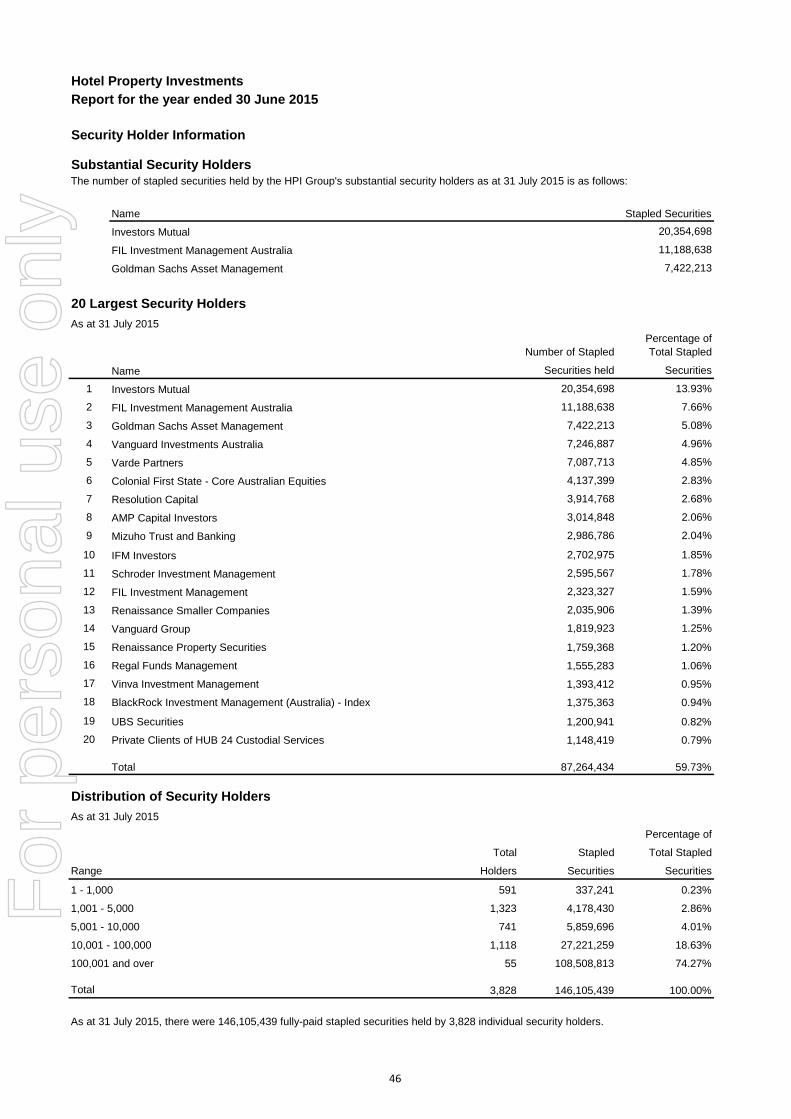
Hotel Property Investments
Report for the year ended 30 June 2015
Stapled Securities
Investors Mutual 20,354,698
FIL Investment Management Australia 11,188,638
Goldman Sachs Asset Management 7,422,213
Number of Stapled
Percentage of
Total Stapled
Securities held Securities
1 Investors Mutual 20,354,698 13.93%
2 FIL Investment Management Australia 11,188,638 7.66%
3 Goldman Sachs Asset Management 7,422,213 5.08%
4 Vanguard Investments Australia 7,246,887 4.96%
5 Varde Partners 7,087,713 4.85%
6 Colonial First State - Core Australian Equities 4,137,399 2.83%
7 Resolution Capital 3,914,768 2.68%
8 AMP Capital Investors 3,014,848 2.06%
9 Mizuho Trust and Banking 2,986,786 2.04%
10 IFM Investors 2,702,975 1.85%
11 Schroder Investment Management 2,595,567 1.78%
12 FIL Investment Management 2,323,327 1.59%
13 Renaissance Smaller Companies 2,035,906 1.39%
14 Vanguard Group 1,819,923 1.25%
15 Renaissance Property Securities 1,759,368 1.20%
16 Regal Funds Management 1,555,283 1.06%
17 Vinva Investment Management 1,393,412 0.95%
18 BlackRock Investment Management (Australia) - Index 1,375,363 0.94%
19 UBS Securities 1,200,941 0.82%
20 Private Clients of HUB 24 Custodial Services 1,148,419 0.79%
87,264,434 59.73%
Percentage of
Total Stapled Total Stapled
Range Holders Securities Securities
591 337,241 0.23%
1,323 4,178,430 2.86%
741 5,859,696 4.01%
1,118 27,221,259 18.63%
55 108,508,813 74.27%
Total 3,828 146,105,439 100.00%
Security Holder Information
Substantial Security HoldersThe number of stapled securities held by the HPI Group's substantial security holders as at 31 July 2015 is as follows:
Name
20 Largest Security Holders
As at 31 July 2015
Name
5,001 - 10,000
10,001 - 100,000
100,001 and over
As at 31 July 2015, there were 146,105,439 fully-paid stapled securities held by 3,828 individual security holders.
Total
Distribution of Security Holders
As at 31 July 2015
1 - 1,000
1,001 - 5,000
46
For
per
sona
l use
onl
y
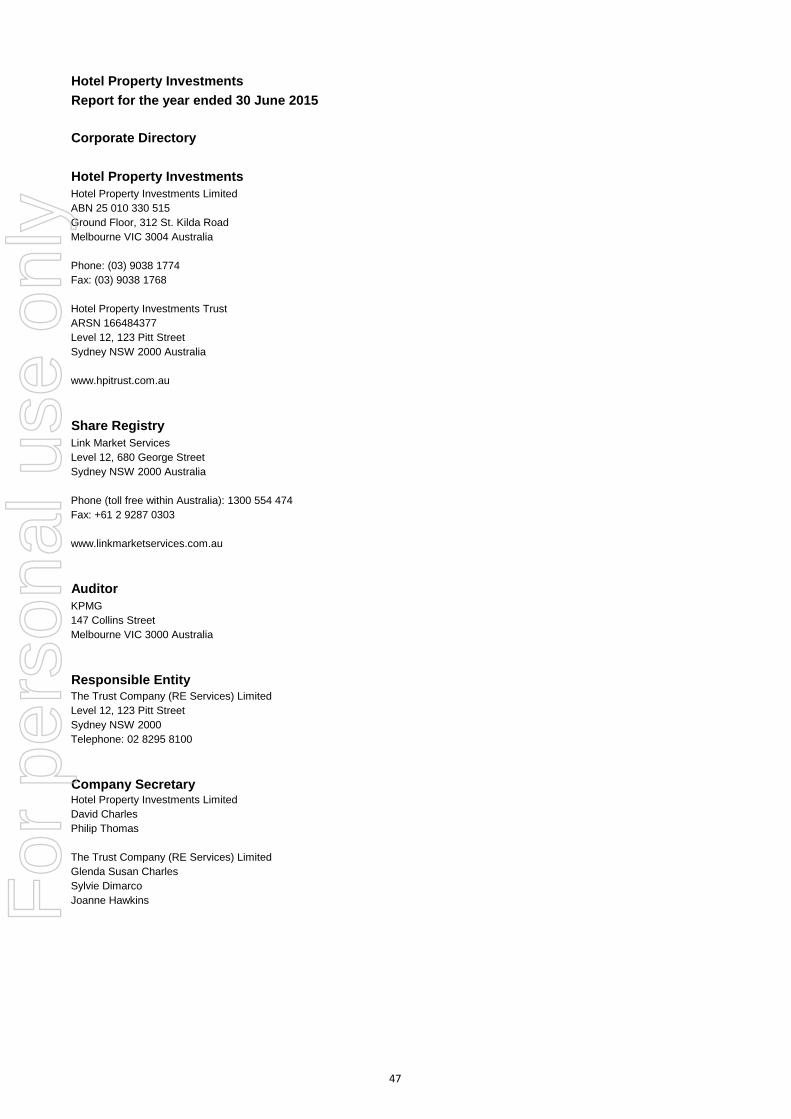
Hotel Property Investments
Report for the year ended 30 June 2015
Joanne Hawkins
Corporate Directory
Hotel Property Investments Limited
ABN 25 010 330 515
Hotel Property Investments Trust
ARSN 166484377
Ground Floor, 312 St. Kilda Road
Melbourne VIC 3004 Australia
Hotel Property Investments
Fax: (03) 9038 1768
KPMG
147 Collins Street
Link Market Services
Sydney NSW 2000 Australia
Share Registry
Level 12, 680 George Street
Sydney NSW 2000 Australia
www.hpitrust.com.au
Phone: (03) 9038 1774
Telephone: 02 8295 8100
Level 12, 123 Pitt Street
Responsible EntityThe Trust Company (RE Services) Limited
Level 12, 123 Pitt Street
Phone (toll free within Australia): 1300 554 474
Fax: +61 2 9287 0303
Auditor
Melbourne VIC 3000 Australia
www.linkmarketservices.com.au
Sydney NSW 2000
Company SecretaryHotel Property Investments Limited
The Trust Company (RE Services) Limited
David Charles
Philip Thomas
Glenda Susan Charles
Sylvie Dimarco
47
For
per
sona
l use
onl
y